
A Test Method to Evaluate the Adhesive Property between Asphalt and Aggregate Based on Simulating Actual Working Conditions


Abstract
:1. Introduction
2. Objective
- (1)
- To develop the testing equipment and design the testing procedure based on testing principles appropriate to actual working conditions.
- (2)
- To determine the experimental conditions of the brush damage test, including the brush type, the asphalt content, the maintenance temperature, and the maintenance time.
- (3)
- To compare the results of the brush damage test with the BBS test and analyze the effective indexes to evaluate the adhesion properties between asphalt and aggregate.
3. Materials
4. Test Method
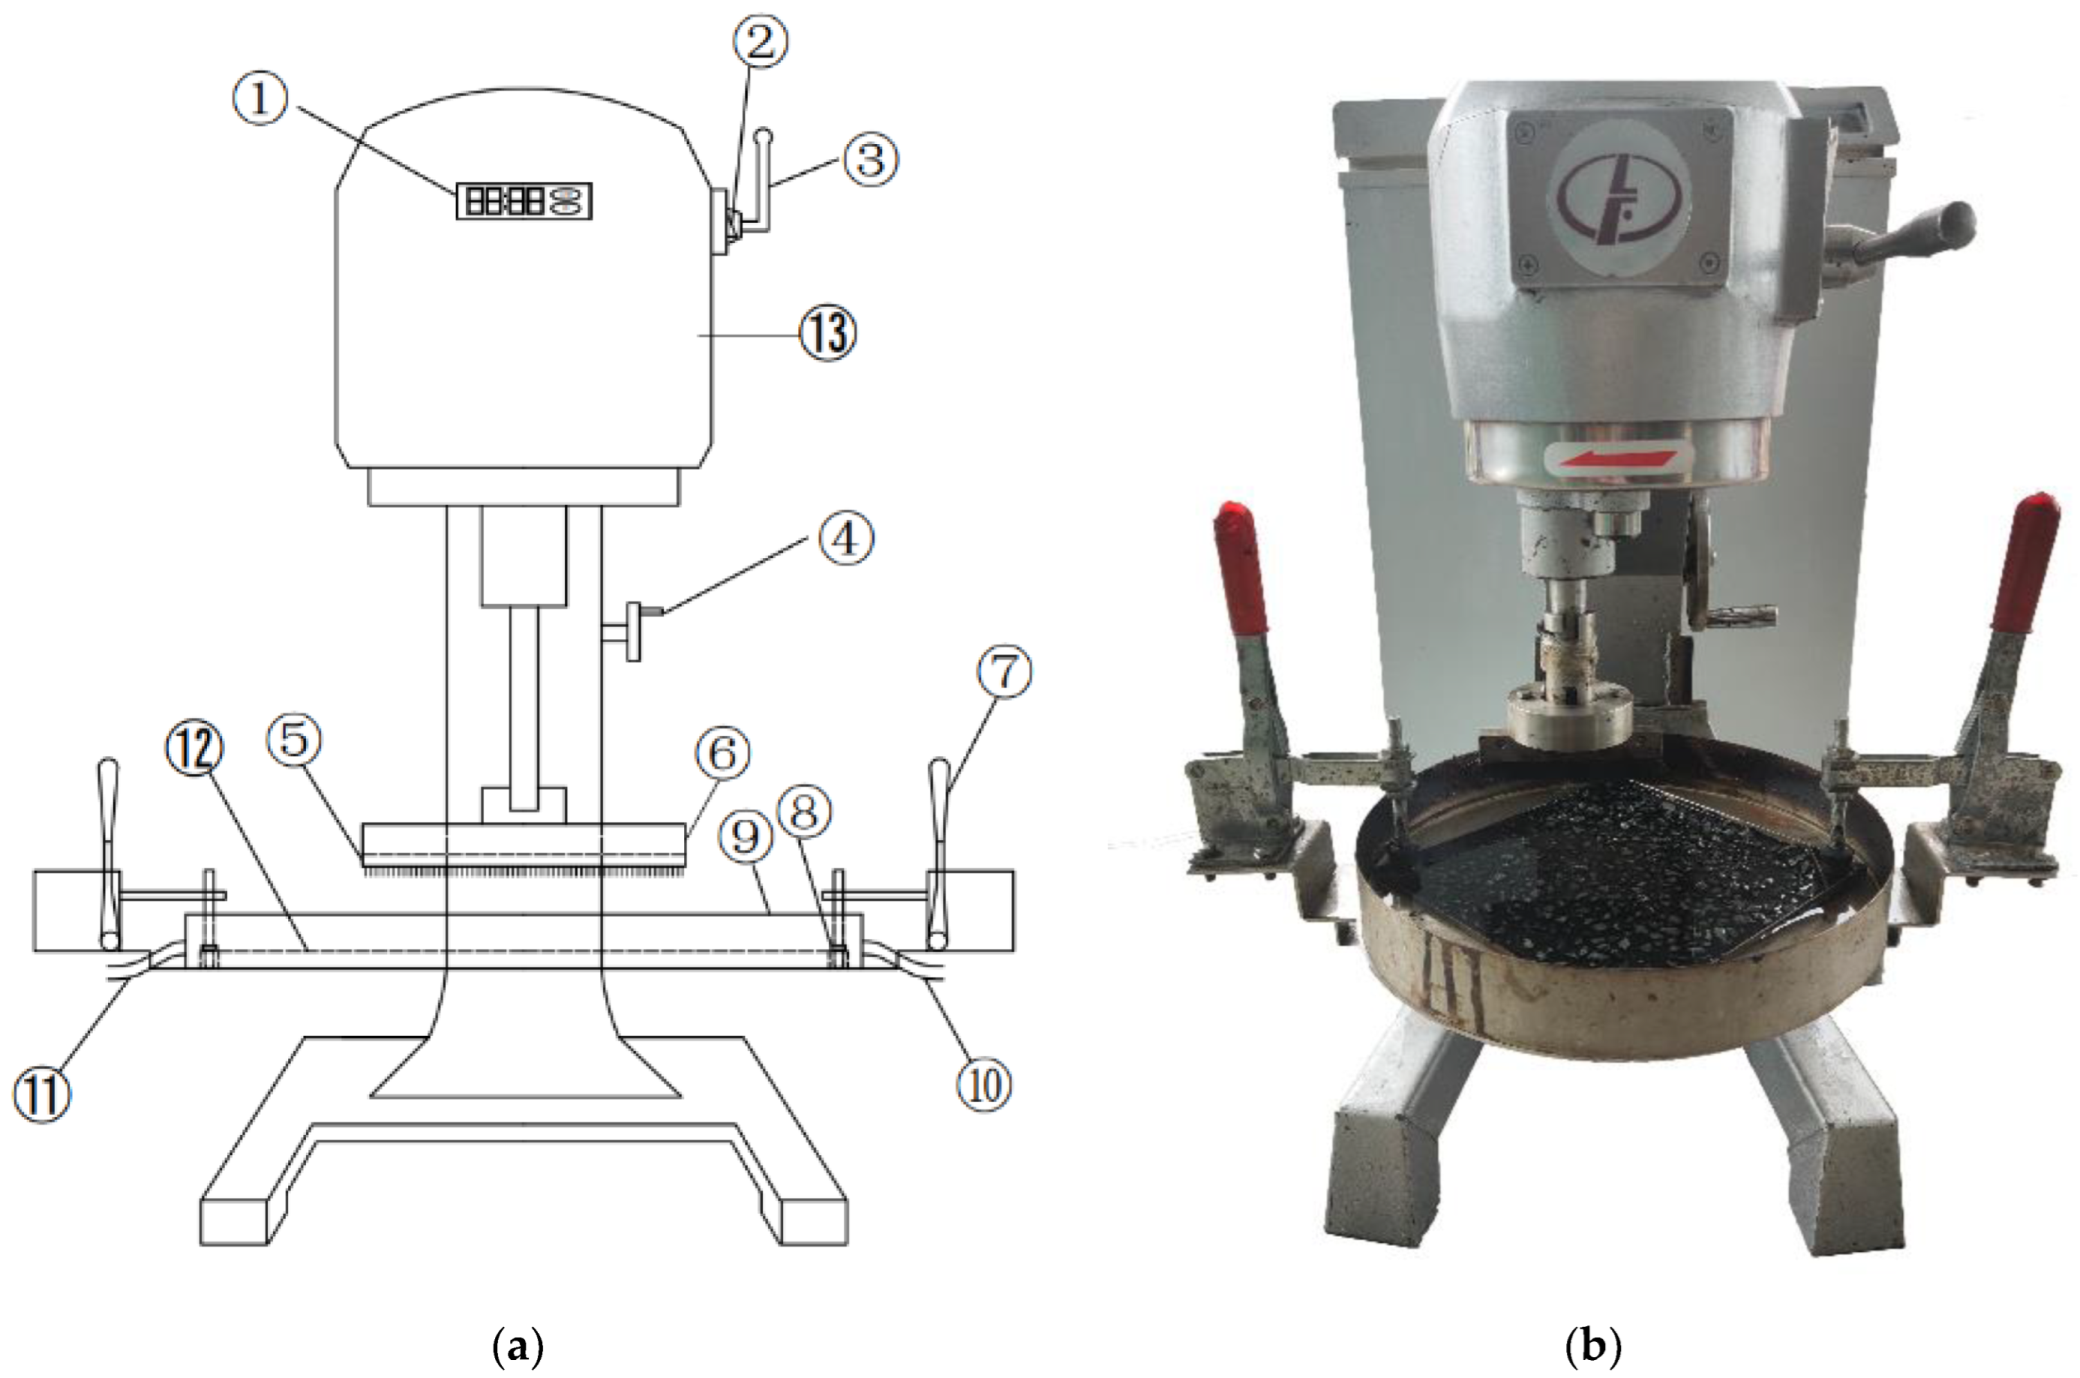
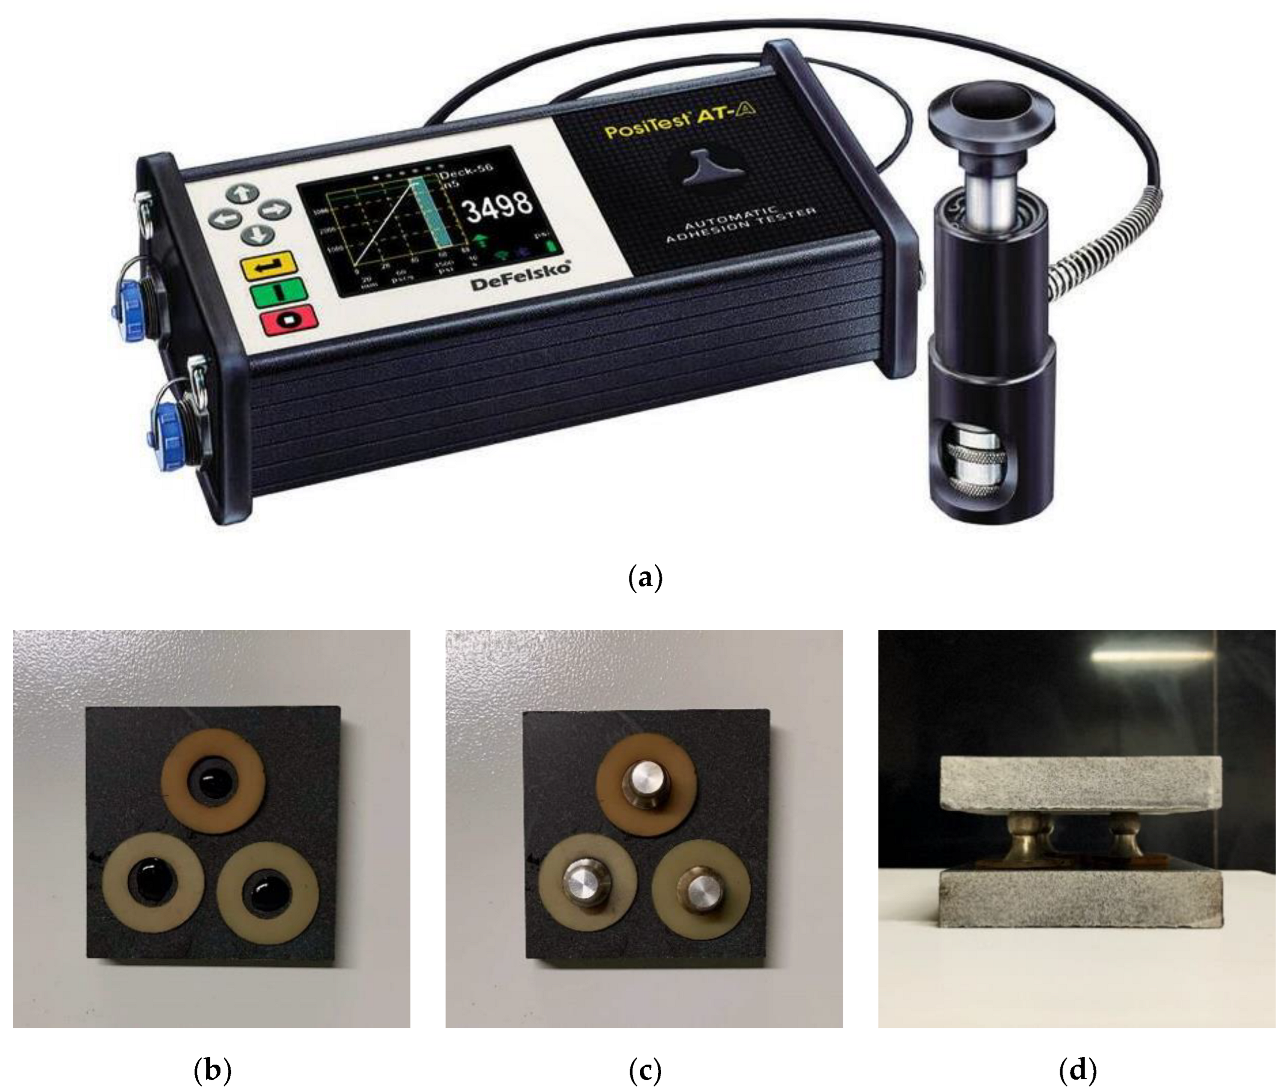
4.1. Test Equipment
4.2. Test Procedure
4.2.1. Preparation of Materials
- (1)
- AggregateAccording to section T0702-2011 in Chinese standard test methods [6], the aggregates need to be dried to a constant weight at 105 °C.Equation (1) was used to determine aggregate quantity.where is aggregate quantity (g), is apparent density of aggregate (g/cm3), is fully paved area (cm2), and is correction factor (%).The method was based on the following assumptions. The shape of the aggregate is square, and the particle size is evenly distributed in an interval of 2.36–4.75 mm. Therefore, the average height of the aggregate is taken as the average of 2.36 and 4.75. On this basis, the mass of a single full layer of aggregate is initially obtained by multiplying the density by the volume. However, as asphalt overflow will occupy a certain position and the actual shape of the aggregate is generally not uniform, the preliminary calculation result is generally on the large side. Therefore, the correction factor needs to be considered in the calculation, which can be determined based on experience or pre-experiments. In this study, the correction factor of 70% was selected through pre-experiment.The aggregates need to be heated at 160 °C for standby when using base asphalt binders, and at 180 °C when using modified asphalt binders.
- (2)
- AsphaltThe asphalt content has a significant impact on the test results, which should be determined according to the multi-level pre-test results by considering the expected adhesion force and particle size of the aggregate. During the preparation process, the asphalt should have acceptable fluidity. The heating temperature () was 160 °C when using base asphalt binders, and 180 °C when using modified asphalt binders.
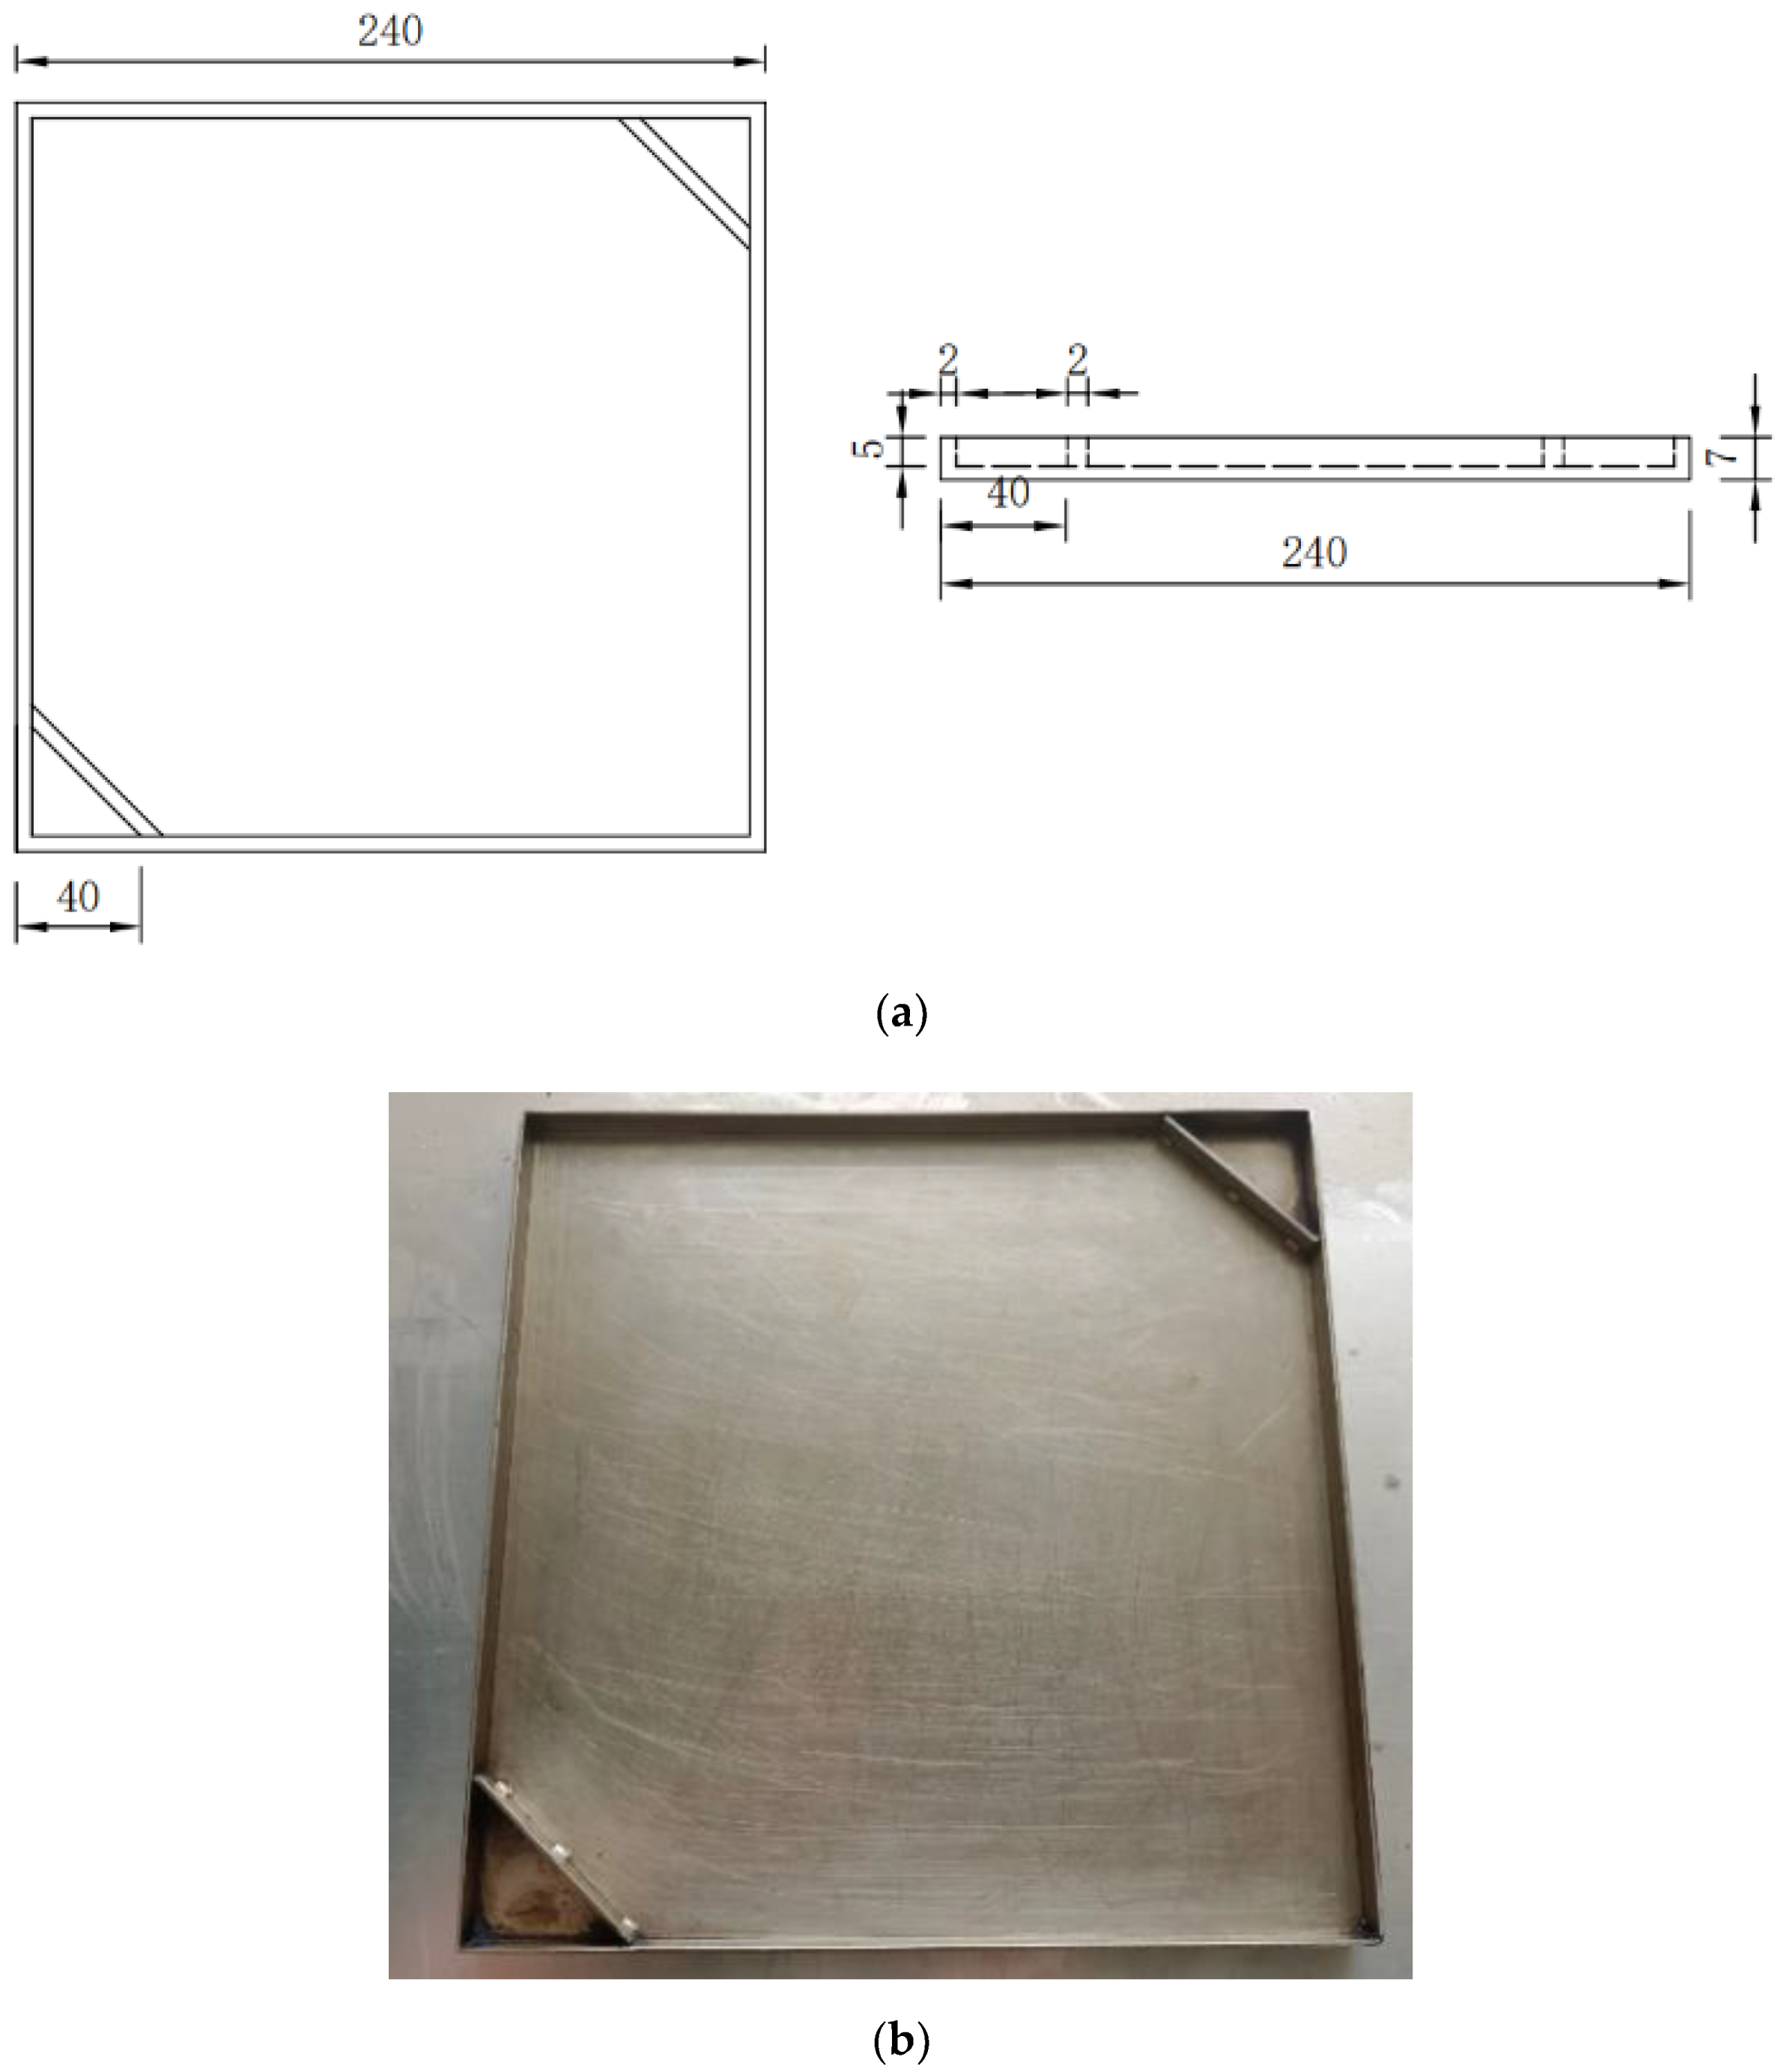
4.2.2. Preparation of Specimens
- (1)
- Weighed the mass of the test mold ( ) and preheated it with the asphalt in an oven set to for 1 h.
- (2)
- Took out the test mold and immediately poured the asphalt of target weight ( ) evenly.
- (3)
- Returned the test mold to the original oven and heated for 1 h.
- (4)
- Placed the test mold on the heating plate set to and spread the aggregate at target weight () evenly on the asphalt film.
- (5)
- Used the rolling forming machine on asphalt mixture to roll the specimen for three round-trips in the same direction.
- (6)
- Swept away all loose aggregate and cured the specimen under dry conditions at 25 °C for 4 h.
- (7)
- Weighed the total mass of the test mold and specimen ().
4.2.3. Maintenance Phase
4.2.4. Testing Phase
- (1)
- Fixed the specimen on the test platform and raised the test platform by lift lever until the brush was in full contact with the sample.
- (2)
- Used a speed of 100 r/min and the brushing time of 1 min for brush damage test. During the test, the brush rotated on the axis of the stirring shaft with its radius of rotation as the radius of the brush, and rotated with the stirring shaft with its radius of rotation of 5 cm.
- (3)
- Weighed the total mass of the test mold and specimen ( ) after sweeping away all loose aggregate.
4.2.5. Calculation of Results
5. Results and Discussion
5.1. Experimental Conditions of the Brush Damage Test
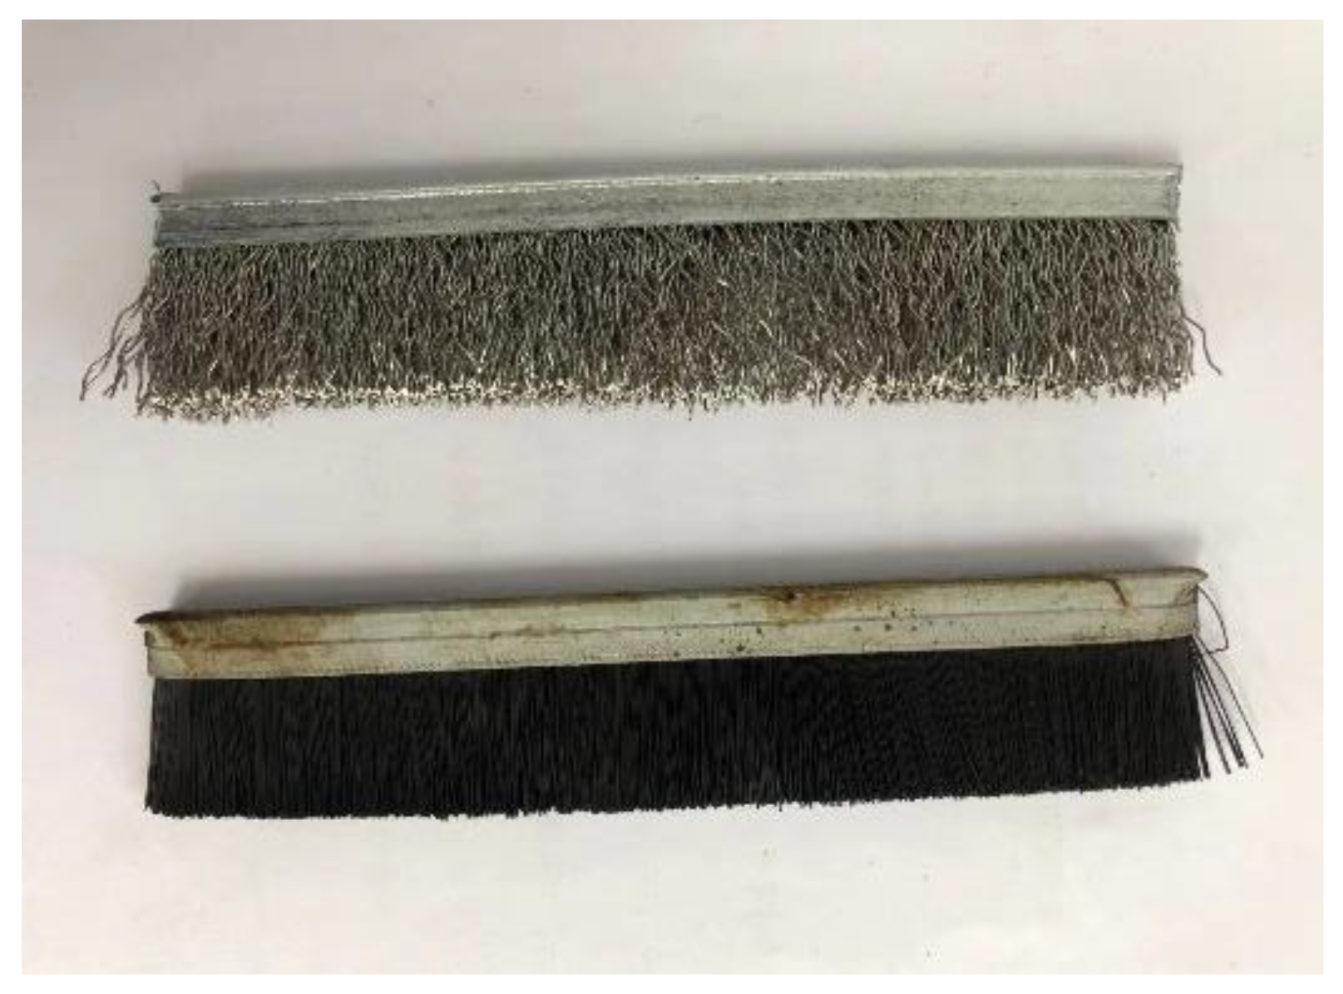
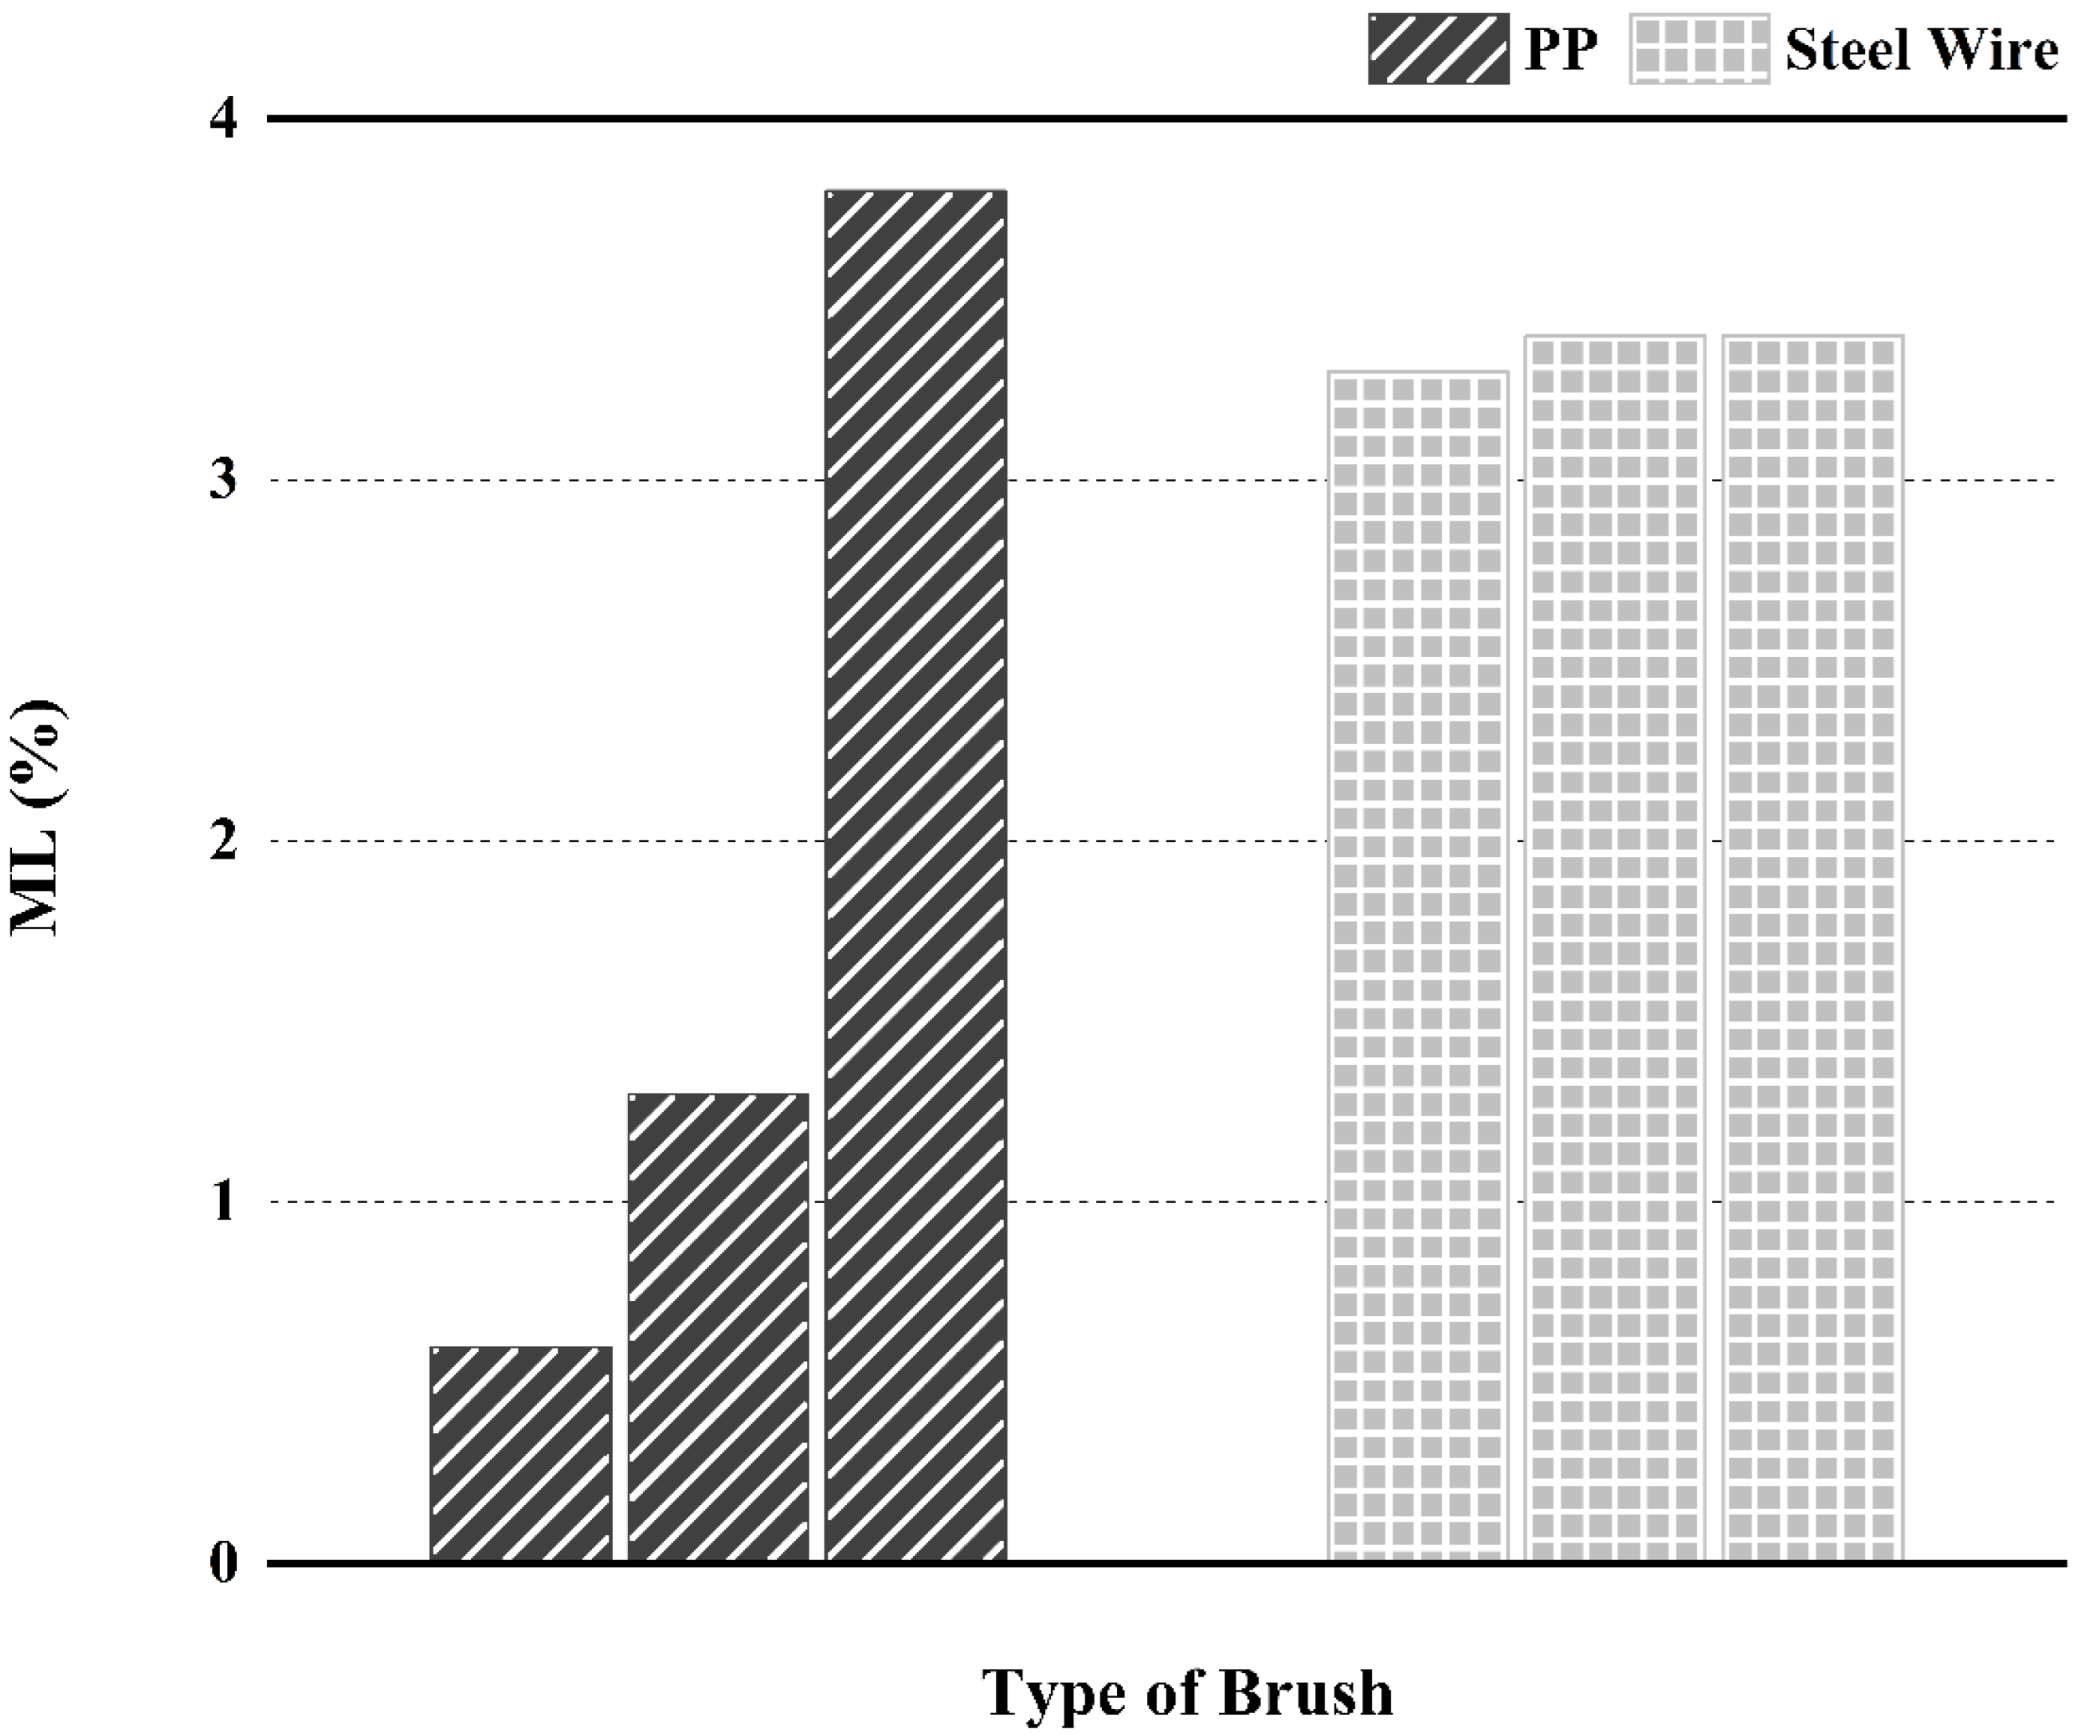
5.1.1. Type of Brush
- (1)
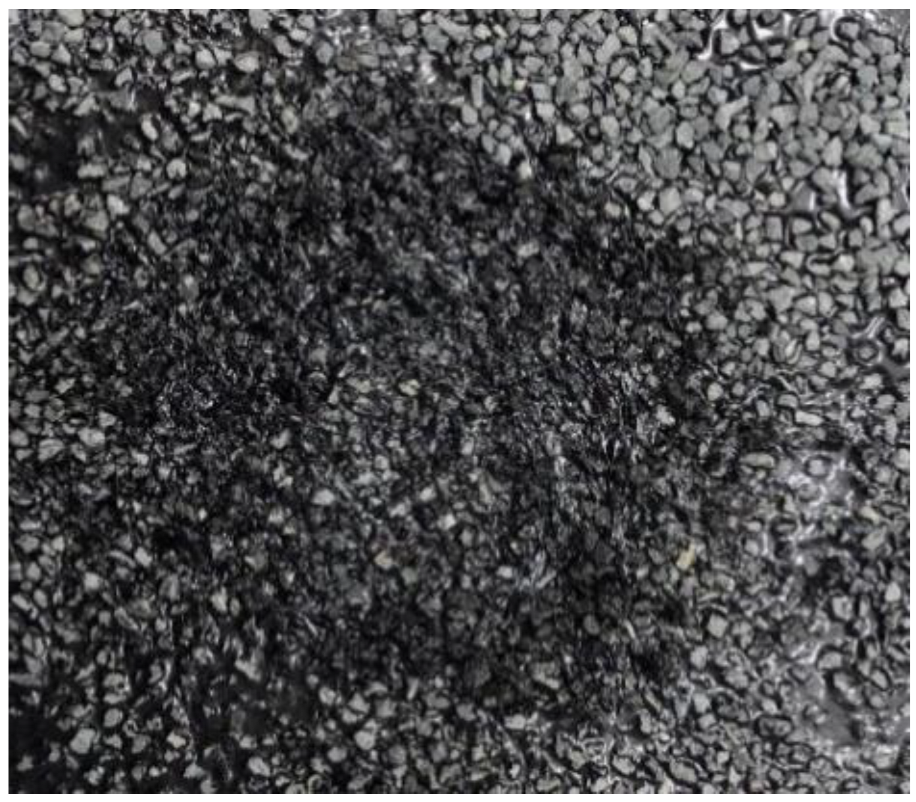
- Produced substantial damage to the specimens, that is, swept away the aggregate from the specimens.
- (2)
- The degree of damage and the test results for specimens with different properties could be differentiated.
- (3)
- The shape of the brush was stable to ensure that no obvious deformation occurred during the test that would affect the results.
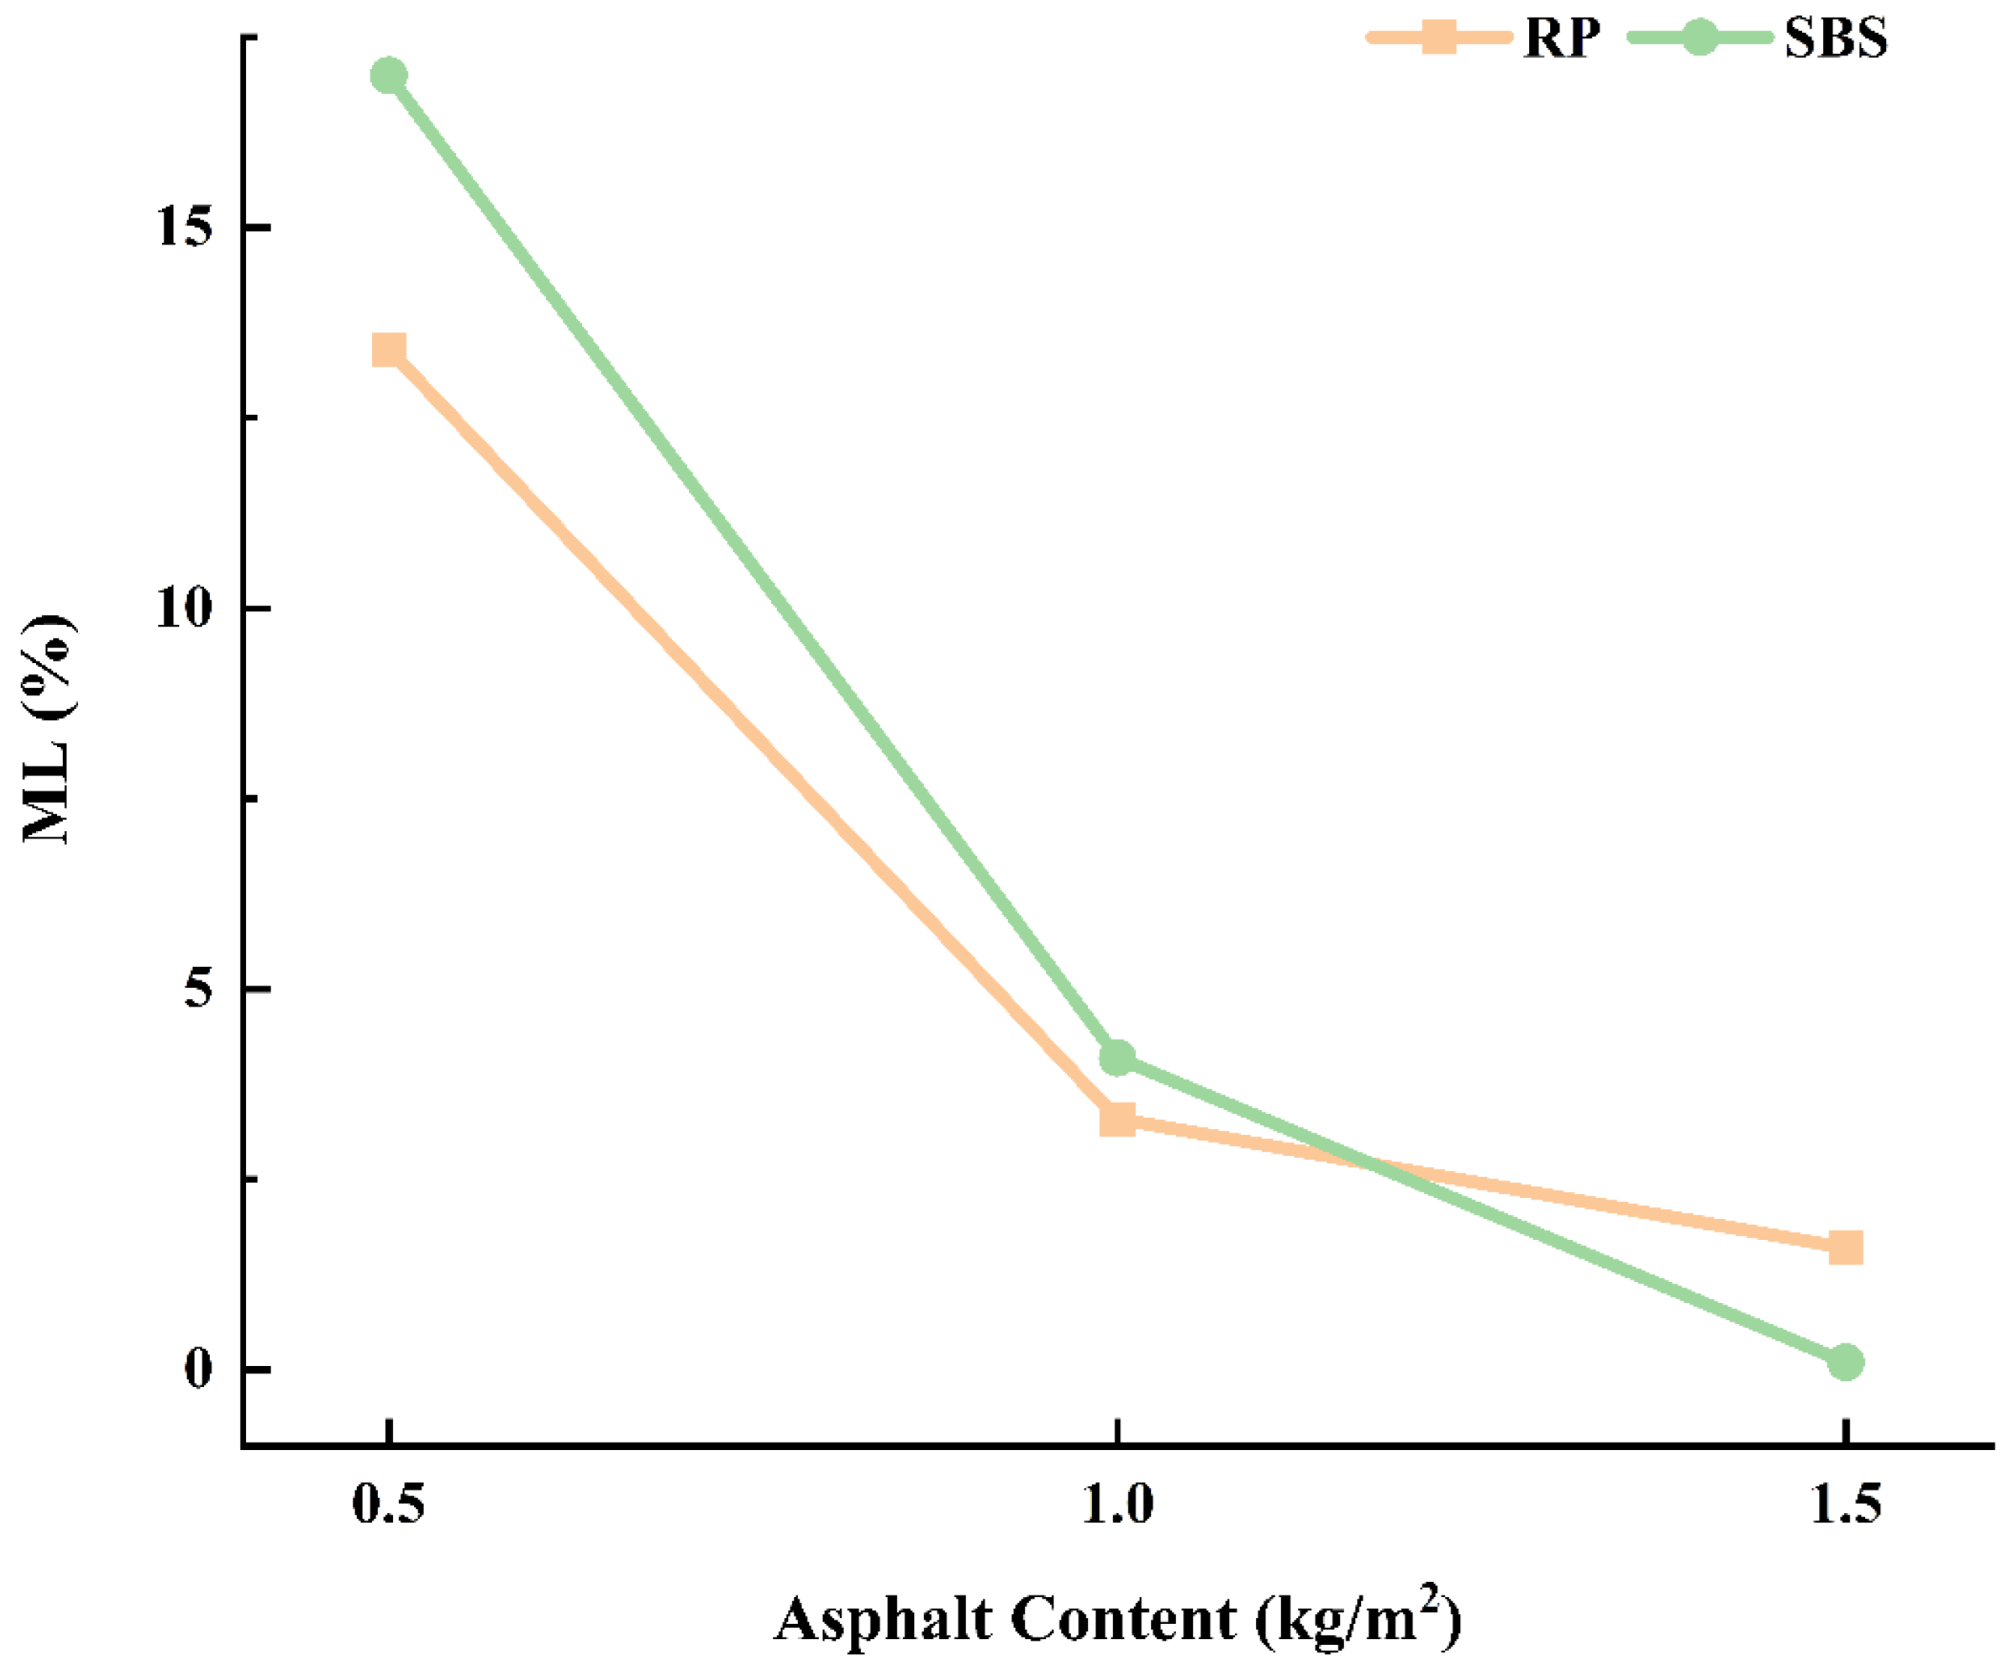
5.1.2. Asphalt Content
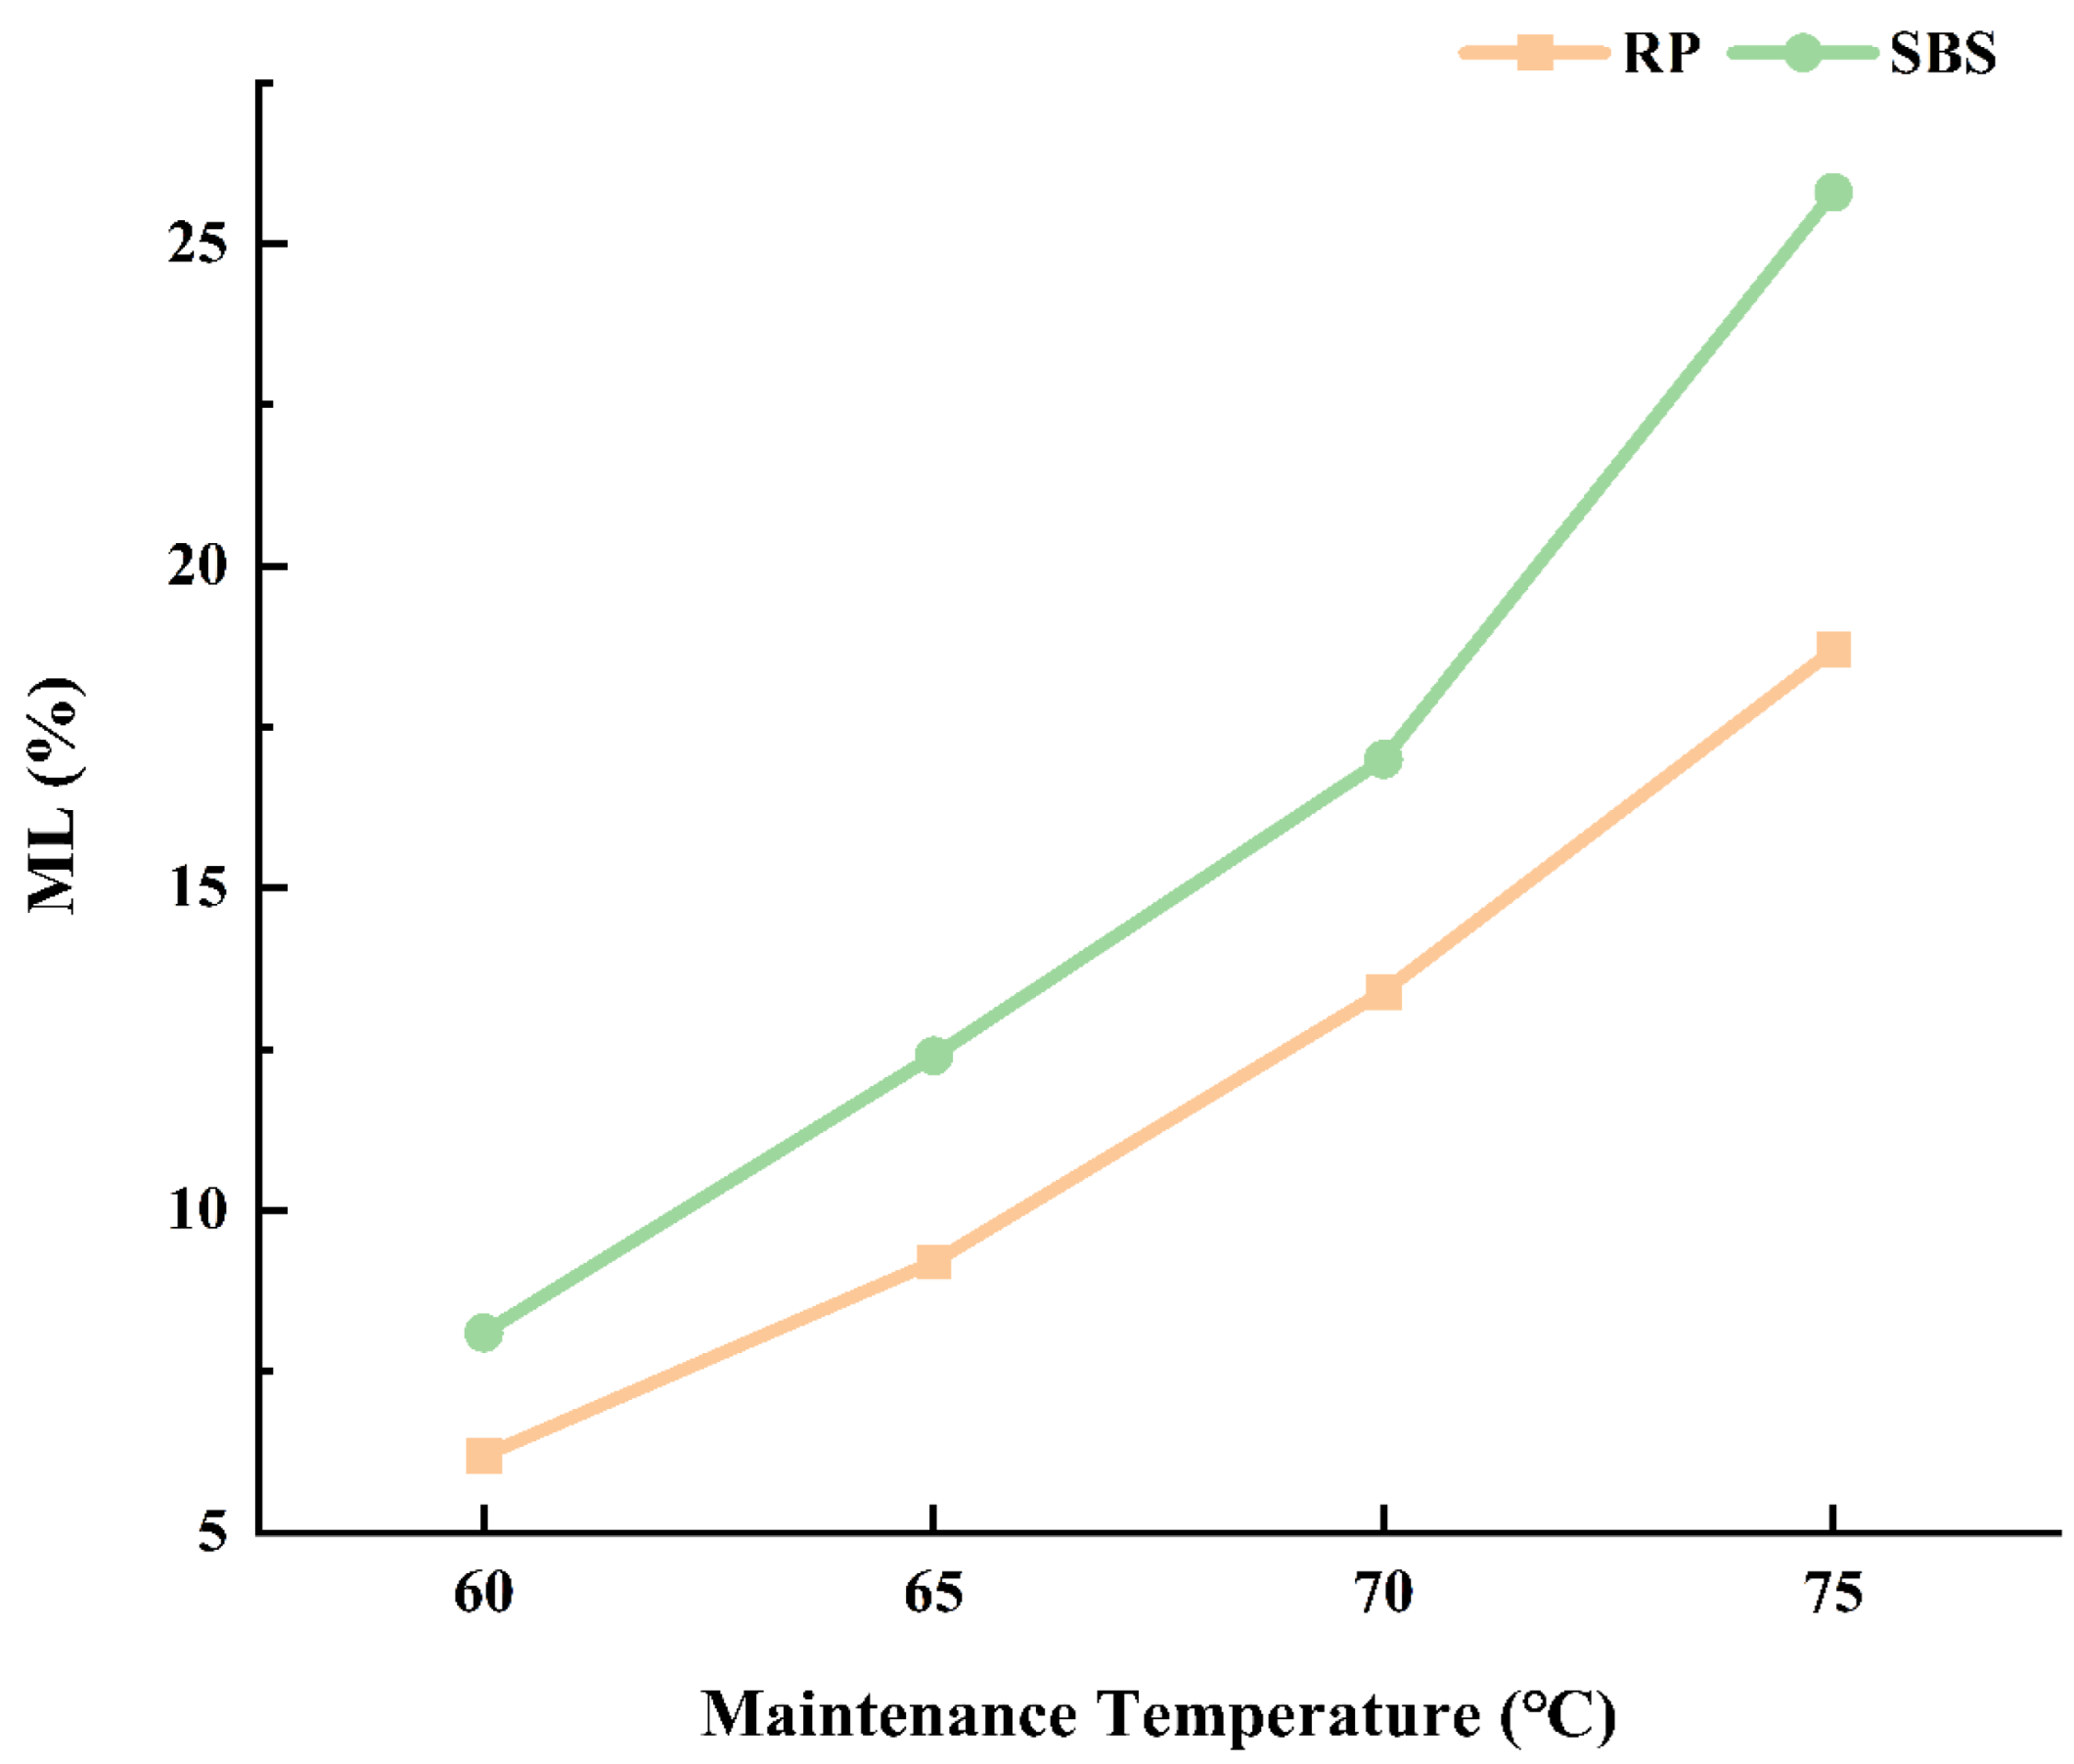
5.1.3. Maintenance Temperature
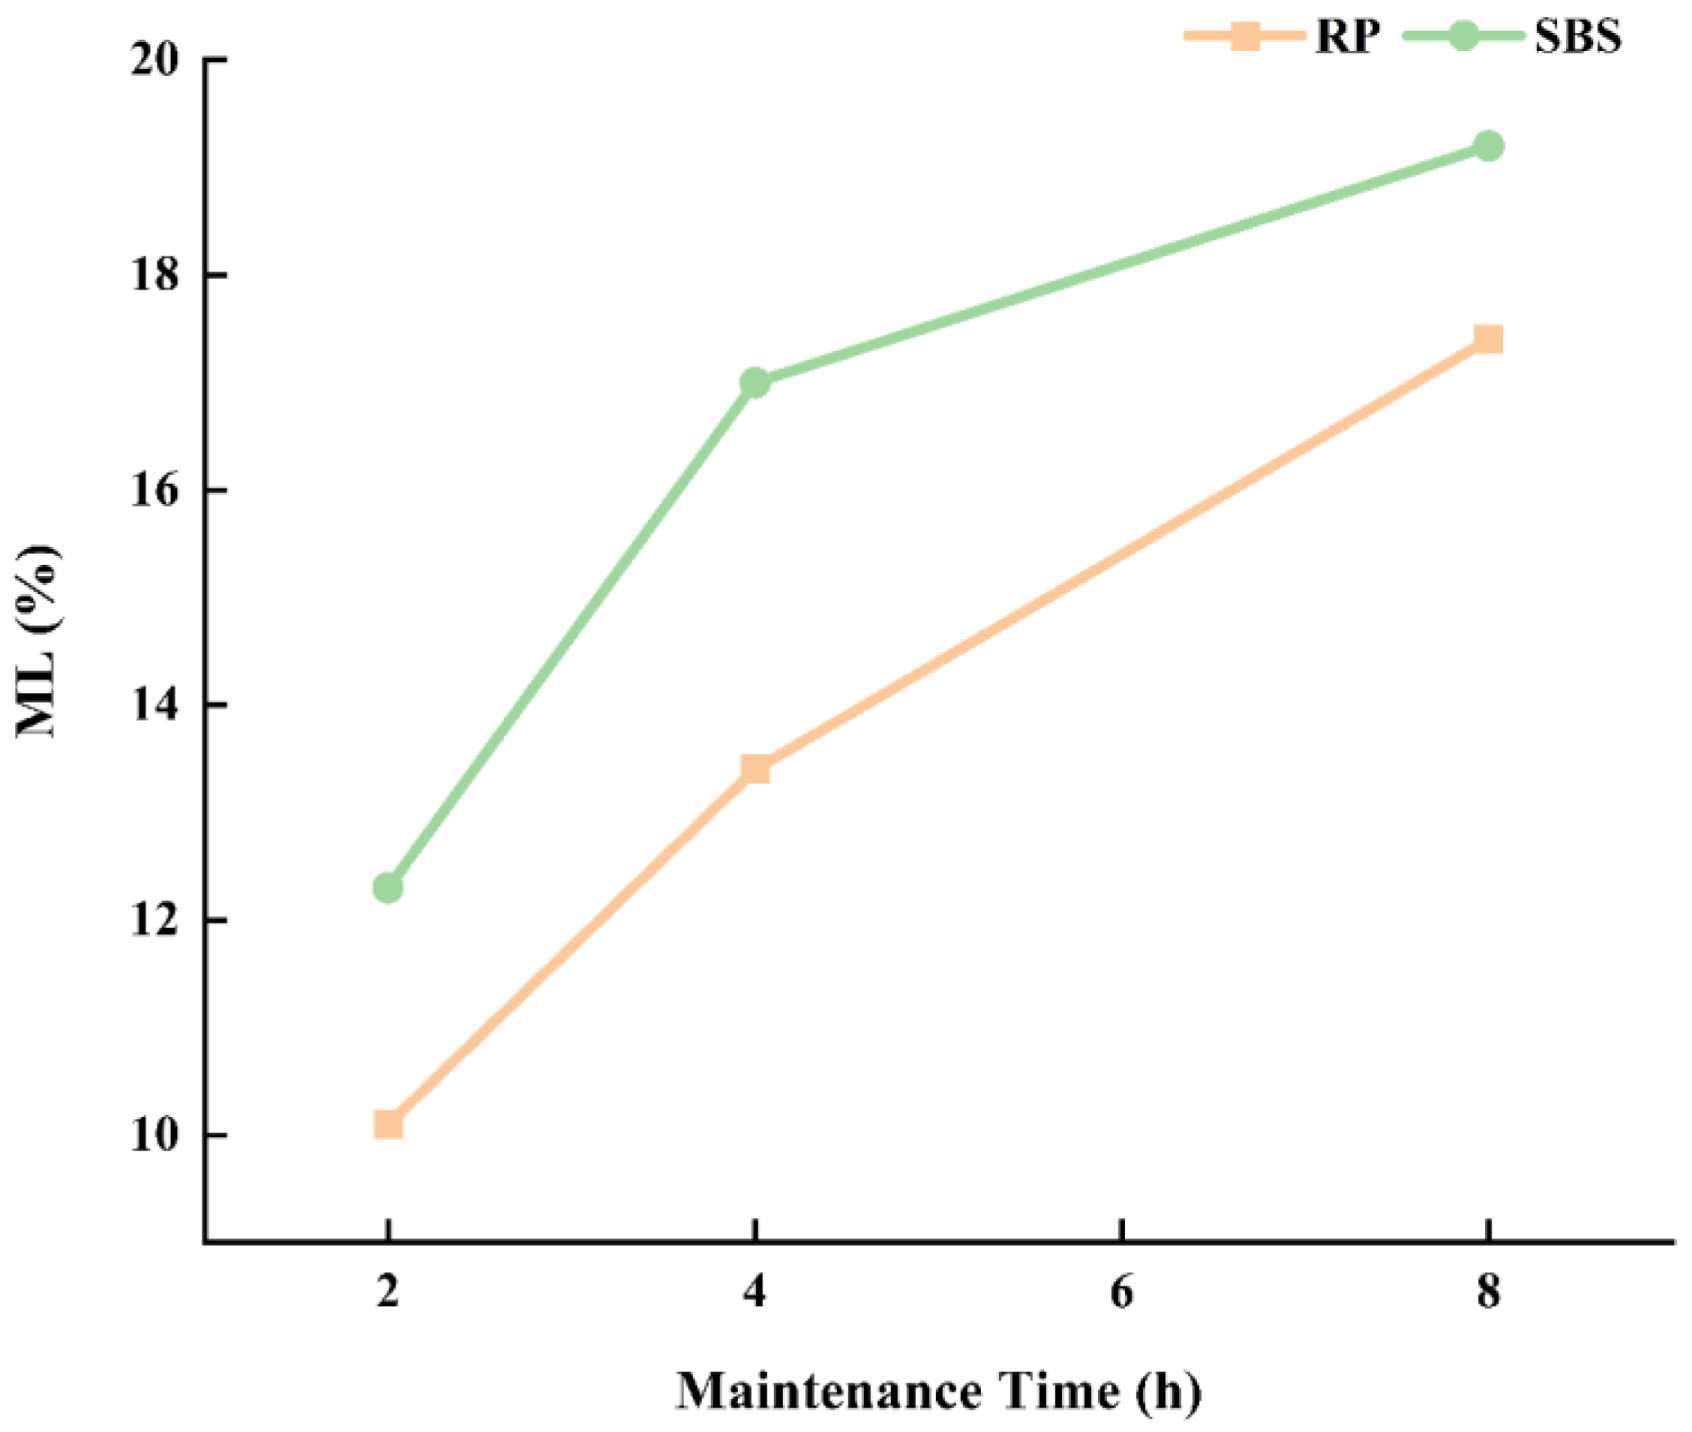
5.1.4. Maintenance Time
5.2. Analysis of the Brush Damage Test Results
5.3. Comparison between Brush Damage Test and BBS Test
- (1)
- Prepared three parallel specimens for each group.
- (2)
- Cleaned the stone substrate and the pull-out stubs and preheated them with the base asphalt binders in an oven set to 160 °C (180 °C for modified asphalt binders) for 1 h.
- (3)
- (4)
- Removed the upper stone substrate and silicone molds after maintaining at 25 °C for 1 h.
- (5)
- Under wet conditions, submerged the specimens in a water bath at 40 °C for 48 h and then maintained them at 25 °C for 1 h. Under dry conditions, hold the specimens at 25 °C for 49 h.
- (6)
- Measured the pull-off tensile strength (POTS) at the loading rate of 0.7 Mpa/s.
6. Conclusions
- (1)
- A method for evaluating the adhesion properties between asphalt and aggregate, the brush damage test, was proposed, and the mass loss rate (ML) of specimens through brushing was used as the evaluation index. In this study, the test equipment was independently developed. To simulate the actual working conditions with adhesion failures between asphalt and aggregate, the actual asphalt binders and aggregates used in the construction of asphalt pavement were selected, and the dry and wet conditions were set.
- (2)
- For experimental conditions, the type of brush, the asphalt content, the maintenance temperature, and the maintenance time were determined. A steel-wire brush was recommended based on its stable shape and significant test results. As the asphalt content increased, the thickness of the asphalt film increased, and the test results were unable to reflect the actual moisture damage. Therefore, a total of 0.5 kg/m2 of asphalt content was recommended. As the maintenance temperature and the maintenance time increased, the ML values increased. Considering the actual surface temperatures of asphalt pavements, sufficient bonding between asphalt and aggregate, and reducing the test time, 70 °C and 4 h of maintenance temperature and time, respectively, were recommended.
- (3)
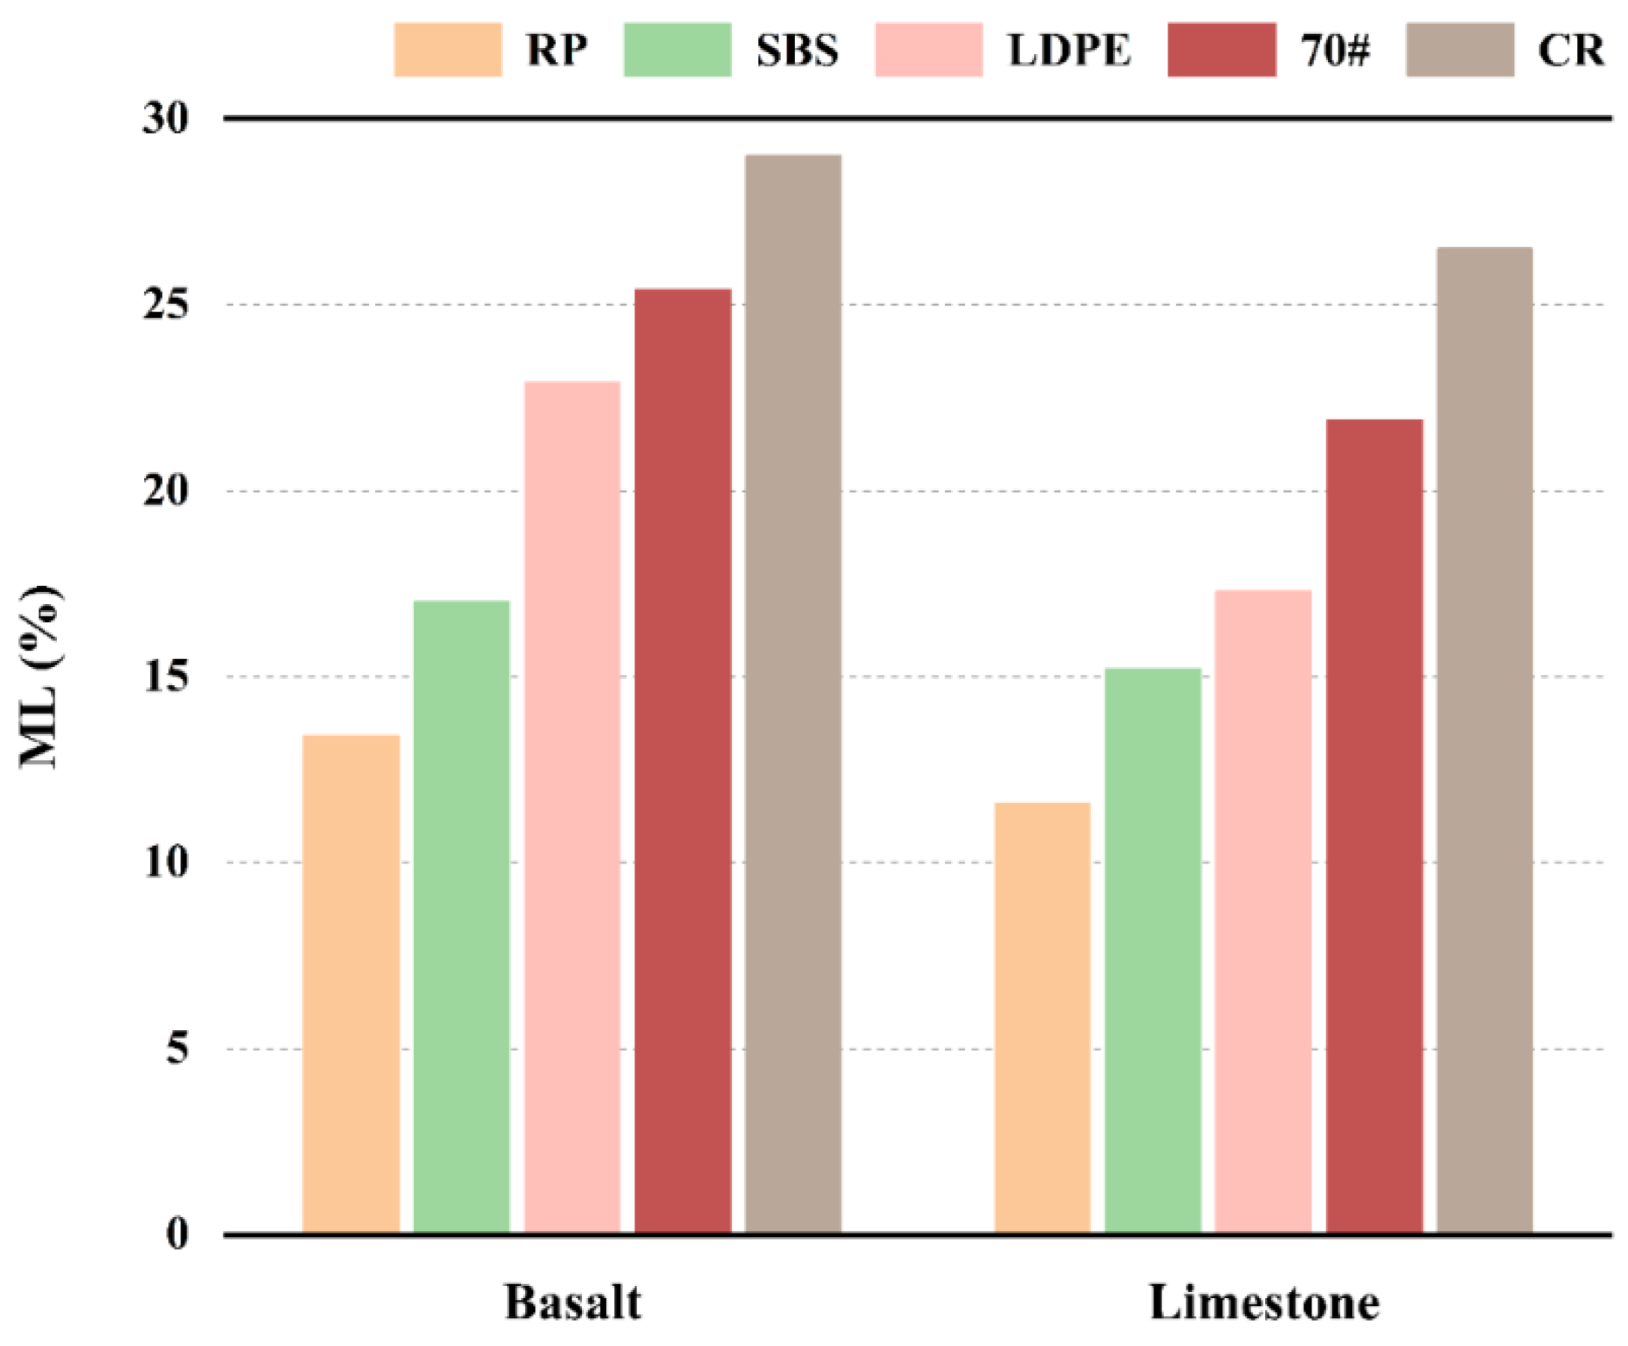
- The brush damage test was performed on one base asphalt binder and four modified asphalt binders. Taking the mass loss rate (ML) of specimens as the evaluation index, the adhesion properties between asphalt and aggregate were ranked as follows: RP, SBS, LDPE, 70#, and CR.
- (4)
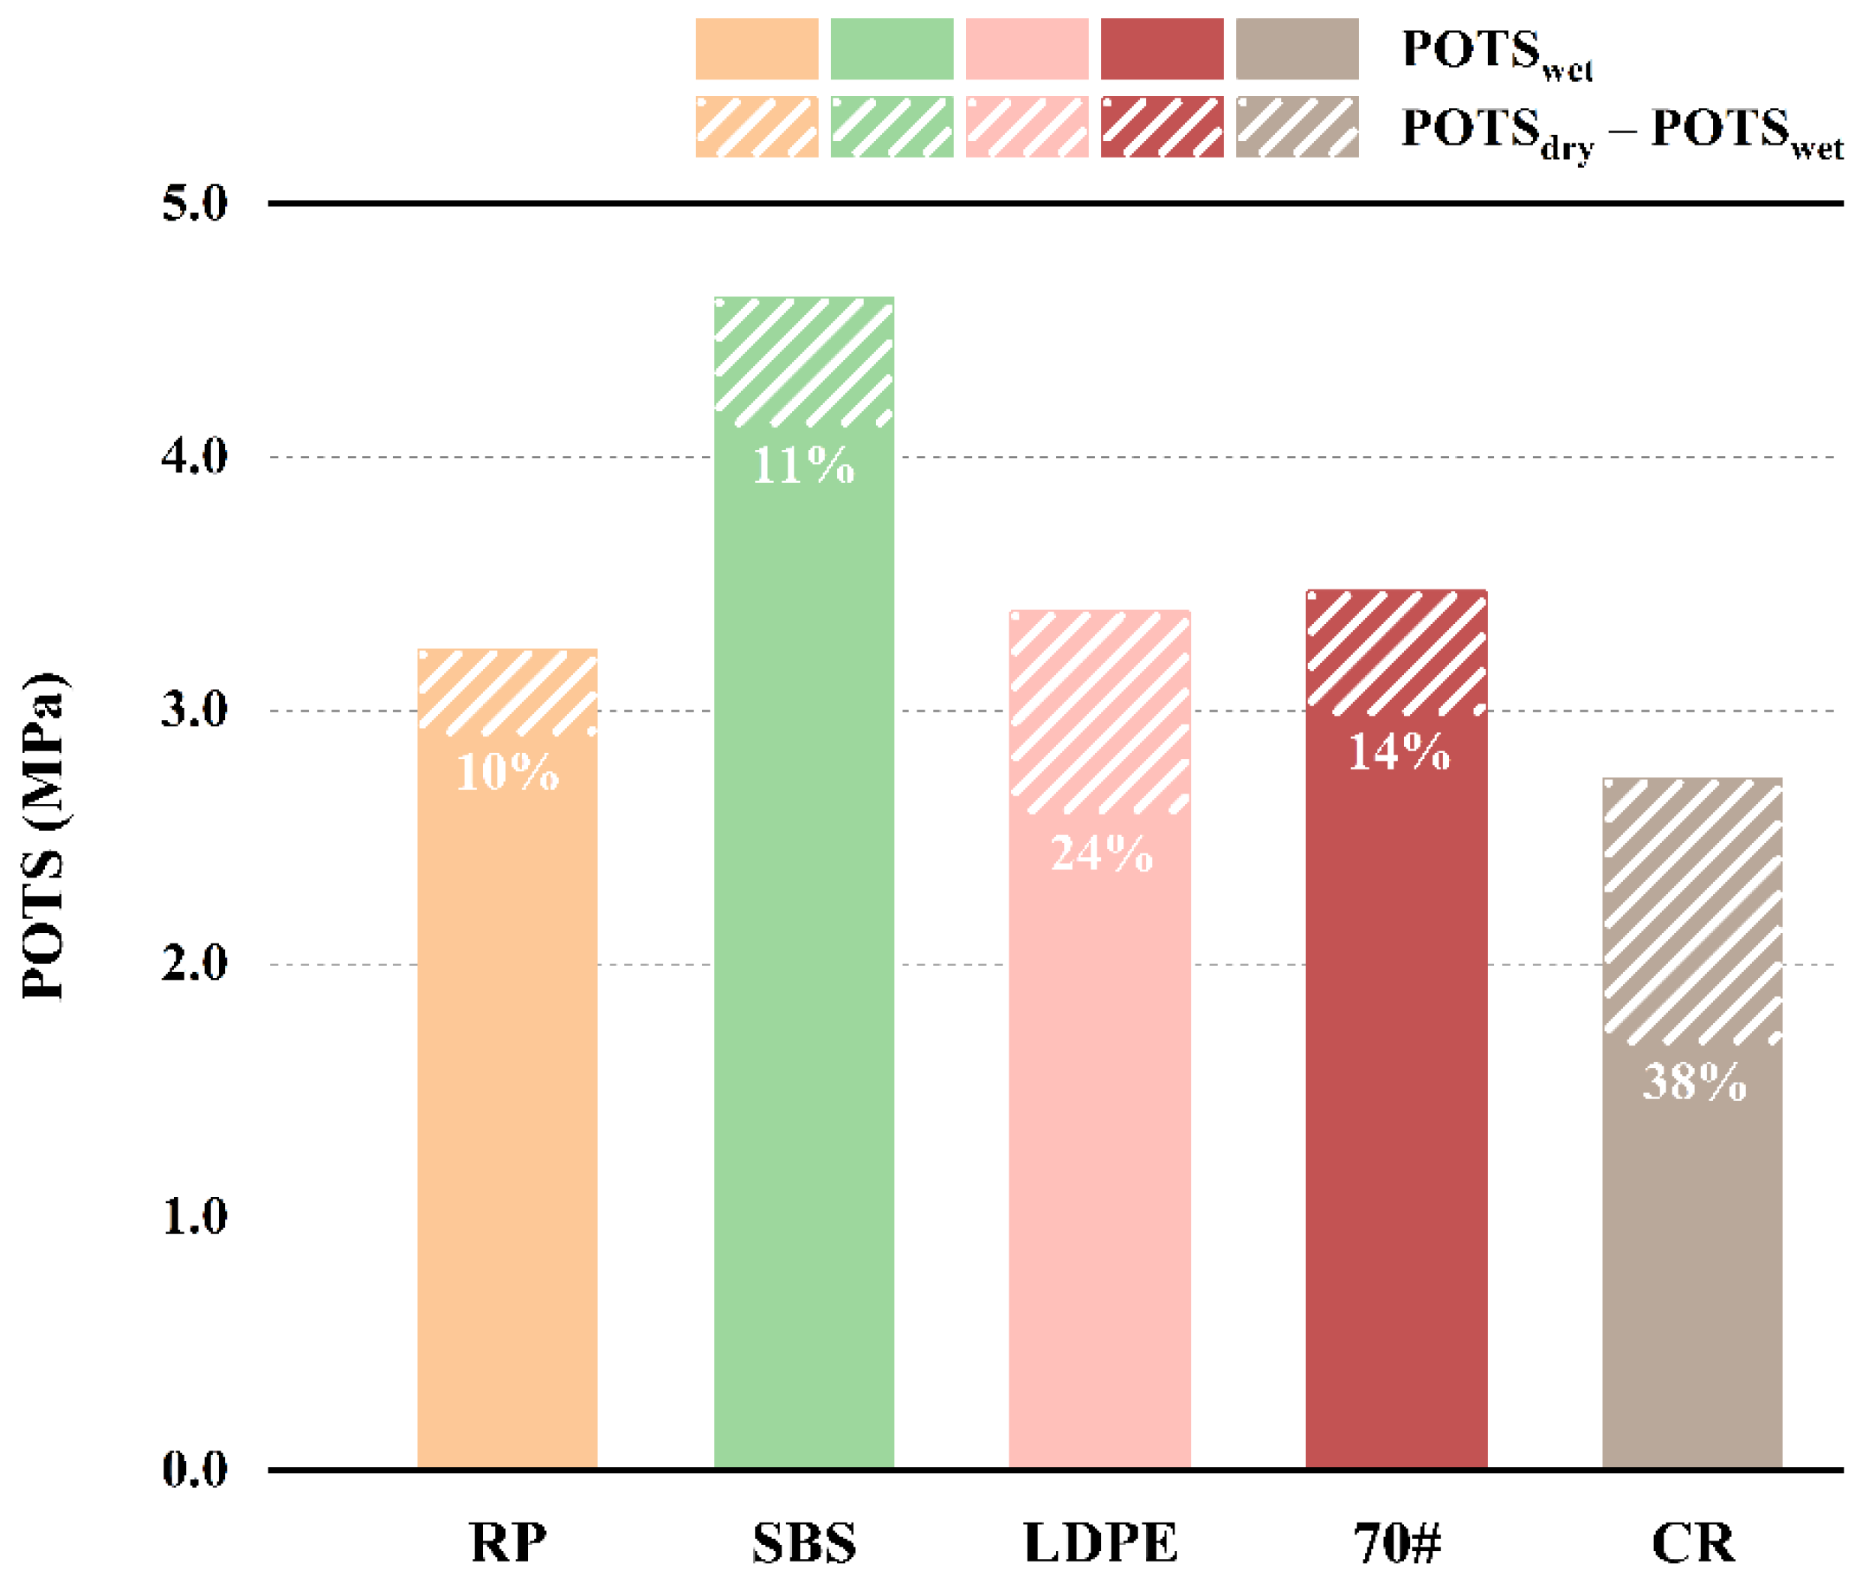
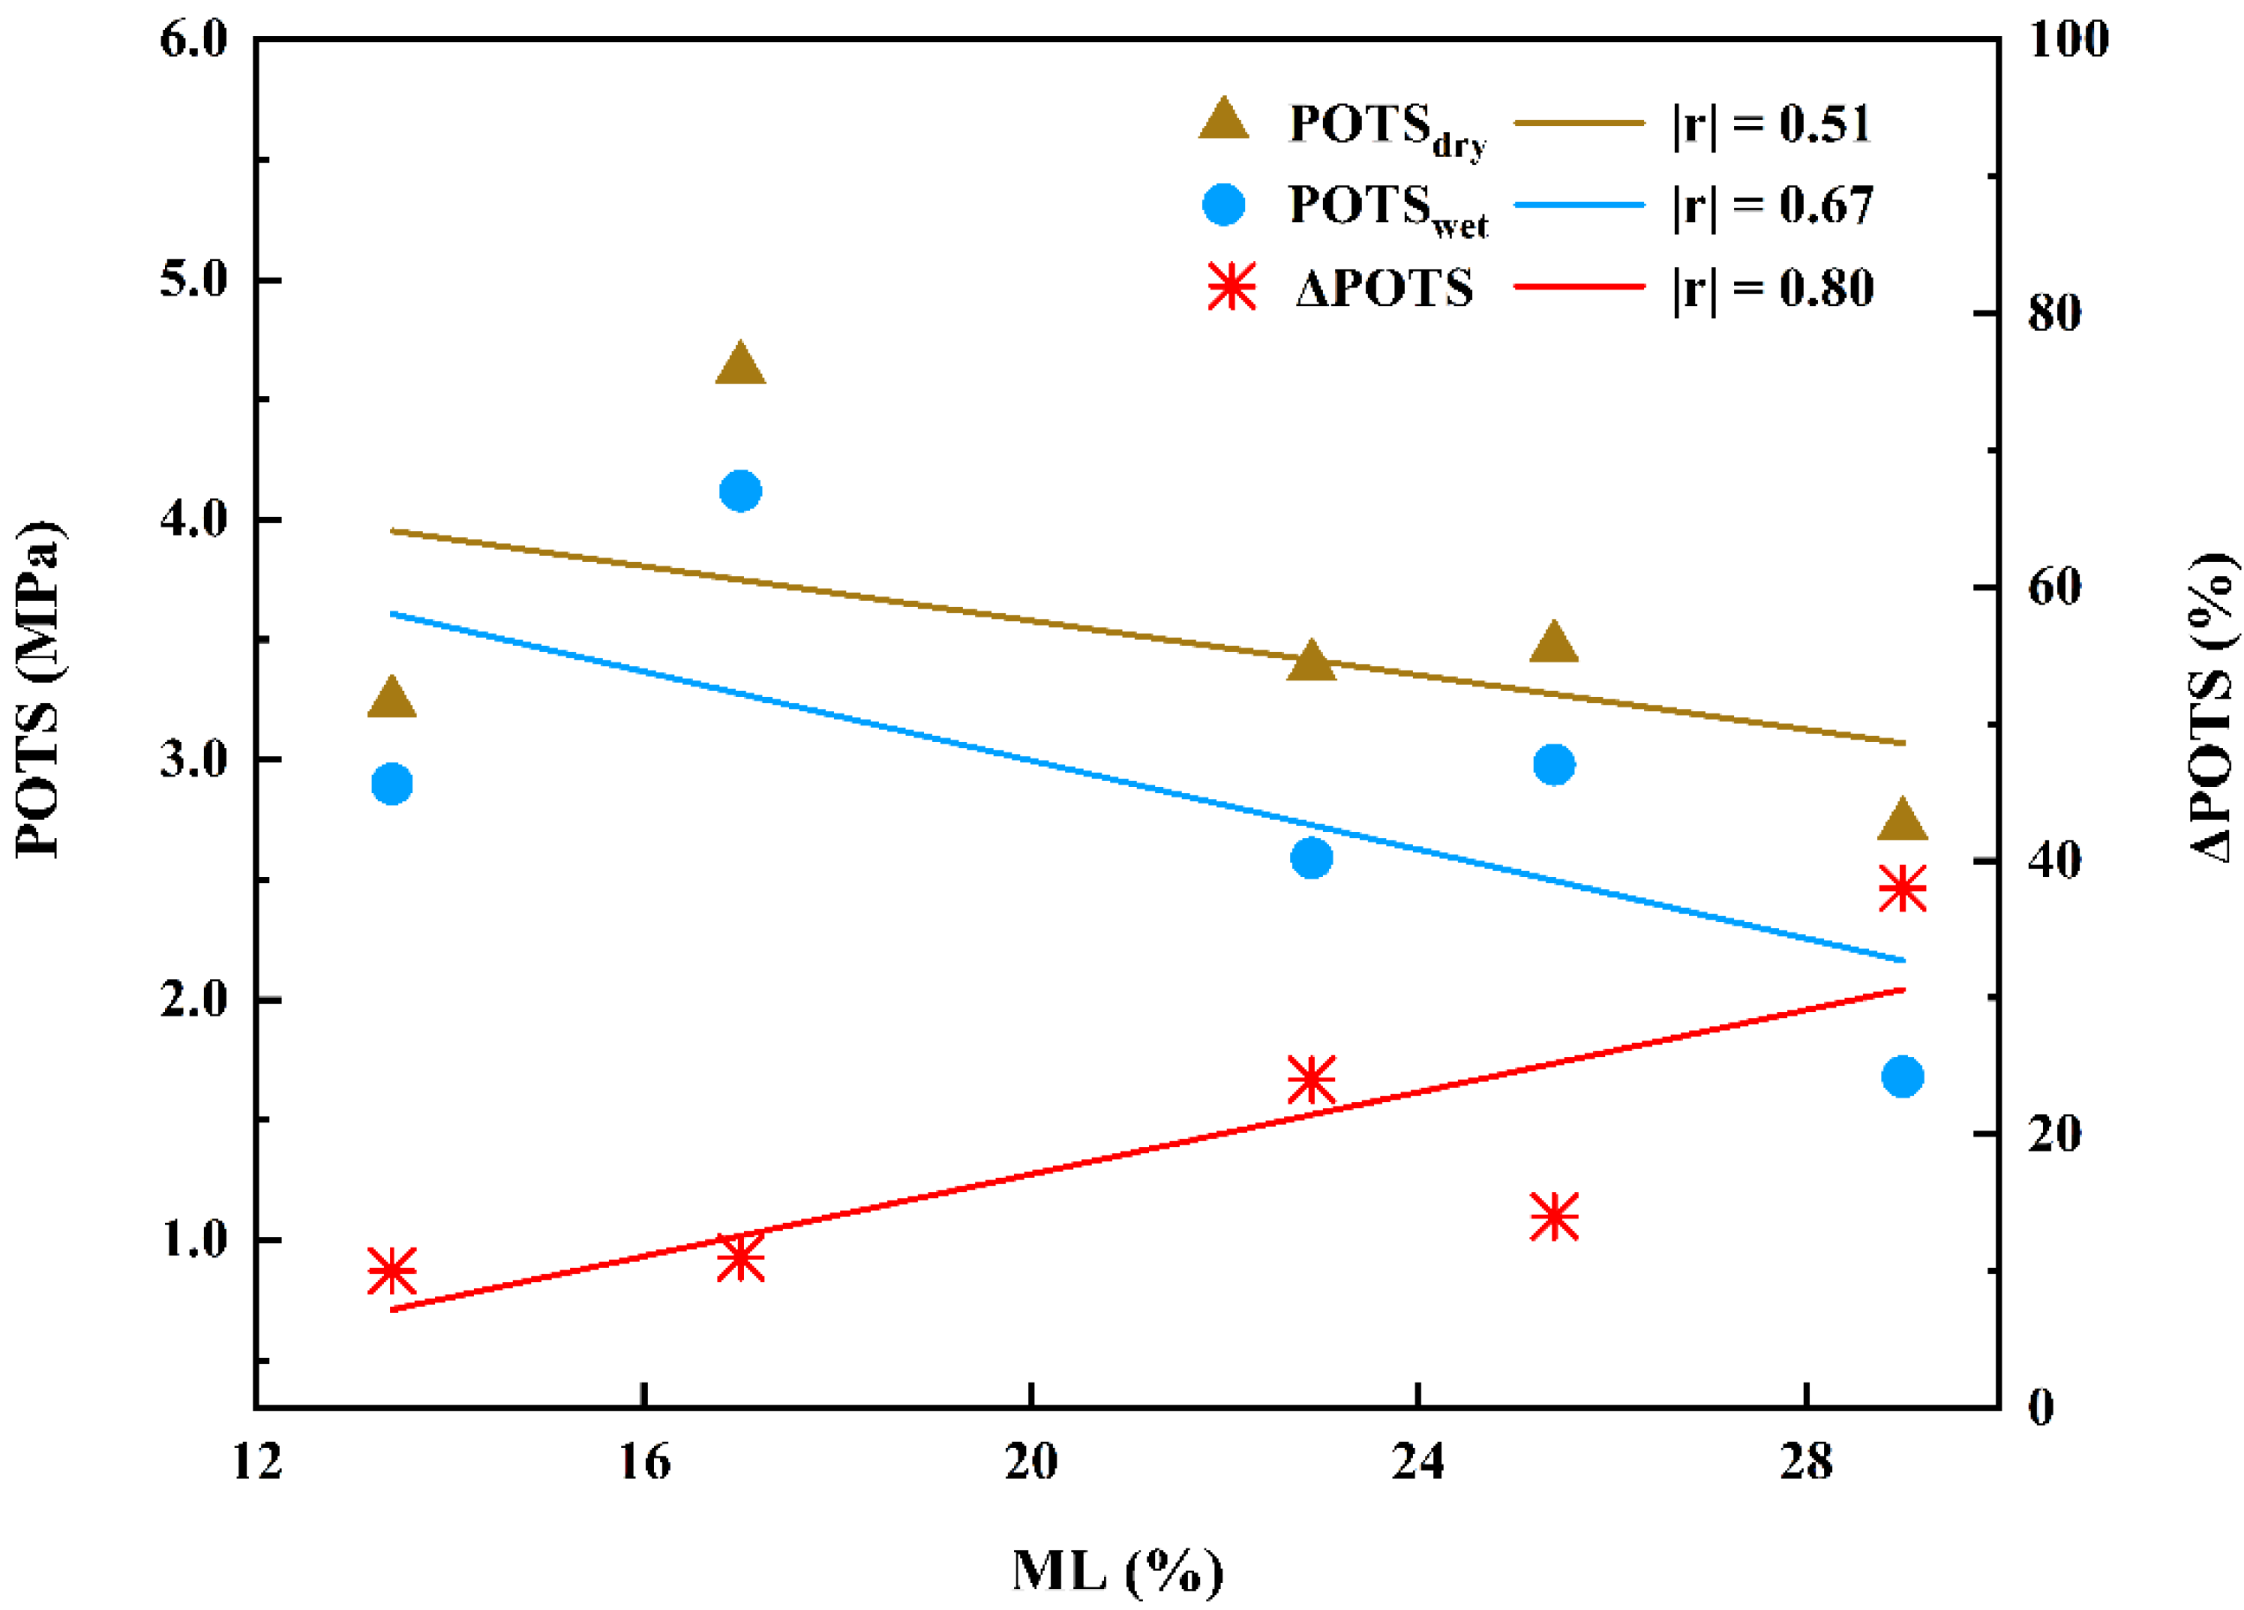
- The BBS test was conducted on the same five asphalt binders, and it was found that the evaluation results of adhesion properties between asphalt and aggregate were not consistent with the brush damage test. The pull-off tensile strength under dry conditions (POTSdry) had a poor correlation with ML. Although the pull-off tensile strength under wet conditions (POTSwet) has been a popular index to evaluate adhesion properties, it ignores the influence of the actual texture of the aggregate. The credibility of the above two indexes to evaluate the adhesion properties between asphalt and aggregate was doubtful. ΔPOTS represented the ability of asphalt to resist the loss of adhesion strength caused by moisture damage, which had a strong correlation with ML based on simulated actual working conditions and could be used as an evaluation index to evaluate the adhesion properties between asphalt and aggregate.
- (5)
- On the basis of simulating actual working conditions, the brush damage test for evaluating the adhesion properties between asphalt and aggregate had the advantages of simple operation, high credibility, and good discrimination
Author Contributions
Funding
Institutional Review Board Statement
Informed Consent Statement
Data Availability Statement
Conflicts of Interest
Abbreviations
| Abbreviation or Acronym | Full Name |
| ML | Mass loss rate |
| BBS | Binder bond strength |
| POTSdry | Pull-off tensile strength under dry conditions |
| POTSwet | Pull-off tensile strength under wet conditions |
| POTS | Pull-off tensile strength |
| LDPE | Low density polyethylene |
| SBS | Styrene-butadiene-styrene block copolymer |
| CR | Crumb rubber |
| RP | Rubber plastic powder |
References
- Haider, S.; Hafeez, L.; Jamal; Ullah, R. Sustainable use of waste plastic modifiers to strengthen the adhesion properties of asphalt mixtures. Constr. Build. Mater. 2020, 235, 117496. [Google Scholar] [CrossRef]
- Ameri, M.; Ziari, H.; Yousefi, A.; Behnood, A. Moisture susceptibility of asphalt mixtures: Thermodynamic evaluation of the effects of antistripping additives. J. Mater. Civ. Eng. 2021, 33, 4020457. [Google Scholar] [CrossRef]
- Ghabchi, R.; Singh, D.; Zaman, M. Laboratory evaluation of stiffness, low-temperature cracking, rutting, moisture damage, and fatigue performance of WMA mixes. Road Mater. Pavement Des. 2015, 16, 334–357. [Google Scholar] [CrossRef]
- Chu, L.; Luo, L.; Fwa, T.F. Effects of aggregate mineral surface anisotropy on asphalt-aggregate interfacial bonding using molecular dynamics (MD) simulation. Constr. Build. Mater. 2019, 225, 1–12. [Google Scholar] [CrossRef]
- Junior, J.; Babadopulos, L.; Soares, J.B. Influence of aggregate–binder adhesion on fatigue life of asphalt mixtures. J. Test. Eval. 2020, 48, 150–160. [Google Scholar]
- Research Institute of Highway Ministry of Transport. Standard Test Methods of Bitumen and Bituminous Mixtures for Highway Engineering (JTG E20-2011); China Communications Press: Beijing, China, 2011. [Google Scholar]
- Valentin, J.; Trejbal, J.; Nezerka, V.; Valentova, T.; Vackova, P.; Ticha, P. A comprehensive study on adhesion between modified bituminous binders and mineral aggregates. Constr. Build. Mater. 2021, 305, 124686. [Google Scholar] [CrossRef]
- Mccann, M.; Sebaaly, P. Quantitative evaluation of stripping potential in hot-mix asphalt, using ultrasonic energy for moisture-accelerated conditioning. Transp. Res. Rec. J. Transp. Res. Board 2001, 1767, 48–49. [Google Scholar] [CrossRef]
- Vuorinen, M.; Hartikainen, O. A new ultrasonic method for measuring stripping resistance of bitumen on aggregate. Road Mater. Pavement Des. 2011, 2, 297–309. [Google Scholar] [CrossRef]
- Curtis, C.W.; Ensley, K.; Epps, J. Fundamental Properties of Asphalt-Aggregate Interactions including Adhesion and Absorption (SHRP-A-341); National Research Council: Washington, DC, USA, 1993. [Google Scholar]
- Kavussi, A.; Naderi, B. Application of SCB Test and Surface Free Energy Method in Evaluating Crack Resistance of SBS Modified Asphalt Mixes. Civ. Eng. Infrastruct. J. 2020, 53, 103–114. [Google Scholar]
- Tanzadeh, R.; Shafabakhsh, G. Surface free energy and adhesion energy evaluation of modified bitumen with recycled carbon black (micro-nano) from gases and petrochemical waste. Constr. Build. Mater. 2020, 245, 118361. [Google Scholar] [CrossRef]
- Al-Saffar, Z.H.; Yaacob, H.; Satar, M.K.I.M.; Jaya, R.P. Impacts of maltene on the wettability and adhesion properties of rejuvenated asphalt binder. Arab. J. Sci. Eng. 2021, 46, 1–12. [Google Scholar] [CrossRef]
- Wei, J.; Zhang, Y. Application of sessile drop method to determine surface free energy of asphalt and aggregate. J. Test. Eval. 2012, 40, 807–813. [Google Scholar] [CrossRef]
- Soenen, H.; Vansteenkiste, S.; Kara De Maeijer, P. Fundamental Approaches to Predict Moisture Damage in Asphalt Mixtures: State-of-the-Art Review. Infrastructures 2020, 5, 20. [Google Scholar] [CrossRef] [Green Version]
- Allen, R.G.; Little, D.N.; Bhasin, A. Structural characterization of micromechanical properties in asphalt using atomic force microscopy. J. Mater. Civ. Eng. 2012, 24, 1317–1327. [Google Scholar] [CrossRef]
- Ji, X.P.; Li, J.; Zhai, X.G.; Zou, H.W.; Chen, B. Application of atomic force microscope to investigate the surface micro-adhesion properties of asphalt. Materials 2020, 13, 1736. [Google Scholar] [CrossRef] [Green Version]
- Nazzal, M.D.; Abu Qtaish, L.; Al-Hosainat, A.; Abu Talha, S.; Abbas, A. Evaluation of moisture damage in asphalt mixtures at macro- and nanoscales. J. Mater. Civ. Eng. 2021, 33, 04021369. [Google Scholar] [CrossRef]
- Wang, Y. Study on Adhesion between Asphalt and Aggregate Using Surface Energy Theory. Master’s Thesis, Hunan University, Hunan, China, 2010. [Google Scholar]
- Wang, W.N.; Xu, Q.J.; Zhou, S.X.; Qin, Y.; Yan, Q. A review on evaluation methods of asphalt-aggregate adhesion. Mater. Rev. 2019, 33, 2197–2205. [Google Scholar]
- Lacombe, R. Adhesion Measurement Methods: Theory and Practice; CRC Press Taylor & Francis Group: Boca Raton, FL, USA, 2006. [Google Scholar]
- Wang, Y. The Bonding Characteristic Research of Aggregate-Asphalt Mortar Interface. Master’s Thesis, Harbin Institute of Technology, Harbin, China, 2015. [Google Scholar]
- American Society of Testing Materials ASTM D4541, Standard Test Method for Pull-Off Adhesion Strength of Coatings on Concrete Using Portable Pull-Off Adhesion Testers; American Society of Testing Materials: West Conshohocken, PA, USA, 2009.
- AASHTO TP-91, Standard Method of Test for Determining Asphalt Binder Bond Strength by Means of the Binder Bond Strength (BBS) Test; American Association of State Highway and Transportation Officials: Washington, DC, USA, 2011.
- Lv, Q.; Huang, W.D.; Sun, L.J.; Zhou, L.; Liu, L.Y. Evaluation and mechanism analysis of adhesive self-healing property of asphalt. J. Harbin Inst. Technol. 2021, 53, 33–41. [Google Scholar]
- Guo, M.; Tan, Y.Q.; Zhou, S.W. Multiscale test research on interfacial adhesion property of cold mix asphalt. Constr. Build. Mater. 2014, 68, 769–776. [Google Scholar] [CrossRef]
- Khasawneh, M.A.; Al-Oqaily, D.M.; Abu Alia, A.H.; Al-Omari, A.A. Evaluation of aggregate-binder bond strength using the bbs device for different road materials and conditions. Int. J. Pavement Eng. 2021, 107, 2411–2502. [Google Scholar] [CrossRef]
- Chaturabong, P.; Bahia, H.U. Effect of moisture on the cohesion of asphalt mastics and bonding with surface of aggregates. Road Mater. Pavement Des. 2018, 19, 741–753. [Google Scholar] [CrossRef]
- Mogawer, W.S.; Austerman, A.J.; Bahia, H.U. Evaluating the effect of warm-mix asphalt technologies on moisture characteristics of asphalt binders and mixtures. Transp. Res. Rec. J. Transp. Res. Board 2011, 2209, 52–60. [Google Scholar] [CrossRef]
- Aguiar-Moya, J.P.; Loria-Salazar, L.; Salazar, J.; Corrales-Azofeifa, J.; Villegas, E.; Corrales-Azofeifa, J.P.; Hajj, E.Y. Evaluation of Adhesion Properties of Costa Rican Asphalt Mixtures Using the Bitumen Bond Strength (BBS) and Contact Angle Measurement Tests. Presented at the 92nd Annual Meeting of the Transportation Research Board, Washington, DC, USA, 13–17 January 2013. [Google Scholar]
- Mishra, V.; Singh, D. Evaluating factors affecting aggregate-bitumen interfacial strength using binder bond-strength test. J. Mater. Civ. Eng. 2021, 33, 04021089. [Google Scholar] [CrossRef]
- Li, Z.; Zhang, Y.; Fa, C.; Zou, X.; He, R. Investigation on the temperature distribution of asphalt overlay on the existing cement concrete pavement in hot-humid climate in southern China. Adv. Civ. Eng. 2021, 2021, 1–12. [Google Scholar] [CrossRef]
- Fu, J.; Liu, Z.H.; Zuo, X.N.; Lai, Z.H.; Wang, X.Z.; Ding, Q.J. Influence of regional climate change on summer temperature effect of asphalt pavement. J. Chongqing Univ. (Nat. Sci.) 2020, 39, 87–94. [Google Scholar]
- Huang, W.D.; Zhou, L. Evaluation of adhesion properties of modified asphalt binders with use of binder bond strength test. Transp. Res. Rec. J. Transp. Res. Board 2017, 2632, 88–98. [Google Scholar] [CrossRef]


| Asphalt Binder | Modifier | Preparation |
|---|---|---|
| LDPE | 6% LDPE 868-000 | Adding LDPE to 70# and stirring for 75 min at 180 °C |
| SBS | 4% linear SBS-791 and 0.12% sulfur | 1. Adding linear SBS-791 to 70# at 180 °C and shearing for 30 min at 3500 RPM 2. Adding sulfur and stirring for 2 h at 180 °C |
| CR | 20% crumb rubber of 30 mesh | 1. Adding crumb rubber to 70# at 180 °C and shearing for 30 min at 3500 RPM 2. Stirring for 1 h at 180 °C |
| RP | 14% rubber plastic powder | 1. Adding rubber plastic powder to SBS at 185 °C and shearing for 30 min at 3500 RPM 2. Stirring for 1.5 h at 185 °C |
| Asphalt Binder | Penetration at 25 °C (0.1 mm) | Softening Point (°C) | Ductility (cm) |
|---|---|---|---|
| 70# | 62 | 46.8 | 24.3 |
| LDPE | 36 | 54.6 | 6.6 |
| SBS | 51 | 79.4 | 25.6 |
| CR | 45 | 58.4 | 7.6 |
| RP | 45 | 99.4 | 16.6 |
| Aggregate | Particle Size | Gross Volume Relative Density | Apparent Relative Density | Water Absorption (%) |
|---|---|---|---|---|
| Basalt | 2.36–4.75 mm | 2.732 | 2.873 | 1.74 |
| Limestone | 2.36–4.75 mm | 2.692 | 2.705 | 1.82 |
| Type of Brush | Length × Width × Height of Brush (mm) | Length of Brush Filaments (mm) | Diameter of Brush Filaments (mm) |
|---|---|---|---|
| PP Brush | 130 × 7 × 25 | 17 | 0.15 |
| Steel Wire Brush | 0.40 |
Publisher’s Note: MDPI stays neutral with regard to jurisdictional claims in published maps and institutional affiliations. |
© 2022 by the authors. Licensee MDPI, Basel, Switzerland. This article is an open access article distributed under the terms and conditions of the Creative Commons Attribution (CC BY) license (https://creativecommons.org/licenses/by/4.0/).
Share and Cite
Liu, J.; Sun, M.; Wu, S.; Huang, W.; Fan, Z.; Du, X. A Test Method to Evaluate the Adhesive Property between Asphalt and Aggregate Based on Simulating Actual Working Conditions. Sustainability 2022, 14, 2160. https://doi.org/10.3390/su14042160
Liu J, Sun M, Wu S, Huang W, Fan Z, Du X. A Test Method to Evaluate the Adhesive Property between Asphalt and Aggregate Based on Simulating Actual Working Conditions. Sustainability. 2022; 14(4):2160. https://doi.org/10.3390/su14042160
Chicago/Turabian StyleLiu, Jianhua, Mutian Sun, Shaoming Wu, Wenyuan Huang, Zhenyang Fan, and Xiaobo Du. 2022. "A Test Method to Evaluate the Adhesive Property between Asphalt and Aggregate Based on Simulating Actual Working Conditions" Sustainability 14, no. 4: 2160. https://doi.org/10.3390/su14042160