1. Introduction
Powered two wheelers (PTWs) is a term used in the motorcycle industry to refer to motorcycles, mopeds, and scooters. PTWs are an economical means of transportation that provide greater mobility in traffic jams. The use of PTWs is very popular worldwide as they offer various advantages in terms of both personal and societal benefits. They facilitate movement in congested urban environments, have a low initial cost, and consume less fuel, while requiring less space for parking. In addition, they are very flexible (unlike more rigid public transport systems), have a smaller environmental footprint, and offer a beneficial door-to-door personal solution. Nevertheless, the high number of road accidents and poor safety statistics in many countries in Europe and around the world have highlighted the vulnerability of users of PTWs. Motorcycles have very different road performance characteristics than other motorised vehicles, and certain driving manoeuvres and road conditions pose a higher risk to riders than to car drivers. For all these reasons, riders of PTWs are considered a particularly vulnerable group of road users. The lack of a protective ‘shell’, their lower mass, and different driving dynamics compared to those of other vehicles also increase the severity of the collisions in which they could be involved. Considering the different controls of PTWs and cars, i.e., handlebars and lean angle for PTWs and the steering wheel for cars, it is clear how difficult motorcycles are to handle, especially during manoeuvres, such as cornering or braking or those that are hard to mitigate, e.g., avoiding incidents in emergency situations. Another critical factor is the road environment, which is generally designed for heavy vehicles, e.g., crash barriers, which can be a hazard for PTWs.
Various studies [
1] have shown that in the European Union, PTW riders are one of the most vulnerable groups of road users and are frequently involved in road accidents and, unfortunately, in many cases seriously injured or even killed. Studies focusing on accidents involving PTWs [
2,
3] report that about 96% of riders of PTWs involved in traffic accidents are at a high risk of suffering an injury [
2] and that 50% of accidents involve serious injuries or even death of the rider [
3].
In the EU, the number of riders killed per 100,000 registered motorcycles is more than double that of passenger car occupants killed per 100,000 registered passenger cars [
4]. In 2014 alone, 26,000 people were killed in road accidents in the EU, with PTWs accounting for 17% of the deaths (compared to 16% in 2005). In the same year, at least 3841 riders—both riders and passengers of PTWs—were killed in road accidents in the EU [
5].
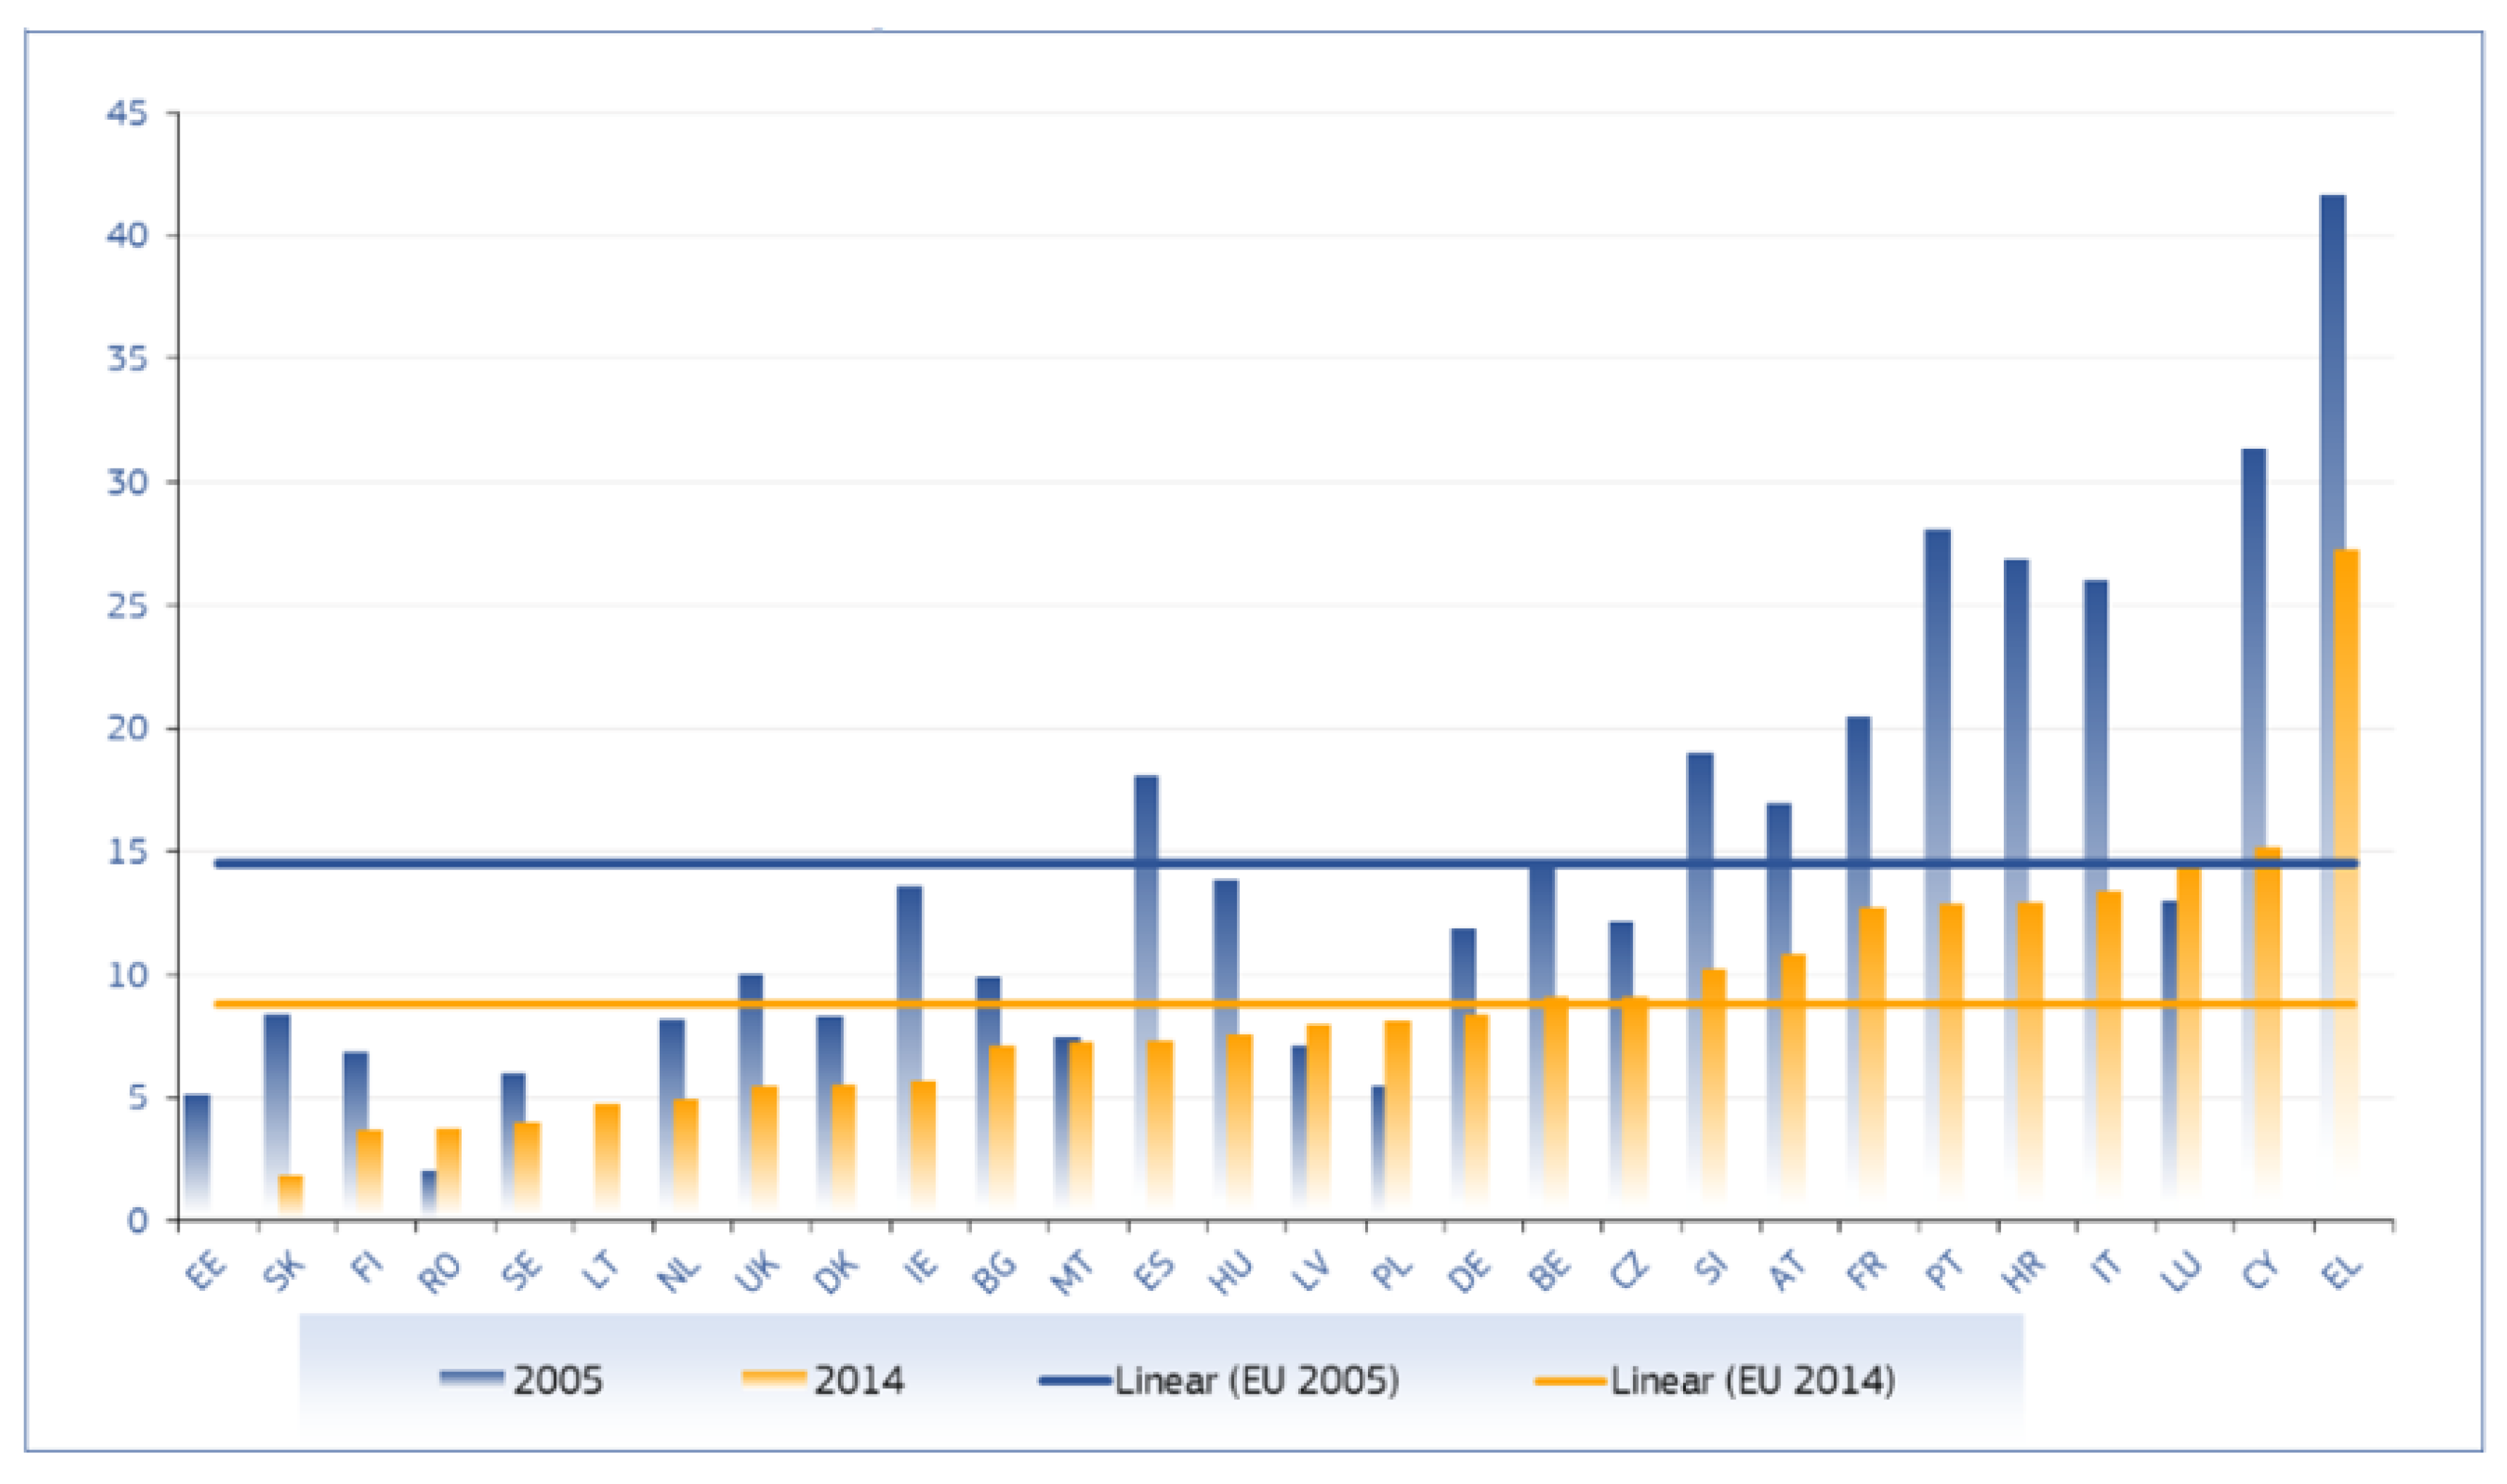
Figure 1 shows the trend in the number of deaths of PTW riders between 2005 and 2014, illustrating a decrease in most EU countries: a significant decrease was observed in Italy, Portugal, and Cyprus, while the number of fatalities increased in Romania and Poland [
5].
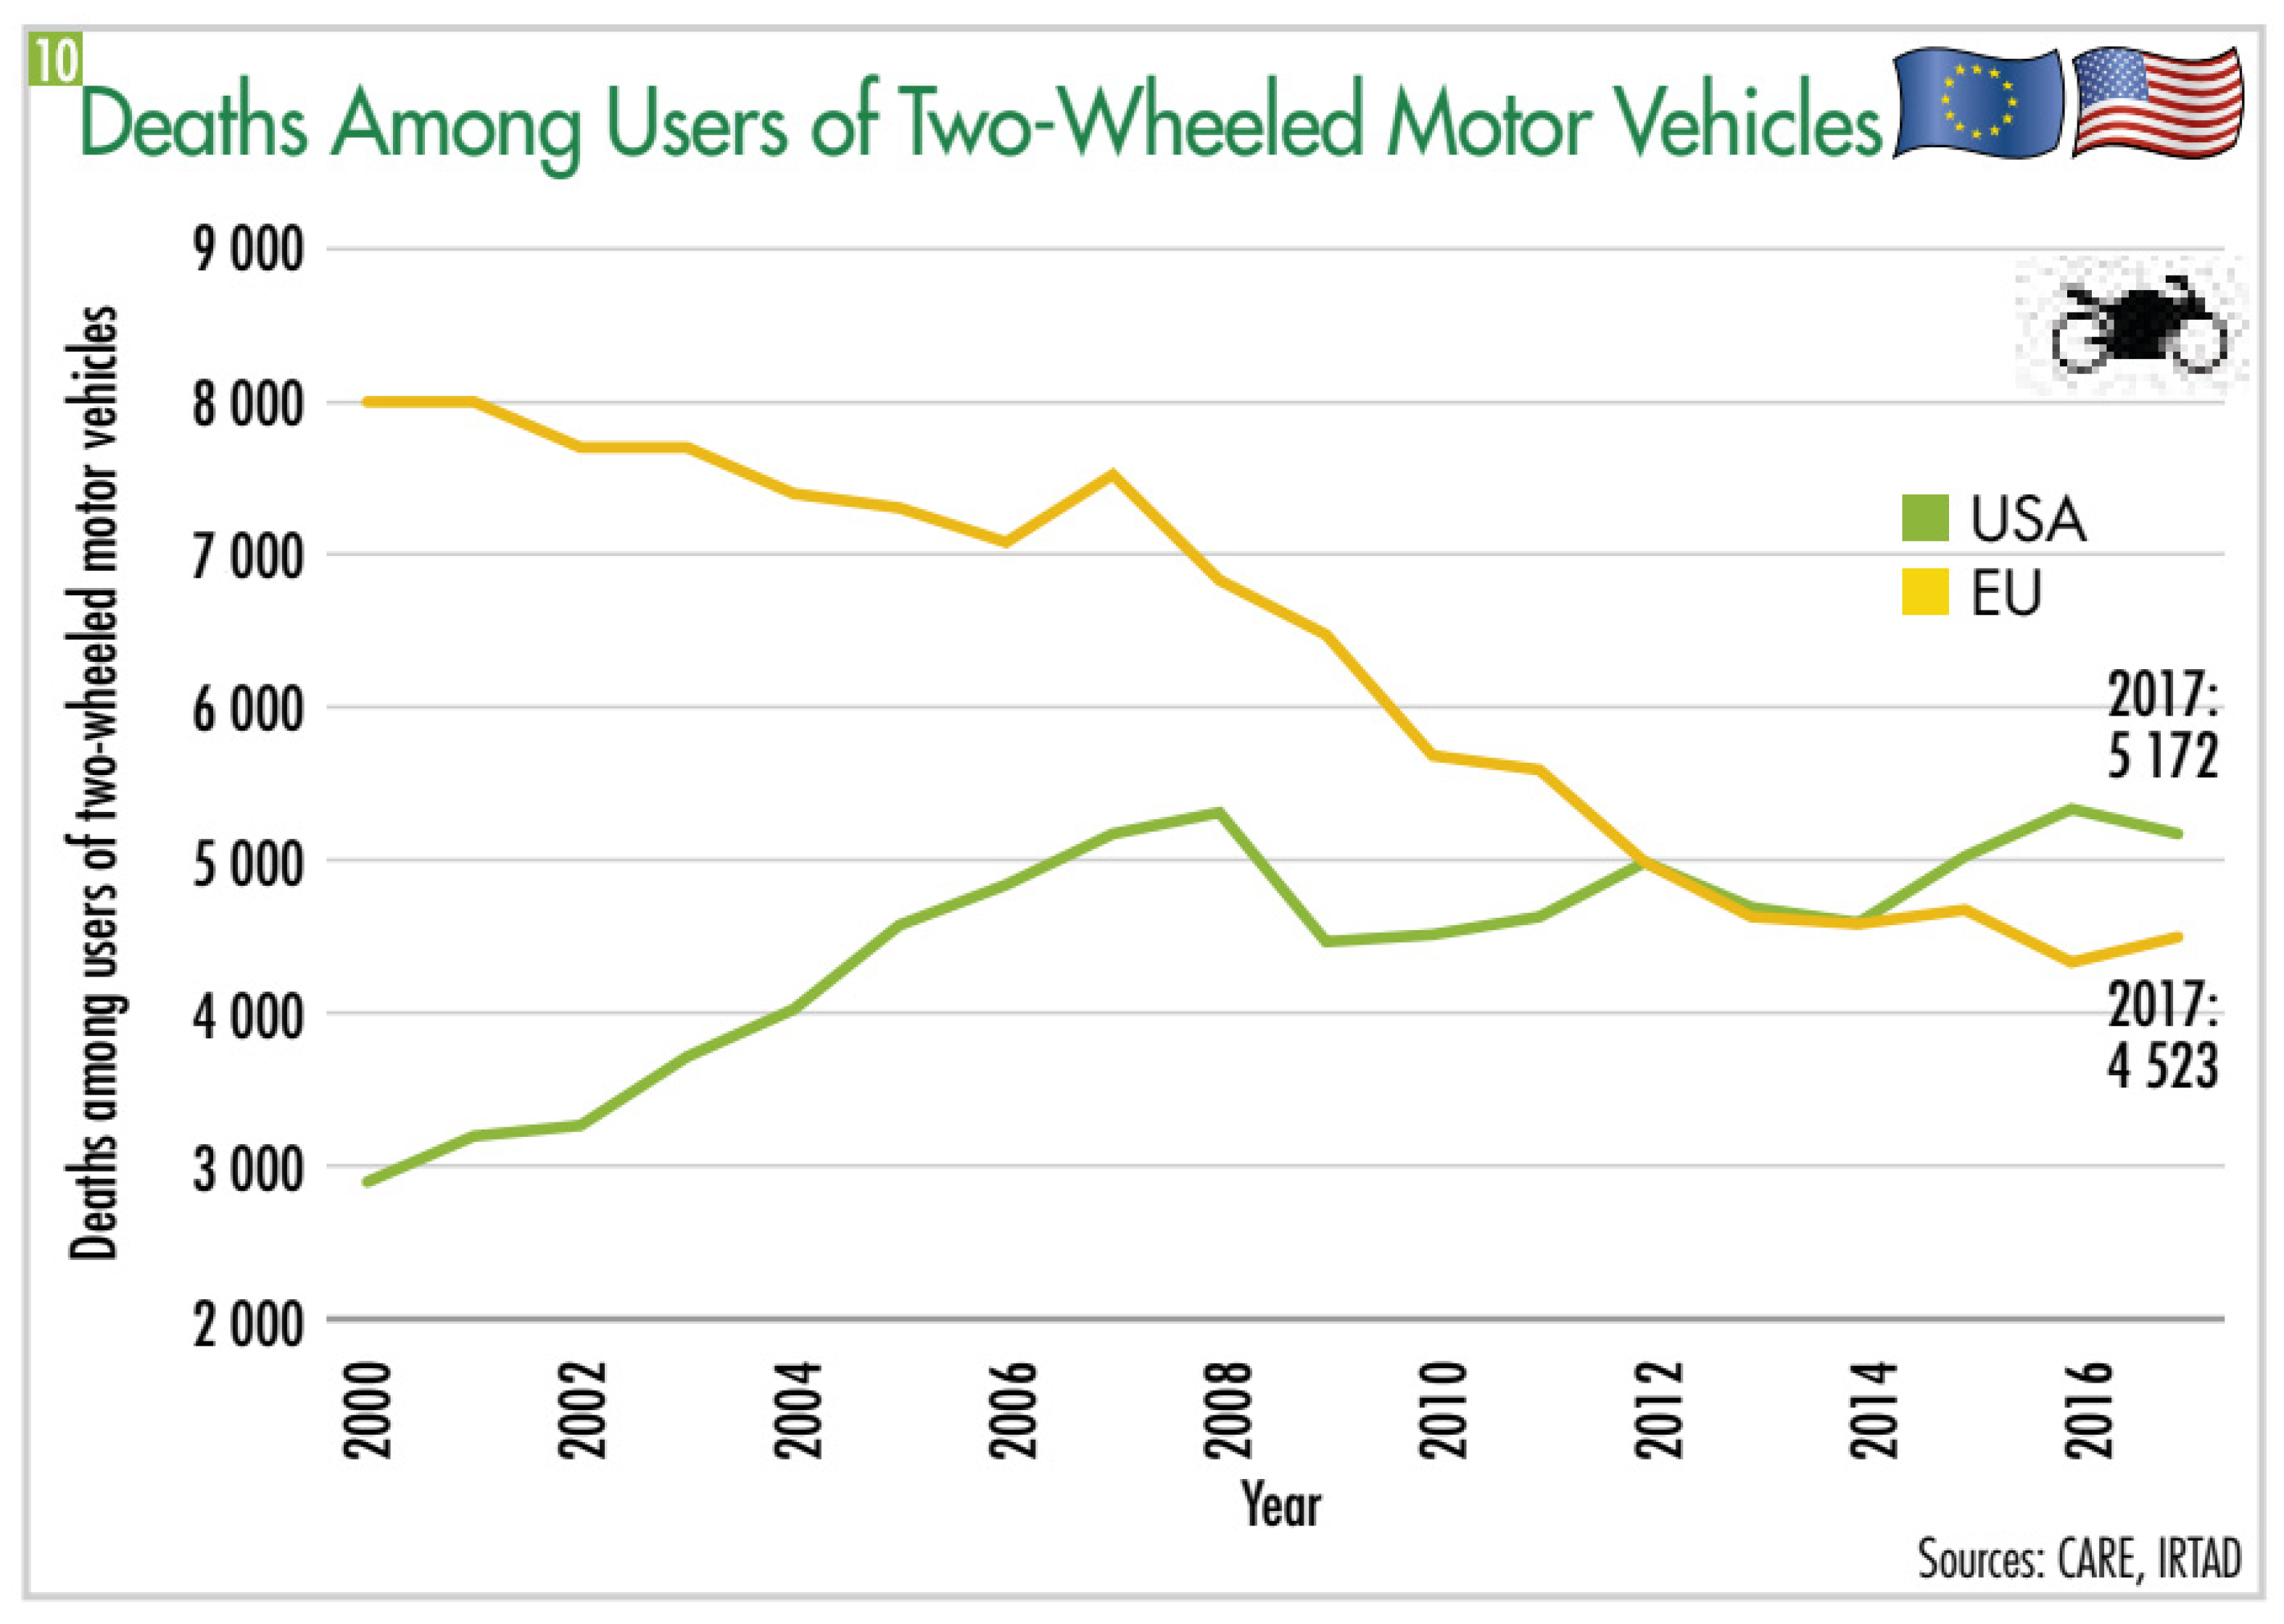
DEKRA’s 2020 report [
6] is of particular concern. This document, which reports both road safety data and the opinions of road safety experts, is focused on the safety of two-wheeled vehicle users, a group of road users that includes bike and e-bike riders, moped and e-scooter users, and motorcycle riders. Among the reported data,
Figure 2 is of particular interest, comparing the number of deaths among PTW users in Europe and the USA. Though data are limited to 2017, the trend is alarming in both continents: while a descending trend can be seen in Europe from 2000 to 2016 compared to the increasing trend in the USA, taking a closer look at the last section of the graph, an increase in deaths can be noted from 2016 to 2017, with 4523 deaths among PTW users in Europe.
In Slovenia, the situation related to PTW safety on the road is also similar to that in Europe: though general road safety has indeed improved in Slovenia in the last decade, the same cannot be stated for the safety of motorcycle riders. National statistics [
7,
8] show that the number of road accidents in which motorcycle riders were involved was the same in 2019 as in 2010, i.e., 679 road accidents. Moreover, though the number of road accidents involving the impairment of PTW users dropped in 2019 to 6% in comparison to 2010, the number of accidents that led to the death of a PTW rider increased to 18%. Additionally, considering the rate of accidents among PTW riders in relation to the total number of accidents on Slovenian roads, there was a notable increase from 3.2% to 3.6% in the period from 2010 to 2019; the rate of fatal road accidents involving motorcycle riders increased from 12.3% to 19.6%, while the percentage of motorcycle riders who survived but were injured increased from 19.8% to 23.0%. The same statistics [
7,
8] also highlight that in the majority of cases—on average, 67% of crashes in the period from 2010 to 2019—motorcycle riders account for the highest number of fatalities among road users. Finally, attention should be paid to the cause and location of accidents. Of the total number of road crashes in which motorcycle riders were involved, 48% were caused by the PTW rider themselves and were due to excessive speed. The second biggest causes of road accidents are incorrect riding and low safety distance (17% of road accidents involving PTW users). In cases where the responsible road user is not a rider, the most common causes of accidents are non-compliance to the rules of giving way (44% of accidents) and non-correct movement of the vehicle (16% of cases). Highlighting the location of road accidents, the majority occurred within urban areas. In the period 2010 to 2019, 50% of the road accidents that ended in the death of a road user occurred on state roads.
Taking all these observations into account, it is clear that there is significant interest in understanding the relationship between riders and road infrastructure in order to identify new approaches to road design, equipment and maintenance that take into account the road safety of riders.
The aim of this study is to present the preliminary results of a field study co-funded by the Slovenian Research Agency to improve road safety for riders. For this purpose, a comparative study of the gaze behaviour of riders and car drivers was conducted. Knowing what riders focus on while travelling allows an understanding of what the dangerous elements are for this specific group of road users, thus helping in the selection and location of suitable safety countermeasures both during the road design and maintenance phases. Understanding the elements focused on by both riders and drivers and linking them to their speed performance could also help define specific countermeasures, which could have a double effect on safety: on the one hand by ‘driving’ the detection of risks for riders, while on the other by encouraging drivers to slow down.
This paper is divided into six sections: the introduction is followed by a literature review of research on rider safety and eye-tracking technology. This is followed by an explanation of the data collection, elaboration, and analysis methodology. Section Four analyses the results both qualitatively and quantitatively. Section Five is the final part of the document, in which the results are discussed and conclusions are drawn.
2. Related Works
One aspect that can greatly affect the safety of riders is their distraction and attention allocation.
Attention and distraction are highly linked, especially when it comes to road safety. Eye-tracking studies carried out in the field of transportation often analyse what elements are more fixated by a determined class of users, and, within these elements, the authors define which of them distract road users and which are road-related (and, therefore, it is h for users to fixate on them). An example related to drivers is the study carried out by Topolšek et a. [
9]. A study that somehow relates gaze behaviour and sources of risk is [
10], in which the authors link pedestrian gaze behaviour to a ‘natural’ stimulus (oncoming cars) to calculate reaction time. In this case, the oncoming cars, which at the beginning of the experiment are not in sight to the pedestrian, can be seen as a source of risk. In general, researchers that develop eye-tracking experiments focus on distraction in order to understand what important elements are not seen by road users if distracted, and, in doing so, they highlight design improvements that could help to combat such situations that cause a distraction.
Previous research has often conducted simulations to investigate driver distraction in various traffic and roadside arrangements [
11,
12], however, they do not necessarily reflect the real-world environment, thus sometimes leading to less reliable results. The use of mobile eye-tracking solutions applied to different road safety aspects and types of road users has increased steadily in recent years. In the early days of their use, researchers mainly used mobile eye-tracking equipment in laboratories and conducted experiments indoors [
13,
14]. However, as reported by [
15,
16], these experiments did not always reflect the realistic behaviour and situation of road users in a real traffic environment. This led researchers to conduct a growing number of studies in real-world environments [
17,
18,
19,
20,
21].
Fotios et al. in [
17,
18] developed several outdoor experiments using eye-tracking devices. In the first part of their work, the researchers investigated the gaze behaviour of pedestrians during the day and at night and assessed the importance of lighting in residential areas, while in their second study, they addressed the importance of fixations on other pedestrians. Trefzeger et al. in [
19] developed a comparative analysis of gaze behaviour between pedestrians and cyclists, where both groups of road users travelled along the same route on three different road sections: a straight roadway, a traffic-free intersection, and a pedestrian crossing.
Focusing on riders, Di Stasi et al. focused on riders and used eye-tracking to understand how training can affect the hazard perception of two-wheeled riders and how this perception changes from novice to experienced drivers [
20]. They developed an indoor experiment in which riders ran six different virtual scenarios and found an effective improvement in driving skills, with more efficient speed adaptation to different situations, a lower number of collisions, and a lower number of trajectory corrections. A study conducted in Greece [
19] investigated rider distraction on rural roads and found that the average distraction time was more than 0.7 s on all the road sections studied, increasing to more than 1 s when riding on suburban roads and to more than 1.2 s on urban roads.
Beyond eye-tracking research, riders have been the subject of attention in the past: a study of the correlation between riders’ behavioural perception and their actual behaviour was conducted in [
20] and [
22]; changes in motorists’ behaviour while riding a motorcycle or driving a car were studied in [
23], the way riders recognise roadside objects (e.g., advertisements) was studied in [
9], riders’ reactions to safe and unsafe roadside objects were highlighted in [
1], and riders’ risk thresholds were investigated in [
24]. In the field of PTWs, eye-tracking efforts are still very rare. Therefore, unlike the aforementioned literature, this study focuses on the attentional allocation of riders travelling on various urban road segments and attempts to identify the differences and similarities in the gaze behaviour of riders of PTWs and car drivers while travelling on the same route. For the purposes of this research, the authors decided to first carry out a baseline study in order to understand what riders look at when riding normally on defined road segments, and how their gaze behaviour changes in comparison to drivers.
3. Method
Based on the research hypothesis that riders generally focus on different features of the roadway than drivers, and that these features represent the risks they face within the urban environment, the main objective of this study is to investigate whether this difference in the behaviour of drivers and riders of PTWs can be observed when they are travelling on urban roads. To reach this objective, the study is based on three research questions:
- -
What are the elements of urban road design that riders and car drivers focus on most?
- -
What gaze sequences are performed by drivers and riders, respectively?
- -
How does the gaze behaviour of the two groups of road users differ and how does it affect their behaviour on the road?
In order to answer these research questions, an eye-tracking study was conducted. The method used to collect, elaborate and analyse the data was based on the approach developed in [
10,
25], which was adapted to the needs of this research and is described in detail in the following subsections.
Figure 3 schematically summarises the main steps of the methodology.
3.1. Experimental Design
As shown in
Figure 3, experimental design involves three main tasks, which are explained in the following subsections:
- -
Definition of the route;
- -
Selection of participants;
- -
Preparation of the equipment.
3.1.1. Definition of the Route
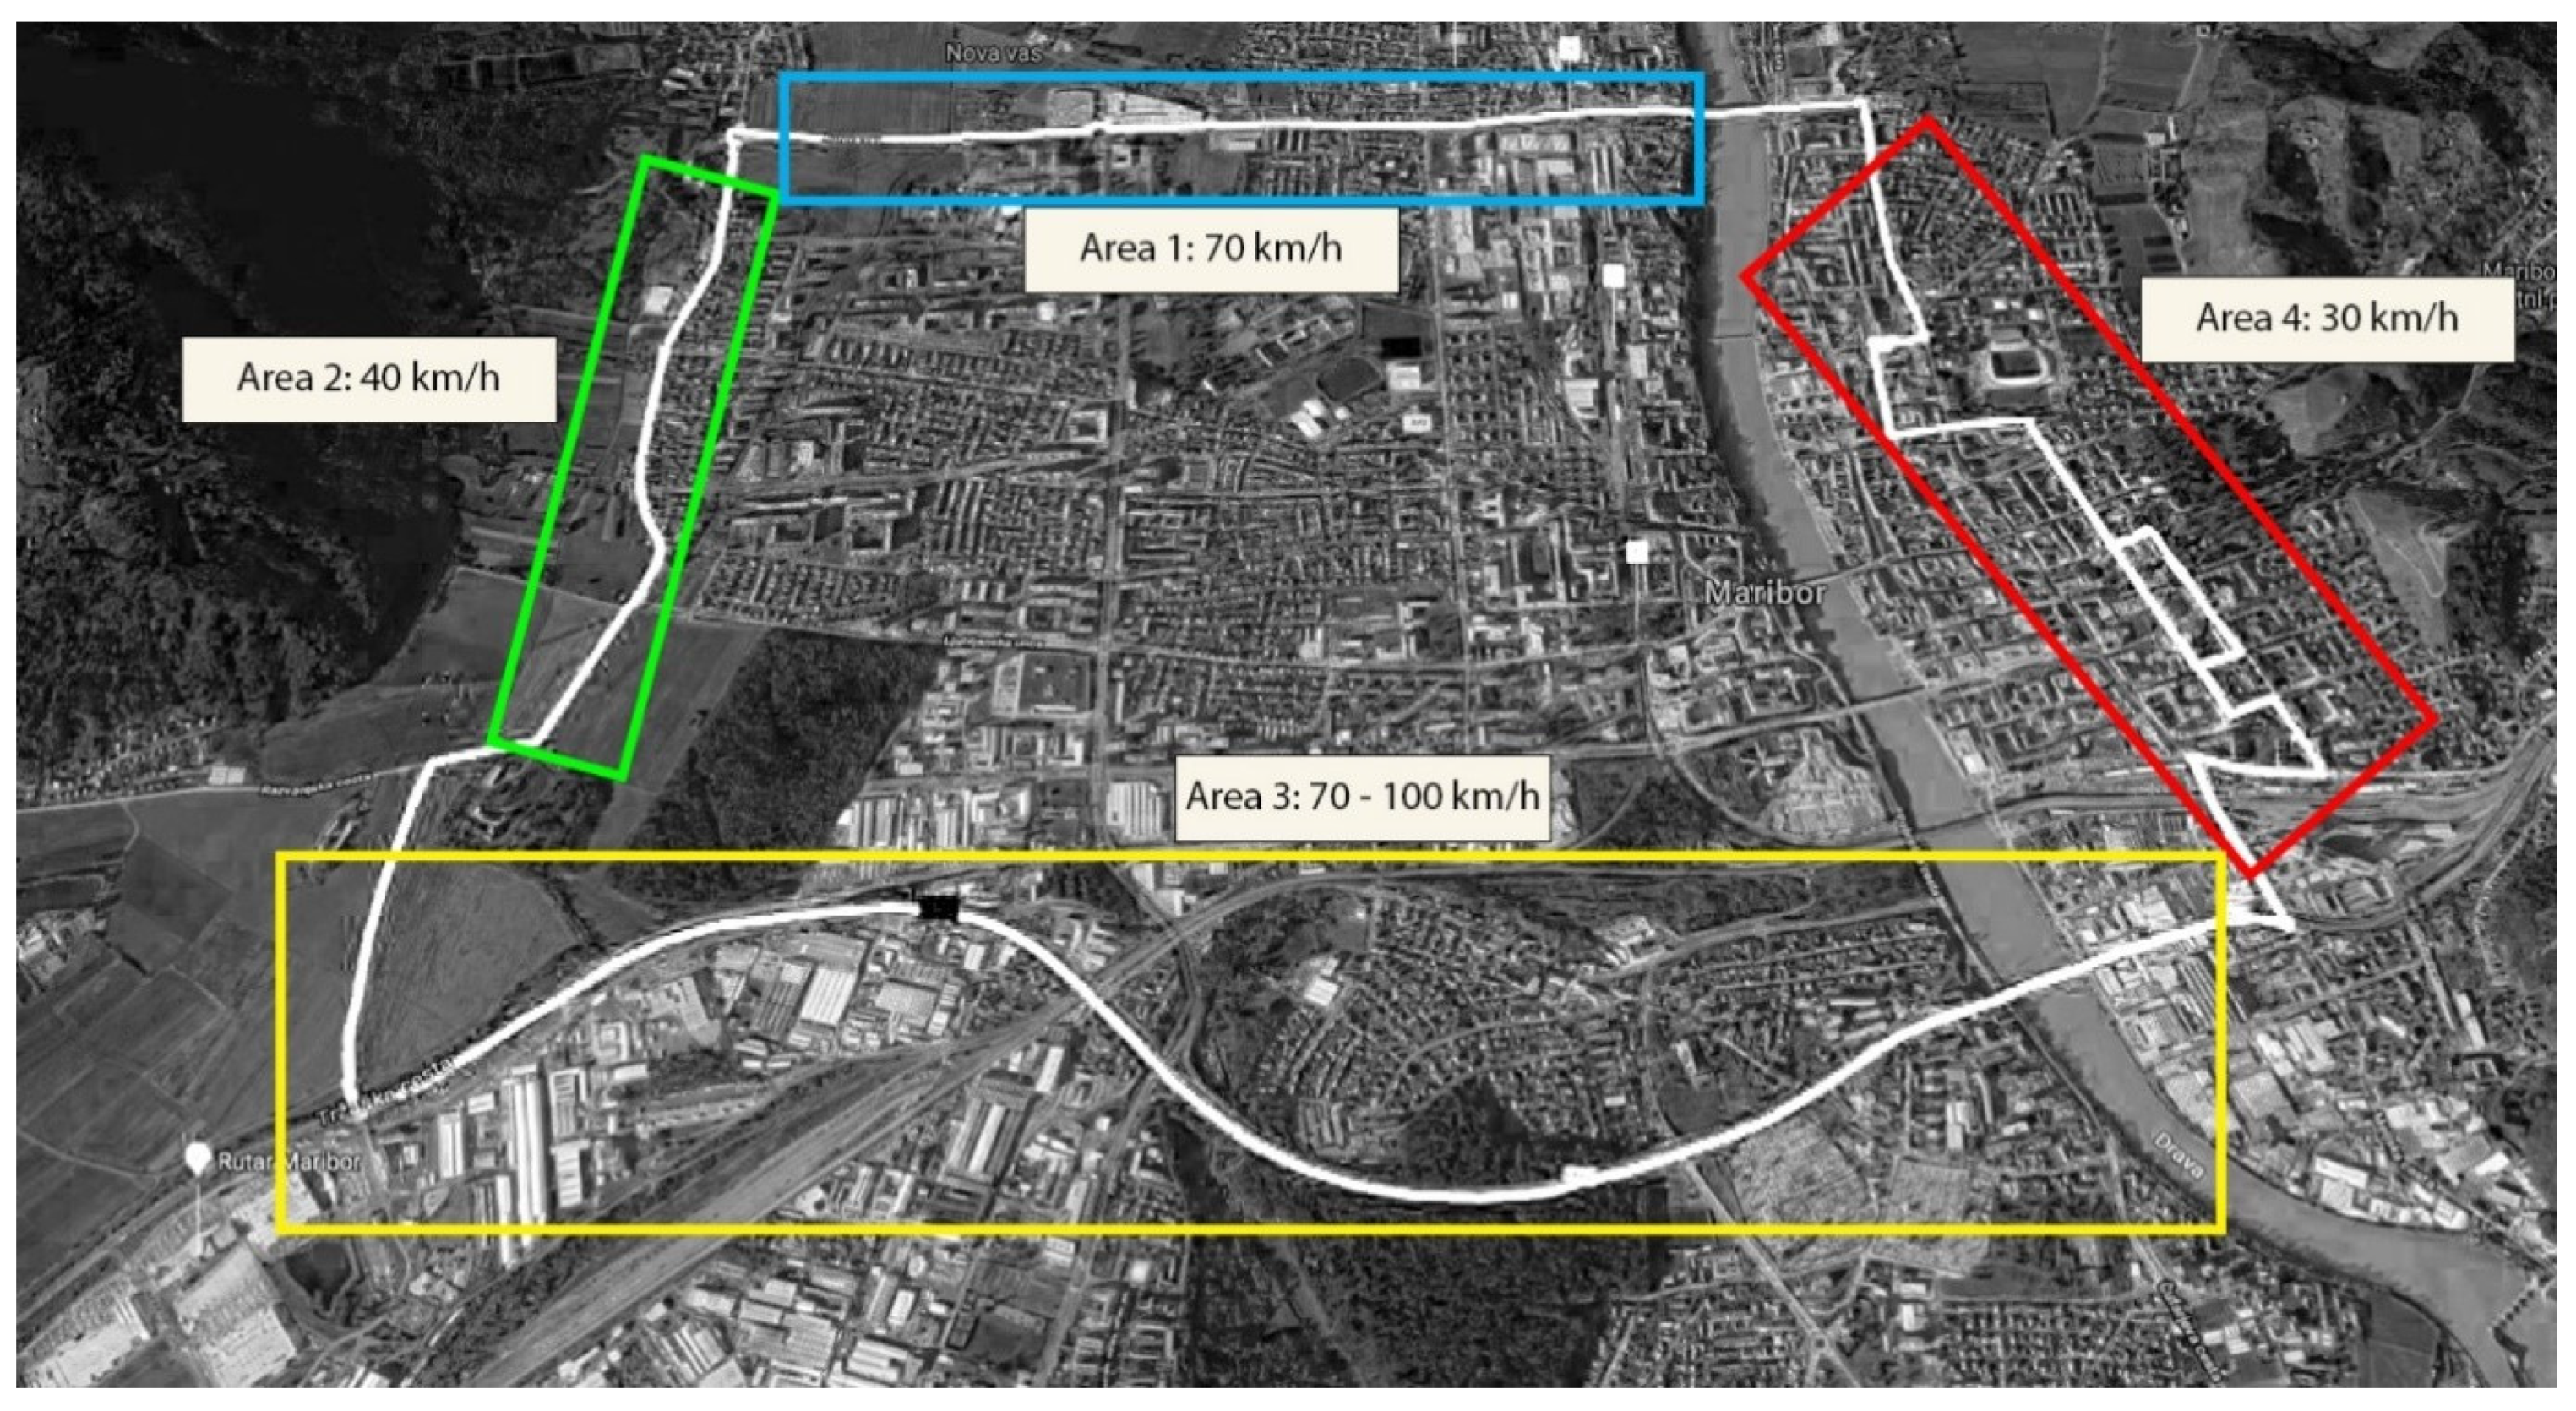
For the purpose of this study, the city of Maribor (Slovenia) was selected. Within the urban area, a 11.7 km-long route (
Figure 4) was chosen along which the participants would travel. The main reason for choosing such a long route was the desire to include different types of roads, which vary in their speed limits, road infrastructure, and traffic arrangements. Thus, four areas (
Figure 4) were identified:
- -
Area 1 is characterised by a speed limit of 70 km/h. The road is a four-lane road where opposite directions are divided by a curbed median. It is intended for all types of road traffic and has a multi-lane carriageway with at-grade intersections with other roads. It consists of five two-lane roundabouts and two traffic lights.
- -
Area 2 has a speed limit of 40 km/h, because it passes through a residential area of the city. The local road is for mixed traffic, it has a two-lane carriageway with level crossings. There is one traffic light intersection, three single-lane roundabouts, and one three-lane intersection without traffic lights in this area. Traffic density is high during peak hours, and the pavement is partially available on only one side.
- -
Area 3 has a higher speed limit of 100 km/h, because it is a motorway. The motorway was designed for motor vehicles with a high degree of safety and comfort at higher speeds, has level-separated intersections with other roads, and a two-lane directional carriageway with a curbed median. This road has a high volume of traffic, with mixed traffic flows and a higher proportion of commercial vehicles. There are three acceleration/deceleration ramps and one tunnel on this road, which has a more constant profile than Area 2.
- -
Area 4 is an area that is part of the city centre where the speed limit is 30 km/h. This area is characterised by numerous potential hazards, and the road infrastructure is very different from the other areas. It consists of eight traffic light intersections and five non-traffic light intersections. There are various different attractions in the area that can distracts drivers’ eyes from the road.
3.1.2. Selection of Participants
All the participants that took part in the experiment were volunteers and, similar to [
22,
26], they were expected to meet the general selection criteria:
- -
Participants had to have adequate and comparable driving experience; thus, participation was limited to individuals with at least 15 years of driving experience.
- -
Participants had to have a class B (car driver) and A (motorcycle driver) driving licence.
- -
Participants were expected to own their own vehicle (car or motorcycle), so as not to alter their behaviour by introducing a new vehicle.
- -
Based on previous experience and in order to avoid bias in the data collected, a poor percentage of data collection, or low accuracy, the following criteria were also added:
- -
Participants were required not to wear glasses, have undergone eye correction, have excessively drooping eyelids, or be wearing heavy makeup.
- -
Restrictions were also placed on helmets: within the six existing types of motorcycle helmets, only modular (‘flip-up’), half, and open-face helmets were allowed. These helmet types allow a larger field of vision.
A total of 10 participants (five car drivers and five motorcycle riders) met all the criteria and were able to participate in the experiment. Of these, six, i.e., the majority, were male, while four were female, and in their 50 s. Although at first sight this different rate may seem unbalanced, it reflects the imbalance between male and female riders, which is also reported in the literature [
12]. In terms of the vehicles, although the models differed from participant to participant, the power was similar, ranging from 86 kW to 112 kW for cars and from 76 kW to 92 kW for motorcycles.
3.1.3. Preparation of the Equipment
During the experiment, Tobii 2 Pro eye-tracking glasses [
27] were used. This device, which can be used to record a user’s gaze behaviour in natural conditions, consists of three main units: the head unit, i.e., the eye-tracking glasses where all the sensors are located; the main unit, which contains the SD card where all the hardware and recordings are stored; and a tablet in which two pieces of software are uploaded. The first piece of software, the Tobii Controller, allowed the eye-tracking recordings to be reviewed in real time and the participant’s gaze to be tracked. The second, the Tobii Analyzer, was used to analyse the recordings and the data.
To accurately use the eye-tracking glasses, calibration and validation steps must be performed for each participant. The first step consists of a single-point calibration: the participant wearing the glasses should stare at a specifically designed calibration card until the software indicates that calibration has been successful. The validation step consists of the participant looking at specific objects in the environment indicated by the researcher to confirm the correct functioning of the equipment. The actual experiment did not begin until after these two steps were performed.
3.1.4. Course of the Experiment
The experiment was conducted on normal weekdays, outside rush hours, which in Slovenia are between 7 am and 9 am, and from 2 pm to 4 pm.
During the experiment, the weather was generally cloudy, so intense sunlight could not affect the eye-tracking sensors, as this would have resulted in a low percentage of data being collected.
During the experiment, each participant was informed of the general goal of the study, which was to understand their behaviour in traffic. No other specific information was given, so as not to affect the participants’ performance. The route was then explained in detail to each participant: each of them was asked to drive the route once, for a total duration of 20 min.
Following the calibration and validation steps, video recording began at the start of each experiment and continued until the moment when the participant returned to the starting point. The elaboration and analysis steps described in the following sections were carried out on the data collected.
3.1.5. Data Elaboration
Once collected, the raw gaze points, i.e., the points on which participants’ eyes focus, should be linked to known elements in order to be further analysed. This process is called mapping and can be performed automatically or manually. It can also be developed by taking an image of the real environment as a reference, or an abstract scheme representing the elements of interest on which gaze points should be labelled. Due to the complexity of the road environment and the constantly changing scenarios, it was decided that a scheme should be defined for the labelling of gaze points, and that manual mapping would be performed to ensure higher accuracy of the data. As shown in
Figure 3, the following four steps led to the elaborated data:
- -
Visual analysis of the video recordings;
- -
Definition of appropriate Areas of Interest (AOI);
- -
Definition of Times of Interest (TOI);
- -
Manual mapping.
First, a rough visual analysis of each video recording was carried out to identify the most recurrent elements of interest. This identification allowed the most appropriate AOI to be defined and considered in the further steps. These areas allowed data to be aggregated based on elements of space. Given the objective of the study, five elements were found to be particularly influential: the carriageway, roadside, traffic signs, road markings, and rear-view mirrors. For each of these elements, an AOI was defined in terms of the sides to which participants could look: left, middle, and right. This led to a total of 15 AOI being identified.
The TOI were also defined. While AOI allow the aggregation of data based on space, TOI allow aggregation based on time. For this study, 17 TOI were defined: one for each of the road sections (four), one for each standard two-lane roundabout (three), one for each standard one-lane roundabout (two), one for each turbo-roundabout (two), one for each four-way intersection (three), one for each T-junction (two), and one for the tunnel.
After defining the AOI and TOI, the manual mapping could be carried out: this step consisted of manually labelling each gaze point relevant to the created scheme.
3.1.6. Data Analysis
The final step of the procedure was data analysis, which relied on both the qualitative and quantitative results of the eye-tracking experiment.
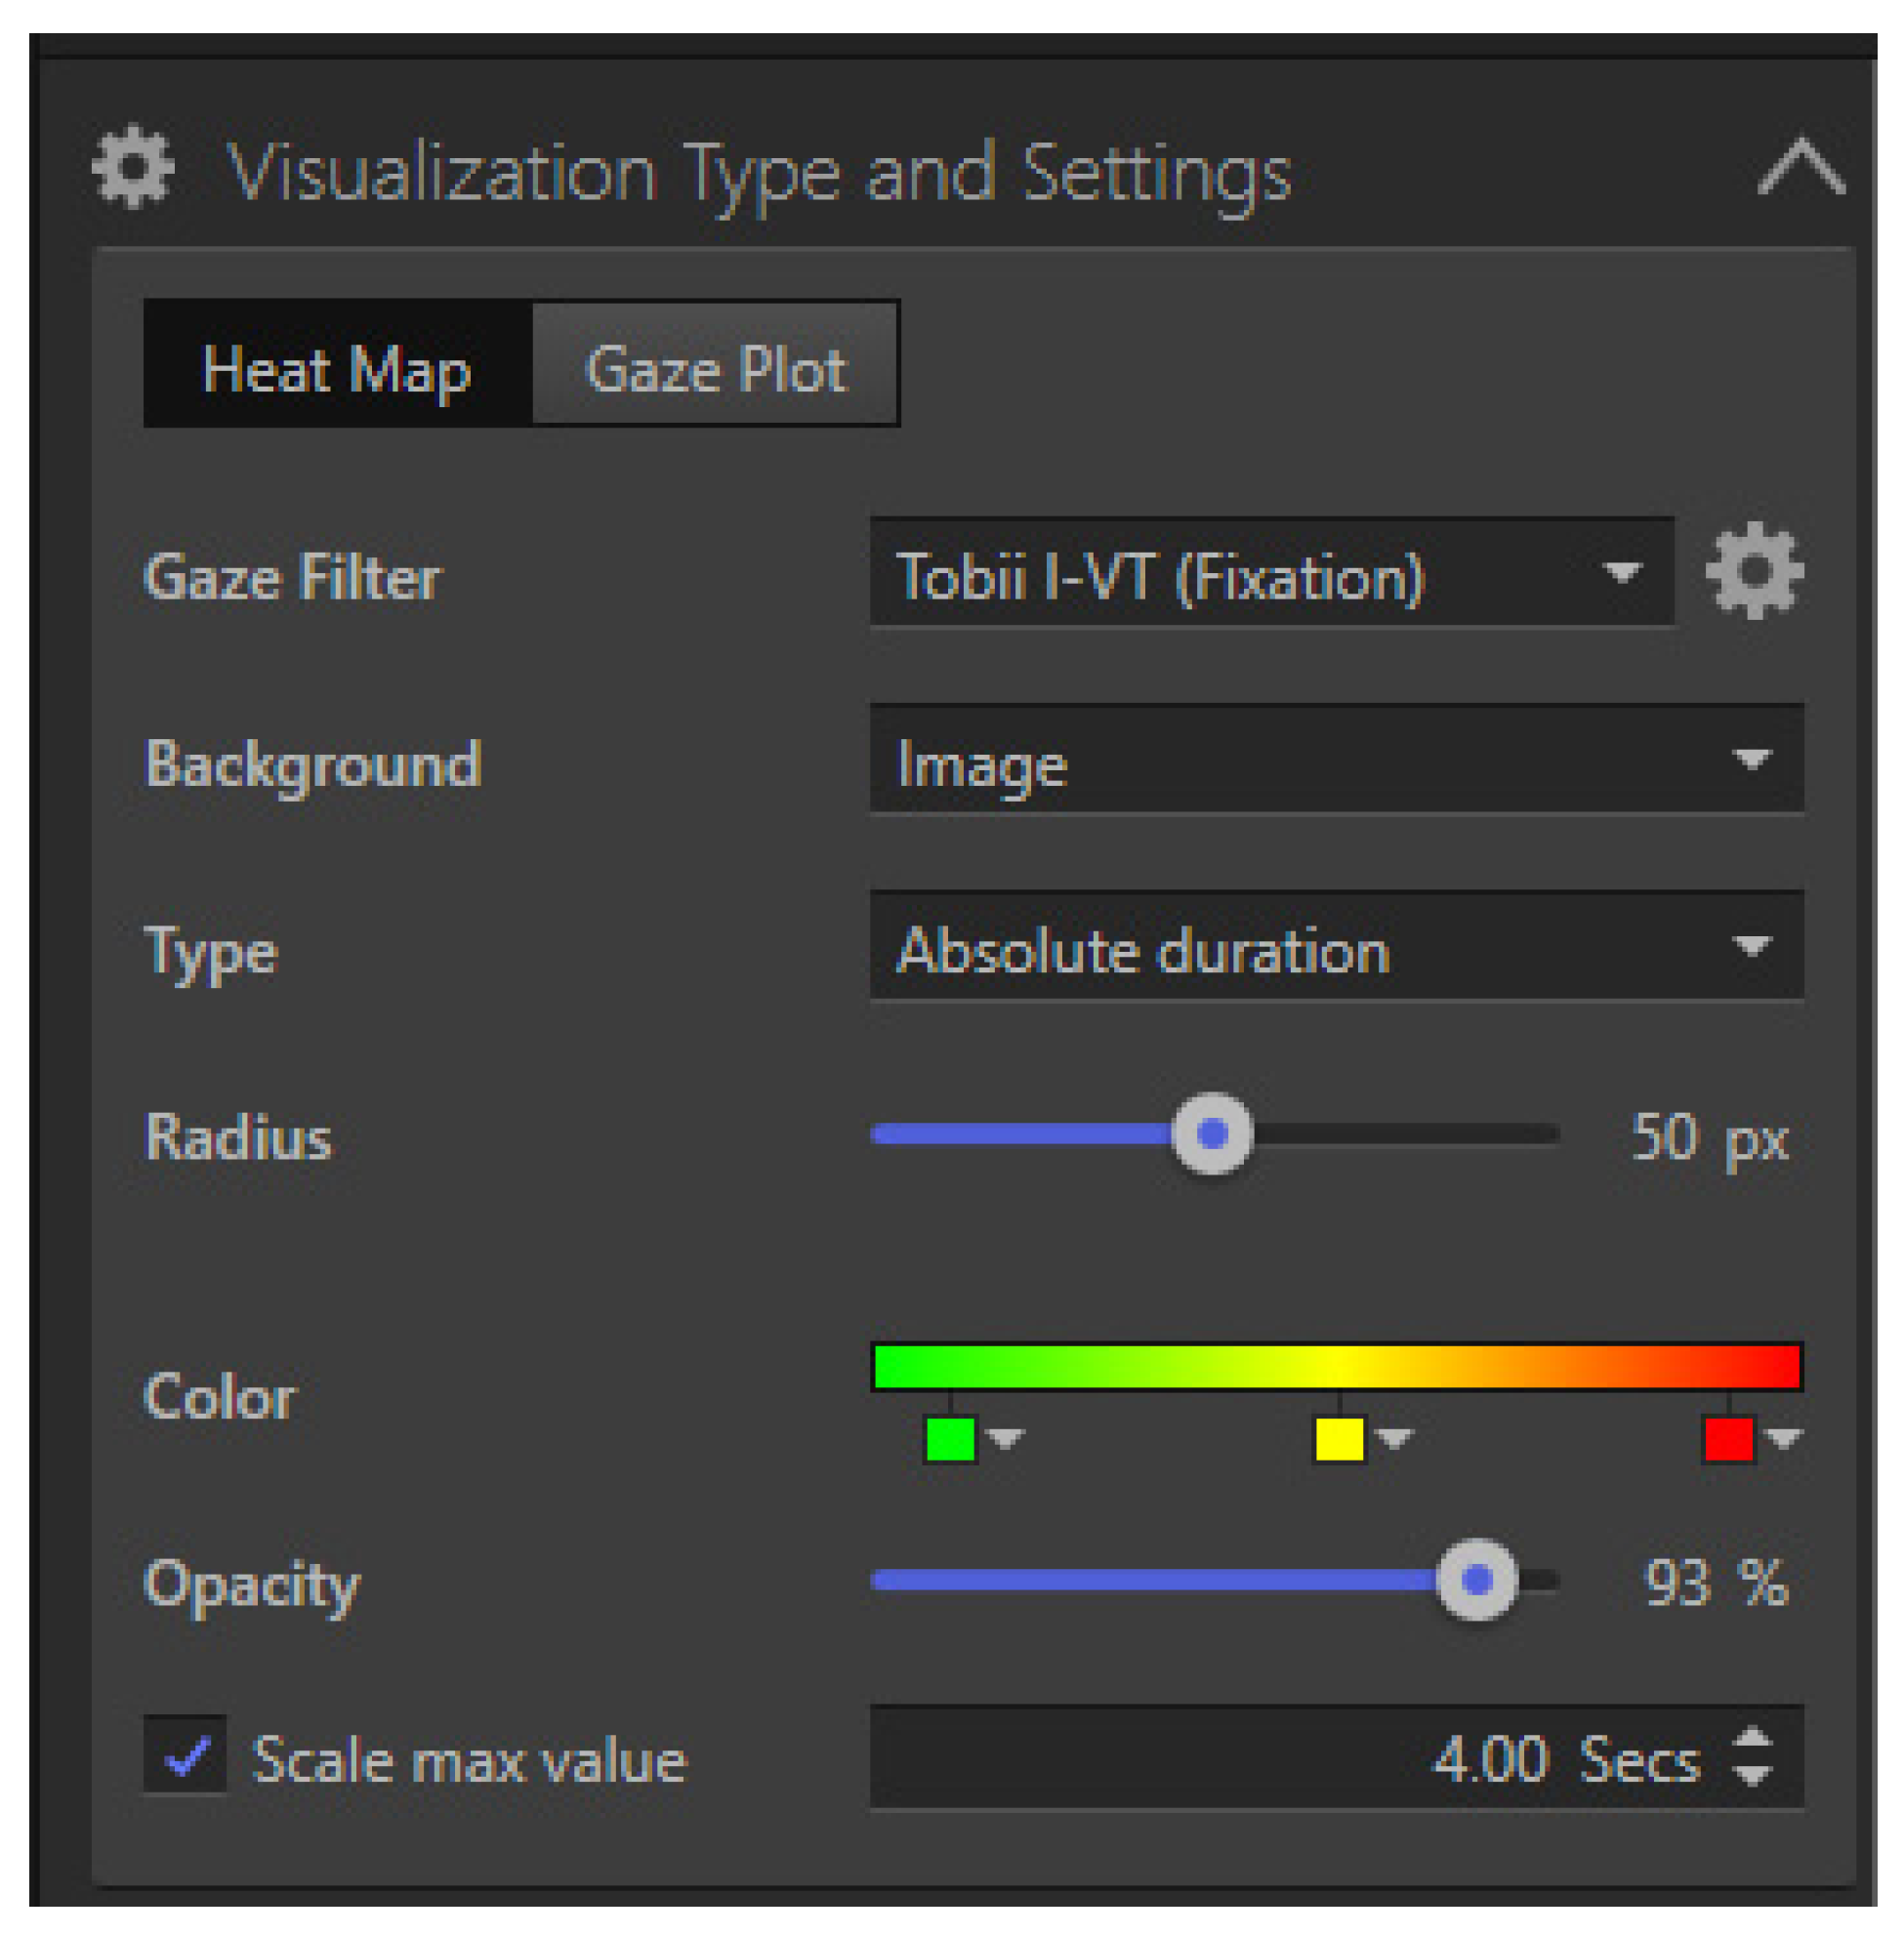
First, the heat maps were analysed. Heatmaps are graphical representations of the number and/or duration of fixations based on a colour scale ranging from red zones, indicating items with a high number/duration of fixations, to green zones, where fixations are lower/shorter. This representation is produced directly within Tobii Pro Lab [
27], by defining the settings illustrated in
Figure 5. As can be seen, the ‘fixation’ was utilised as a filter (there are already two filters within the software, which differ according to their speed threshold) to display hotspots, the AOI were used for the background image, absolute duration was selected as the heatmap type, and 4 s was used as the threshold to display the maximum duration of users’ fixations.
Finally, the quantitative data were analysed. These data were the numerical outputs of the manual mapping and were aggregated based on the defined AOI and TOI. In order to make the results clearer, it is important to point out what fixations are. A fixation is one of the four most applied eye-movements—the remaining ones are saccades, smooth pursuit, and vergence—and it identifies the specific situation when the eye remains stable on a stimulus for a defined period of time. Fixations give information about attention and cognition, and they can be studied on the basis of their number, duration, location and sequence. In this research, the number and duration of fixations were used to provide an insight into drivers’/riders’ attention allocation.
4. Results
This section provides an overview of the results of both the qualitative and preliminary quantitative analysis. The results are divided into two subsections and are described in relation to the four road areas and the six road arrangements that may lead to particular behaviour among road users, i.e., four-way intersections and T-junctions, standard one-lane and two-lane roundabouts, turbo roundabouts, and a tunnel.
4.1. Qualitative Analysis
4.1.1. The Four Road Areas
A first visual analysis of the qualitative eye-tracking outputs provides a comparison of riders’ and drivers’ behaviour in terms of heatmaps (
Figure 6). The heat maps were drawn based on five AOI. Considering the grey label image reported in
Figure 6 and moving in a descending order from top to bottom, these are: carriageway/motor vehicles; roadside; traffic signs; road markings; rear-view mirrors/motorcycle mirrors. These five AOI were then divided into three sub-areas, indicating the centre, left, and right. Here, it should be noted that the choice of AOI highly influenced the results of the experiment. For the purpose of this study, the researchers were particularly interested in the elements of road design and how they affect riders’ attention. Nevertheless, when travelling on the road, there are many other factors that can distract road users, thus explaining some of the less concentrated heatmaps. The first observation was that riders focused their attention on precise elements of the road design, which are the carriageway, mainly the left and straight part; the left-hand side of the road; and the rear-view mirrors. In contrast, drivers paid attention to a number of different elements comprising all the areas of interest considered in this study. Interestingly, lower attention was noted for riders in the third section, while the same observation was made for drivers on the second section of the considered route. This behaviour among riders can be explained by taking into account the type of road in the third section; when travelling in that area, riders were travelling on a motorway. On this kind of road, the arrangement is more homogeneous, riders feel a lower sense of risk and tend to accelerate, focusing mainly on the carriageway ahead.
4.1.2. Roundabouts
As can be seen from the heatmaps in
Figure 7, the major difference at standard one-lane roundabouts was in the distribution of the gaze on the carriageway and on the roadside. In fact, while drivers paid attention to all parts of the carriageway, riders were much more focused straight ahead and on the left-hand side. Similarly, drivers mainly focused on the right-hand side of the road, while riders were more focused on the left-hand side and central part. Finally, while both groups of users looked at the road markings, riders did not fix their gaze on traffic signs. On standard two-lane roundabouts, the behaviour of drivers and riders was quite similar: both looked intensively at all sides of the carriageway, road markings, and rear-view mirrors. In terms of the roadside, drivers were more focused on it than riders, as was the case for traffic signs. In contrast, when negotiating turbo-roundabouts, the behaviour of the two road user groups was quite different: drivers mainly focused their attention on the carriageway and road markings, while riders tended to focus on the carriageway and the rear-view mirrors.
4.1.3. Intersections and Tunnel
Figure 8 compares the heatmaps for drivers and riders at different types of intersections. It is interesting to note how attentive drivers were when travelling at four-way intersections; they looked extensively at each element of the road arrangement. In contrast, riders tended to focus on fewer elements, i.e., the central and left-hand side of the carriageway, traffic signs, rear-view mirrors, and partially the roadside. T-junctions, none of which have any signalisation, seemed to be the least demanding for both kind of users, who both focused their attention on a few elements, i.e., the carriageway, roadside, and road markings. Additionally, in this case, it could be seen that riders directed their focus towards the carriageway, while drivers also took into account other elements of the road design. This particular behaviour by riders could be explained by their interest in avoiding possible encounters with vehicles coming directly from the other side of the intersection. It is a fact that motorcycle riders are much more vulnerable than drivers, since they are not protected by a ‘shell’, and such an encounter can result in tragic consequences. In terms of the tunnel, the behaviour of drivers and riders showed some similarities; both groups identified the carriageway and the rear-view mirrors as the most important elements to look at.
4.2. Quantitative Analysis
4.2.1. Fixation Number and Average Duration
This subsection discusses the characteristics of fixation—number, average duration, and time to the first fixation.
Table 1 summarises the number of fixations that car drivers and riders exhibited on the five considered road elements (carriageway, roadside, traffic signs, road markings, and mirrors) when driving in the four road areas considered in the study. First, it could be observed that for both groups of road users, the majority of the fixations were on the carriageway, with a noticeably higher number of fixations on the left-hand side of the carriageway among riders. Riders also focused heavily on the roadside, especially the left-hand side. When comparing the number of fixations in relation to the four areas, it could be noted that both drivers and riders did not pay much attention to the roadside in area 3, while the number of fixations was considerable in the three remaining areas. Additionally, area 3 showed the fewest number of fixations among riders who were concentrating on a few elements of the road, i.e., the carriage (left-hand side and straight ahead), mirrors, road markings, and roadside, in contrast to drivers who looked at all the considered AOI.
Considering the results for the six road arrangements (
Table 2), it could be seen that both groups of road users had the highest number of fixations on the carriageway and the roadside, followed by the road markings. Riders mainly focused on the carriageway when driving on standard one-lane and two-lane roundabouts and through the tunnel, while there was a significant difference in the number of fixations between the two groups for turbo-roundabouts and T-junctions. In this case, drivers had a higher number of fixations on the carriageway. However, as can be seen in
Figure 7 and
Figure 8, drivers tended to look at the entire carriageway (left-hand side, straight ahead, and right-hand side), while riders focused on the road ahead.
Moreover, both drivers and riders looked at road markings, while the same was not observed for vertical traffic signs, which may lead to the conclusion that road markings are more effective for both groups of users. Interestingly, the level of attention to traffic signs was higher at intersections, while road markings were more observed at roundabouts. Finally, it is notable that mirrors were generally used more frequently by riders than by drivers, although the latter were particularly likely to use them at four-way intersections. Taking a closer look at
Table 2, it could be observed that both groups of road users showed a peak in fixations on the straight section of the carriageway. However, this trend was much more pronounced for riders at standard two-lane roundabouts and in the tunnel. For all infrastructure types, the number of fixations of riders on the left-hand side of the carriageway was higher or the same, except for T-junctions, where drivers concentrated more than riders on each of the road elements considered. This fact could be explained by the major interest of riders in avoiding collisions with oncoming vehicles of the counterflow; indeed, previous findings have shown they mainly look at the carriageway ahead. As far as the roadside is concerned, it was noted that drivers usually paid more attention to it than riders, although the left-hand side of road was also of interest to riders, especially at standard one-lane roundabouts and four-way intersections.
Some consideration should be given to the average duration of fixations. The number of fixations alone is not entirely meaningful without knowing their duration, i.e., it may be that a group of users has more, albeit shorter, fixations, or, on the contrary, a lower number of longer fixations. This occurred with respect to the AOI mirror in the case of riders (
Figure 9). As can be seen from
Figure 9, the duration of riders’ fixation on rear-view mirrors was longer than for car drivers on three different road types, and was comparable on two. The carriageway fixation durations had comparable values for both types of road users, while there was a considerable difference in fixation duration in terms of traffic signs and road markings, on which car drivers fixated considerably more. Looking at the duration of riders’ fixations, it can be concluded that the two elements that attracted their attention the most were the carriageway and mirrors.
4.2.2. Average Driving/Riding Speed
Table 3 and
Table 4 illustrate the average speeds for drivers and riders in the different road areas (
Table 3) and the considered intersections (
Table 4). It is important to note that, in general, car drivers travel faster than riders, both considering a single element or an entire segment of the road. Comparing the gaze behaviour to the speed recorded in the different areas, it was observed that the areas with a higher number of fixations were those where both road users travelled at lower speeds. This is to be expected, since these areas—1, 2, and 4—have a more varied road design.
Focusing on the single intersection types (
Table 4), it could be observed that both drivers and riders usually travelled at speeds lower than 30 km/h, wherein riders were even more attentive than drivers. This speed limit is undoubtedly a result of the road layout, since the speed of both groups was much higher through the tunnel (it is the only element of the entire route on which riders travelled faster than drivers). This finding is also quite interesting when considering the safety of other vulnerable road users; as largely demonstrated in the literature, speeds lower than 30 km/h result in lower injuries to pedestrians, cyclists, and riders of PTWs when involved in a collision.
5. Discussion and Conclusions
Understanding the performance and gaze behaviour of riders of PTWs is very important for both road designers and road safety officials. Riders have significantly different road performance characteristics than drivers, meaning that certain manoeuvres and road conditions pose a higher risk to riders than drivers. In the process of road and intersection design, road designers should always consider the expectations of road users, and among them riders of PTWs. The definition of drivers’ and riders’ gaze locations could help them to find suitable road equipment and countermeasures, which would encourage drivers to slow down and riders to detect risky elements, while being safe for all road users, including riders of PTWs. Understanding the different performance and gaze behaviour of riders is also extremely important for road safety auditors and inspectors. The discovery of dangerous situations and locations for PTW riders in the design phase is a key component of road safety audits. In addition, the discovery of such locations on existing roads is a central issue of road safety inspections. Additionally, the analysis of gaze behaviour and attention allocation can be very influential during in-depth investigations of the causes of motorcycle accident. In this study, the gaze behaviour of riders and car drivers in real-world environments was analysed and compared using a visual analysis approach. The study was conducted in four different urban areas with different real-world traffic environments, traffic arrangements, and speed limits, and participants’ attention allocation was analysed on the carriageway, roadside, traffic signs, road markings, and rear-view mirrors.
In general, it can be stated that there is a difference in the gaze behaviour of riders and drivers, and this difference depends on the traffic layout of the roads on which they are travelling.
By summarising the number of fixations of drivers and riders on the five considered road elements (carriageway, roadside, traffic signs, road markings, and mirrors), it could be observed that for both groups of road users the majority of fixations were on the carriageway, with the number of fixations on the left-hand side of the roadway being significantly higher for riders. Riders also focused heavily on the roadside, especially on the left-hand side.
Looking at the results for the six road layouts, it appeared that both drivers and riders had the most fixations on the carriageway and roadside, followed by road markings. Riders mainly fixated on the carriageway when travelling on standard one- and two-lane roundabouts and through the tunnel, while there was a significant difference in the number of fixations between the two groups for turbo-roundabouts and T-junctions. In this case, drivers fixated more often on the carriageway. However, drivers were more likely to look at the entire carriageway (left, straight ahead, and right), while riders focused on the road in front of them. Moreover, both drivers and riders looked at road markings, while the same was not observed for vertical traffic signs, which could lead to the conclusion that road markings are more effective for both groups of road users. Interestingly, the level of attention to traffic signs was higher at intersections, while road markings were more observed at roundabouts. Finally, mirrors were generally used more frequently by riders than by drivers, although the latter used them particularly frequently at four-way intersections.
Since the number of fixations alone is not totally meaningful, some consideration should also be given to the average duration of fixations. The duration of fixation on the rear-view mirror was generally longer for riders than for car drivers. Fixation duration on the carriageway showed comparable values for both types of road users, while there was a consistent difference in fixation duration in terms of traffic signs and road markings, which was much higher for car drivers.
Finally, some limitations of the study should be pointed out. First, one of the limitations of eye-tracking equipment is that this type of technology is not able to record the elements seen by participants through their peripheral vision. However, in this study, where riders’ sight was limited by their helmets, this restraint did not greatly affect the results. In addition, due to the limited number of participants, it was not possible to statistically test the samples of the two types of road users. Nevertheless, as mentioned above, the reported results are part of a preliminary analysis that is the starting point for further research. For future studies in this area, the authors will include a higher number of participants. In addition, different age groups with various durations of holding a driving licence will be considered in order to understand the reactions of drivers with different levels of experience to various road conditions. The influence of different types of motorcycles on riders’ gaze behaviour will also be investigated. To gather more information, the eye-tracking technology will be supported by surveys in future, in order to obtain both objective and subjective information from the participants and to provide more in-depth explanations for the behaviour observed. The ultimate goal is to obtain a comprehensive analysis of riders’ behaviour and perception on a variety of urban and extra-urban road arrangements, so that specific road safety measures tailored to the needs of motorcycle riders can be proposed. It could also be interesting to link gaze and crash data locations. This task was not carried out in this research for various reasons. First, though Slovenia has a very large and informative database about road accidents, crash data in urban areas are normally linked to the nearest house number, and this generates errors in the identification of the real location of the crash. Second, the aim of the study was to understand what riders/drivers look at when travelling on different road segments, and not to link their gaze behaviour to crash locations. This gap, however, could be bridged in further research.
Author Contributions
Conceptualisation, T.T., M.M. and C.G.; methodology, T.T., M.M. and C.G.; software, M.M.; validation, T.T. and M.M.; formal analysis, T.T., M.M. and C.G.; investigation, T.T. and M.M.; resources, T.T.; data curation, M.M. and C.G.; writing—original draft preparation, T.T. and C.G.; writing—review and editing, T.T., M.M. and C.G.; visualisation, M.M.; supervision, T.T. and C.G.; project administration, T.T.; funding acquisition, T.T. All authors have read and agreed to the published version of the manuscript.
Funding
This research was co-funded by the Slovenian Research Agency (ARRS) in the framework of the research programme: Development, modelling and optimization of structures and processes in civil engineering and traffic P2-0129 (A).
Institutional Review Board Statement
The study was conducted according to the guidelines of the Declaration of Helsinki and approved by the Ethics Committee of the Faculty of Civil Eng, Transportation Eng. and Architecture of the University of Maribor (protocol code: 001-TT/2021; date of approval: 17 December 2021).
Informed Consent Statement
Informed consent was obtained from all subjects involved in the study.
Data Availability Statement
Data are available on request due to privacy restrictions.
Conflicts of Interest
The authors declare no conflict of interest.
References
- Šraml, M.; Tollazzi, T.; Renčelj, M. Traffic safety analysis of powered two-wheelers (PTWs) in Slovenia. Accid. Anal. Prev. 2012, 49, 36–43. [Google Scholar] [CrossRef] [PubMed]
- Hurt, H.H.; Ouellet, J.V.; Thom, D.R. Motorcycle Accident Cause Factors and Identification of Countermeasures; Technical Report; Traffic Safety Center, University of Southern California: Los Angeles, CA, USA, 1981; Volume 1. [Google Scholar]
- Diamantopoulou, K.; Brumen, I.; Dyte, D.; Cameron, M. Analysis of Trends in Motorcycle Crashes in Victoria; Report No 84; Monash University Accident Research Centre: Melbourne, Australia, 1995. [Google Scholar]
- European Commission. Powered Two Wheelers; European Commission, Directorate General for Transport: Brussels, Belgium, 2015. [Google Scholar]
- European Commission. Traffic Safety Basic Facts on Motorcycles & Mopeds; European Commission, Directorate General for Transport: Brussels, Belgium, 2016. [Google Scholar]
- Dekra. Dekra Road Safety Report 2020. Mobility on Two Wheels. Steps towards Making Vision Zero a Reality. Available online: https://www.dekra.com/media/dekra-evs-report-2020-en-201005.pdf (accessed on 17 January 2022).
- Javna Agencija Republike Slovenije za Varnost Prometa. Pregled Stanja Varnosti v Cestnem Prometu za Leto 2020. Report. Available online: https://www.avp-rs.si/wp-content/uploads/2021/03/analiza-in-pregled-stanja-varnosti-cestnega-prometa-v-letu-2020.pdf (accessed on 17 January 2022).
- Javna Agencija Republike Slovenije za Varnost Prometa. Zemljevid Prometnih Nesreč. Available online: http://nesrece.avp-rs.si/ (accessed on 17 January 2022).
- Topolšek, D.; Areh, I.; Cvahte Ojsteršek, T. Examination of driver detection of roadside traffic signs and advertisements using eye-tracking. Transp. Res. Part F Traffic Psychol. Behav. 2016, 43, 212–224. [Google Scholar] [CrossRef]
- Gruden, C.; Otković, I.I.; Šraml, M. Pedestrian safety at roundabouts: Their crossing and glance behavior in the interaction with vehicular traffic. Accid. Anal. Prev. 2021, 159, 106290. [Google Scholar] [CrossRef] [PubMed]
- Lobjois, R.; Siegler, I.S.; Mars, F. Effects of visual roll on steering control and gaze behavior in a motorcycle simulator. Transp. Res. Part F 2016, 38, 55–66. [Google Scholar] [CrossRef]
- Hosking, S.G.; Liu, C.C.; Bayly, M. The visual search patterns and hazard responses of experienced and inexperienced motorcycle riders. Accid. Anal. Prev. 2010, 42, 196–202. [Google Scholar] [CrossRef] [PubMed]
- Bellinger, D.B.; Budde, B.M.; Machida, M.; Richardson, G.B.; Berg, W.P. The effect of cellular telephone conversation and music listening on response time in braking. Transp. Res. Part F Traffic Psychol. Behav. 2009, 12, 441–451. [Google Scholar] [CrossRef]
- De Waard, D.; Schepers, P.; Ormel, W.; Brookhuis, K. Mobile phone use while cycling: Incidence and effects on behavior and safety. Ergonomics 2010, 53, 30–42. [Google Scholar] [CrossRef] [Green Version]
- Foulsham, T.; Walker, E.; Kingstone, A. The where, what and when of gaze allocation in the lab and the natural environment. Vis. Res. 2011, 51, 1920–1931. [Google Scholar] [CrossRef] [PubMed]
- Kapitaniak, B.; Walczak, M.; Kosobudzki, M.; Jozwiak, Z.; Borkiewicz, A. Application of eye-tracking in the testing of drivers: A review of research. Int. J. Occup. Med. Environ. Health 2015, 28, 941–954. [Google Scholar] [CrossRef] [PubMed] [Green Version]
- Fotios, S.; Uttely, J.; Cheal, C.; Hara, N. Using eye-tracking to identify pedestrians’ critical visual tasks, Part 1. Dual Task approach. Lighting Res. Technol. 2015, 47, 133–148. [Google Scholar] [CrossRef] [Green Version]
- Fotios, S.; Uttely, J.; Cheal, C.; Hara, N. Using eye-tracking to identify pedestrians’ critical visual tasks, Part 2. Dual Task approach. Lighting Res. Technol. 2015, 47, 149–160. [Google Scholar] [CrossRef] [Green Version]
- Trefzeger, M.; Blascheck, T.; Raschke, M.; Hausmann, S.; Schlegel, T. A visual comparison of gaze behavior from pedestrians and cyclists. In Proceedings of the ETRA, 2018 ACM Symposium on Eye Tracking Research & Applications, Warsaw, Poland, 14–17 June 2018. [Google Scholar]
- Christoforou, Z.; Yannis, G.; Golias, J.; Saleh, P. PTW Crashes and the Role of Perception. In Increasing Motorcycle Conspicuity. Design and Assessment of Interventions to Enhance Rider Safety; Ashgate Publishing, Ltd.: Farnham, UK, 2015. [Google Scholar]
- Di Stasi, L.L.; Candido, A.; Canas, J.J.; Catena, A. Behavioral and eye-movement measures to track improvements in driving skills of vulnerable road users: First-time motorcycle riders. Transp. Res. Part F 2011, 14, 26–35. [Google Scholar] [CrossRef]
- Lemonakis, P.; Misokefalou, E.; Koroni, M.; Eliou, N. Recording and Evaluating Riders’ Gaze Behavior in Rural Roads. Available online: https://smarter-usa.org/wp-content/uploads/2020/10/Recording-and-Evaluating-Motorcyclists-Gaze-Behaviour-in-Rural-Roads.pdf (accessed on 15 December 2021).
- Topolšek, D.; Dragan, D. Behavioural comparison of drivers when driving a motorcycle or a car: A structural equation modelling study. Promet 2015, 27, 457–466. [Google Scholar] [CrossRef] [Green Version]
- Ding, C.; Rizzi, M.; Strandroth, J.; Sander, U.; Lubbe, N. Motorcyclist injury risk as a function of real-life crash speed and other contributing factors. Accid. Anal. Prev. 2019, 123, 374–386. [Google Scholar] [CrossRef] [PubMed]
- Gruden, C.; Otković, I.I.; Šraml, M. Safety analysis of young pedestrian behavior at signalized intersections: An eye-tracking study. Sustainability 2021, 13, 4419. [Google Scholar] [CrossRef]
- Topolšek, D.; Dragan, D. Relationships between the riders’ behavioural perception and their actual behaviour. Transport 2018, 1, 151–164. [Google Scholar] [CrossRef] [Green Version]
- Tobii Pro Glasses 2 Wearable Eye Tracker. Available online: https://www.tobiipro.com/product-listing/tobii-pro-glasses-2/ (accessed on 14 December 2021).
| Publisher’s Note: MDPI stays neutral with regard to jurisdictional claims in published maps and institutional affiliations. |
© 2022 by the authors. Licensee MDPI, Basel, Switzerland. This article is an open access article distributed under the terms and conditions of the Creative Commons Attribution (CC BY) license (https://creativecommons.org/licenses/by/4.0/).


