1. Introduction
Aspergillus niger is used in industrial fermentation for production in several industrial fields, including the food industry. It is used to produce extracellular (food) enzymes, citric acid, for biotransformation and in waste treatment. However,
A. niger is a serious plant pathogen and produces many mycotoxins (e.g., ochratoxins and aflatoxins) that contaminant foodstuffs (e.g., groundnut, maize, onion, etc.). Furthermore,
A. niger causes rotting of vegetables and fruits and causes substantial losses to the economy and agriculture products [
1,
2,
3,
4,
5]. The fungus reduces seed germination, seedling emergence, and root and shoot elongation, causing mortality at the point of plant emergence [
6].
Fungal pathogenicity is related to the mechanism of mycotoxin effect; it allows the fungus to invade the tissue environment and boosts the host’s defense lytic activity. Proteinases, lipases, and phospholipases are among the hydrolytic enzymes produced by fungi in culture conditions. These enzymes have a role in fungal pathogenesis and harm the host cells. Fungal nutritional absorption, tissue invasion, and nutrient delivery in a confined environment are all aided by these enzymes [
7].
Induced chemical mutation is a technique for creating genetic variation in phytopathogens those results in new strains with varied traits. Induced mutations can be used to provide a new source of resistance to biotic and abiotic stress factors. This enables the creation of new resistant varieties [
8,
9]. Treatment with chemical mutagens can enhance physiological behavior in many plants (e.g., wheat, broad bean) [
10].
The chemical mutagen sodium azide (NaN
3) is one of the most potent mutagens in many phytopathogens. It is used because it is simple and cheap, and it produces mutations that enhance their characteristics. The efficiency of mutant production is influenced by several factors, including azide concentration and treatment time. It causes point mutations and chromosome damage, resulting in plant tolerance to a variety of adverse conditions [
8]. At low doses, sodium azide is cytotoxic in a variety of animal and plant systems, inhibiting protein synthesis and replicative DNA synthesis. It has been utilized as a positive control in various systems since it is mutagenic in bacteria, fungi, higher plants, and human cells [
9].
The initial goal of the study was to study how mutagens affect fungal growth and physiology (
Figure 1). The second goal was to investigate how mutant and control
A. niger strains affect specific plants (e.g., maize grains and onion seeds).
4. Discussion
The main purpose of choosing A. niger for this study is that it produces organic acids, enzymes, plant growth regulators, mycotoxins, and antibiotics. Under normal conditions, A. niger may create certain enzymes and is a prolific exporter of homologous protein species.
Pathogenic fungi secrete enzymes which are integral to their pathogenesis. The
A. niger group is composed of black-spored
Aspergillus species. The spores are responsible for secretion of several secondary metabolites, known as mycotoxins.
A. niger is widely distributed in many habitats; it has not only been isolated from host cells but was recognized and isolated from space [
18]. Molecular identification was used to define
A. niger isolates collected from U.S. segment surfaces of the International Space Station. According to Shankar [
3] and Zohri et al. [
7], the fungal secretions are virulent factors of fungi to facilitate the adherence and hydrolysis of the components of the cells of the host. Schuster et al. [
1] examined the idea that
A. niger strains produce mycotoxins (e.g., aflatoxins, ephrotoxic and carcinogenic mycotoxin ochratoxin A). They suggested that these toxins were produced under uncontrolled storage conditions for
A. niger. In addition, [
2] demonstrated that
A. niger isolates are responsible for production of mycotoxins that affect food grade enzymes. Soares et al. [
19] reported the infection of maize with
A. niger which produced fumonisin B2 and ochratoxin A, while [
20] found that mycotoxins, such as ochratoxins, could be isolated from grapes infected by
A. niger and
A. carbonarius strains.
In this study, spore count, and fungal growth were negatively affected as mutagen concentration increased. Fungal spores are important as causes of disease, pollution, and as biological warfare agents. Dijksterhuis and Samson [
21] demonstrated that spores have several advantages over their vegetative counterparts. Spores have unique characteristics, such as tolerance to extreme temperatures, poisonous chemicals, desiccation, and radiation, among others. So, in this study it was essential to estimate the spore count to evaluate any changes due to exposure to mutation. The germination and count of spores varied in response to mutation according to this study.
Kumar and Parikh [
22] suggested that change in fungal growth diameter could be explained as a result of chemical mutagens causing the production of cellulose-degrading enzymes and inhibiting extracellular protein production in fungi which inhibits fungal cell wall formation.
To prevent spore germination, sodium azide was added to the bioconversion medium. Spores could be used as a catalyst in the bioconversion of glucose to gluconic acid because of these treatments [
23]. Sodium azide, either as the free acid HN
3, or as an ionic compound, binds metal sites in enzymes. The azide anion acts as a reversible or irreversible inhibitor of catalytic hemoproteins, such as catalase and horseradish peroxidase, in various situations. In previous studies, sodium azide was used as the bioconversion medium. Its effect on the enzyme was compared to that of commercial glucose oxidase because it was found to be toxic. When sodium azide was added to the bioconversion medium containing commercial glucose oxidase, 50% of the activity was lost when compared to the control [
23]. As a result, sodium azide was discovered to be a glucose oxidase enzyme inhibitor. There have been reports that sodium azide inhibits peroxidase and laccase [
24,
25]. With
A. niger, a sodium azide mutagen was used; [
26] worked on
A. niger mutants to increase glucose oxidase enzyme production.
For the physiological parameters, this study showed that mutation causes variation in responses and indicated that a concentration of 40 µM sodium azide has a better response rather than the other two concentrations. These findings could be explained by [
27,
28,
29] who concluded that many enzymes, including invertase and galactosidase, are found in
Aspergillus spp. Aflatoxigenic and probable aflatoxin makers,
Aspergillus spp., infect maize, peanuts, and tree nuts. Chemical (sodium azide, ethyl methane sulphonates, and nitrous acid) and physical (ultraviolet radiation) mutagens have a significant impact on them. Aflatoxigenic fungi contaminate food, hence mutation can be utilized to eliminate this impact.
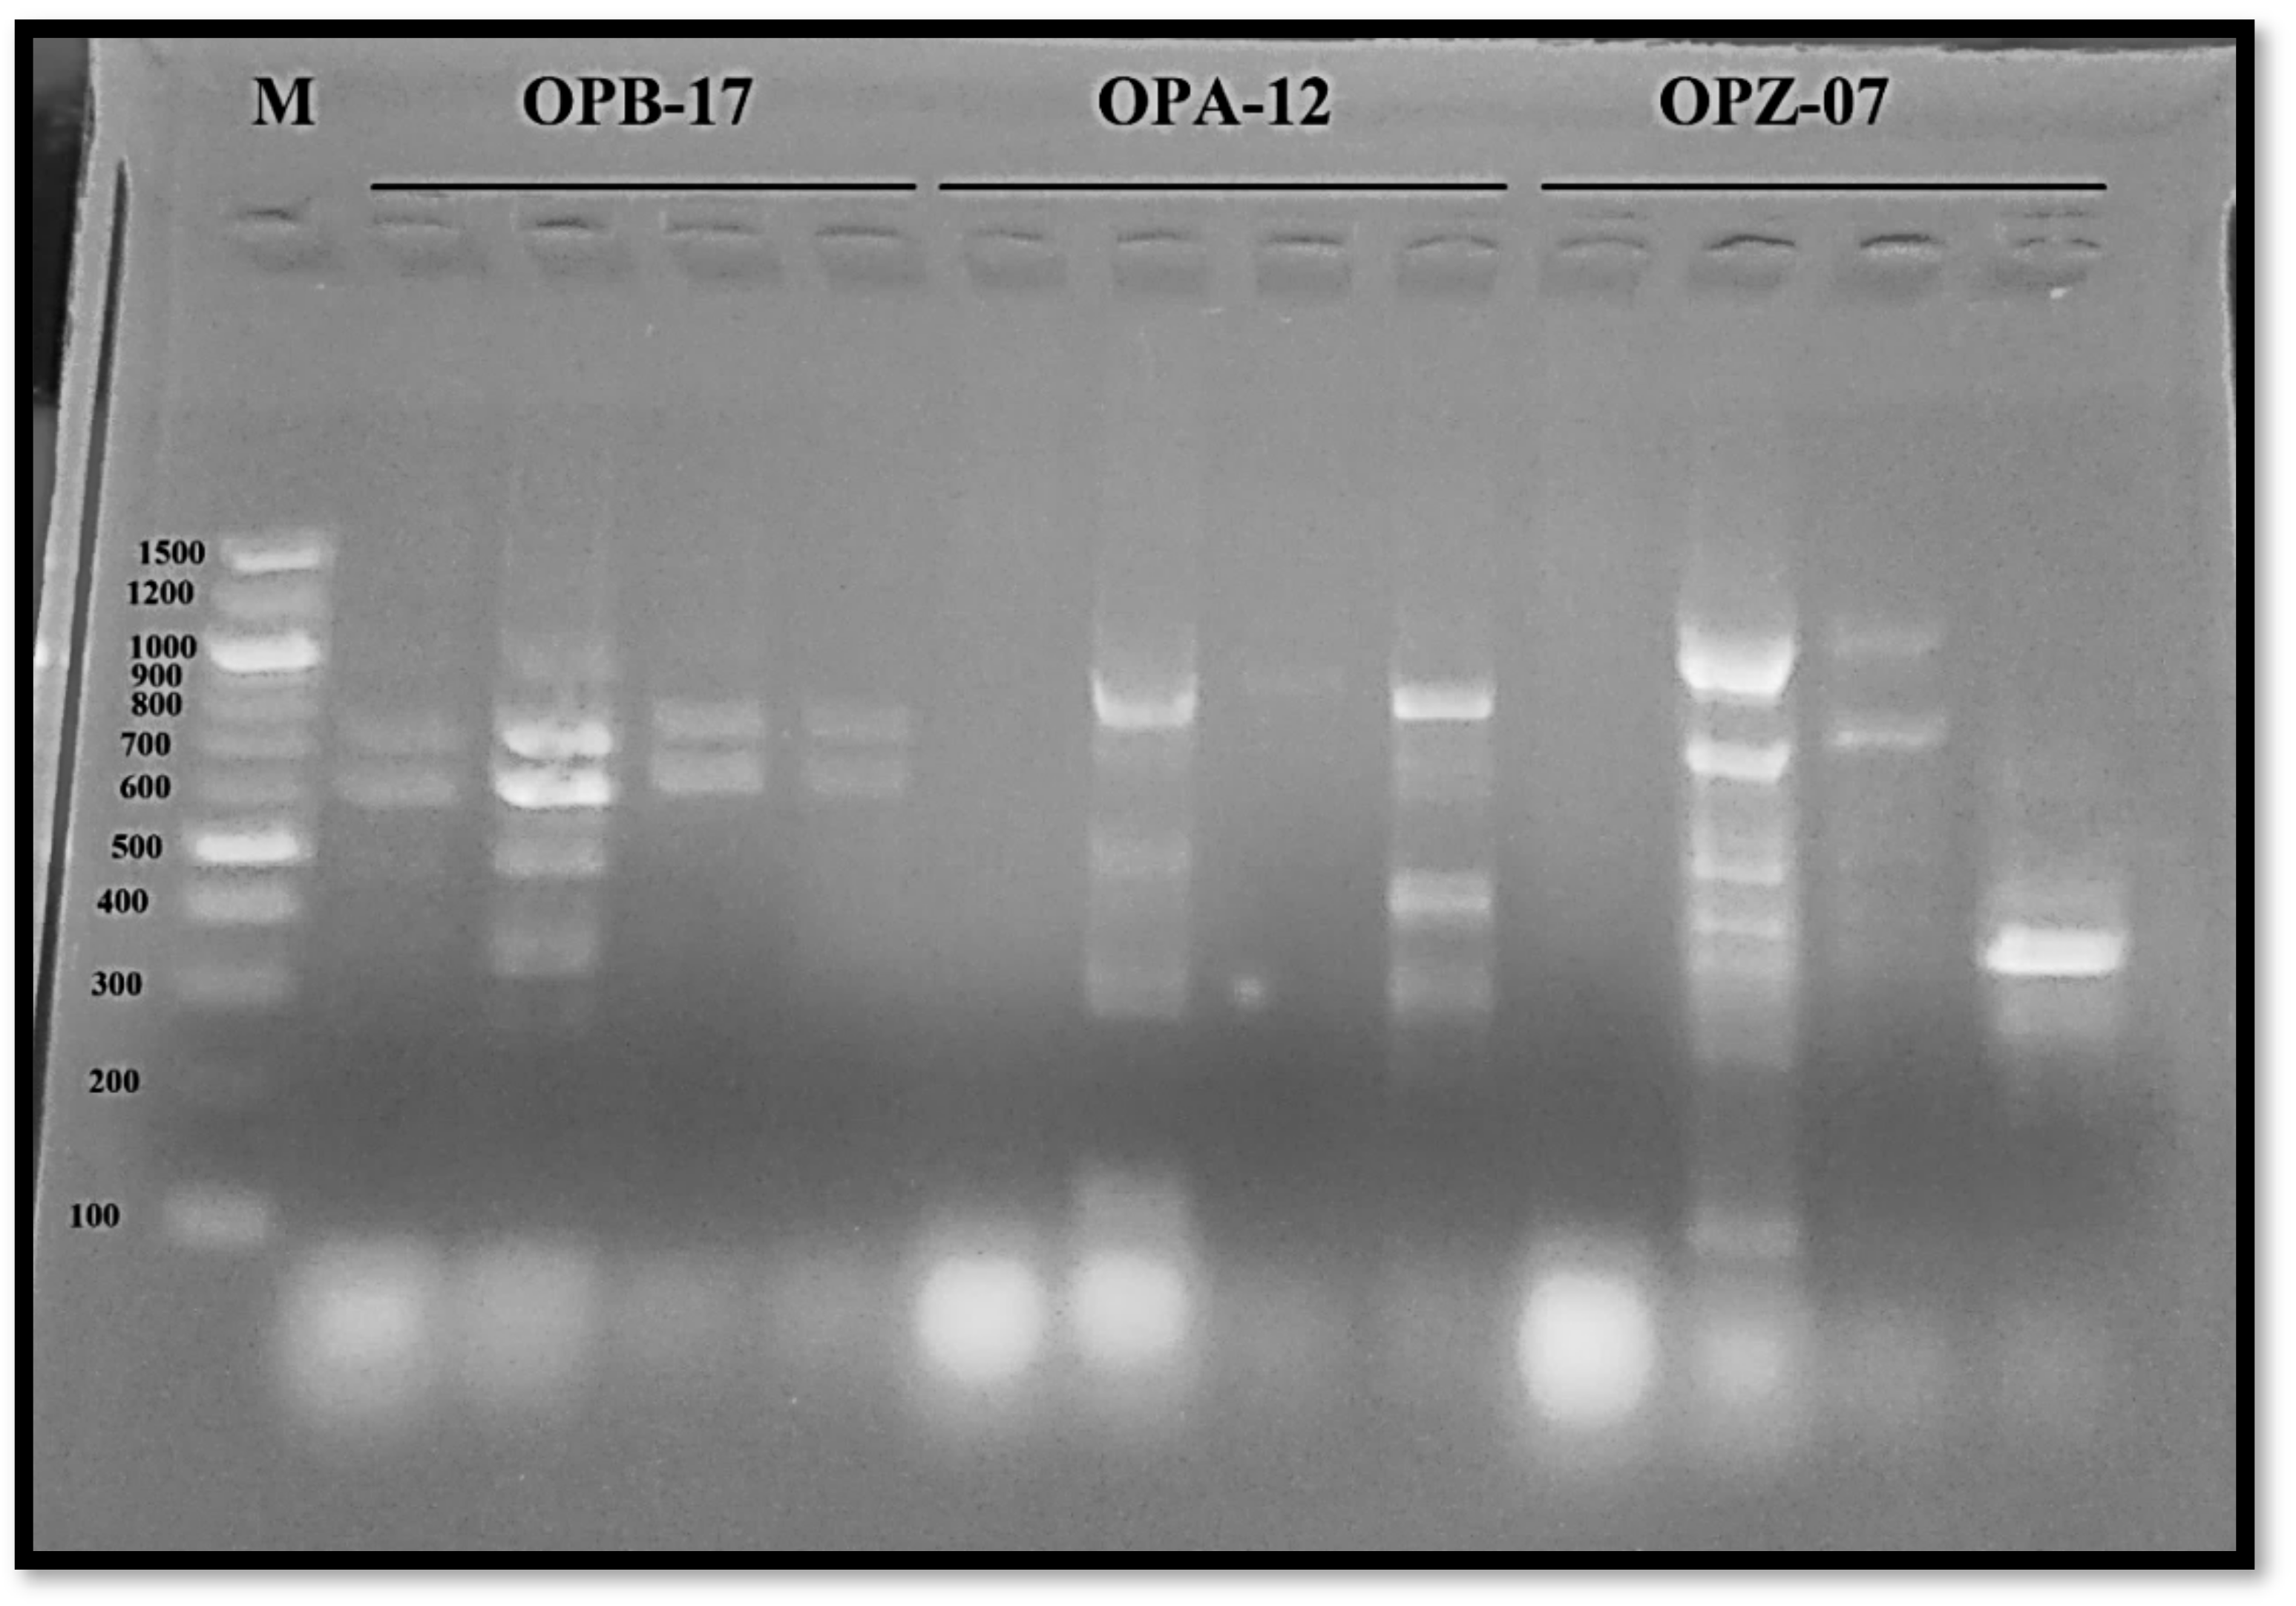
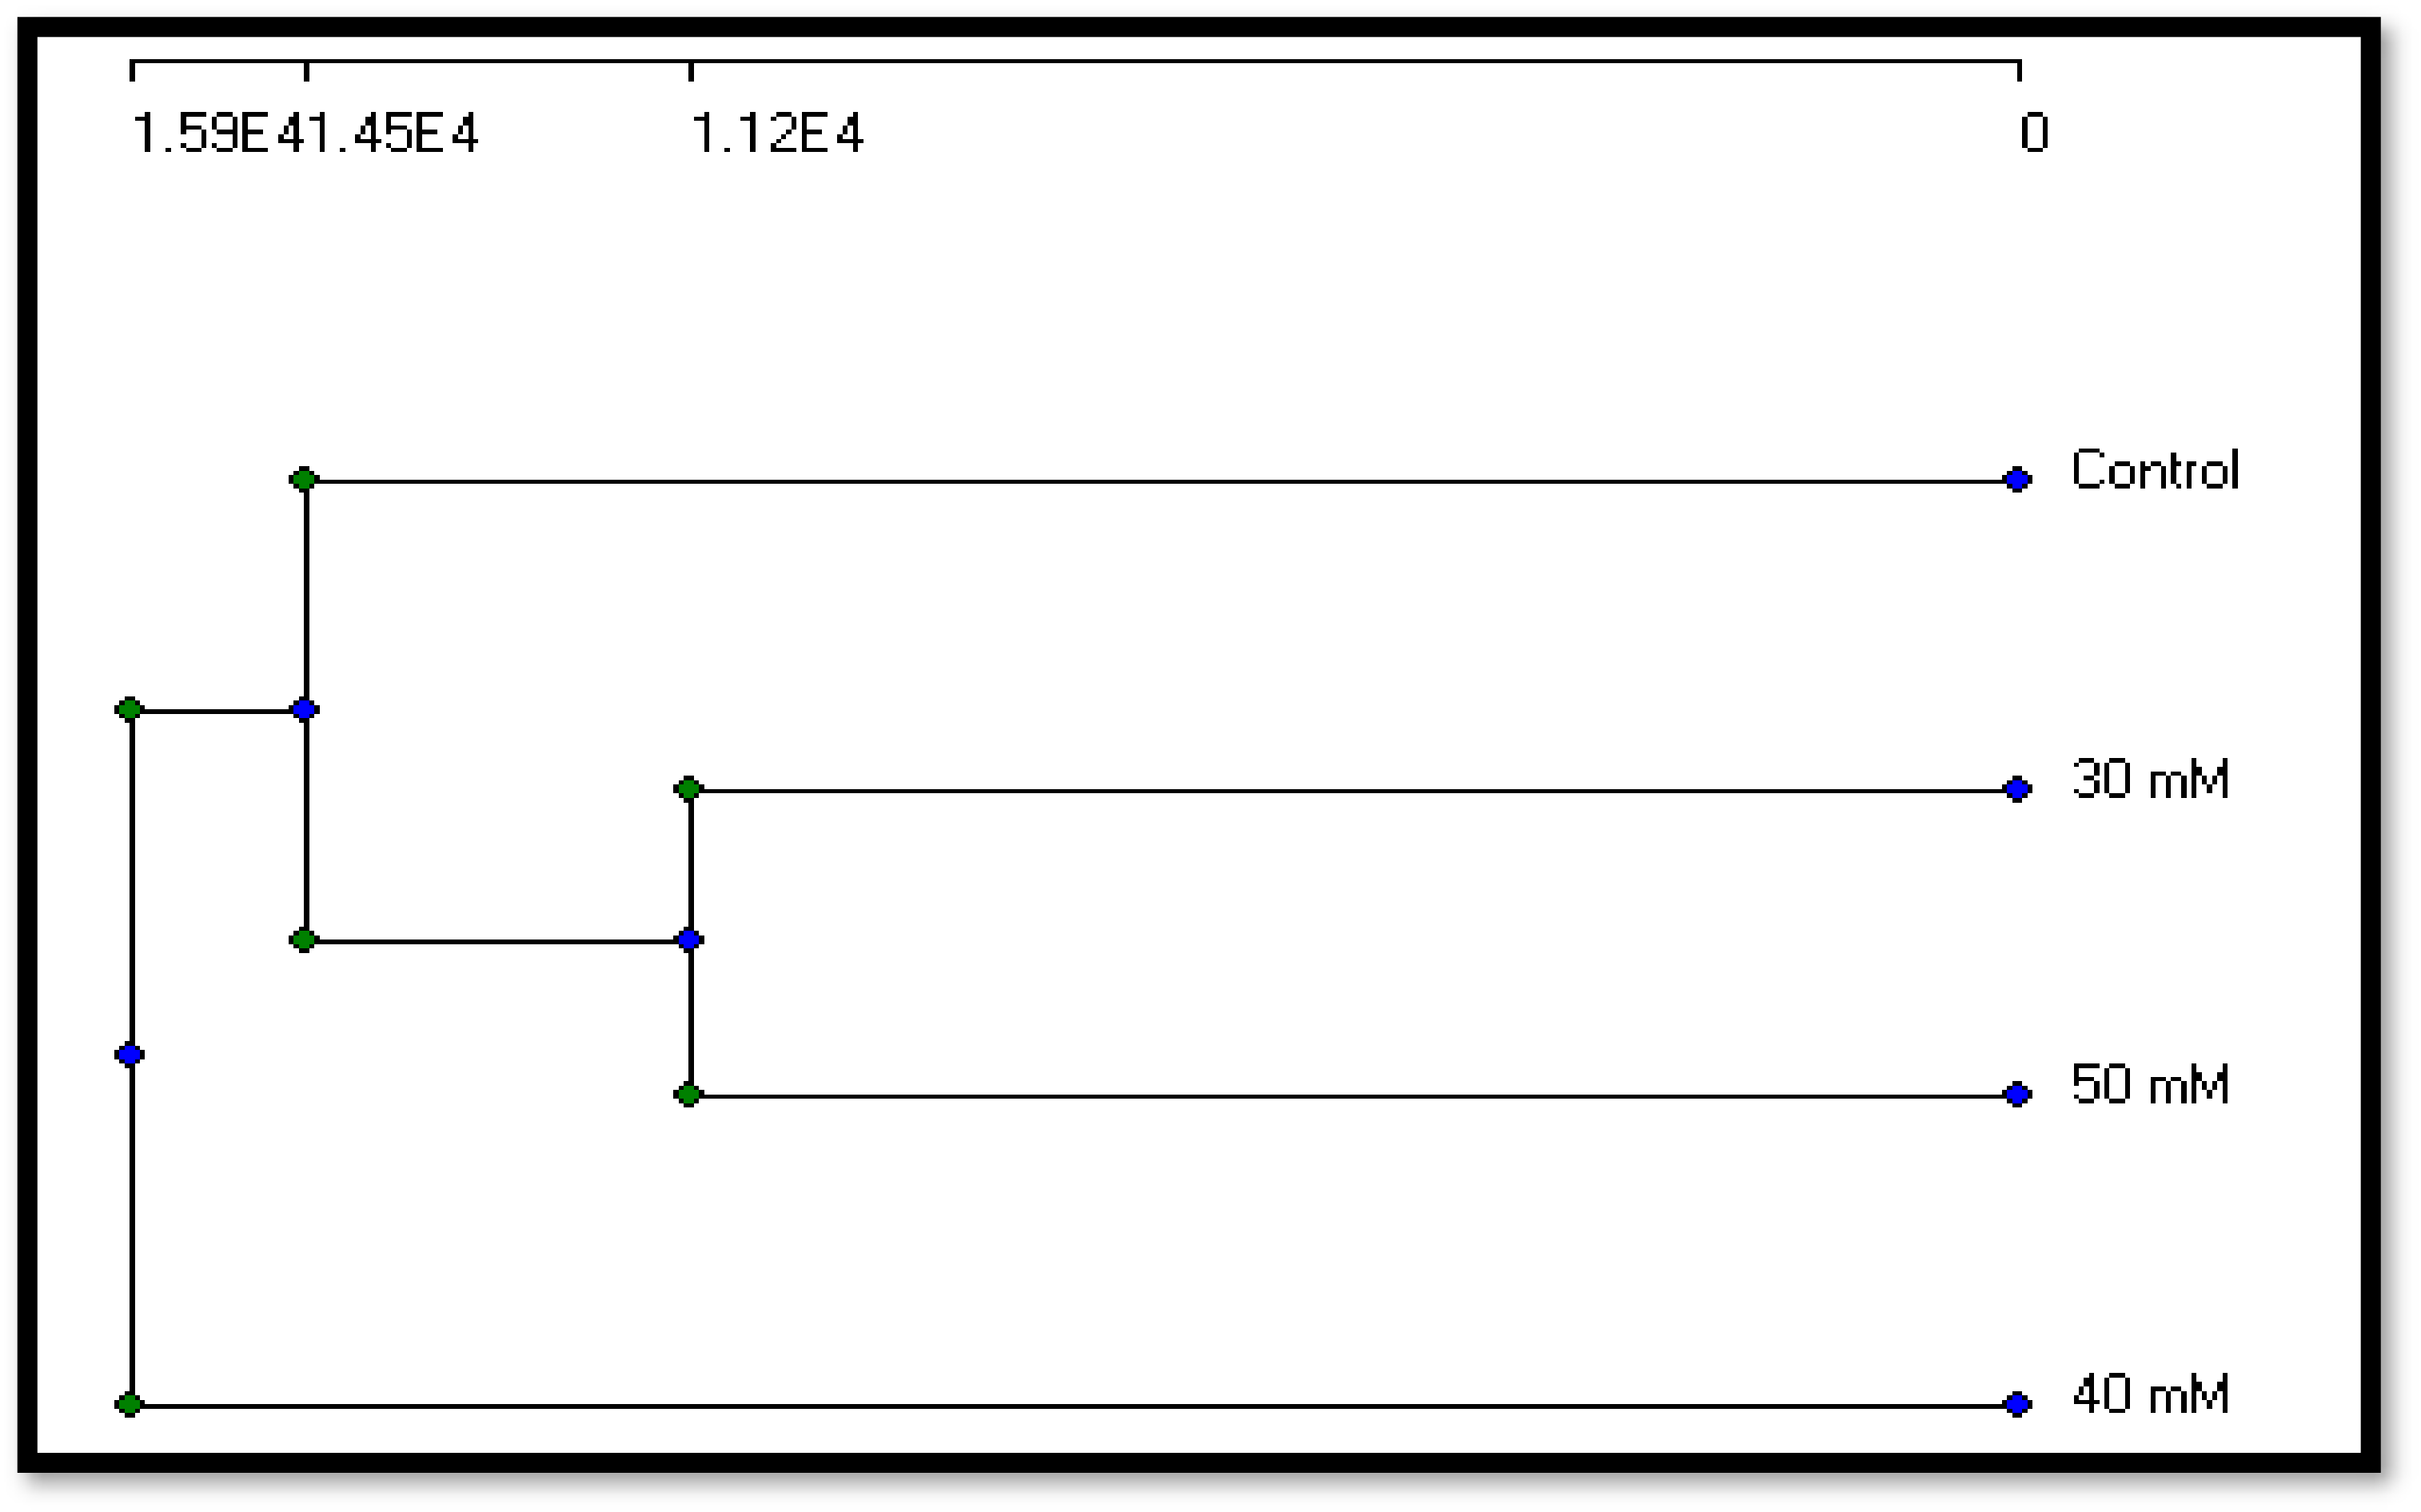
The present study found that mutation caused genotoxicity and instability in DNA content. Other studies have also found this, using molecular markers to estimate the variation caused by mutations. Many researchers [
30,
31,
32] have shown that molecular markers, such as inter-simple sequence repeats (ISSRs), random-amplified polymorphic DNA (RAPD), and amplified fragment length polymorphisms (AFLPs) are three DNA profiling approaches that can be effectively utilized to assess genetic diversity. They are dominant markers that use anonymous regions enabling study of genomic diversity using universal primers. All these approaches were related to this investigation which used RAPD-PCR as a molecular technique to estimate the genetic diversity in
A. niger resulting from exposure to the sodium azide mutagen. Similar results from chemical mutagenic treatments of the strain could predict the activation of specific genes because of mutant mutations. According to [
33] a mutation caused
aflR overexpression in
A. flavus, which increased aflatoxin pathway gene transcription and aflatoxin accumulation.
The evolutionary history of a pathogen population determines the genetic makeup of that population. Genetic makeup data is thought to provide insight into the evolutionary potential of disease populations in the future. The distribution and amount of genetic variability among and within populations is referred to as genetic structure. The genetic makeup includes both genotype and gene diversity. Gene diversity refers to the number and frequencies of alleles at particular loci in a population, whereas genotype diversity refers to the number and frequencies of multi-locus genotypes in a population [
34,
35].
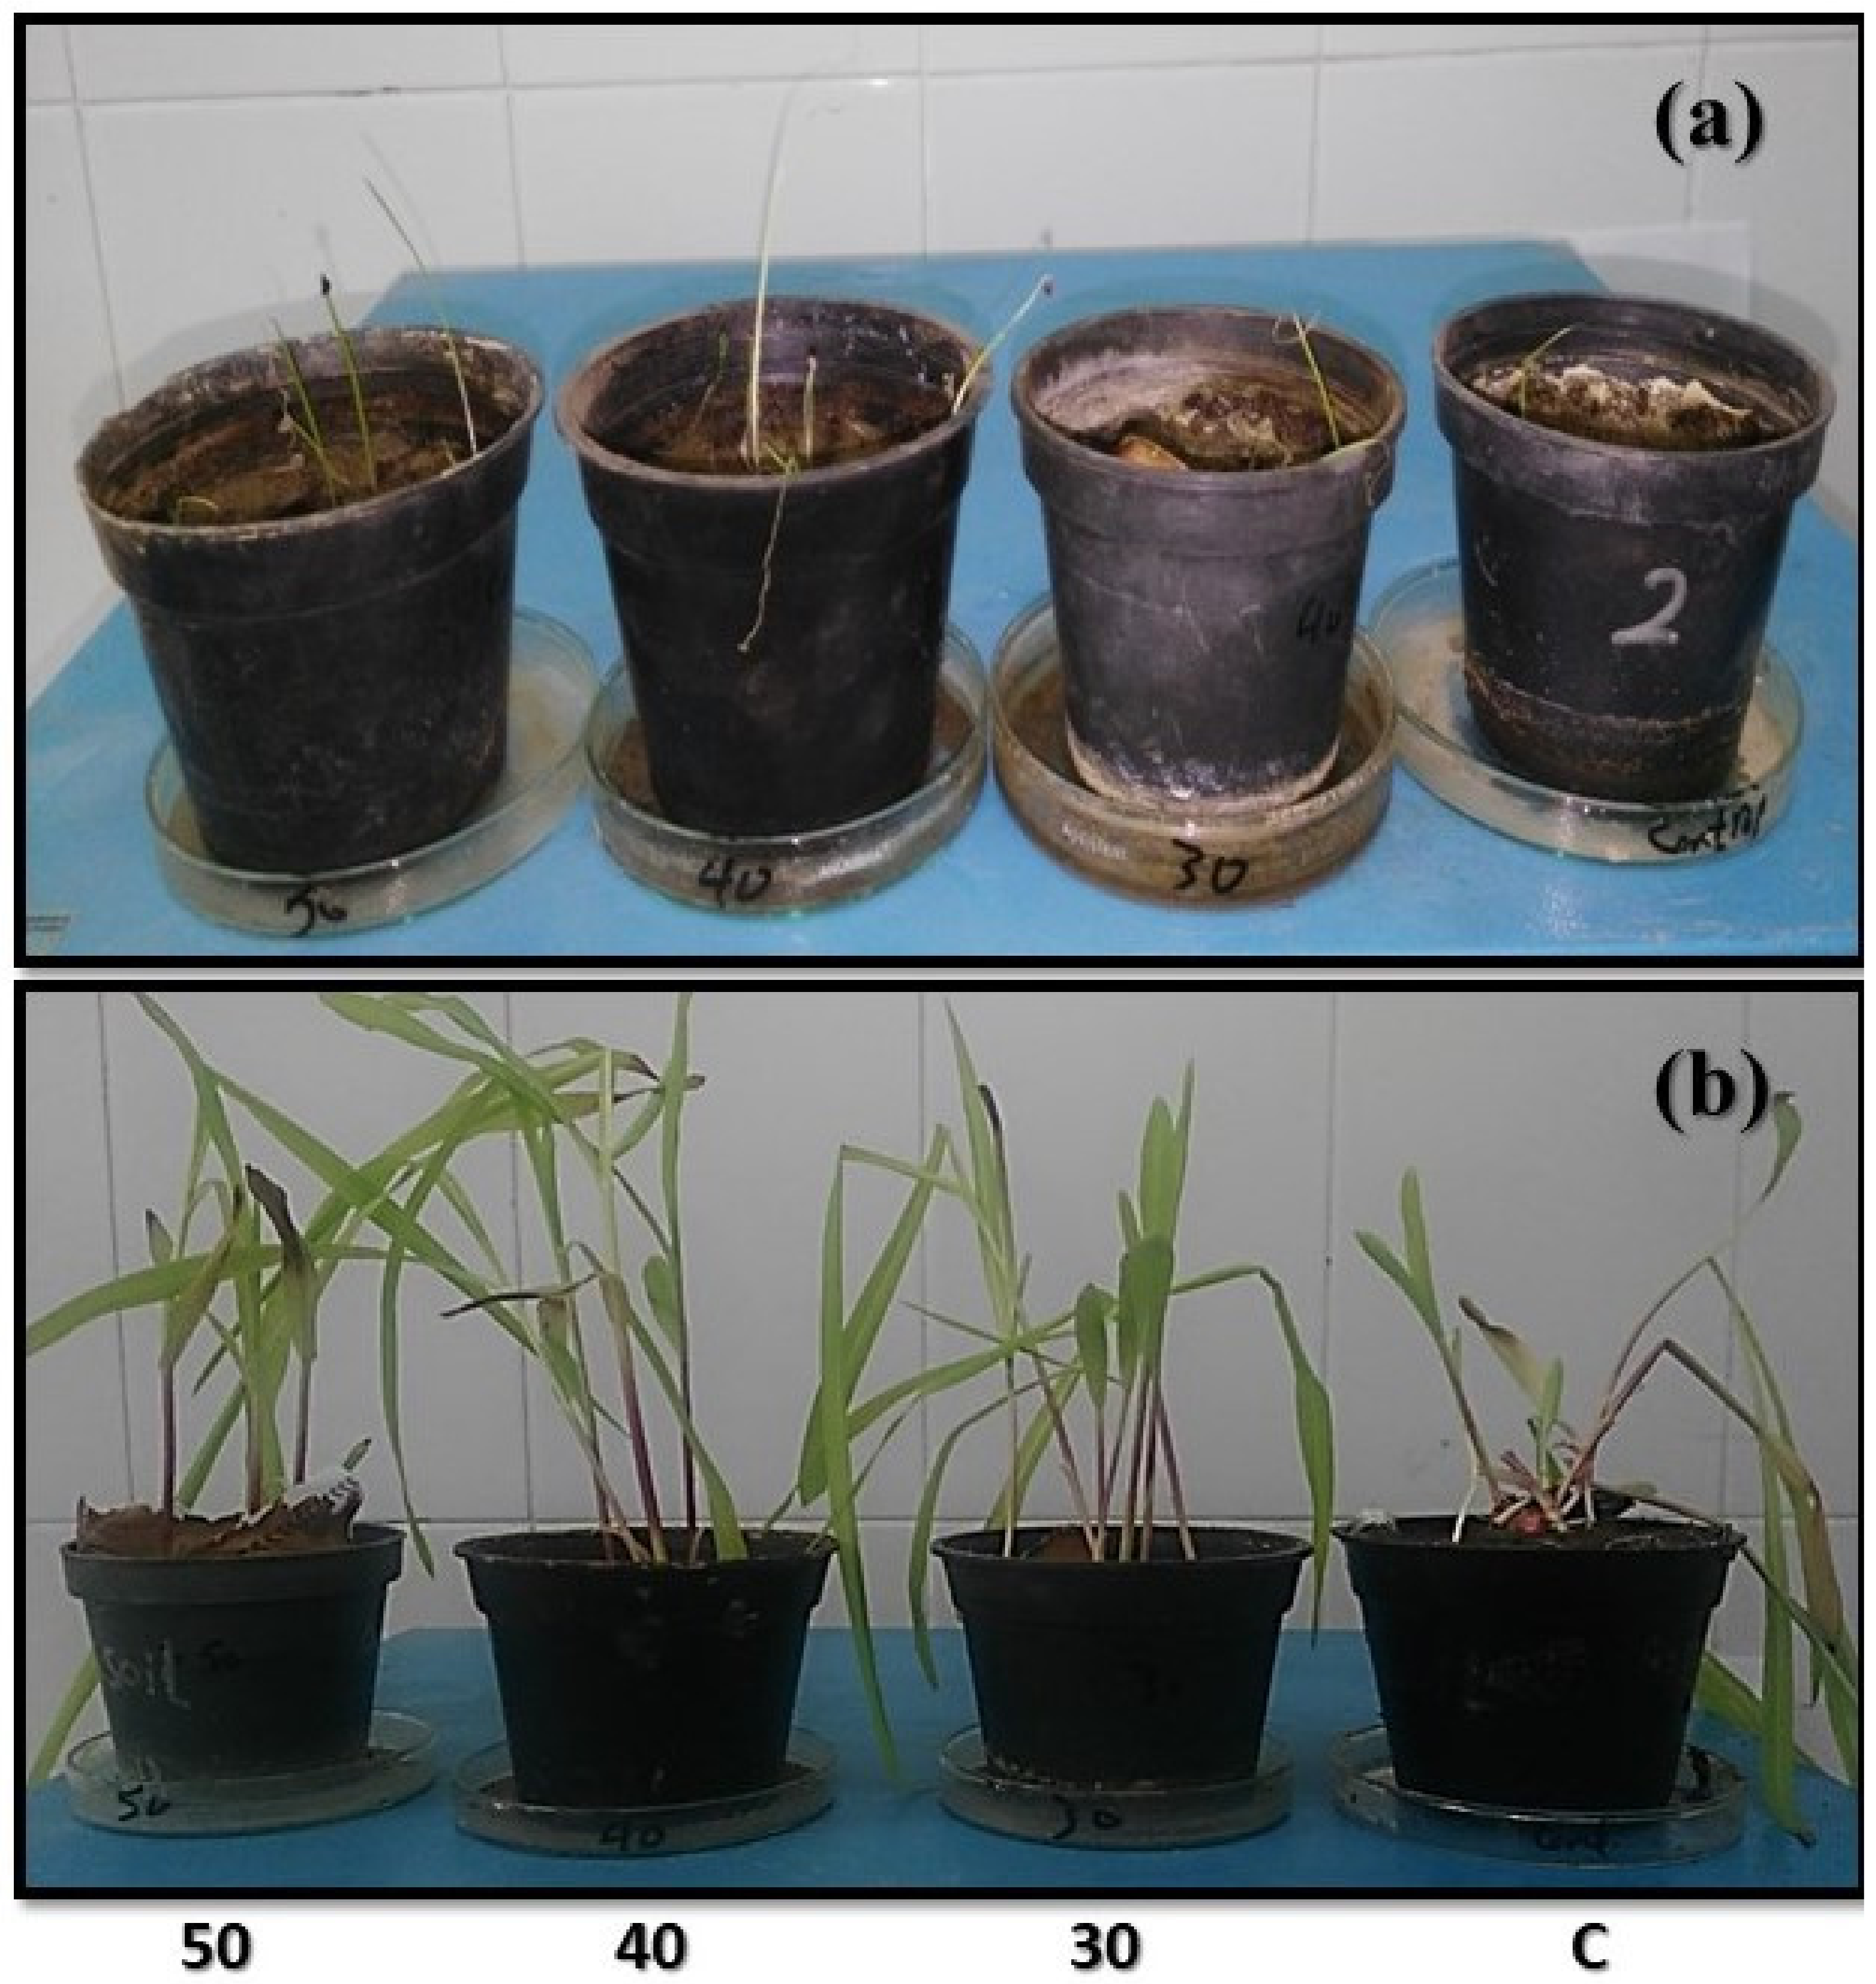
In this study, both
Z. maize and
A. cepa showed high resistance, in morphological and physiological parameters, in response to mutant
A. niger strains compared to control. This agrees with [
36] who identified three fungal species that infect maize,
Aspergillus flavus,
Aspergillus niger and
Fusarium spp. These species have inhibitory effects on maize with percentage reductions of 42, 96 and 13%. Moreover, [
37] found that ten fungal endophytes of maize cause severe diseases in maize.


 ,
, 


