
Theoretical and Experimental Analysis on Influence of Natural Airflow on Spent Fuel Heat Removal in Dry Cask Storage

 ,
, 
 ,
, 
Abstract
:1. Introduction
2. Methodology
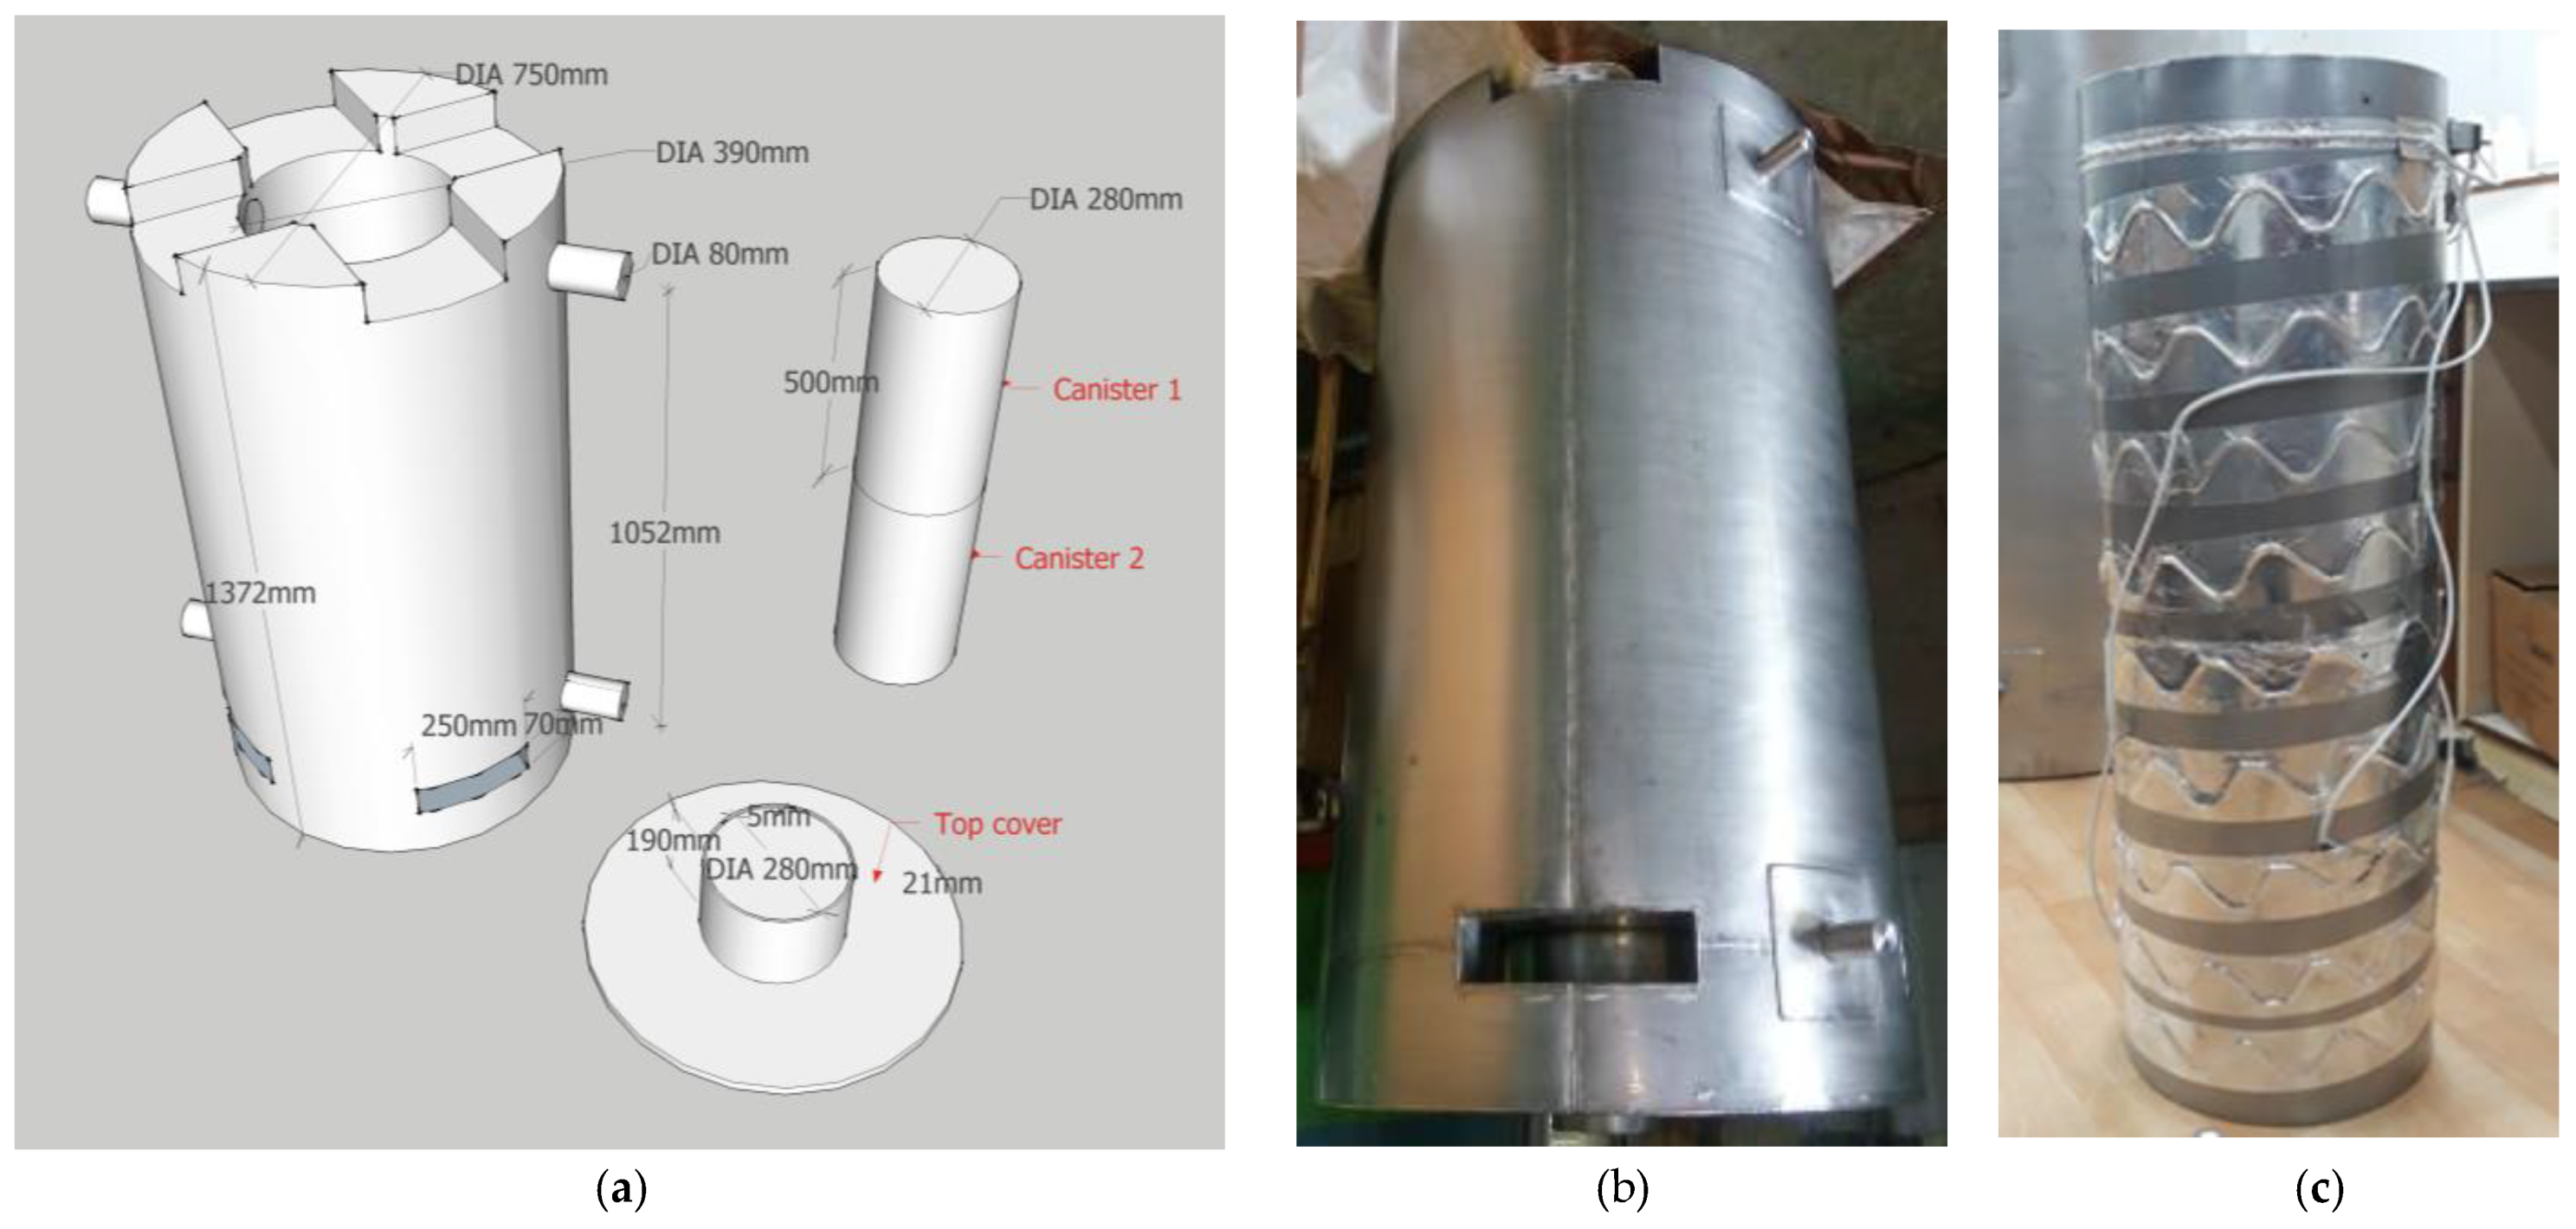
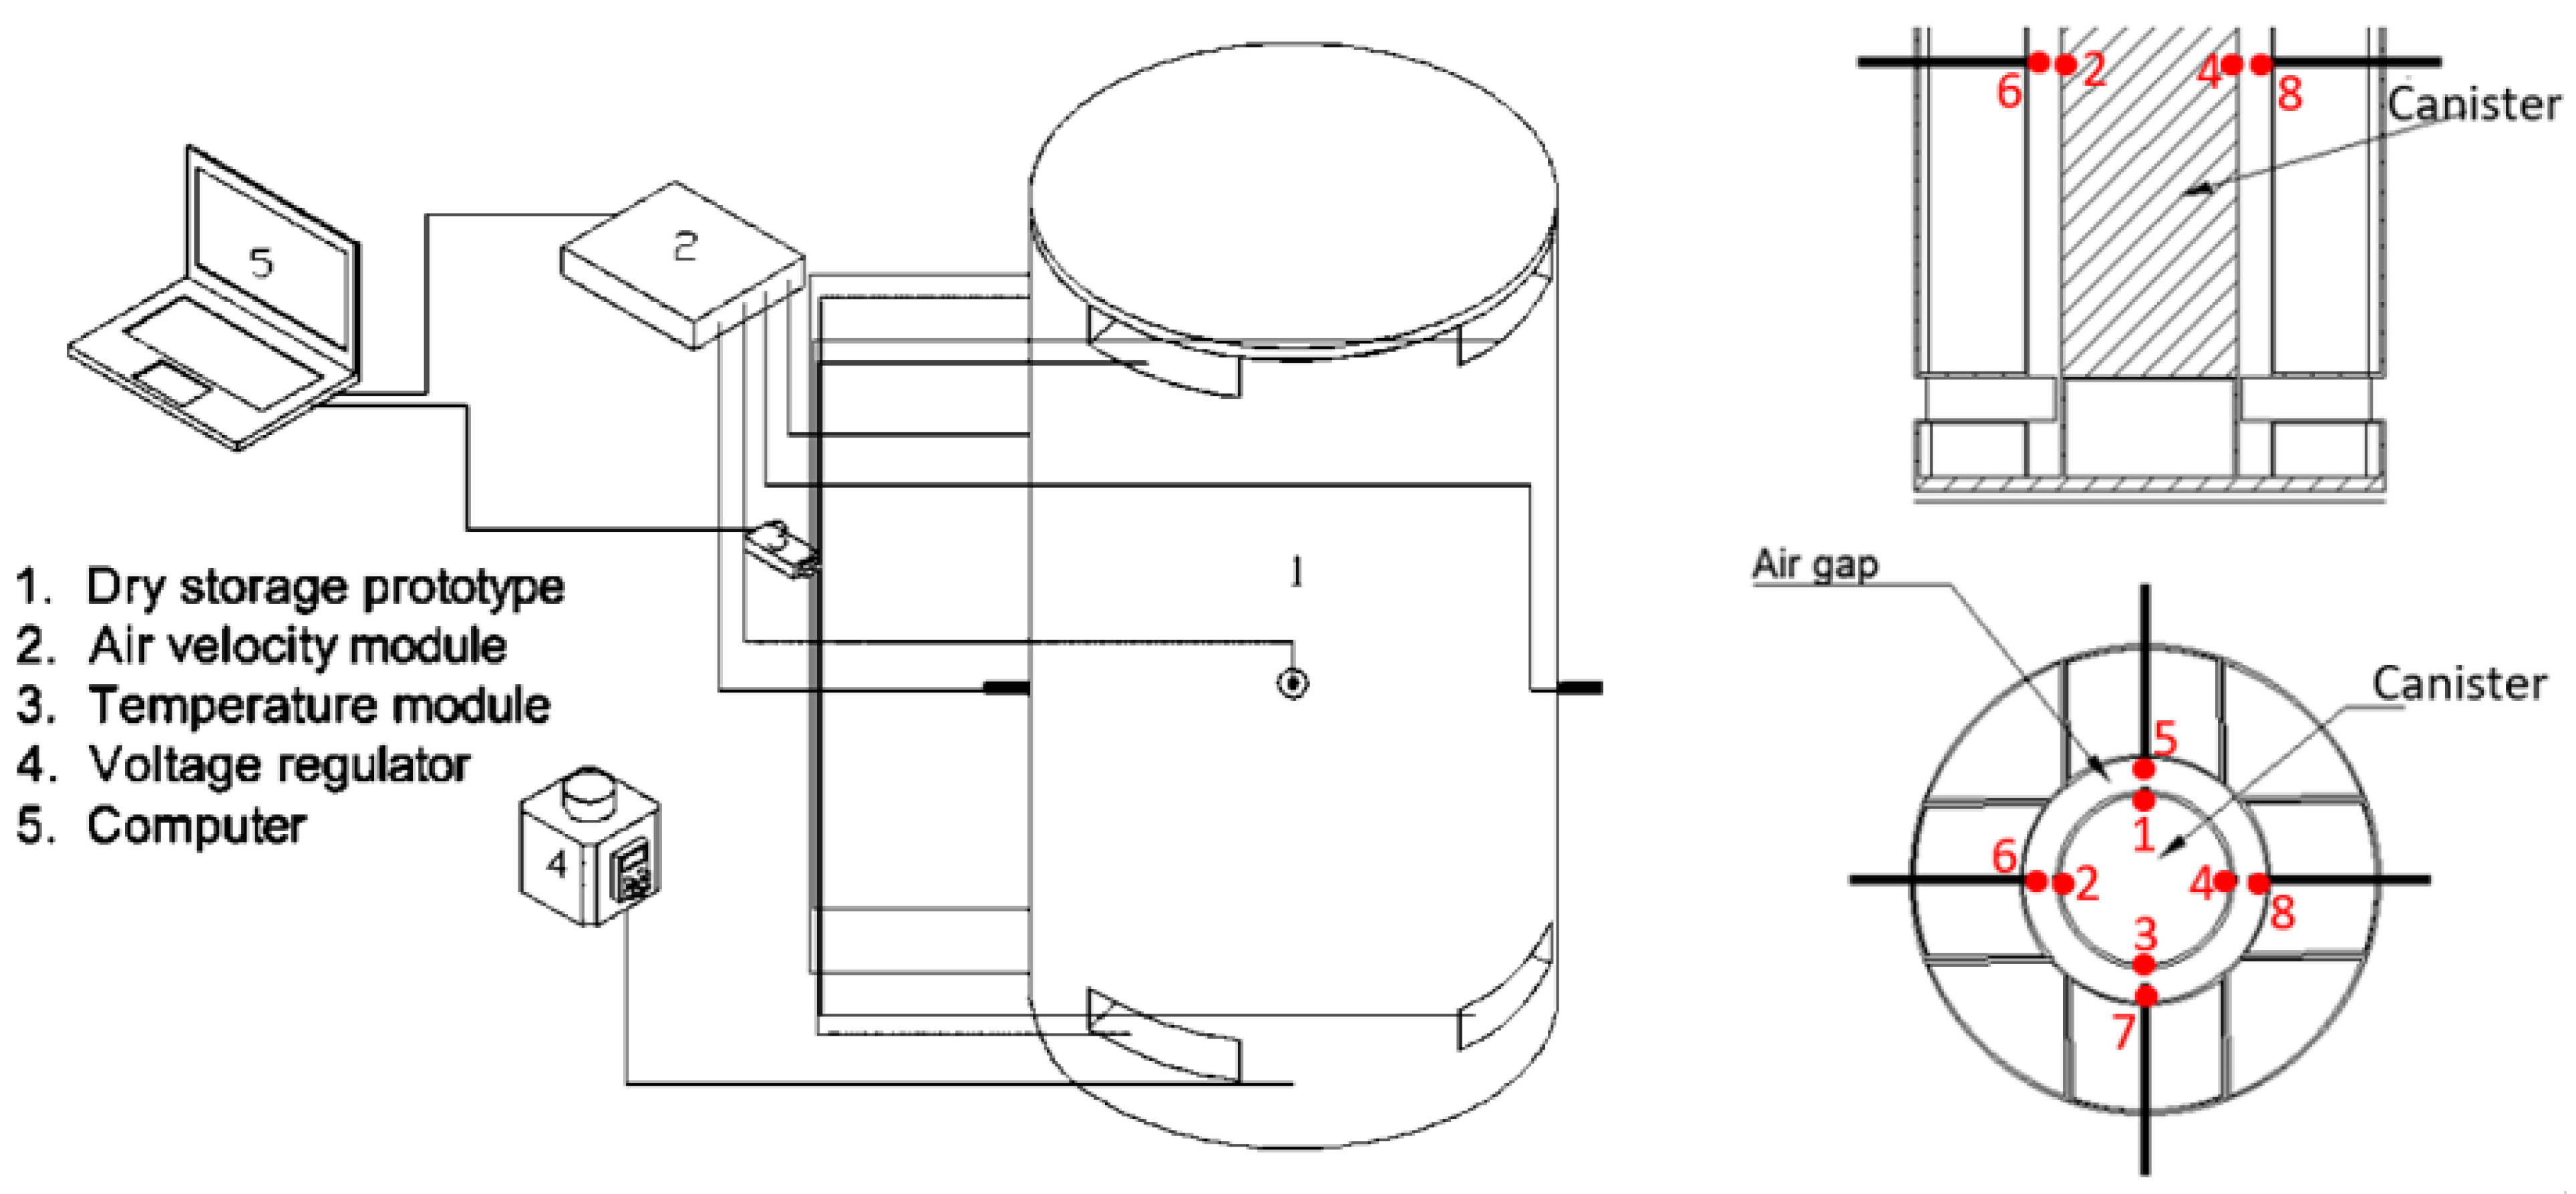
2.1. Experimental
2.2. Model
3. Results and Discussion
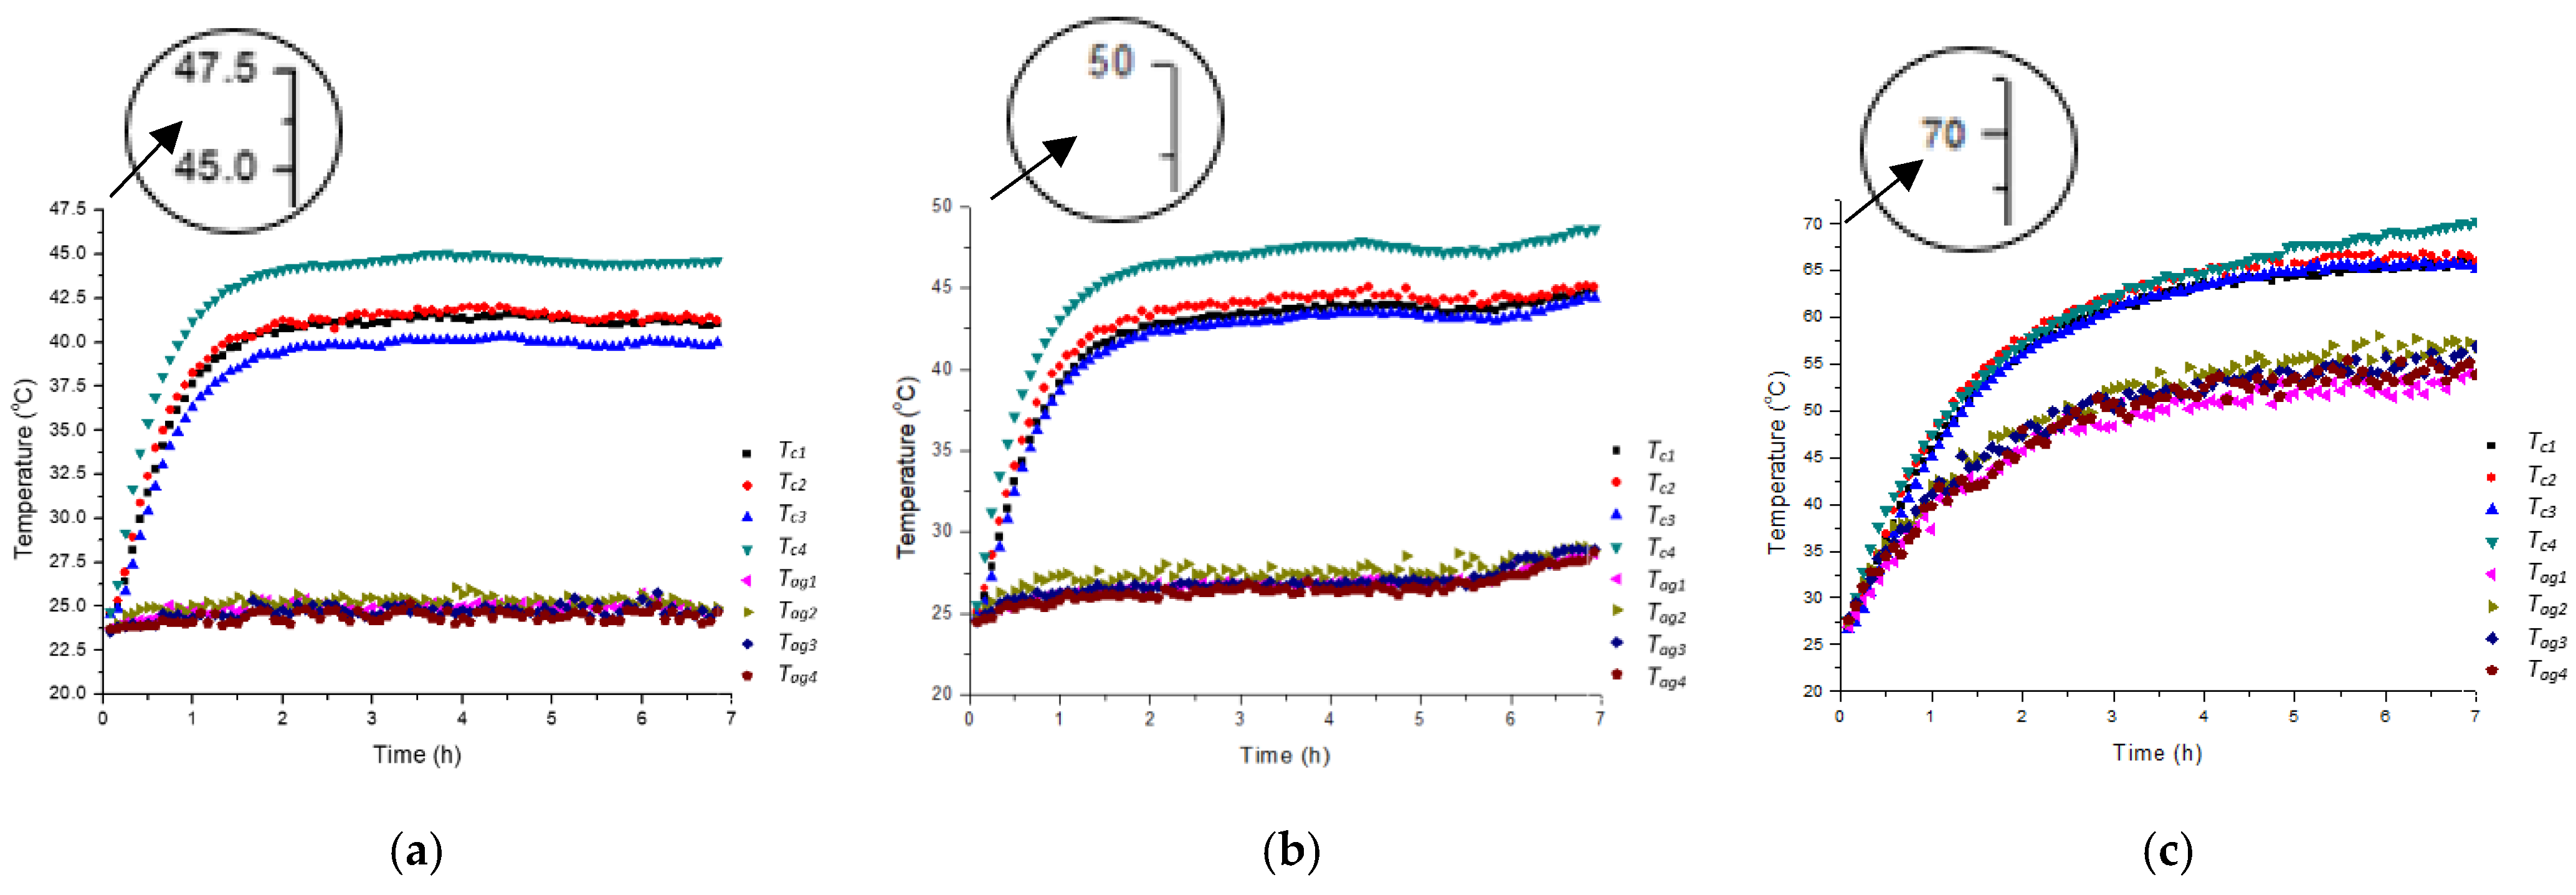
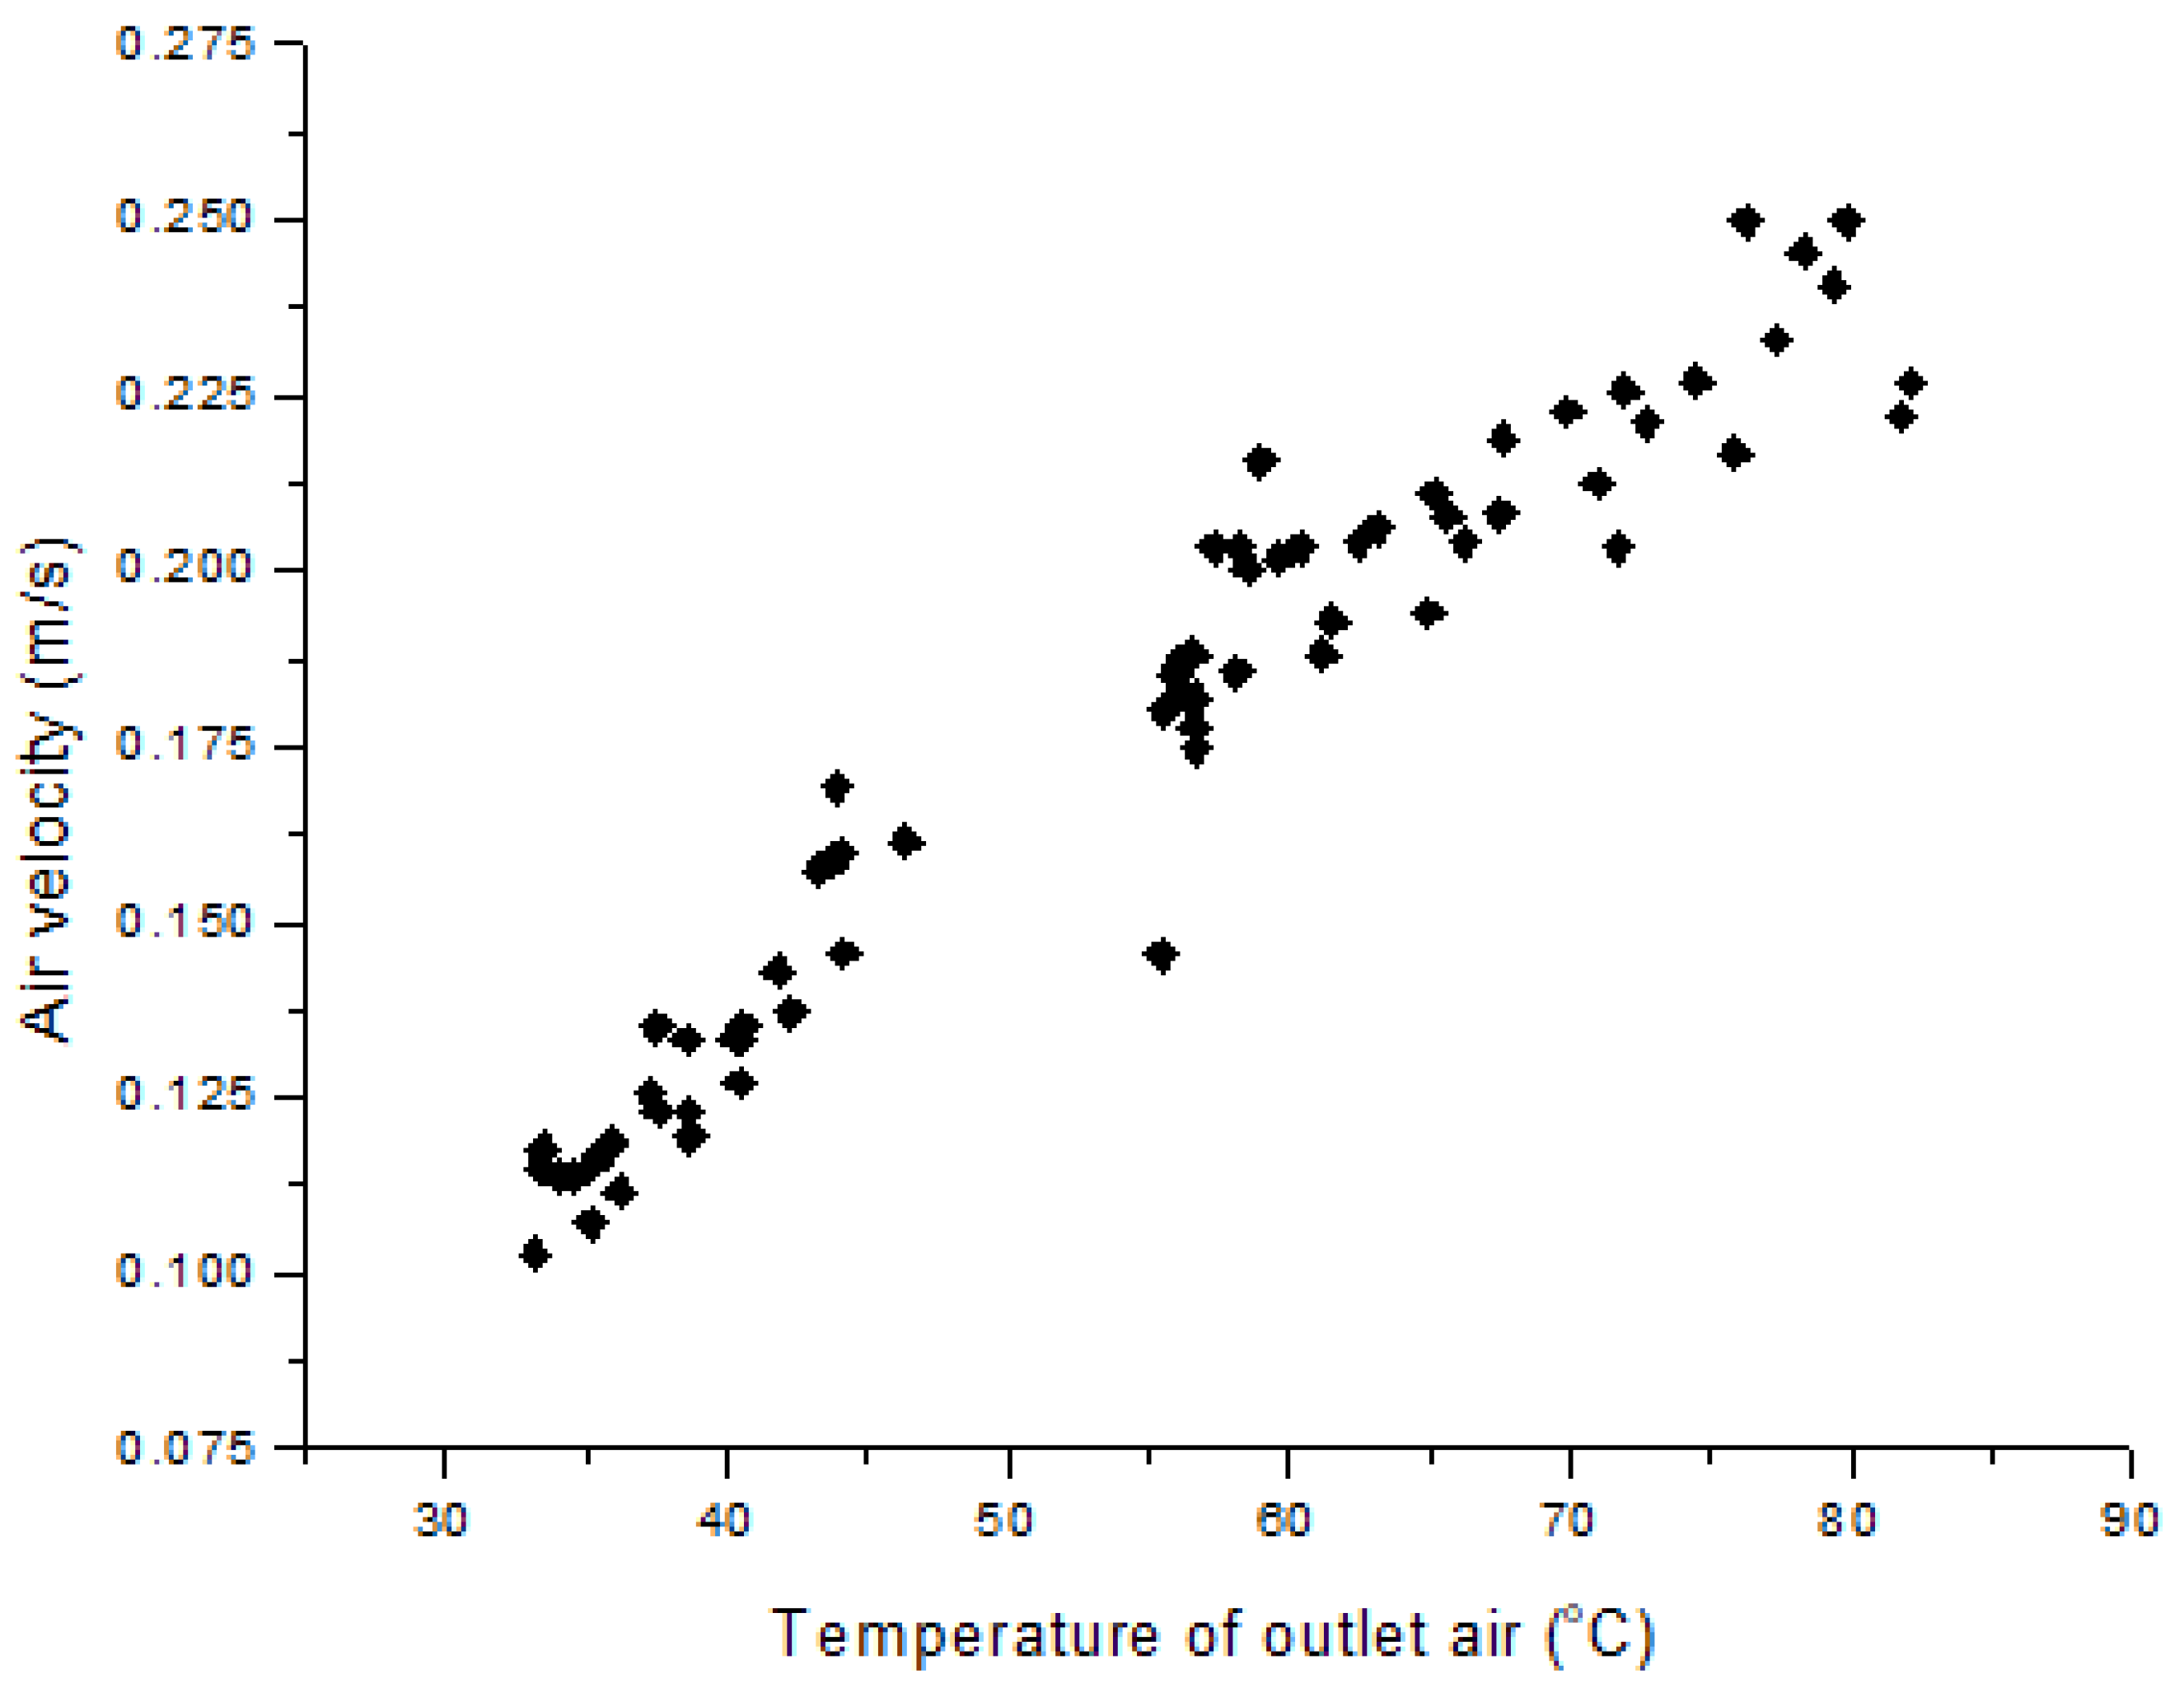
3.1. Experimental Data Results
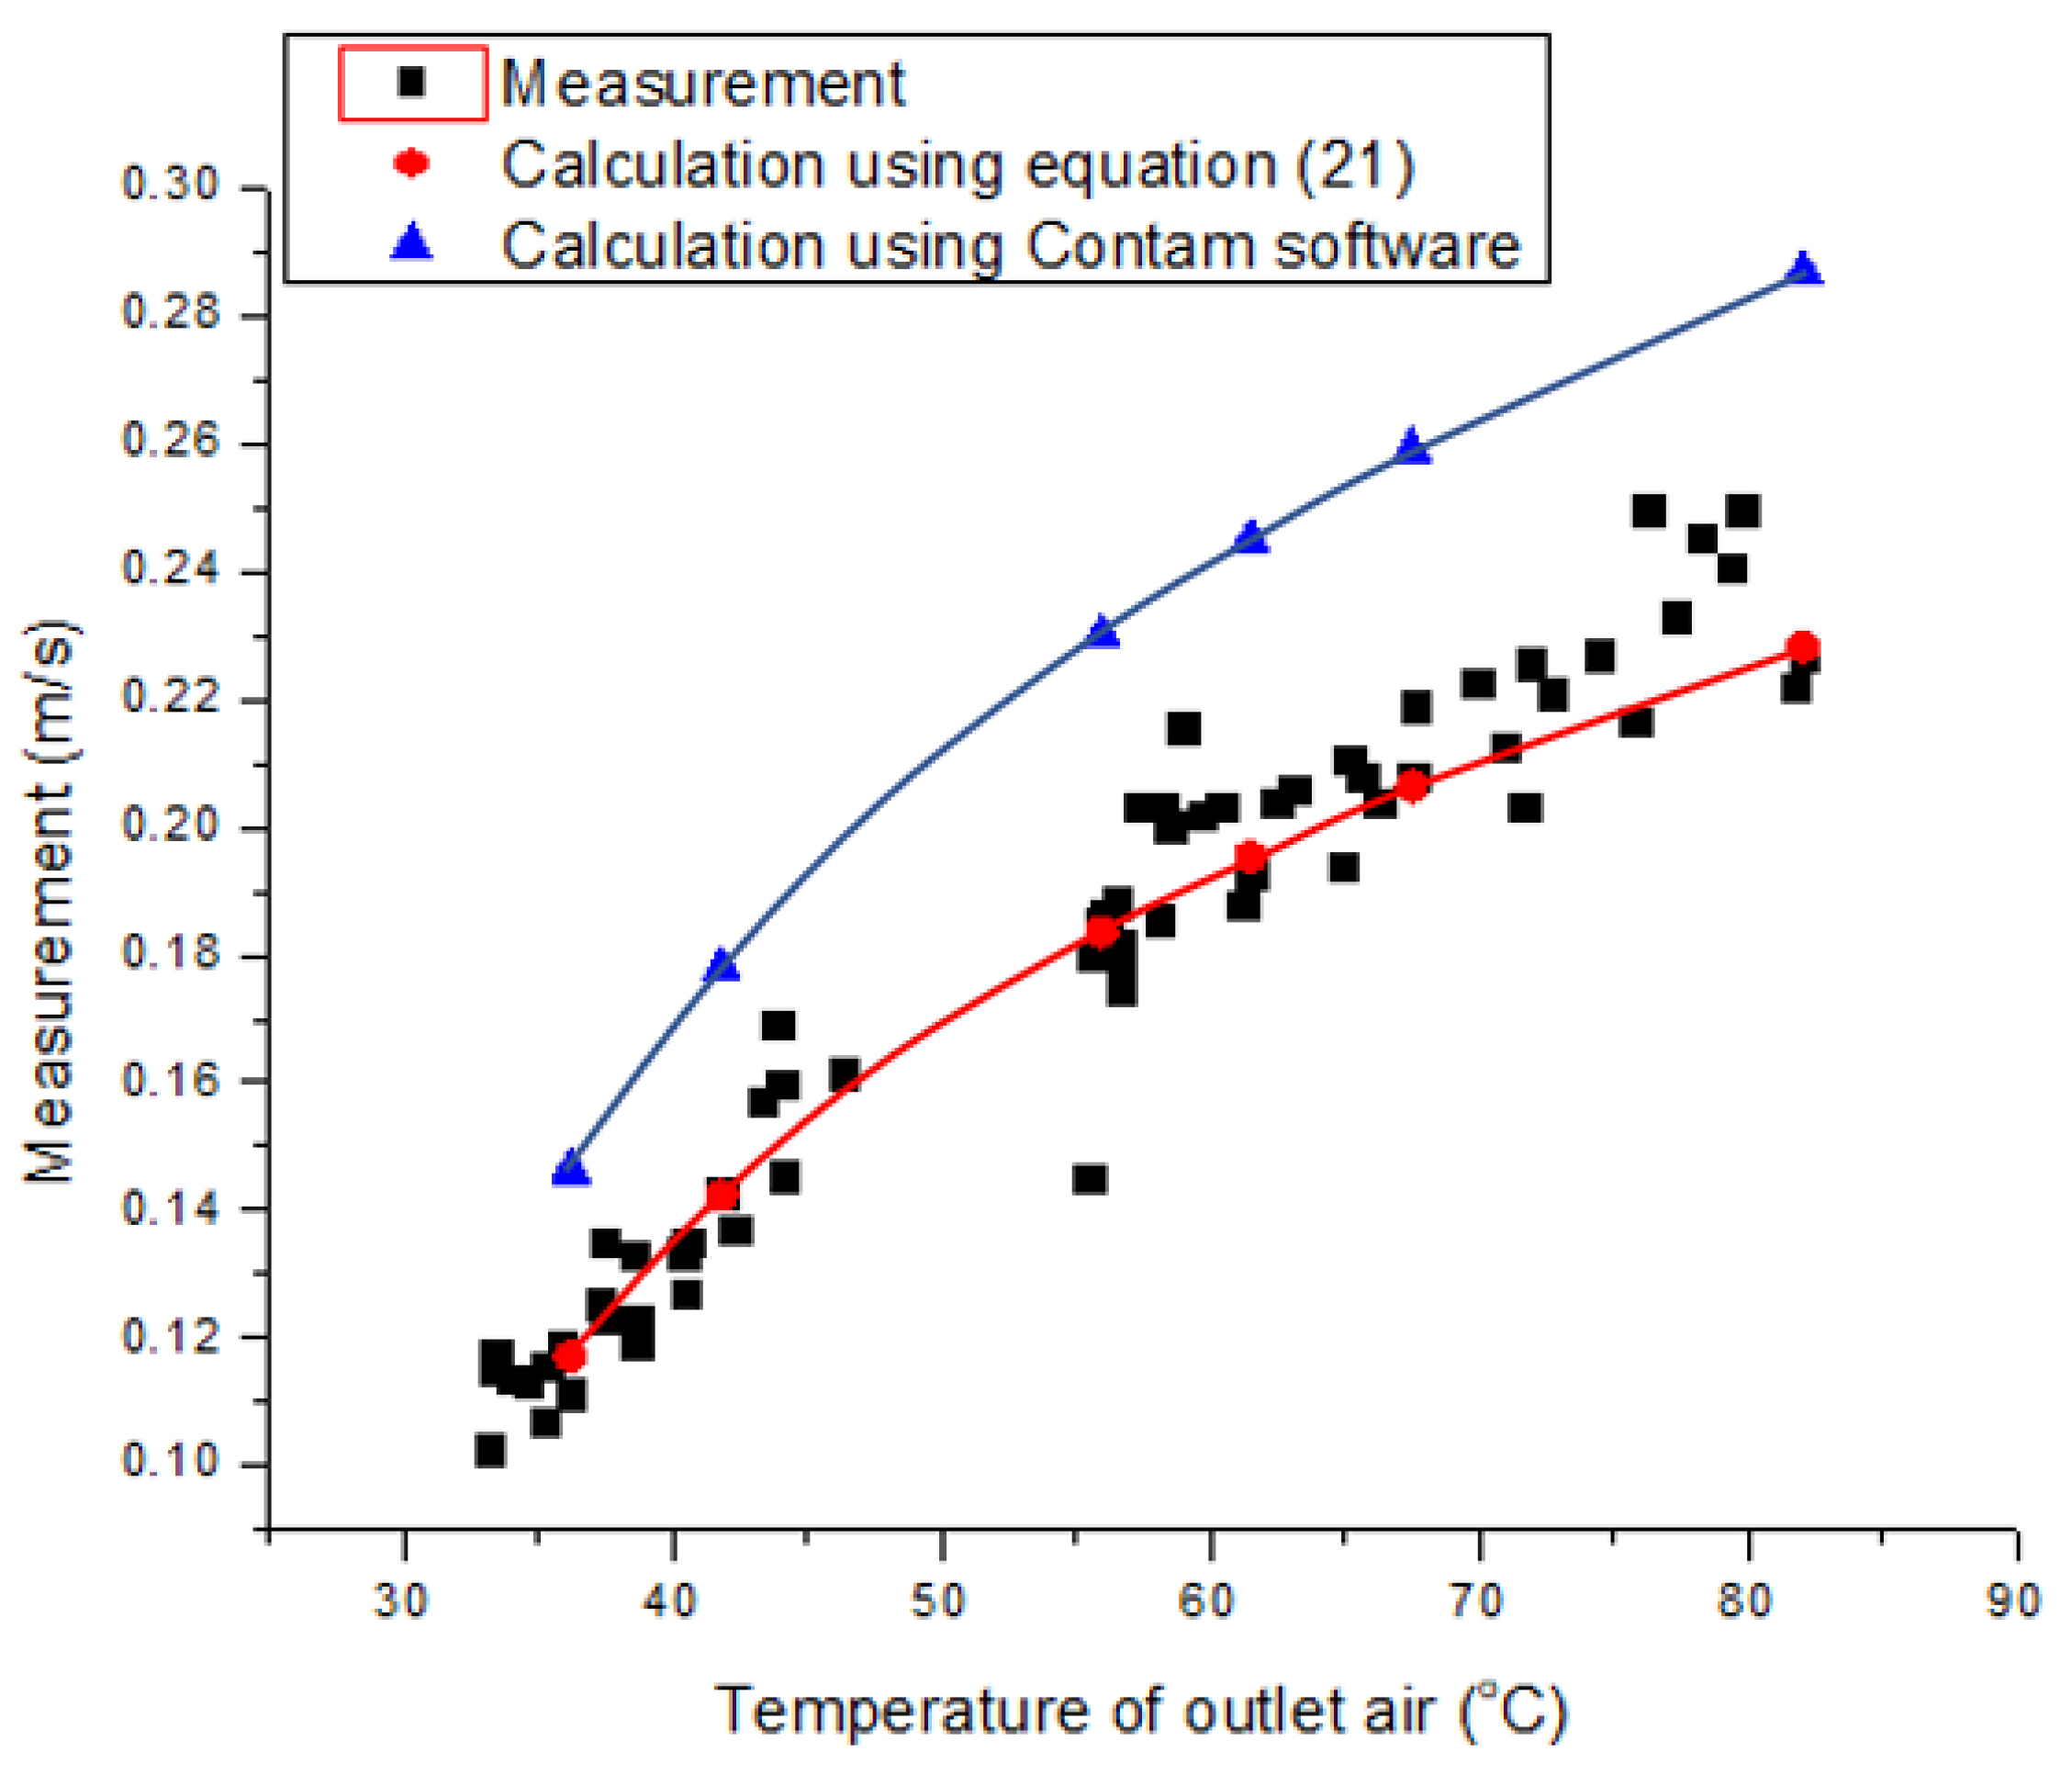
3.2. Measurement Data Comparison of Numerical Modeling, Simulation, and Theoretical Calculation
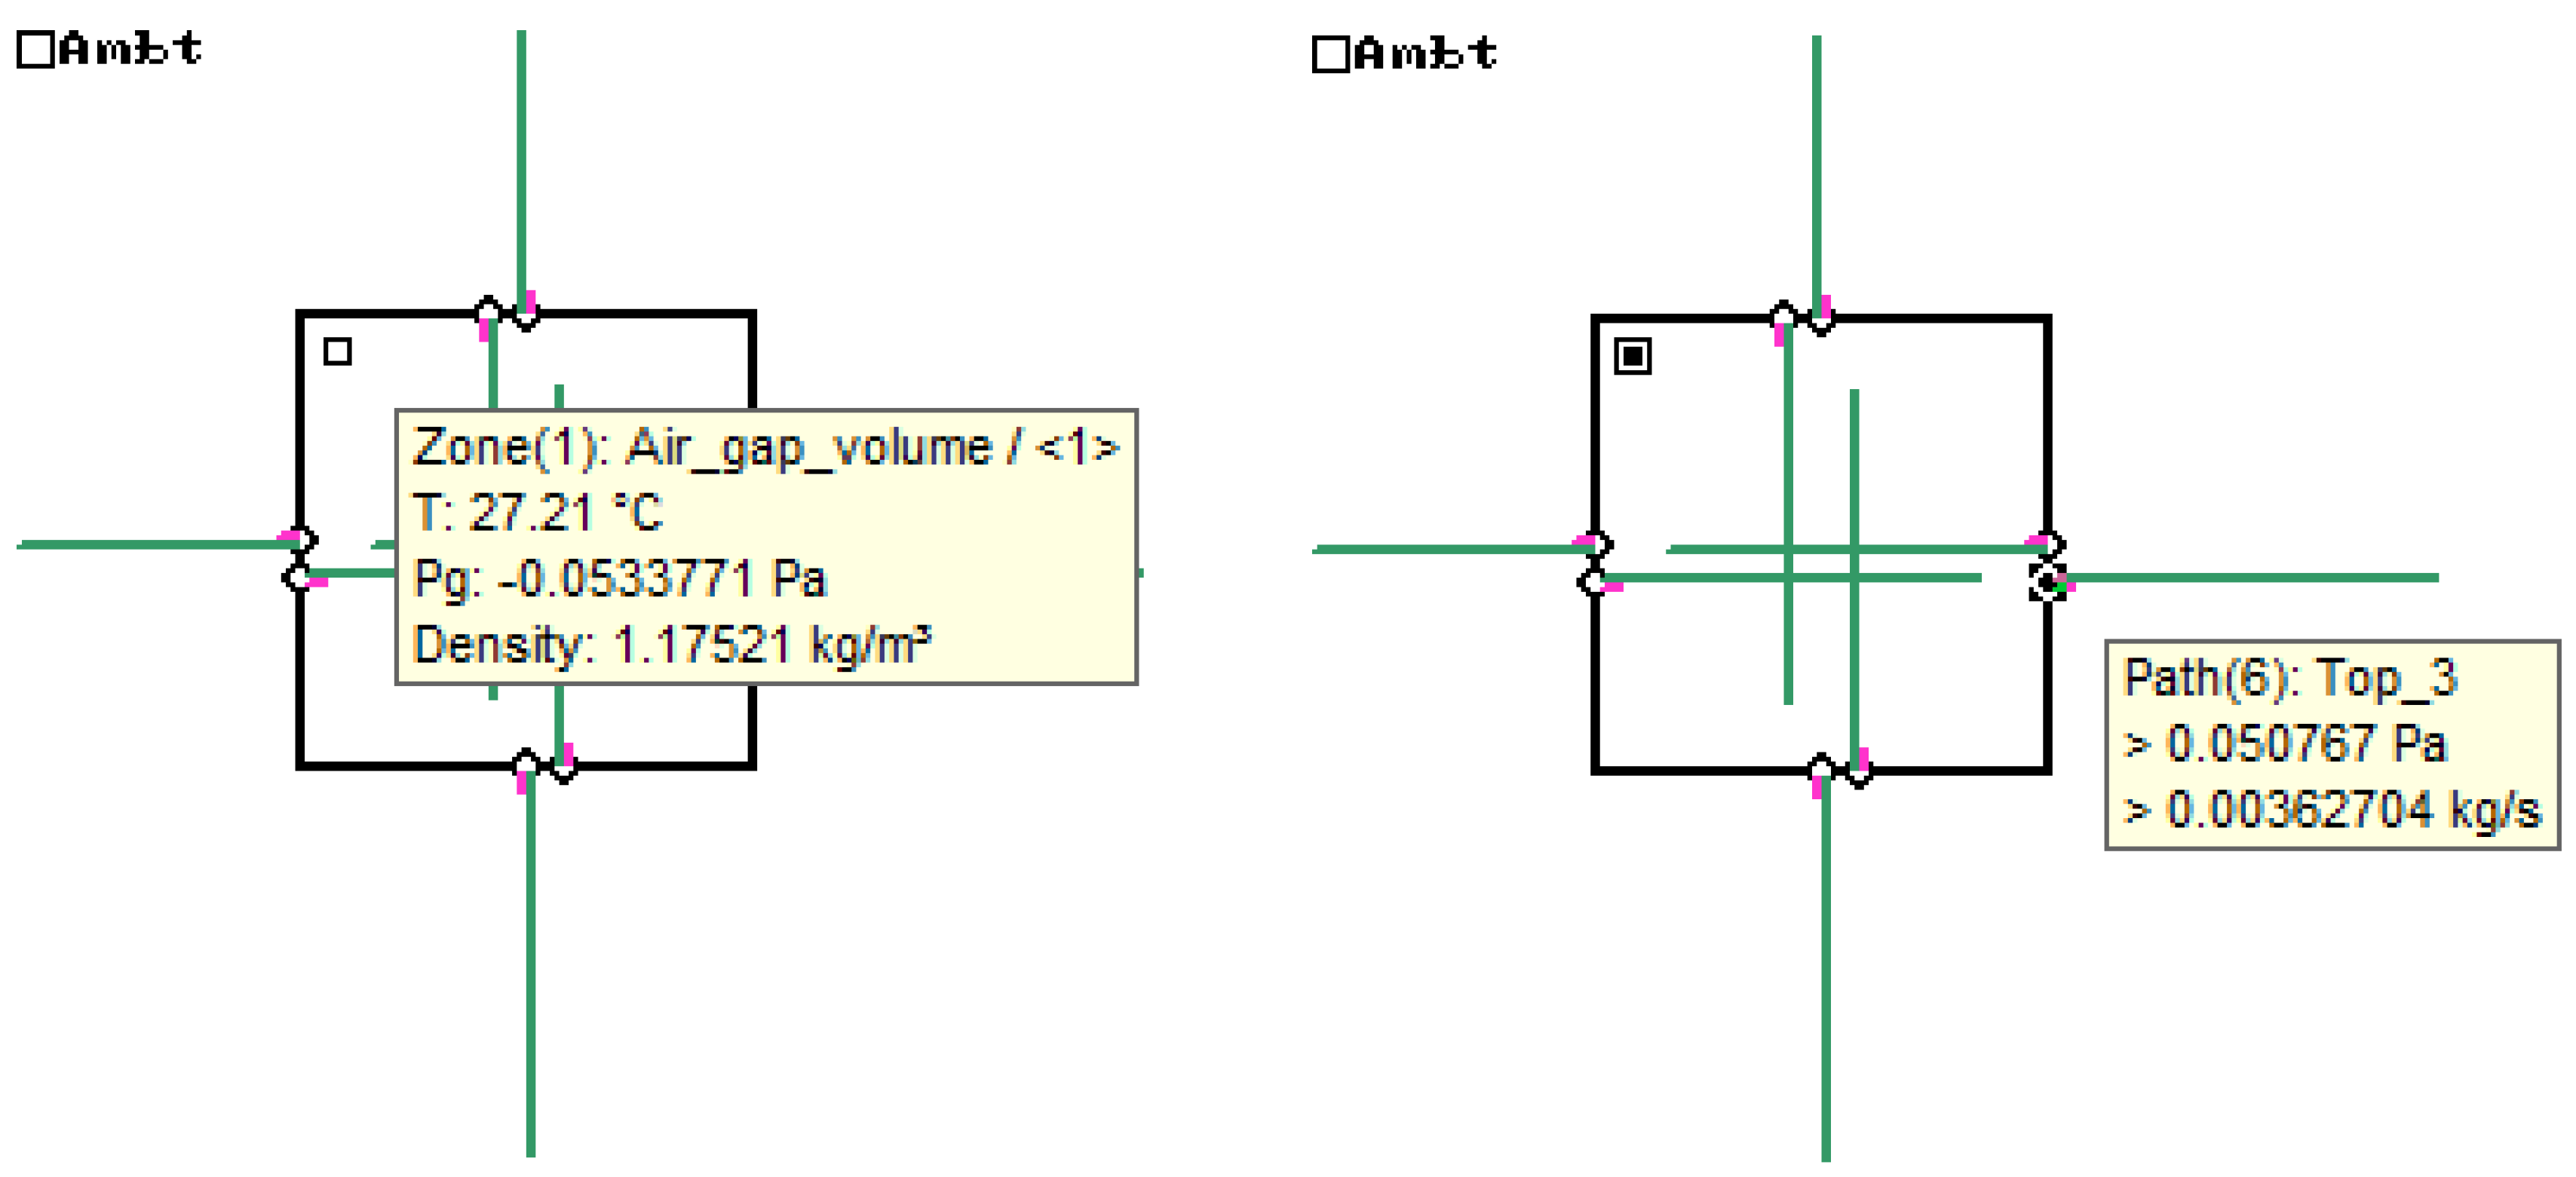
3.2.1. Heat Transfer Analysis Using Software
3.2.2. Heat Transfer Analysis Using Natural Air Mass Flow
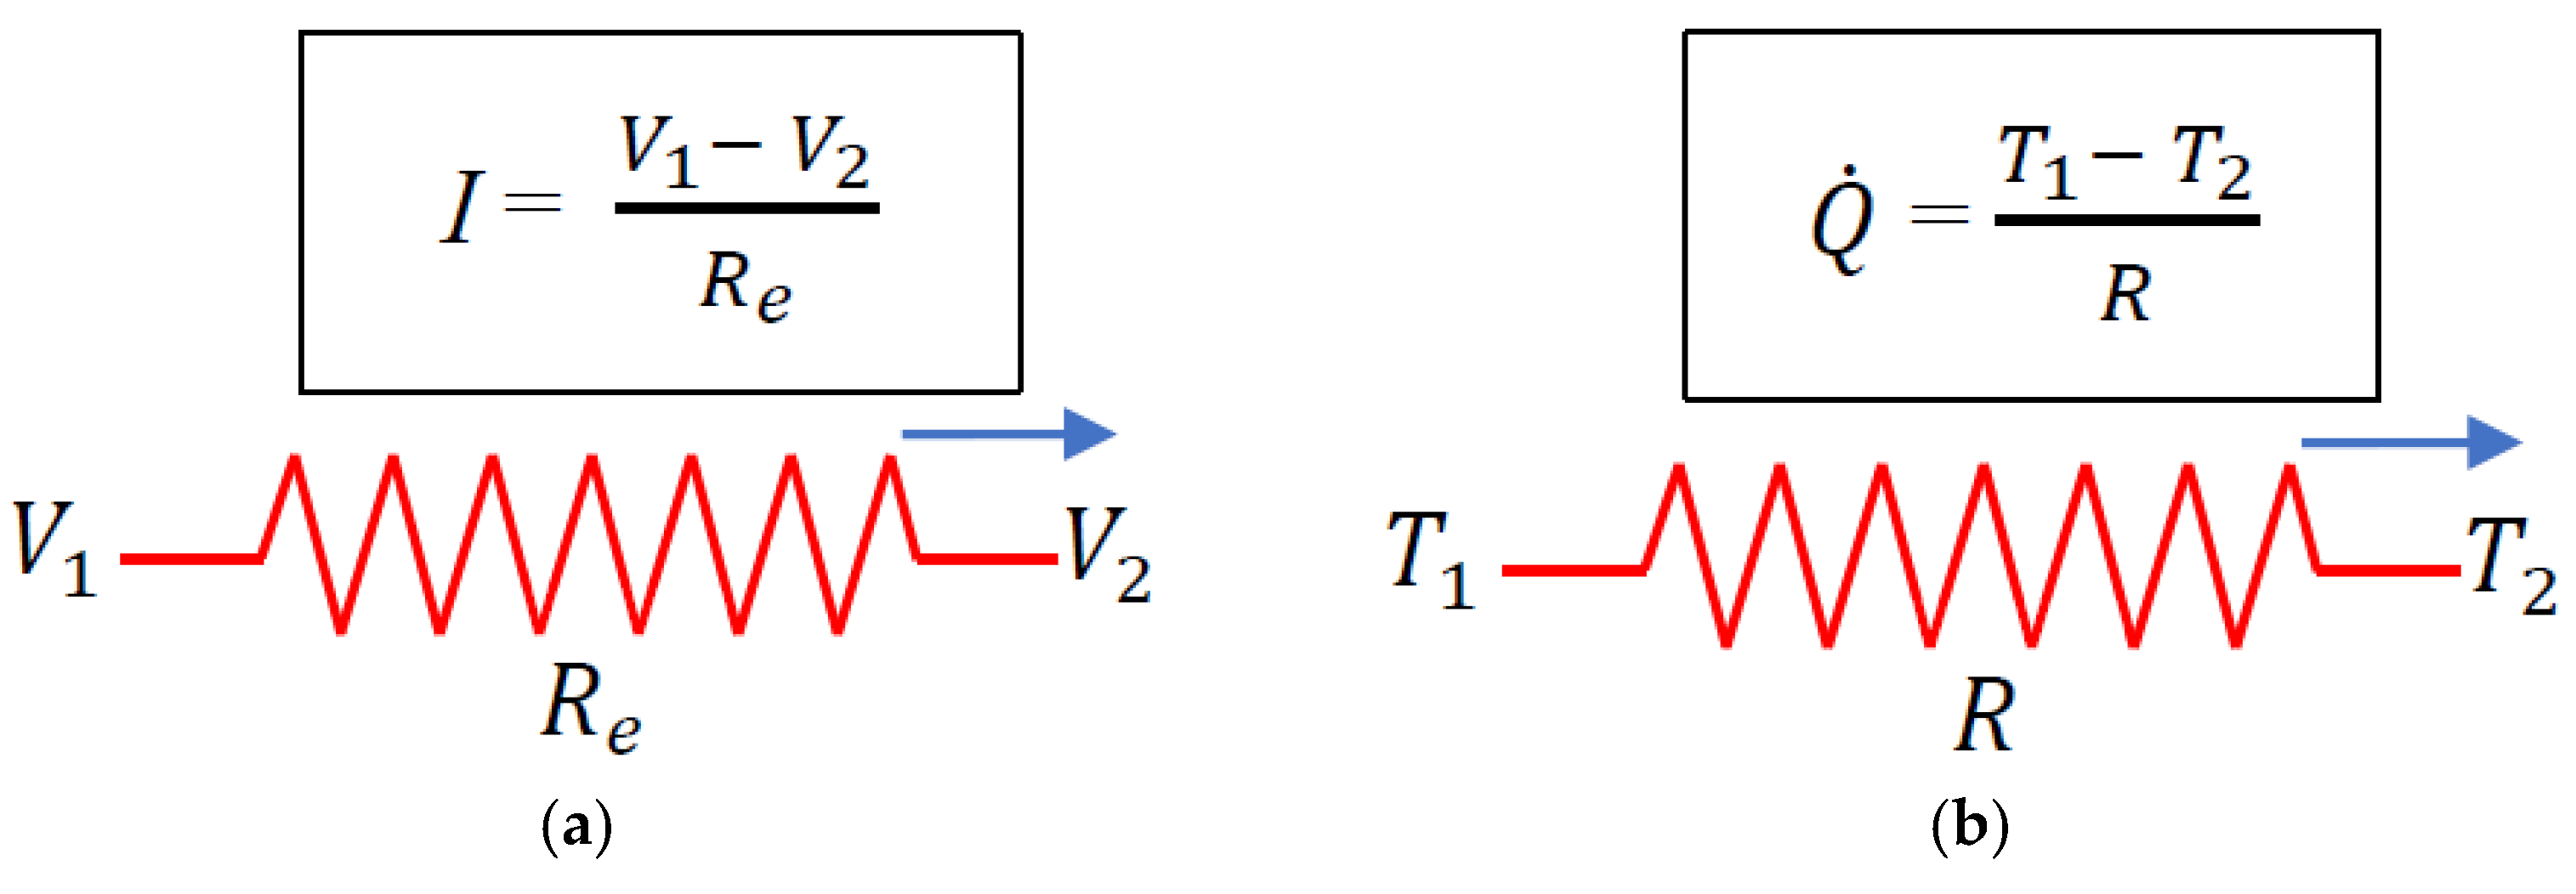
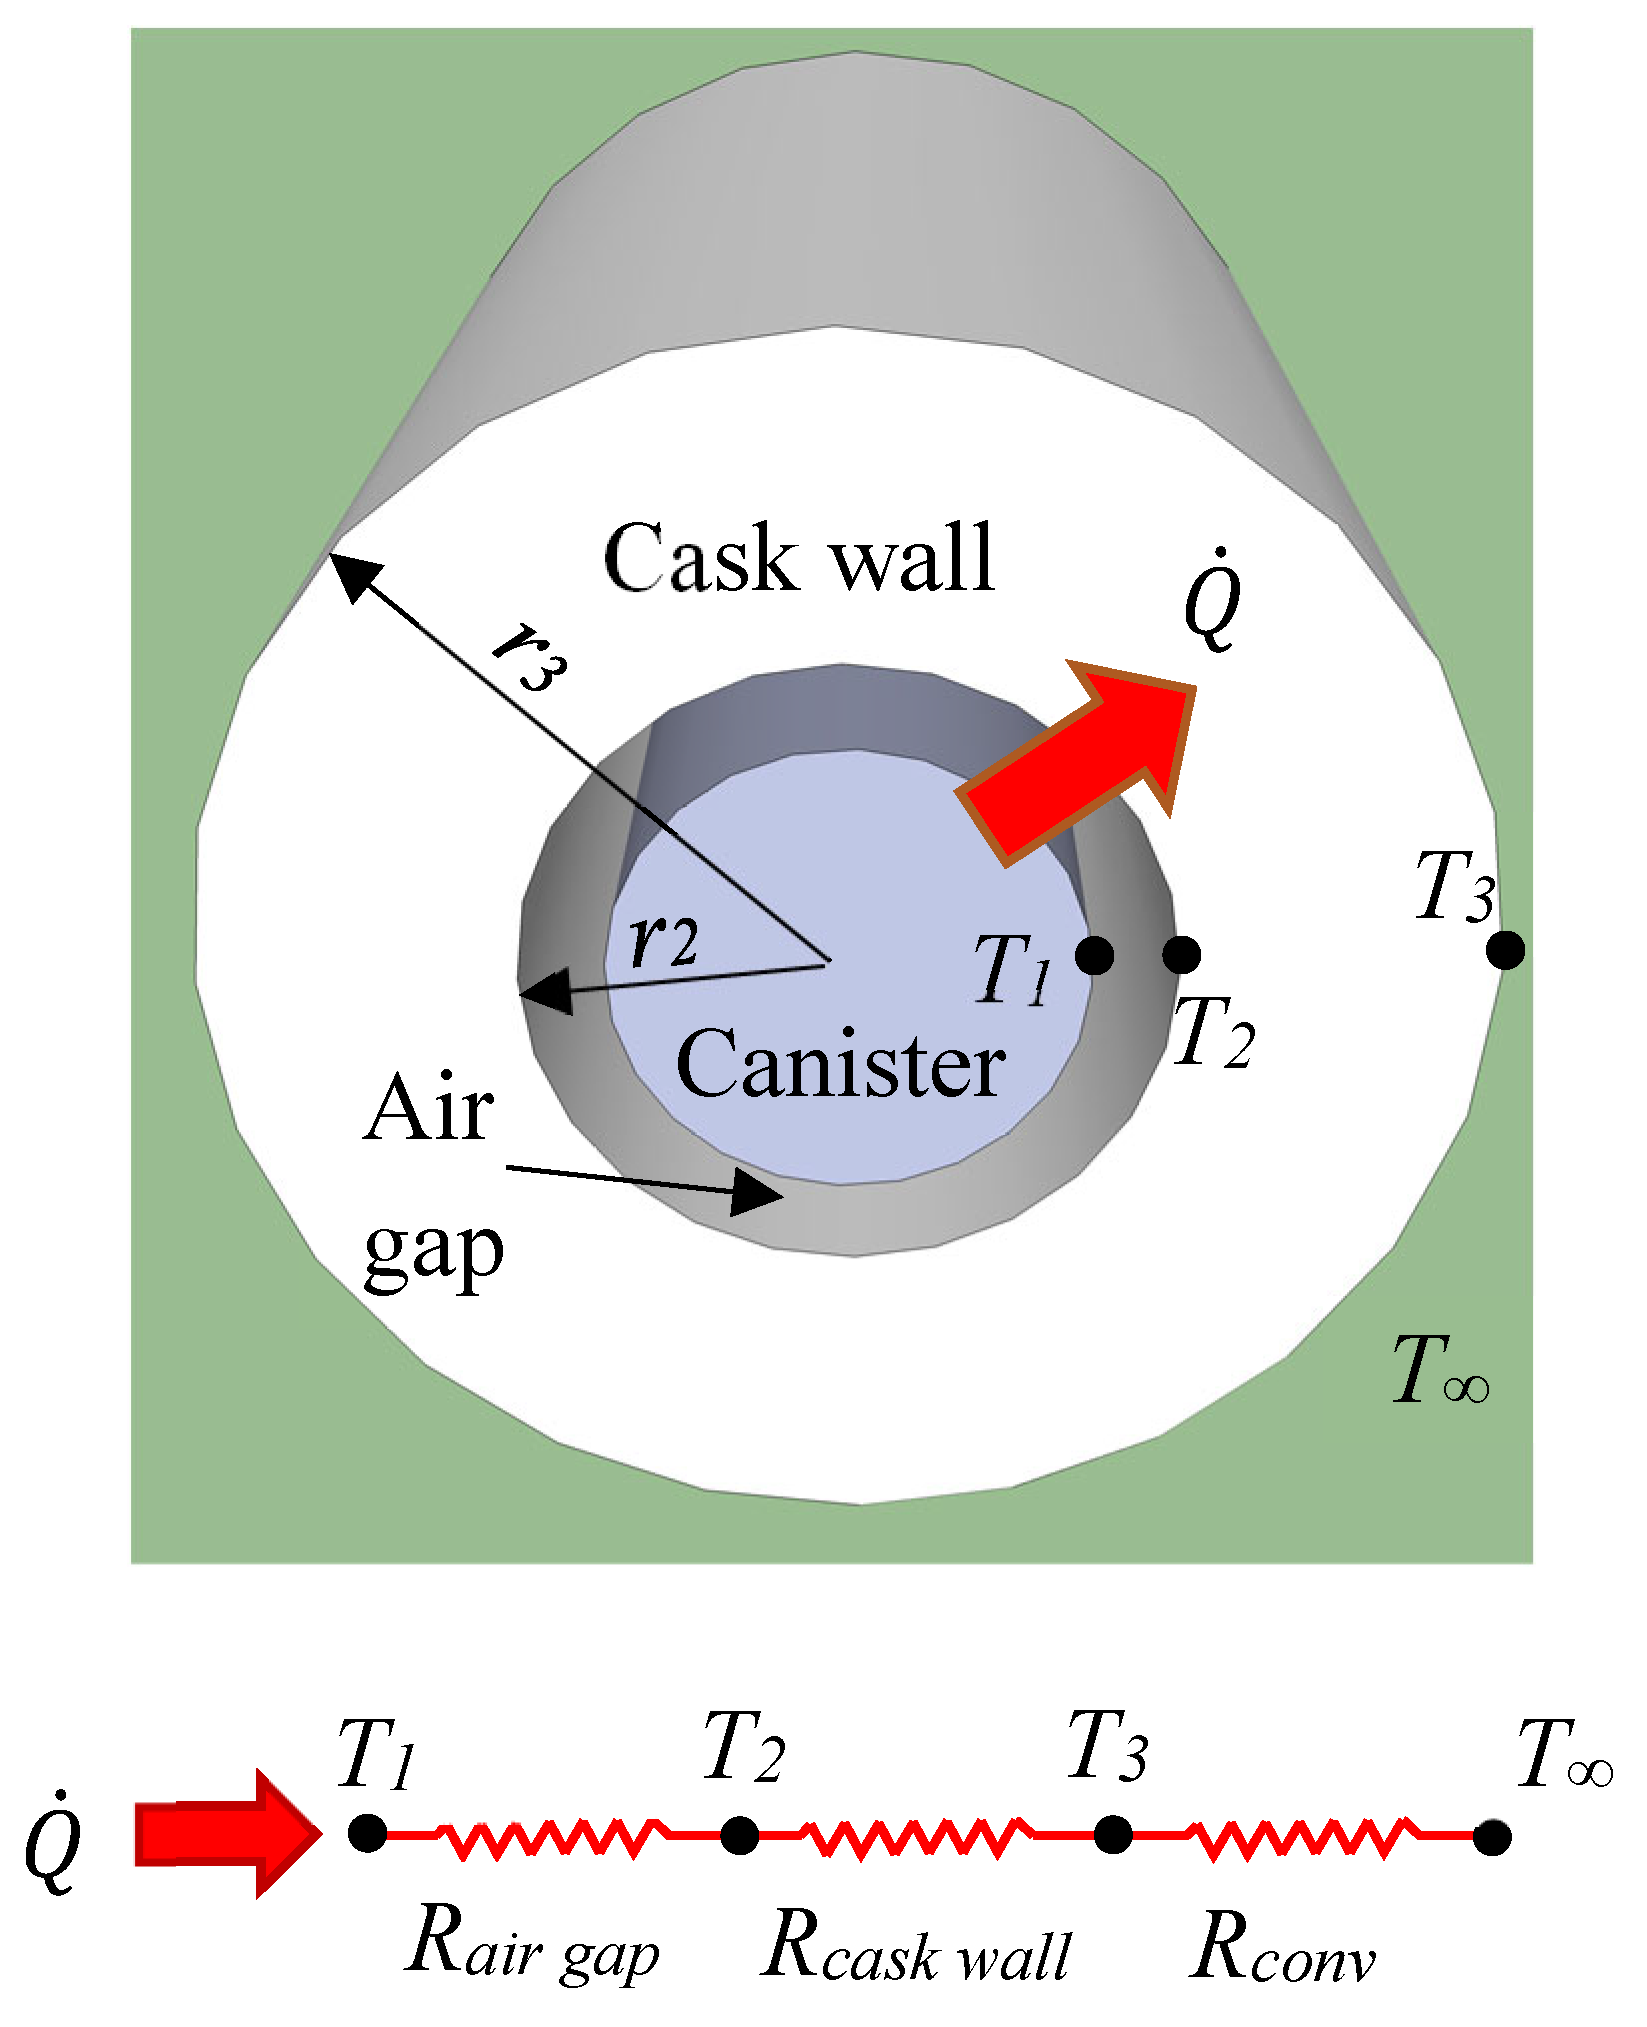
3.2.3. Heat Transfer Analysis Using Thermal Resistance Network
4. Conclusions
Author Contributions
Funding
Institutional Review Board Statement
Informed Consent Statement
Data Availability Statement
Acknowledgments
Conflicts of Interest
References
- Ratiko, R.; Wisnubroto, D.; Nasruddin, N.; Mahlia, T. Current and future strategies for spent nuclear fuel management in Indonesia. Energy Strat. Rev. 2020, 32, 100575. [Google Scholar] [CrossRef]
- Ratiko, R.; Samudera, S.A.; Hindami, R.; Siahaan, A.T.; Naldi, L.; Hapsari, D.; Mahlia, T.M.I.; Nasruddin, N. Optimization of Dry Storage for Spent Fuel from G.A. Siwabessy Nuclear Research Reactor. Int. J. Technol. 2018, 9, 55–67. [Google Scholar] [CrossRef] [Green Version]
- Wahid, A.; Sundari, T.; Ratiko, R. Dynamic modeling and controlling of a spent nuclear fuel storage pool under periodic operation and station blackout conditions. Ann. Nucl. Energy 2022, 166, 108751. [Google Scholar] [CrossRef]
- Matveenko, V.; Varlakov, A.P.; Zherebtsov, A.A.; Germanov, A.V.; Mikheev, I.V.; Kalmykov, S.N.; Petrov, V.G. Natural Clay Minerals as a Starting Material for Matrices for the Immobilization of Radioactive Waste from Pyrochemical Processing of SNF. Sustainability 2021, 13, 10780. [Google Scholar] [CrossRef]
- Park, S.; Lee, J.; Park, M. A Study of Prediction Model Improvement for Air-Oxidation Breakaway in a Postulated Spent Nuclear Fuel Pool Complete Loss of Coolant Accident. Sustainability 2021, 13, 1442. [Google Scholar] [CrossRef]
- Wiss, T.; Dieste, O.; De Bona, E.; Benedetti, A.; Rondinella, V.; Konings, R. SUPERFACT: A Model Fuel for Studying the Evolution of the Microstructure of Spent Nuclear Fuel during Storage/Disposal. Materials 2021, 14, 6538. [Google Scholar] [CrossRef]
- Wheeler, M.; Chvála, O. Molten Salt Reactor Sourdough Refueling and Waste Management Strategy. J. Nucl. Eng. 2021, 2, 471–483. [Google Scholar] [CrossRef]
- Park, C.; Baek, M.K.; Kang, I.-S.; Lee, S.; Chung, H.; Chung, Y.H. Design and characterization of a Muon tomography system for spent nuclear fuel monitoring. Nucl. Eng. Technol. 2021, 54, 601–607. [Google Scholar] [CrossRef]
- Alyokhina, S.; Maksymov, M.V.; Romashov, Y. Evaluation of radioactive material leakage through the fuel cladding as result of diffusion processes during the long-term storage of spent nuclear fuel. J. King Saud Univ. Sci. 2021; in press. [Google Scholar] [CrossRef]
- El-Samrah, M.G.; Tawfic, A.F.; Chidiac, S.E. Spent nuclear fuel interim dry storage; Design requirements, most common methods, and evolution: A review. Ann. Nucl. Energy 2021, 160, 108408. [Google Scholar] [CrossRef]
- Poškas, R.; Šimonis, V.; Jouhara, H.; Poškas, P. Modeling of decay heat removal from CONSTOR RBMK-1500 casks during long-term storage of spent nuclear fuel. Energy 2019, 170, 978–985. [Google Scholar] [CrossRef] [Green Version]
- Kirch, N.; Brinkmann, H.; Brücher, P. Storage and final disposal of spent htr fuel in the federal republic of Germany. Nucl. Eng. Des. 1990, 121, 241–248. [Google Scholar] [CrossRef]
- Yoo, H.S.; Yoo, S.H.; Kim, E.S. Heat transfer enhancement in dry cask storage for nuclear spent fuel using additive high density inert gas. Ann. Nucl. Energy 2019, 132, 108–118. [Google Scholar] [CrossRef]
- Bautista-Valhondo, J.; Batet, L.; Mateo, M. Minimizing the Standard Deviation of the Thermal Load in the Spent Nuclear Fuel Cask Loading Problem. Energies 2020, 13, 4869. [Google Scholar] [CrossRef]
- Chang, H.-Y.; Chen, R.-H.; Lai, C.-M. Numerical Simulation of the Thermal Performance of a Dry Storage Cask for Spent Nuclear Fuel. Energies 2018, 11, 149. [Google Scholar] [CrossRef] [Green Version]
- Li, J.; Liu, Y.Y. Thermal modeling of a vertical dry storage cask for used nuclear fuel. Nucl. Eng. Des. 2016, 301, 74–88. [Google Scholar] [CrossRef] [Green Version]
- Bang, K.-S.; Yu, S.-H.; Lee, S.-H.; Lee, J.-C.; Seo, K.-S. Experimental investigation of heat removal performance of a concrete storage cask. Ann. Nucl. Energy 2015, 85, 679–686. [Google Scholar] [CrossRef]
- Alyokhina, S. Thermal state of ventilated storage container with spent nuclear fuel under normal operation. Int. J. Nucl. Energy Sci. Technol. 2019, 13, 381–398. [Google Scholar] [CrossRef]
- Miller, R.F.; Sindelar, R.L. Analysis for Materials Test Reactor (MTR Fuel Assemblies in Dry Storage); National Technical Information Service—U.S. Department of Commerce: Springfield, VA, USA, 1999.
- Badan Tenaga Nuklir Nasional. Safety Analysis Report (SAR) RSG-GAS; Revision 11; PRSG-BATAN: Banten, Indonesia, 2011. [Google Scholar]
- Cengel, Y.; Heat, T.M. Heat Transfer: A Practical Approach; Mc-Graw Hill Education: Columbus, GA, USA, 2003. [Google Scholar]
- Cengel, Y.A.; Ghajar, A.J. Heat and Mass Transfer: Fundamentals and Applications; McGraw-Hill: New York, NY, USA, 2015. [Google Scholar]
- Ratiko; Moriizumi, J.; Yamazawa, H.; Nasruddin. Quantification of the impact of temperature difference between two connected indoor spaces on 222Rn concentration. Build. Environ. 2019, 149, 322–329. [Google Scholar] [CrossRef]
- Parsons, R. ASHRAE Handbook-Fundamentals; American Society of Heating Refrigerating and Air-Conditioning Engineers: Atlanta, GA, USA, 1997. [Google Scholar]
- Walton, G.N.; Walton, G.N. CONTAM 2.4 User Guide and Program Documentation; US Department of Commerce—National Institute of Standards and Technology: Gaithersburg, MD, USA, 2005.
- Etheridge, D. Natural Ventilation of Buildings: Theory, Measurement and Design; John Wiley & Sons: Hoboken, NJ, USA, 2011. [Google Scholar]


| Heater Voltage | |||
|---|---|---|---|
| 100 V open vents | 48 Watt | 42.70 Watt | 30.59 Watt |
| 125 V open vents | 75 Watt | 58.55 Watt | 45.01 Watt |
| 125 V half-closed vents | 75 Watt | 57.44 Watt | 48.29 Watt |
Publisher’s Note: MDPI stays neutral with regard to jurisdictional claims in published maps and institutional affiliations. |
© 2022 by the authors. Licensee MDPI, Basel, Switzerland. This article is an open access article distributed under the terms and conditions of the Creative Commons Attribution (CC BY) license (https://creativecommons.org/licenses/by/4.0/).
Share and Cite
Ratiko, R.; Sumarbagiono, R.; Aisyah, A.; Wati, W.; Heriyanto, K.; Mirawaty, M.; Artiani, P.A.; Purwanto, Y.; Saputra, D.L.I.; Rachmadetin, J.; et al. Theoretical and Experimental Analysis on Influence of Natural Airflow on Spent Fuel Heat Removal in Dry Cask Storage. Sustainability 2022, 14, 1859. https://doi.org/10.3390/su14031859
Ratiko R, Sumarbagiono R, Aisyah A, Wati W, Heriyanto K, Mirawaty M, Artiani PA, Purwanto Y, Saputra DLI, Rachmadetin J, et al. Theoretical and Experimental Analysis on Influence of Natural Airflow on Spent Fuel Heat Removal in Dry Cask Storage. Sustainability. 2022; 14(3):1859. https://doi.org/10.3390/su14031859
Chicago/Turabian StyleRatiko, Ratiko, Raden Sumarbagiono, Aisyah Aisyah, Wati Wati, Kuat Heriyanto, Mirawaty Mirawaty, Pungky Ayu Artiani, Yuli Purwanto, Dwi Luhur Ibnu Saputra, Jaka Rachmadetin, and et al. 2022. "Theoretical and Experimental Analysis on Influence of Natural Airflow on Spent Fuel Heat Removal in Dry Cask Storage" Sustainability 14, no. 3: 1859. https://doi.org/10.3390/su14031859