
Multitemporal Total Coliforms and Escherichia coli Analysis in the Middle Bogotá River Basin, 2007–2019

 ,
,  ,
,  , and
, and 
Abstract
:1. Introduction
2. Materials and Methods
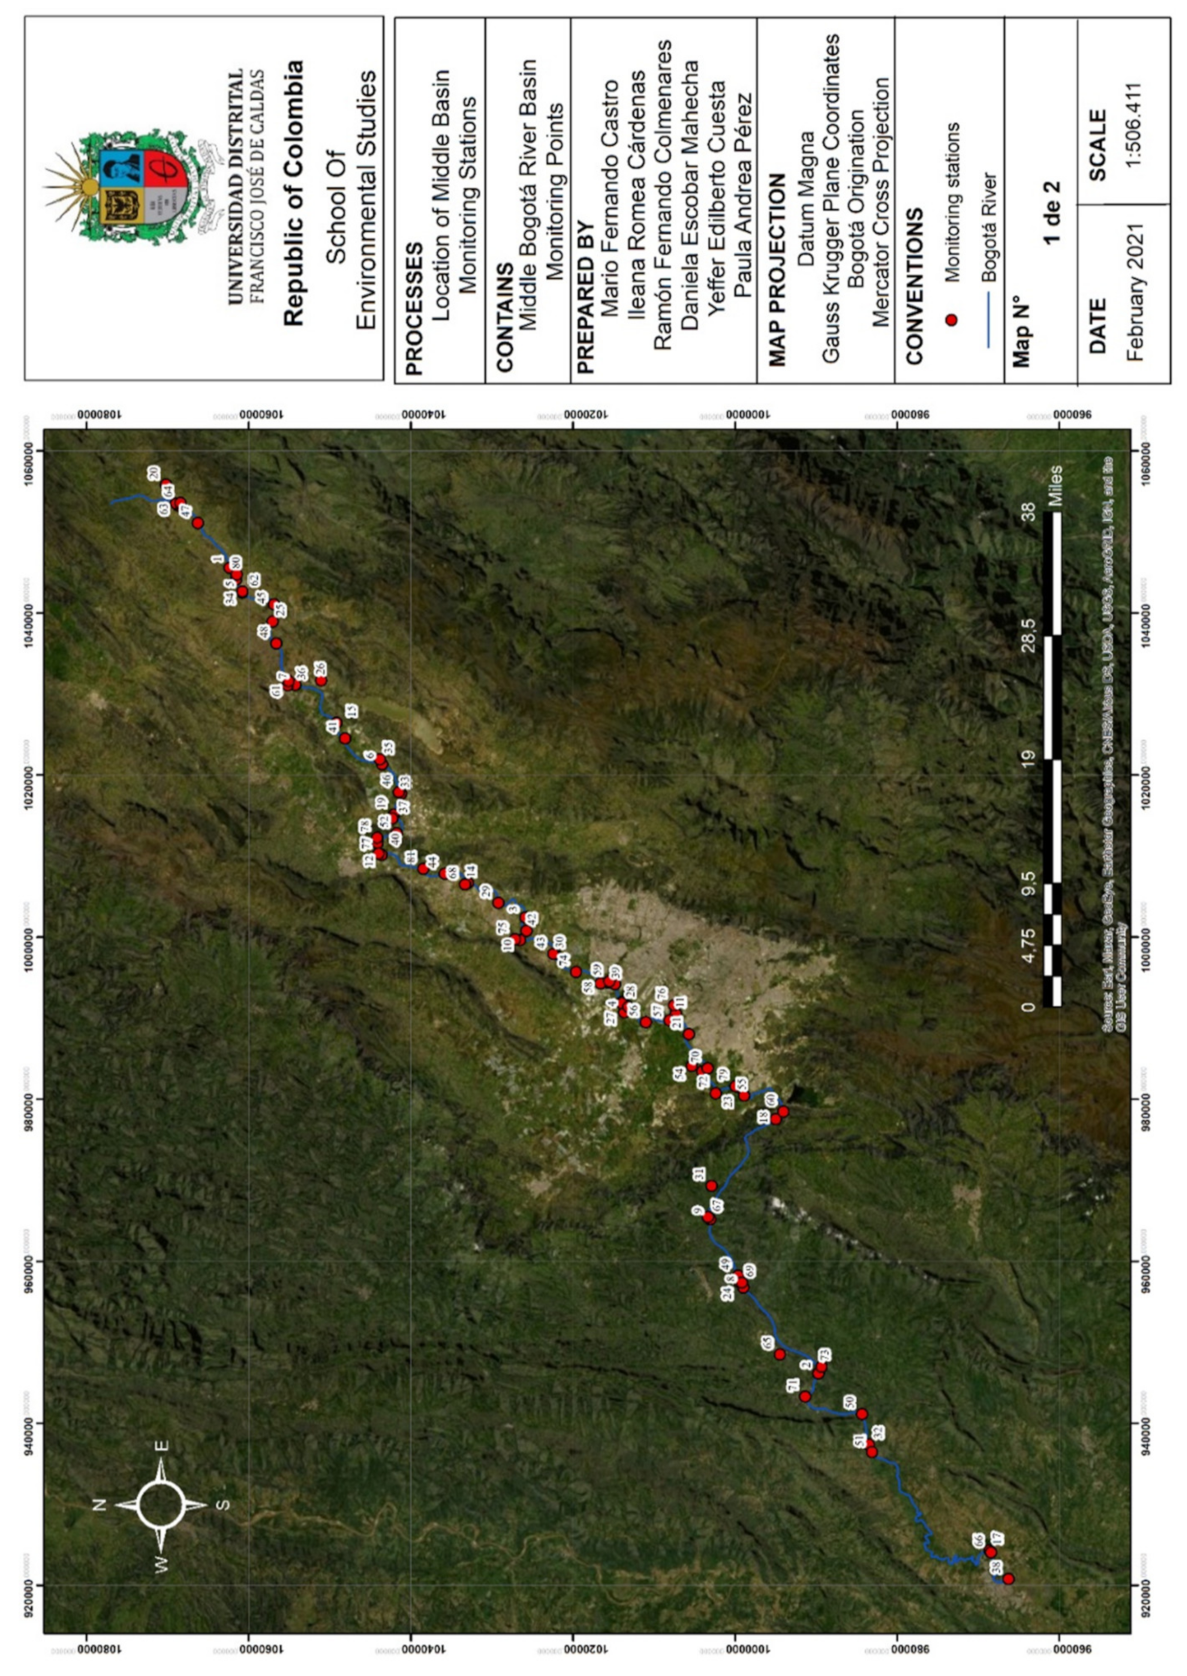
2.1. Study Area
2.2. Station Sampling Design
3. Results
4. Discussion
5. Conclusions
Author Contributions
Funding
Institutional Review Board Statement
Informed Consent Statement
Data Availability Statement
Acknowledgments
Conflicts of Interest
Appendix A

References
- UNESCO. Informe Mundial de las Naciones Unidas sobre el Desarrollo de los Recursos Hídricos 2019. No Dejar a Nadie Atrás. París, France, 2019. Available online: https://es.unesco.org/water-security/wwap/wwdr/2019 (accessed on 15 January 2020).
- Yang, H.J.; Jeong, H.J.; Bong, K.M.; Jin, D.R.; Kang, T.-W.; Ryu, H.-S.; Han, J.H.; Yang, W.J.; Jung, H.; Hwang, S.H.; et al. Organic matter and heavy metal in river sediments of southwestern coastal Korea: Spatial distributions, pollution, and ecological risk assessment. Mar. Pollut. Bull. 2020, 159, 111466. [Google Scholar] [CrossRef]
- Parra Cortés, R. La Agenda 2030 y sus Objetivos de Desarrollo Sostenible: Antecedentes y perspectivas para promover el consumo y la producción sostenibles en Chile. Rev. Derecho Ambient 2018, 10, 99–121. [Google Scholar] [CrossRef]
- Mayorga, M. El Agua y el Río Bogotá Articuladores del Territorio′ Panoramas Discontinuos entre Fragmentos de Gestión e Ilusiones de Recuperación. 2010, Volume 1, pp. 1–7. Available online: http://artes.bogota.unal.edu.co/assets/arquitectura-territorio/docs/01_EL_AGUA_Y_EL_RIO_BOGOTA_COL.pdf (accessed on 7 January 2020).
- Ulises Reyes-Gómez, G.C.; Hernández, K.; Calderón, L.; Velázquez, A.; Becerra, M.; Arce, P.; Huerta, J.; Arza, C.; Quero, A. Enfermedad diarreica aguda en niños. Trib. Méd. 2018, 85, 55–58. [Google Scholar]
- Ministerio de Ambiente Vivienda y Desarrollo Territorial. Resolución 1433 de 2004: Por la Cual se Reglamenta el Artículo 12 del Decreto 3100 de 2003, Sobre Planes de Saneamiento y Manejo de Vertimientos, PSMV, y Se Adoptan Otras Determinaciones; Ministerio de Ambiente Vivienda y Desarrollo Territorial: Bogota, Colombia, 2004; p. 3.
- Procuraduría Delegada para Asuntos Ambientales y Agrarios. Análisis Sistémico de Seguimiento y Control de Gestión En La Zona de Reserva de Biosfera (Zrb) Seaflower, y del Plan San Andrés como Estrategia Emprendida por el Gobierno Nacional Frente al Fallo de la Haya. 2015. Available online: https://www.procuraduria.gov.co/portal/media/file/InformeSA.pdf (accessed on 25 January 2020).
- Ministerio de Ambiente y Desarrollo Sostenible. Diagnostico Nacional de Salud Ambiental. Bogota, Columbia, 2012; p. 368. Available online: https://www.minsalud.gov.co/sites/rid/Lists/BibliotecaDigital/RIDE/INEC/IGUB/Diagnostico%20de%20salud%20Ambiental%20compilado.pdf (accessed on 3 February 2020).
- Esteban-Altabella, J.; Szanto, M.; Colomer-Mendoza, J.F.; Gallardo, A. Análisis del Deslizamiento del Relleno Sanitario de Santa Marta, Chile. In Proceedings of the 13th Congreso Nacional del Medio Ambiente, Madrid, Spain, 28 November–1 December 2016; p. 21. [Google Scholar]
- Navarro, M.O. Determinación de Escherichia coli Y coliformes totales en agua por el metodo de filtraciòn por membrana en Agar Chromocult. Ideam 2007, 3, 2–3. [Google Scholar]
- Ramos-Ortega, L.M.; Vidal, L.A.; Sandra, V.Q.; Saavedra-Díaz, L. Análisis de la contaminación microbiológica (coliformes totales y fecales) en la Bahía de Santa Marta, Caribe Colombiano. Acta Biol. Colomb. 2010, 13, 87–98. [Google Scholar]
- Olivas-Enriquez, E.; Flores-Margez, J.P.; Serrano-Alamillo, M.; Soto-Mejía, E.; Iglesias-Olivas, J.; Salazar-Sosa, E.; Fortis-Hernández, M. Fecal indicators and pathogens in water discharged into the Rio Grande. Terra Lationoam. 2011, 29, 449–457. Available online: http://www.scielo.org.mx/scielo.php?script=sci_arttext&pid=S0187-57792011000400449 (accessed on 4 February 2020).
- Alarcón, M.A.; Beltrán, M.; Cárdenas, M.L.; Campos, M.C. Recuento y determinación de viabilidad de giardia spp. y Cryptosporidium spp. en aguas potables y residuales en la cuenca alta del rio Bogotá. Rev. Bioméd. 2005, 25, 353–365. [Google Scholar] [CrossRef] [Green Version]
- Ramírez, V.G.; Bustamante, M.A.; Sarmiento, C.A. Guia de Atencion de la Enfermedad Diarreica Aguda; No. Dirección General de Promoción y Prevención; Ministerio de Salud Republica Colombia: Bogota, Columbia, 2015; p. 30.
- Arteta Peña, Y.; Moreno Pino, M.; Steffanell De León, I. La Gestión Ambiental de la Cuenca del Río Magdalena desde un Enfoque Socialmente Responsible. Amauta 2015, 13, 193–218. [Google Scholar]
- Mancera Rodríguez, N.J.; Rodríguez Sánchez, L. Río Grande de la Magdalena: Recurso estratégico para el desarrollo colombiano. Econ. Colomb. Coyunt. Política 2002, 292, 83–91. [Google Scholar]
- Ospina, O. Evaluación de la Calidad Microbiológica del Rio Magdalena y Su Potencial Uso en a Provincia del Alto Magdalena; Gestión Calidad, Desarrollo; Facultad de Ingenieria: Bogota, Columbia, 2018; pp. 1–10. Available online: https://acofipapers.org/index.php/eiei/article/view/670/675 (accessed on 18 February 2020).
- Ospina, O.; Zúñiga, E.; Murillo Vargas, F.J.; Toro, M.K. Impact of the Bogotá River on the microbiological quality of the water of the Magdalena River, municipality of Flandes (Tolima). Rev. Luna Azul 2018, 47, 114–128. [Google Scholar] [CrossRef]
- Procuraduria Delegada para Asuntos Ambientales y Agrarios. Río Magdalena: Informe Social, Económico y Ambiental; Informe Preventivo, No, 8; Procuraduria Delegada para Asuntos Ambientales y Agrarios: Barranquilla, Colombia, 2013; Volume 1. [Google Scholar]
- Contraloría de Bogotá. Avances En El Cumplimiento de La Sentencia Río Bogotá. 2019. Available online: http://www.contraloriabogota.gov.co/sites/default/files/Contenido/Informes/Estructurales/Ambiente/AVANCES%20EN%20EL%20CUMPLIMIENTO%20DE%20LA%20SENTENCIA%20R%C3%8DO%20BOGOT%C3%81.pdf (accessed on 26 January 2020).
- Observatorio de Salud de Bogotá. Pirámide Poblacional en Bogota SALUDATA. 2021. Available online: https://saludata.saludcapital.gov.co/osb/index.php/datos-de-salud/demografia/piramidepoblacional/ (accessed on 18 January 2020).
- Castillo, Y.M.B.; Fontalvo, J.A.L.; Borja, I.M.R. Bacteriological quality of the water of the manaure and casacara rivers, department of Cesar, Colombia. Rev. Luna Azul 2018, 46, 106–124. [Google Scholar] [CrossRef]
- Mercedes, N.; Larrea-Murrell, J.A.; Rojas, B.M.M.; Romeu, A.B.; Heydrich, P.M.R.M. Bacterias indicadoras de contaminación fecal en la evaluación de la calidad de las aguas: Revisión de la literature. Rev. CENIC Cienc. Biológicas 2013, 44, 24–34. [Google Scholar]
- Instituto de Hidrología, Meteorología y Estudios Ambientales (IDEAM). Estudio Nacional del Agua 2014; Primera: Bogotá, Colombia, 2014. [Google Scholar]
- DeBoer, J.A.; Thoms, M.C.; Delong, M.D.; Parsons, M.E.; Casper, A.F. Heterogeneity of ecosystem function in an “Anthropocene’ river system”. Anthropocene 2020, 31, 100252. [Google Scholar] [CrossRef]
- Jaiswal, D.; Pandey, J. River ecosystem resilience risk index: A tool to quantitatively characterize resilience and critical transitions in human-impacted large rivers. Environ. Pollut. 2020, 1, 115771. [Google Scholar] [CrossRef]
- Secretaria Distrital de Planeacion de Bogotá. Aproximacion a las Implicaciones del Fallo del Consejo de Estado sobre el Rio de Bogotá en el Ordenamiento Territorial de Regional; Primera, No. 15; Alcaldía Mayor de Bogotá: Bogotá, Colombia, 2014. [Google Scholar]
- Piña, W.H.A.; Martínez, C.I.P. Urban material flow analysis: An approach for Bogotá, Colombia. Ecol. Indic. 2014, 42, 32–42. [Google Scholar] [CrossRef]
- Instituto De Hidrología Meteorología y Estudios Ambientales (IDEAM). Cartilla Ena 2018. Reporte de Avance del Estudio Nacional del Agua 2018. 2018. Available online: http://www.ideam.gov.co/documents/24277/76321271/Cartilla+ENA+2018+WEB+actualizada.pdf/ba353c39-b15d-4a76-8ed4-3814c4c35239 (accessed on 4 March 2020).
- Corporación Autónoma Regional de Cundinamarca. Informe De Seguimiento Sentencia Río Bogotá, 2nd ed.; No. 7; Corporación Autónoma Regional de Cundinamarca: Bogotá, Colombia, 2018. [Google Scholar]
- Castro Fernández, M.F.; Cárdenas Manosalva, I.R.; Montenegro Marin, C.E.; Diaz Casallas, D.M.; Agudelo Valencia, R.N.; Díaz Cuestas, Y.E.; Escobar Mahecha, D. Multitemporal Analysis of Total Coliforms and Escherichia coli in the Upper Basin of the Bogota River (2007 to 2017). Artic J. 2020, 73, 39–52. Available online: https://www.arcticjournal.org/show.php?v=73&i=8 (accessed on 29 February 2021).
- Corporación Autónoma Regional de Cundinamarca. CAR|Río Bogotá. 2018. Available online: https://www.car.gov.co/rio_bogota (accessed on 2 May 2021).
- Orellana, L. Etapas de Una Investigación Descriptiva e Inferencial. Buenos Aires, Argentina, 2004. Available online: http://www.dm.uba.ar/materias/probabilidades_estadistica_C/2004/1/PyEC12.pdf (accessed on 13 February 2020).
- Londoño, A.E. Integración Urbana del Rio Fucha Caso Específico Tramo 1. 2014, p. 349. Available online: http://www.bdigital.unal.edu.co/46542/ (accessed on 8 March 2020).
- Secretaría Distrital de Ambiente and Empresa de Acueducto y Alcantarillado de Bogotá. Calidad del Sistema Hídrico de Bogotá; Primera: Bogotá, Columbia, 2008. [Google Scholar]
- Organización Mundial de la Salud. WHO Guidelines for Drinking Water Quality; No. 3; Organización Mundial de la Salud: Geneva, Switzerland, 2006; Volume 1. [Google Scholar]
- WWAP. Informe Mundial de las Naciones Unidas sobre el Desarrollo de los Recursos Hídricos 2017. Aguas Residuales: El Recurso Desaprovechado; A Organización de las Naciones Unidas para la Educación, la Ciencia y la Cultura: Paris, France, 2017; Volume 1. [Google Scholar]
- Borja-Serrano, P.; Ochoa-Herrera, V.; Maurice, L.; Morales, G.; Quilumbaqui, C.; Tejera, E.; Machado, A. Determination of the microbial and chemical loads in rivers from the Quito capital province of Ecuador (Pichincha)—A preliminary analysis of microbial and chemical quality of the main rivers. Int. J. Environ. Res. Public Health 2020, 17, 5048. [Google Scholar] [CrossRef]
- Corporación Autónoma Regional (CAR) and Planeación Ecológica Ltda. Elaboración del Diagnóstico, Prospectiva y Formulación de la Cuenca Hidrográfica del Río Bogotá, Subcuenca del río Balsillas-2120-08; Corporación Autónoma Regional: Bogotá, Colombia, 2006; p. 516. [Google Scholar]
- Puentes, C.; Lady, R. Evaluación de La Gestión del Recurso Hídrico Urbano a Partir de La Metodología City Blueprints: 24 Indicators to Assess the Sustainability of the Urban Water Cycle En El Municipio de Cajicá Cundinamarca; Universidad Santo Tomás: Bogotá, Columbia, 2019; Volume 26, No. 8. [Google Scholar]
- Aguilar Ramírez, D.O. Valoración del Costo Ambiental de La Contaminación Generada Por Aguas Residuales En El Municipio de Chía. Su Efecto En El Cambio del Precio de Las Viviendas; Universidad Nacional de Colombia: Bogotá, Colombia, 2019. [Google Scholar]
- Grazon, B.A.J. Estudios Diseños, Construcción y Puesta En Marcha de La Nueva Planta de Tratamiento de Aguas Residuales Ptar Chía I Chía. 2020. Available online: https://www.chia-cundinamarca.gov.co/2020/planeaciondir/MGA%20PROYECTOS%202016-2020/Ambiente/Estudios,%20dise%C3%B1os,%20construcci%C3%B3n%20y%20puesta%20en%20marcha%20de%20la%20nueva%20planta%20de%20tratamiento%20de%20aguas%20residuales%20ptar%20ch%C3%ADa%20I.pdf (accessed on 17 April 2021).
- Corporación Autónoma Regional (CAR). PTAR Chía II, la Obra que Saneará las aguas Residuales del 70% de Esa Ciudad|CAR. 2019. Available online: https://www.car.gov.co/saladeprensa/ptar-chia-ii-la-obra-que-saneara-las-aguas-residuales-del-70-de-esa-ciudad (accessed on 1 March 2021).
- EAAB; Universidad Nacional de Colombia. Modelación Dinámica de la Calidad del Agua del Río Bogotá-Entendimiento de la Dinámica de la Calidad del Agua del Río Bogotá y Diseño de Campañas de Medición de la Calidad del Agua; Universidad Nacional de Colombia: Bogotá, Colombia, 2009; p. 76. [Google Scholar]
- Toussaint Jimenez, N. Determinación de un Índice Global de Autodepuración Para Ríos de Montaña a Partir de Calidad de Agua y Características Hidro-Topográficas; Universidad Católica De Colombia: Bogotá, Colombia, 2019. [Google Scholar]
- Soler López, M.P. El Río Frío En El Municipio de Chía. Un Lugar de Representaciones en Tensión, de Dominación y Resistencia; Universidad Externado de Colombia: Bogotá, Colombia, 2018; Available online: https://bdigital.uexternado.edu.co/handle/001/1442 (accessed on 8 July 2021).
- Poloche Rojas, V. Revisión de La Documentación Existentes Sobre Las Áreas de Protección de La Zona de Influencia del Rio Frio En Chía y Rio Torca En El Norte de Bogotá; Universidad Militar Nueva Granada: Bogotá, Colombia, 2015. [Google Scholar]
- Consejo Municipal de Chía. Acuerdo 100 POT 2016. Por medio del cual se adopta la revisión general y ajustes al plan de ordenamiento territorial-POT-del municipio de Chía–Cundinamarca, adoptado mediante acuerdo 17 de 2000. In Acta de Posesión Consejeros Consultivos de Ordenamiento Municipio de Chía; Alcaldía Municipal de Chía: Chía, Colombia, 2016; p. 205. [Google Scholar]
- Municipio de Cota and Unión Temporal Unidos Creando Conciencia Ambiental. Agenda Ambiental 2020–2031 Perfil Ambiental y Plan de Acción; No. 1; María A. Granados: Cota, Colombia, 2019; pp. 1–280. [Google Scholar]
- Mejía, L.E.; Pérez, L.P. Análisis del Estado de Las Plantas de Tratamiento de Agua Residual de La Cuenca Alta del Río Bogotá Dentro de La Jurisdicción de La CAR; Universidad De La Salle: Bogotá, Colombia, 2017. [Google Scholar]
- Moreno Barrera, A.C.; Florez Esguerra, E.A. Estrategias de Diseño y Planificación Urbano Regional En La Metropolización de La Sabana de Bogotá. Caso: Conurbación Corredor Noroccidente Bogotá-Cota-Chía-Cajicá; Universidad La Gran Colombia: Bogotá, Colombia, 2018. [Google Scholar]
- Mora Ardila, L.A. Corredor Industrial de Occidente: Nuevo Modelo de Industrializacion; Universidad Nacional de Colombia: Bogotá, Colombia, 2012. [Google Scholar]
- Corporación Autónoma Regional de Cundinamarca CAR. Boletin Hidrometeorológico Estaciones Río Bogotá Jurisdicción-CAR. 2019. Available online: http://www.car.gov.co/vercontenido/3721 (accessed on 23 August 2021).
- Municipio de Tabio. Plan de Desarrollo “Tabio Compromiso de Todos” 2016–2019; Municipio de Tabio: Tabio, Colombia, 2016; pp. 1–669. [Google Scholar]
- Mateus González, D.M.; Rodríguez Jiménez, D.A. Diagnóstico Técnico y Funcional del Estado Actual del Tratamiento de Aguas Residuales de La Cabecera Municipal de Tenjo–Departamento de Cundinamarca; Universidad La Gran Colombia: Bogotá, Colombia, 2015. [Google Scholar]
- Conservación Internacional Colombia; Acueducto de Bogotá. Plan de Manejo Ambiental Humedal Juan Amarillo; Secretaria Distrital de Medio Ambiente: Bogotá, Columbia, 2010; pp. 1–388. [Google Scholar]
- Consejo Local de Gestión del Riesgo y Cambio Climático. Plan Local de Gestión del Riesgo y Cambio Climático PLGR-CC. 2019. Available online: https://www.idiger.gov.co/documents/220605/494708/PLGR-CC+Compilado-chapinero+.pdf/b7796611-a175-4847-9683-8096ca1b1c4f (accessed on 8 May 2021).
- Rincón Sierra, N.C. Análisis de Esquemas de Integración de La PTAR Salitre Al Alcantarillado y Al Río Bogotá; Universidad De Los Andes: Bogotá, Columbia, 2005. [Google Scholar]
- Distrito Capital. PTAR Salitre. Pagina Principal. Available online: https://ptarsalitre.com.co/ (accessed on 28 September 2020).
- Secretaría Jurídica Distrital. Decreto 624 de 2007 Alcaldía Mayor de Bogotá, D.C., Columbia. Decreto 624 de 2007 Alcaldía Mayor de Bogotá, D.C. 28 December 2007. Available online: https://www.alcaldiabogota.gov.co/sisjur/normas/Norma1.jsp?i=28132 (accessed on 5 October 2020).
- Secretaria de Ambiente de Bogotá. Plan De Manejo Ambiental Humedal Jaboque; Convenio de Cooperación No. 9-07-24100-061-2006; Unico: Bogotá, Colombia, 2016; pp. 1–601. [Google Scholar]
- Equipo De Análisis De Situación En Salud-ASIS. Diagnóstico Localidad Engativá 2014 (Documento en Preliminar). 2016. Available online: http://www.saludcapital.gov.co/DSP/Diagnsticos%20distritales%20y%20locales/Local/2014/10_Diagnostico_Local_2014_Engativ%C3%A1_12abr_2016.pdf (accessed on 16 May 2021).
- Alcaldia Mayor de Bogotá. Conociendo la Localidad de Engativa, Diagnóstico dre los Aspectos Físicos, Demográficos y Socieconomicos Año 2009; Alcaldia Mayor de Bogotá: Bogotá, Colombia, 2009. Available online: http://www.sdp.gov.co/sites/default/files/documento_tecnico_pdl-engativa.pdf (accessed on 2 June 2021).
- Cámara de Comercio de Bogotá. Perfil Económico y Empresarial Localidad Engativa. 2007. Available online: https://bibliotecadigital.ccb.org.co/bitstream/handle/11520/2883/6227_perfil_economico_engativa.pdf?sequence=1&isAllowed=y (accessed on 11 February 2021).
- CAR. Producto Final–Anexo No. 24 La Ramada. 2011. Available online: https://www.car.gov.co/uploads/files/5aeb755bef54b.pdf (accessed on 8 February 2021).
- CAR. Corporación Autónoma Regional de Cundinamarca–CAR Informe de Gestión 2016–2019 Resumen Ejecutivo (Corte 30 de Noviembre de 2019). 2019. Available online: https://www.car.gov.co/uploads/files/5e1e1c4543b79.pdf (accessed on 15 May 2021).
- Secretaría Distrital De Planeación. IA de Intervención del Rio Fucha y Su Área de En Torno Diseño de la Estrategia de Intervención Integral y Multidimensional En Materia Socioeconómica, Ambiental y Urbanística Para El Río Fucha y Su Area de Entorno; Secretaría Distrital de Planeación, Dirección de Operaciones Estratégicas: Bogotá, Columbia, 2015; Volume 1. [Google Scholar]
- Monroy, J. Análisis del paisaje de la microcuenca del río Fucha en la ciudad de Bogotá, Colombia. Diagnóstico para el mejoramiento de servicios ecosistémicos. Investig. Geográficas 2020, 18, 101. [Google Scholar] [CrossRef]
- Castaño Pachón, M.; Urrego Muñoz, L. Problemáticas socioambientales en la cuenca del río Tunjuelo: Una posibilidad en la enseñanza y el aprendizaje de la geografía. Giramundo 2015, 2, 95–108. Available online: https://www.cp2.g12.br/ojs/index.php/GIRAMUNDO/article/view/673 (accessed on 29 August 2021). [CrossRef]
- Empresa de Agua Alcantarillado y Aseo de Bogotá; E. y Proyectos Ambientales y Mecánicos. Desarrollo y Validación de La Evaluación Regional del Agua En La Cuenca Hidrográfica del Río Tunjuelo Producto 3; Empresa de Agua Alcantarillado y Aseo de Bogotá: Bogotá, Colombia, 2014. Available online: http://www.orarbo.gov.co/es/documentacion-y-enlaces/listado/desarrollo-y-validacion-de-la-evaluacion-regional-del-agua-en-la-cuenca-hidrografica-del-rio-tunjuelo-producto-3 (accessed on 29 August 2021).
- Peña-Guzmán, C.A.; Soto, L.; Diaz, A. A proposal for redesigning the water quality network of the Tunjuelo River in Bogotá, Colombia through a spatio-temporal analysis. Resources 2019, 8, 64. [Google Scholar] [CrossRef] [Green Version]
- Camargo, F.M. El relleno sanitario Doña Juana en Bogota:la produccion politica de un paisaje toxico, 1988–2019. Hist. Crítica 2019, 74, 127–149. [Google Scholar] [CrossRef]
- Rodríguez Muñoz, Y. Tunjuelo: El Río Que se Convirtió en Cloaca; Universidad Jorge Tadeo Lozano: Bogota, Colombia, 2018. [Google Scholar]
- Acosta de Armas, M.M.; Montilla Peña, J.X. Evaluación de La Contaminación Por Cadmio y Plomo En Agua, Suelo, y Sedimento y Análisis de Impactos Ambientales En La Sabana de Bogotá; Universidad de La Salle: Bogotá, Colombia, 2011. [Google Scholar]
- Rodríguez Navarrete, J.M. Los Factores Ambientales Como Determinantes del Estado de Salud de La Población En El Municipio de Soacha 2006–2016; Pontificia Universidad Javeriana Facultad: Bogotá, Colombia, 2018. [Google Scholar]
- Soto Varon, H.; Tobaria Leon, C. Diseño de un Estudio de Prefactibilidad Para La Construcción de Humedales Artificiales Como Método de Remoción de Contaminantes En las Fuentes Hídricas del Municipio de Soacha, Producto de La Explotación Minera; Universidad Distrital Francisco José De Caldas: Bogotá, Columbia, 2020. [Google Scholar]
- Colmenares Rodríguez, H.J.; Torres Guerrero, V. Evaluación de Ccontaminación En Agua, Suelo y Sedimentos, Asociada a Plomo y Cadmio en La Subcuenca Embalse del Muña, Río Bogotá; Universidad de la Salle: Bogotá, Columbia, 2012. [Google Scholar]
- Corporación Autónoma Regional de Cundinamarca-CAR. Objetivos de Calidad del Agua para la Cuenca del Río Bogotá; Corporación Autónoma Regional de Cundinamarca—CAR: Bogotá, Colombia, 2010; pp. 1–16. [Google Scholar]
- Corporación Autónoma Regional (CAR). Salto del Tequendama: Pulmón de la Cuenca Baja del Río Bogotá|CAR. 2018. Available online: https://www.car.gov.co/saladeprensa/salto-del-tequendama-pulmon-de-la-cuenca-baja-del-rio-bogota (accessed on 19 January 2021).
- Torres Torres, W.; Moreno Chaparro, H.C. Evaluación de La Adecuación Hidráulica del Río Bogotá Sobre La Calidad del Agua Tomando Como Base Datos Históricos; Universidad Católica De Colombia: Bogotá, Colombia, 2019. [Google Scholar]
- Naranjo Hensel, A.M. Interventoría Ambiental de Obras Para El Sistema de Alcantarillado Operado Por La Empresa Pública de Alcantarillado de Santander Empas S.A. E.S.P.; Universidad Pontificia Bolivariana: Bogotá, Colombia, 2009. [Google Scholar]
- Ardila Esquivel, N. Estrategia Formativa Para Disminuir El Vertimiento de Residuos Orgánicos Al Río Bogotá, Por Parte de Las Granjas Porcícolas de San Antonio del Tequendama; Universidad de La Salle: Bogotá, Colombia, 2016. [Google Scholar]
- Pérez Jiménez, J.S. Propuesta de Zonificación de La Microcuenca Quebrada La Honda a Partir de Sistemas de Producción. Tena (Cundinamarca); Universidad Distrital Francisco José de Caldas: Bogotá, Colombia, 2019. [Google Scholar]
- Corporacion Autonoma Reginal—CAR. Anexo 5—Soporte Plan de Manejo y Ordenamiento de Una Cuenca POMCA Rio Bogotá. Elaboración del Hidrográfica del Río Bogotá. 2015. Available online: https://www.google.com/url?sa=t&rct=j&q=&esrc=s&source=web&cd=&ved=2ahUKEwjWuaHh4dvxAhXbQzABHSr_A8wQFjAAegQIBxAD&url=http%3A%2F%2Frepositorio.gestiondelriesgo.gov.co%2Fbitstream%2F20.500.11762%2F22595%2F2%2F11-2-POMCA-RIO-BOGOTA-ANEXO.pdf&usg=AOvVaw0R8dIP (accessed on 12 July 2021).
- Suárez, L.G.; Londoño Toro, B.D.; Barajas Rodríguez, C. La judicialización de los conflictos ambientales: Un estudio del caso de la cuenca hidrográfica del río Bogotá (CHRB), Colombia. Rev. Int. Contam. Ambient. 2015, 31, 195–209. Available online: http://www.scielo.org.mx/scielo.php?script=sci_arttext&pid=S0188-49992015000200009 (accessed on 14 August 2021).
- Corporación Autónoma Regional de Cundinamarca-CAR. Elaboración del Diagnóstico, Prospectiva y Formulación de la Cuenca Hidrográfica del Río Bogotá Subcuenca del Río Frío-2120-12. 2010. Available online: https://www.car.gov.co/uploads/files/5ac25c90a0d0a.pdf (accessed on 20 August 2021).
- Gaitán, M.S. Determinación de Oxígeno Disuelto por El Método Yodométrico Modificación de Azida; Instituto de Hidrología, Meteorología y Estudios Ambientales-IDEAM, Ministerio de Ambiente, Vivienda y Desarrollo Territorial-República de Colombia: Bogotá, Colombia, 2007; Volume 1, pp. 1–9. Available online: http://www.ideam.gov.co/documents/14691/38155/Oxígeno+Disuelto+Método+Winkler.pdf/e2c95674-b399-4f85-b19e-a3a19b801dbf (accessed on 15 August 2021).


| POINTS ID | STATION NAME | COORDINATES | MUNICIPALITY | Year | TC | E. coli | |
|---|---|---|---|---|---|---|---|
| Latitude | Length | MPN/100 mL | MPN/100 mL | ||||
| 3 | Downstream of Chía | 4°49,806′ N | 74°3330′ W | Chía | 2010-01 | 65,000,000 | 11,000,000 |
| 4 | Engativá Downstream | 4°43,194′ N | 74°9667′ W | Engativá | 2016-02 | 110,000,000 | 2,000,000 |
| 9 | Downstream Quebrada Honda | 4°37,427′ N | 74°23,469′ W | El socorro | 2012-01 | 24,000,000 | 4,800,000 |
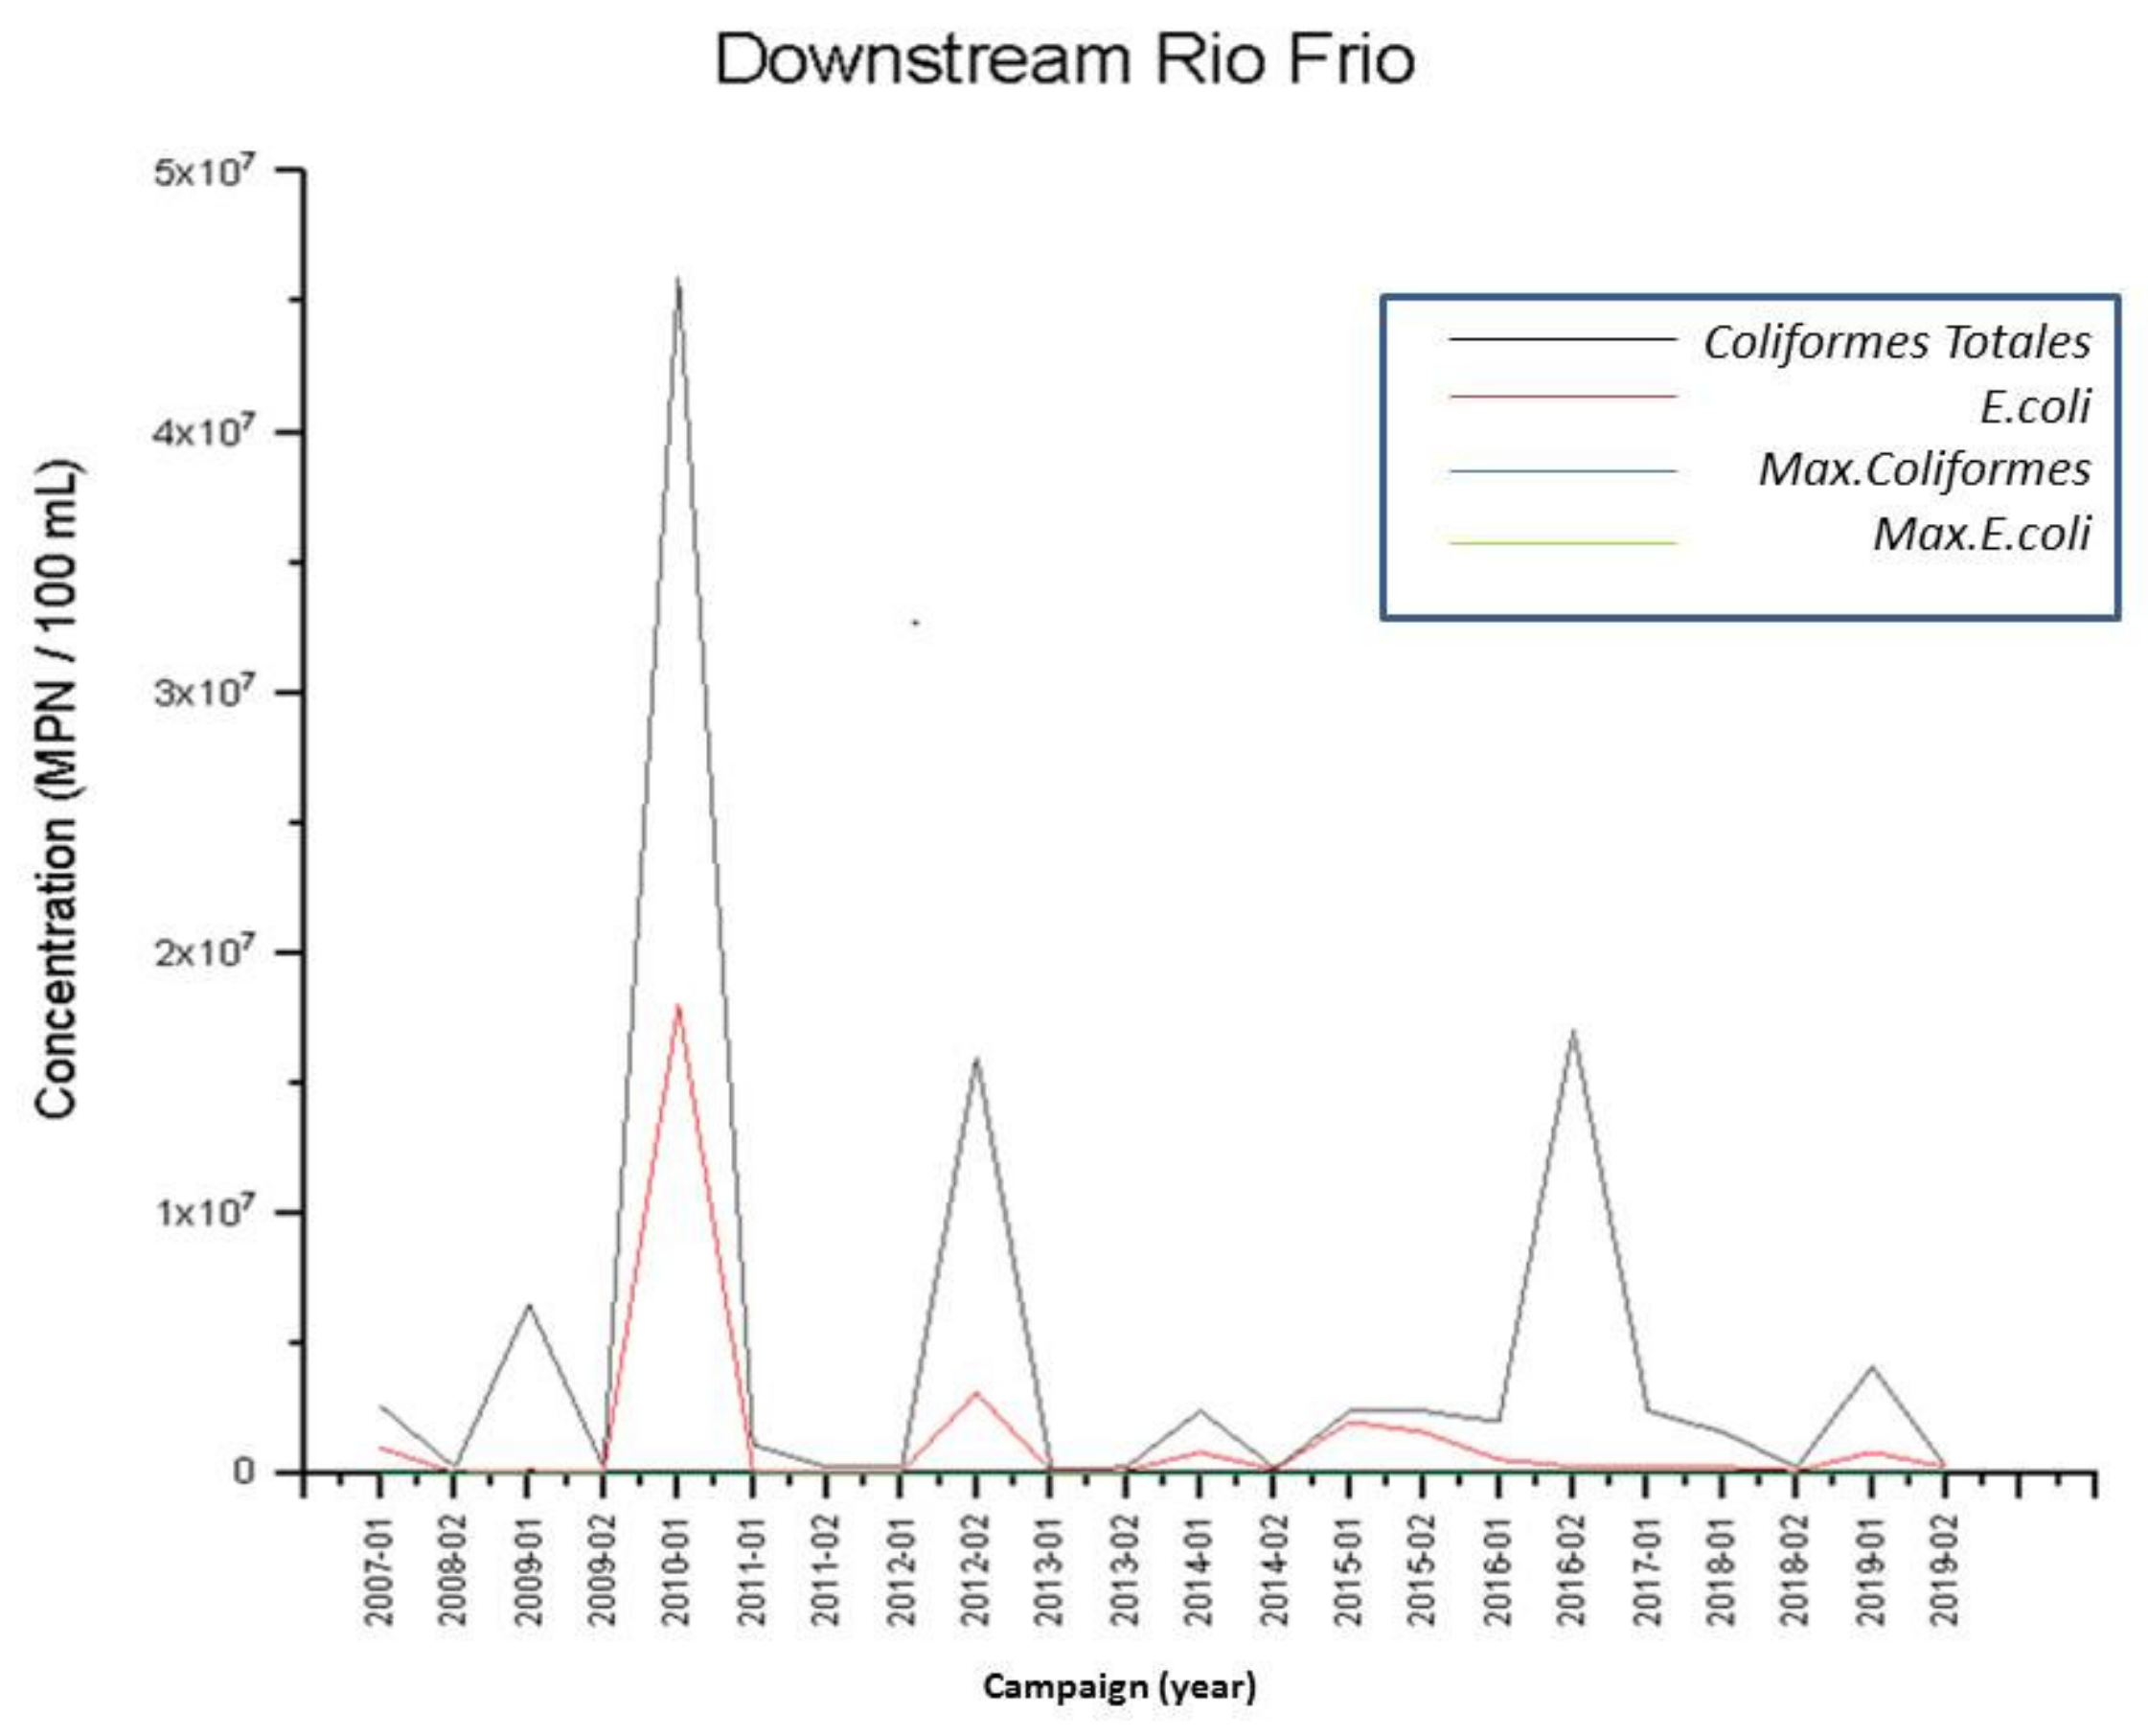
| 10 | Downstream Rio Frío | 4°50,167′ N | 74°4852′ W | Zipaquirá | 2010-01 | 46,000,000 | 18,000,000 |
| 2016-02 | 17,000,000 | 270,000 | |||||
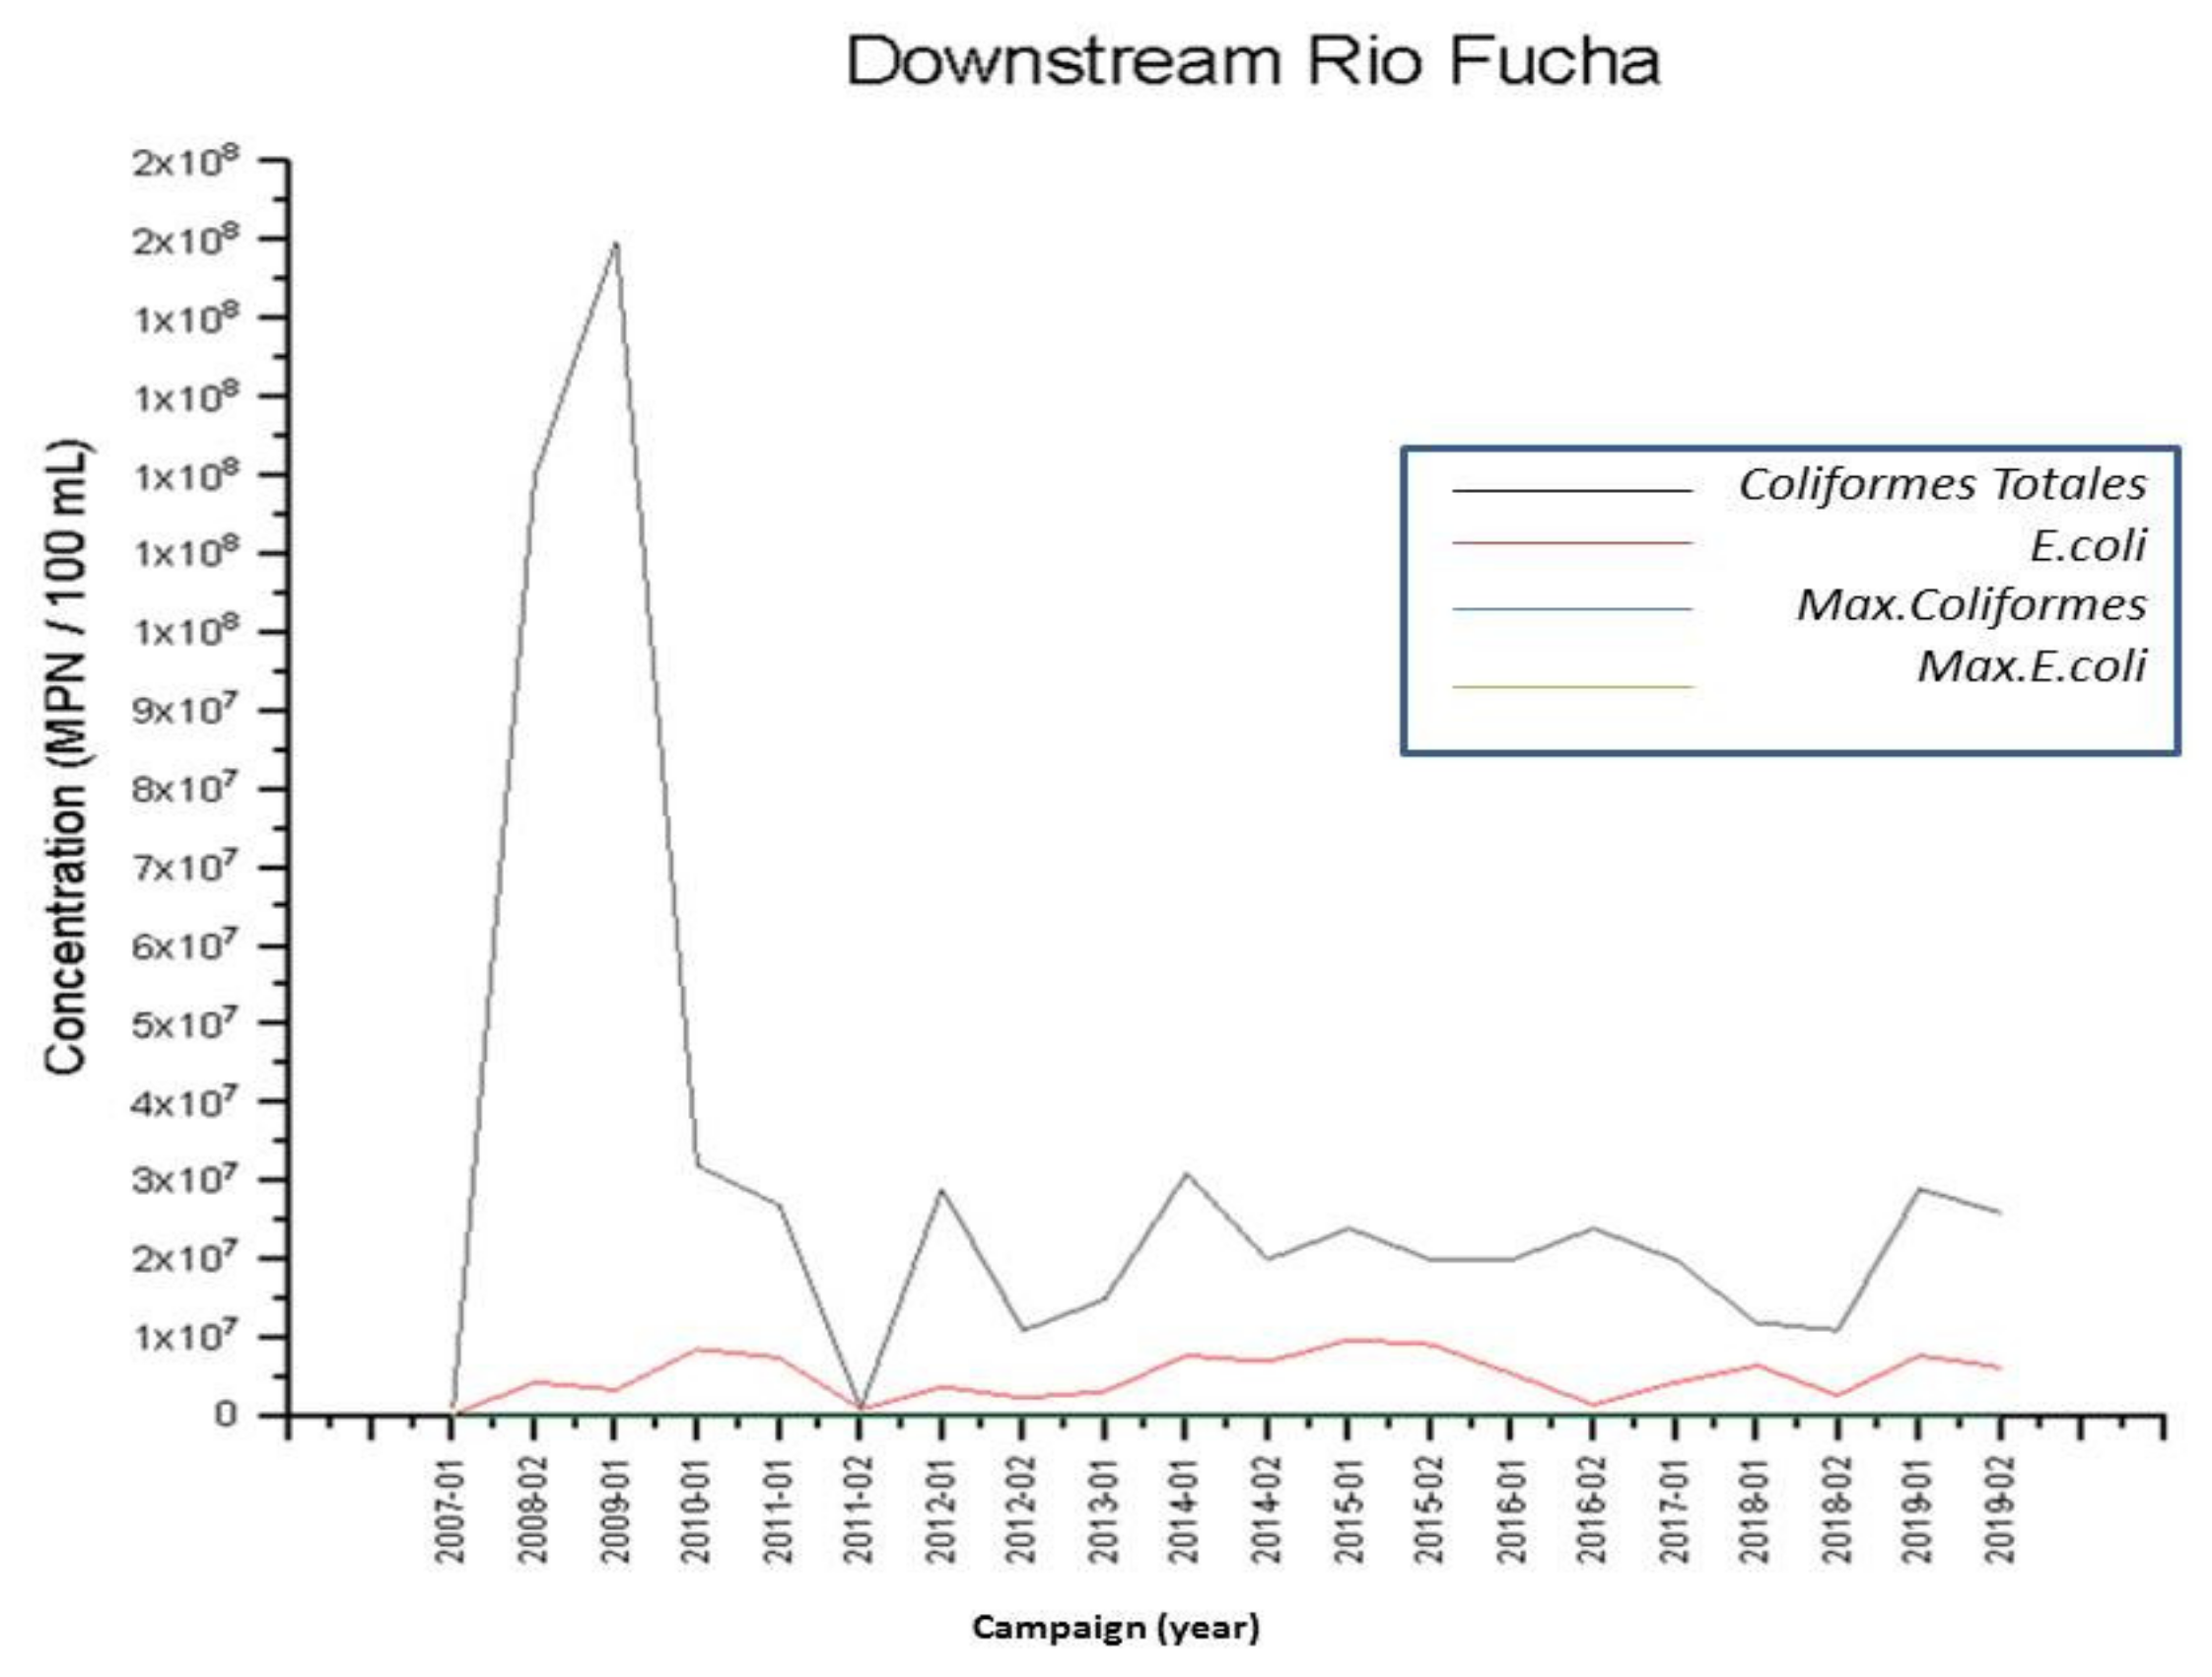
| 11 | Downstream Rio Fucha | 4°39,732′ N | 74°9757′ W | Bogotá | 2009-01 | 150,000,000 | 3,400,000 |
| 13 | Downstream Rio Tunjuelo | 4°37,956′ N | 74°13,608′ W | Bogotá | 2008-02 | 170,000,000 | 12,000,000 |
| 2019-01 | 39,000,000 | 8,600,000 | |||||
| 14 | Upstream of Chía | 4°56,668′ N | 74°1003′ W | Chía | 2007-01 | 24,000,000 | 20,000,000 |
| 2019-01 | 1,700,000 | 820,000 | |||||
| 18 | Upstream Salto Tequendama | 4°33,049′ N | 74°16,796′ W | Soacha | 2009-01 | 240,000,000 | 150,000 |
| 21 | Gibraltar Pump | 4°38,865′ N | 74°11,118′ W | Bogotá | 2009-01 | 870,000,000 | 21,000,000 |
| 22 | Juan Amarillo By Pass | 4°44,303′ N | 74°7655′ W | Bogotá | 2008-02 | 190,000,000 | 12,000,000 |
| 2014-02 | 200,000,000 | 22,000,000 | |||||
| 23 | Soacha cannel | 4°35,467′ N | 74°14,716′ W | Soacha | 2019-01 | <240,000,000 | 11,000,000 |
| 27 | Engativa Discharge | 4°43,303′ N | 74°8952′ W | Engativá | 2019-02 | 200,000,000 | 41,000,000 |
| 28 | Jaboque Discharge | 4°43,352′ N | 74°9047′ W | Bogotá | 2015-01 | 24,000,000 | 98,000 |
| 29 | Chía Municipal Discharge | 4°51,615′ N | 74°2356′ W | Chía | 2008-02 | 25,000,000 | 1,700,000 |
| 2014-02 | 16,000,000 | 4,600,000 | |||||
| 30 | Cota Municipal Discharge | 4°47,841′ N | 74°5760′ W | Cota | 2010-01 | 200,000,000 | 53,000,000 |
| 2019-02 | 150,000,000 | 34,000,000 | |||||
| 31 | San Ant. Tequendama Municipal Discharge, Quebrada La Cuy | 4°37,353′ N | 74°21,237′ W | Soacha | 2018-01 | 160,000,000 | 20,000,000 |
| 39 | El Cortijo | 4°43,817′ N | 74°7781′ W | Bogotá | 2009-01 | 220,000,000 | 12,000,000 |
| 2016-02 | 170,000,000 | 8,200,000 | |||||
| 42 | LG Pte. La Balsa Station | 4°49,744′ N | 74°4226′ W | Cajica | 2014-01 | 2,400,000 | 820,000 |
| 2019-02 | 2,400,000 | 290,000 | |||||
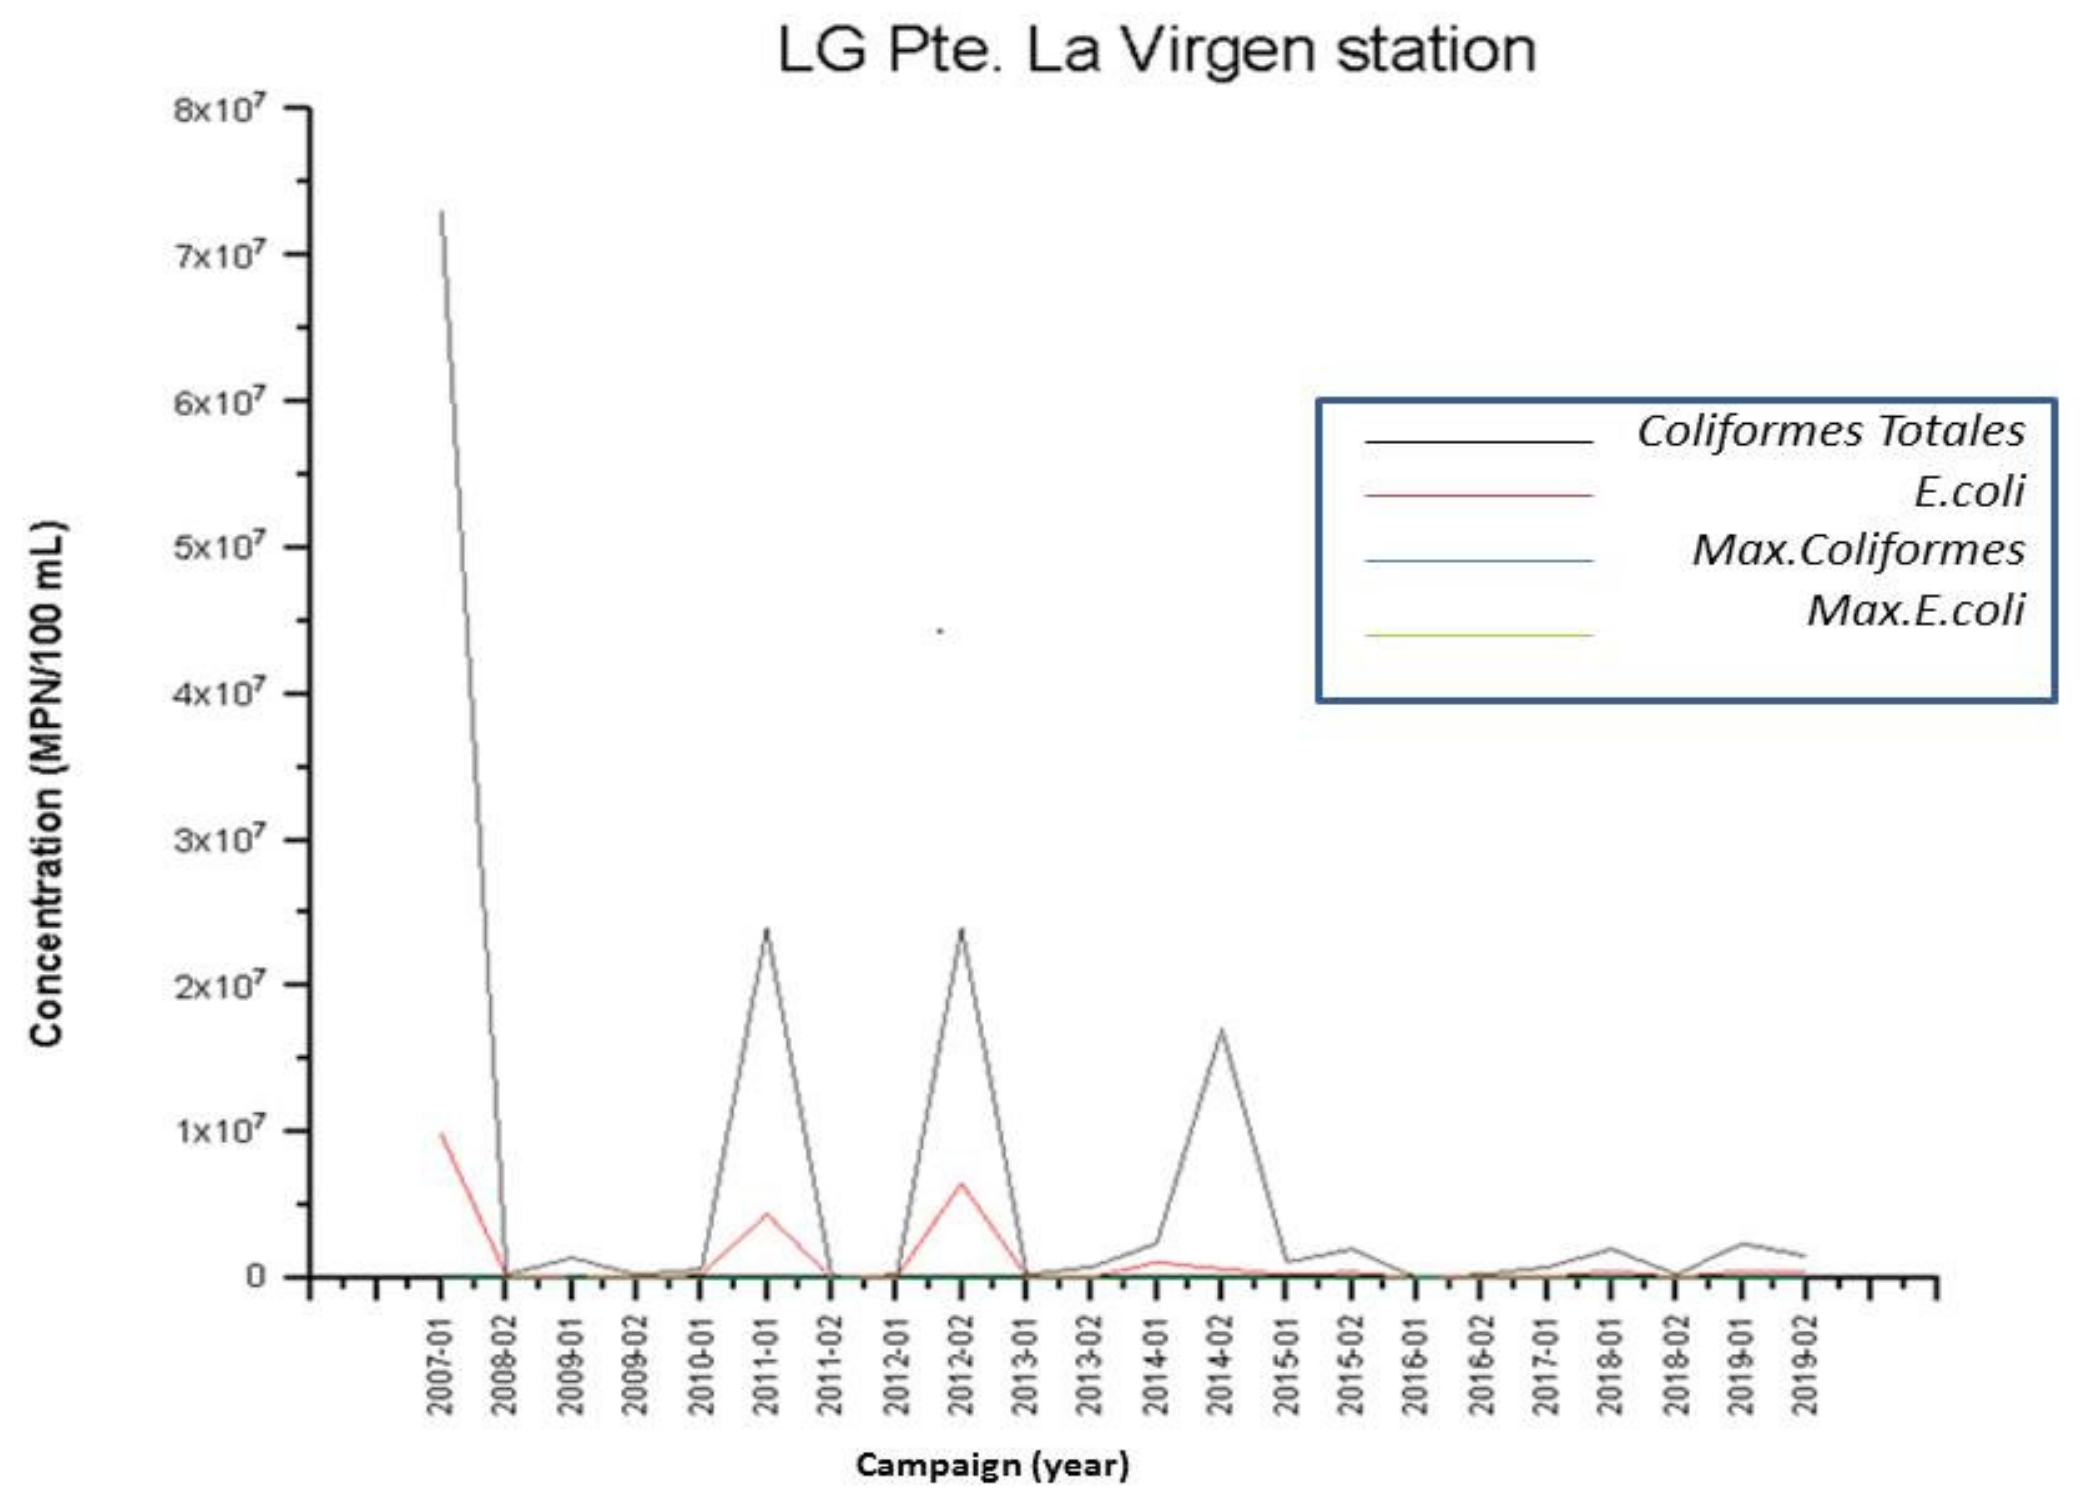
| 43 | LG Pte. La Virgen Station | 4°47,949′ N | 74°5765′ W | Cota | 2007-01 | 73,000,000 | 9,800,000 |
| 2019-01 | 2,400,000 | 500,000 | |||||
| 53 | La Ramada | 4°42, 915′ N | 74°9305′ W | Funza | 2010-01 | 14,000,000 | 6,700,000 |
| 54 | LG La Isla | 4°38,668′ N | 74°13,249′ W | Tenjo | 2009-01 | 92,000,000 | 3,300,000 |
| 55 | LG Las Huertas | 4°35,173′ N | 74°15,228′ W | Bogotá | 2016-02 | 87,000,000 | 5,000,000 |
| 56 | LG Pte. Cundinamarca | 4°41,748′ N | 74°10,327′ W | Bogotá | 2014-01 | >24,000,000 | 6,900,000 |
| 57 | LM Hacienda San Francisco | 4°40,157′ N | 74°10,204′ W | Normandia | 2008-02 | 98,000,000 | 3,500,000 |
| 58 | LM Vuelta Grande | 4°44,785′ N | 74°7728′ W | Bogotá | 2014-02 | 20,000,000 | 20,000,000 |
| 2019-01 | 2,400,000 | 580,000 | |||||
| 59 | EL salitre WWTP | 4°44,191′ N | 74°7593′ W | Bogotá | 2008-02 | 150,000,000 | 13,000,000 |
| 2014-02 | 170,000,000 | 22,000,000 | |||||
| 60 | Mondoñedo bridge | 4°32,546′ N | 74°16,290′ W | Mosquera | 2008-02 | 87,000,000 | 2,700,000 |
| 2016-02 | 110,000,000 | 7,200,000 | |||||
| 67 | Quebrada Honda | 4°37,584′ N | 74°23,333′ W | El socorro | 2007-01 | 6,500,000 | 1,400,000 |
| 2019-02 | 98,000 | 840 | |||||
| 68 | Quebrada La Tenería | 4°53,864′ N | 74°1121′ W | Cajica | 2014-02 | 240,000,000 | 240,000,000 |
| 2019-02 | 100,000,000 | 7,500,000 | |||||
| 70 | Rio Tunjuelo | 4°37,607′ N | 74°13,397′ W | Bogotá | 2008-01 | 240,000,000 | 11,000,000 |
| 72 | Rio Balsillas | 4°37,077′ N | 74°15,078′ W | Mosquera | 2019-01 | 16,000,000 | 1,900,000 |
| 74 | Rio Chicú | 4°46,415′ N | 74°6971′ W | Tenjo | 2007-01 | 2,400,000 | 430,000 |
| 2019-02 | 2400 | 310 | |||||
| 75 | Rio Frío | 4°50,501′ N | 74°4799′ W | Zipaquirá | 2011-01 | 58,000,000 | 9,600,000 |
| 2019-02 | 9900 | 100 | |||||
| 76 | Rio Fucha | 4°39,870′ N | 74°9197′ W | Bogotá | 2009-01 | 450,000,000 | 20,000,000 |
| 2019-01 | 100,000,000,000 | 55,000,000 | |||||
| 79 | Rio Soacha | 4°35,743′ N | 74°14,595′ W | Soacha | 2009-01 | 160,000,000 | 11,000,000 |
| 2019-02 | 92,000,000 | 26,000,000 | |||||
Publisher’s Note: MDPI stays neutral with regard to jurisdictional claims in published maps and institutional affiliations. |
© 2022 by the authors. Licensee MDPI, Basel, Switzerland. This article is an open access article distributed under the terms and conditions of the Creative Commons Attribution (CC BY) license (https://creativecommons.org/licenses/by/4.0/).
Share and Cite
Castro Fernández, M.F.; Cárdenas Manosalva, I.R.; Colmenares Quintero, R.F.; Montenegro Marín, C.E.; Diaz Cuesta, Y.E.; Escobar Mahecha, D.; Pérez Vásquez, P.A. Multitemporal Total Coliforms and Escherichia coli Analysis in the Middle Bogotá River Basin, 2007–2019. Sustainability 2022, 14, 1769. https://doi.org/10.3390/su14031769
Castro Fernández MF, Cárdenas Manosalva IR, Colmenares Quintero RF, Montenegro Marín CE, Diaz Cuesta YE, Escobar Mahecha D, Pérez Vásquez PA. Multitemporal Total Coliforms and Escherichia coli Analysis in the Middle Bogotá River Basin, 2007–2019. Sustainability. 2022; 14(3):1769. https://doi.org/10.3390/su14031769
Chicago/Turabian StyleCastro Fernández, Mario Fernando, Ileana Romea Cárdenas Manosalva, Ramón Fernando Colmenares Quintero, Carlos Enrique Montenegro Marín, Yeffer Edilberto Diaz Cuesta, Daniela Escobar Mahecha, and Paula Andrea Pérez Vásquez. 2022. "Multitemporal Total Coliforms and Escherichia coli Analysis in the Middle Bogotá River Basin, 2007–2019" Sustainability 14, no. 3: 1769. https://doi.org/10.3390/su14031769