Article

Understanding the Spread of COVID-19 Based on Economic and Socio-Political Factors

by
Lorenzo Dinia
1,*,
Valerio Antonio Iannitti
2,
Fabio Mangini
3,
Francesca Di Lascio
2 and
Fabrizio Frezza
1
1
Department of Information Engineering, Electronics and Telecommunications (DIET), “Sapienza” University of Rome, Via Eudossiana 18, 00184 Roma, Italy
2
Department of Political Science, “Roma Tre” University of Rome, Via G. Chiabrera 199, 00145 Roma, Italy
3
Department of Information Engineering (DII), University of Brescia, Via Branze 38, 25123 Brescia, Italy
*
Author to whom correspondence should be addressed.
Sustainability 2022, 14(3), 1768; https://doi.org/10.3390/su14031768
Submission received: 11 December 2021 / Revised: 27 January 2022 / Accepted: 30 January 2022 / Published: 3 February 2022

Abstract

:
Since the beginning of the COVID-19 outbreak, one of the main focuses worldwide has been to collect data on cases and deaths in the widest collaborative innovation to better understand the epidemic spread and keep its evolution under control. Under an “Open Innovation in Science” approach, researchers can contribute to producing new scientific knowledge on the features and, thus, the evolution of the epidemic, by which policymakers can have the tools to adopt optimal containment measures in order to maximize the economic growth and minimize the social impact. Little focus was given to identifying economic and socio-political factors that could drive the spreading of the coronavirus. In its initial stages, the spread of the virus seemed to follow specific paths without a clear explanation. The study aimed to analyze the relationships between mathematical factors obtained from the curves characterizing the COVID-19 spread during its first wave and economic and socio-political factors of the considered countries with an exploratory approach based on data available from different sources. The intent was to identify the elements affecting the contagion and, thus, the COVID-19 cases. Twenty factors for specific countries were selected. In MATLAB environment, a homemade software was used to obtain the mathematical factors, and statistical software was used to identify the potential correlations existing between the mathematical parameters and the economic and socio-political factors. Interesting relationships were found with economic factors such as economic growth forecast and health spending as a percentage of Gross Domestic Product (GDP), just to cite a few, with the spread of the epidemic. This study shows that a better understanding of the link between the epidemic and the economic and socio-political factors of human society can be the key to forecast more accurately the evolution of the pandemic, and even to predict the progress of future insurgencies. Vulnerabilities and weaknesses of our societies could also have the opportunity to be addressed with the ultimate goal of improving the economic, social, and environmental sustainability of human society.

1. Introduction

The outbreak of COVID-19, known in the scientific field as SARS-CoV-2, has put the entire world under unprecedented challenges. The socio-economic structure of the world started to show all its vulnerability, opening new tables of discussions, mainly related to sustainability. Since the beginning of the outbreak, there has been a rush to collect and analyze data, which was used by the scientific community in finding solutions to control the virus spreading. The motivation to lead the world out of the pandemic encouraged many researchers to focus on COVID-19 in an invaluable effort of collaborative innovation [1]. The initial effort focused on forecasting the nature of the virus spread; the approach was based on the classical epidemiological model, suggesting an exponential growth. However, other researchers proposed different mathematical functions, such as the power-law scaling, that better described the available data at that moment [2].
From the very first stage of the outbreak, one of the main focuses was to collect data related to cases and deaths to arrange public databases for monitoring the evolution of the epidemic. Many models were used to predict the progress of the spread, the Susceptible-Infected-Removed (SIR) model was one of the most used [3]. Collecting uniform data from all the countries was necessary to adopt adequate measures to control the spread, but this was also very challenging since data varied depending on different approaches and resources. When the epidemic was declared a pandemic, the disease could not be considered only a medical issue, but the coronavirus became a much bigger concern at all levels of society. Collecting data and analyzing them in real time, with all the potential linkages, was vital to controlling the spread. In this case, the complexity of the task was perceived as even more challenging due to the many unknowns such as asymptomatic cases, the incubation period, and super spreader events just to cite a few [4]. Further complexity was also added by the different strategies adopted by some countries with an aggressive trace and testing approach with isolation of those testing positive and their contacts on one side and a focus on testing only the serious cases on the other side. The different strategies of countries were mainly the result of disparate perspectives of the political parties in charge and the available resources to be allocated for the emergency. It has also been learned that the communication of the leaders plays a key role in the perception of risk related to the outbreak, impacting the outcome severely [5,6]. Moreover, human beings tend to perceive a higher risk for situations or scenarios in which there is less sense of control, even though, statistically, they show a much lower death rate [7,8]. These two factors contribute heavily to people’s behaviors with a great impact on the spread of the pandemic, especially where the governments relied on the population’s responsibility, such as in western countries. This unique scenario allowed the scientific community to participate in the widest open collaboration to advance our understanding of the coronavirus; this approach, with not only the entire world scientific community as participants, is referred to as “crowd science”. This approach of this study is based on the Open Innovation (OI) framework, i.e., the exploitation of knowledge inflows and outflows across organizational boundaries, as the aim is to deliver knowledge on the evolution of the epidemic as it is achieved, exploiting the real-time data collection for the different countries. In this case, the partners for the development of new knowledge are not universities or companies but individuals, which is a growing form of OI [9,10]. This mode was inevitable for the state of emergency with evident benefits such as lower costs and a higher speed in reaching results [11]. As a global problem, each country benefited from others’ research and scenarios, speeding up the process of advancing knowledge on the phenomenon. In this context, big data has represented a fundamental element. Because of the emergency situation the world is facing, data have been collected explicitly and implicitly through proper crowdsourcing platforms. This approach can benefit the economic, social, and environmental sustainability of human society [9,10,12].
Since many studies were conducted to try to quantify the damages created by the spread of COVID-19 with the relative mitigation measures to contain it on the GDP [13,14], very little research was conducted on understanding how the GDP and other distinct demographic, social, economic, and environmental factors impacted the spreading of the coronavirus. The macroeconomic impact of an infectious disease outbreak can follow many channels. The distribution of cases around the world in different countries cannot be casual, and correlations with socio-economic and political factors will exist, as confirmed by previous studies [15,16,17]. The freedom index that measures the level of freedom of a country in the world, looking at different factors such as economic freedom, political freedom, and freedom of the press, was found to be positively associated with a higher number of cases [18]. Countries with a higher freedom index have reported higher COVID-19 infectious cases per million [18]. Up to now, there have only been hypotheses regarding the relationships between socio-economic indicators that drive the pandemic throughout the world. A positive association between the cases per million and the GDP as well as with the flights per capita was one of the first outcomes found [15]. A part of these results was confirmed by Tantrakarnapa et al. identifying a solid relationship between tourism and the virus spread [19]. Economic and cultural factors were then analyzed by Mogi and Spijker finding that the coronavirus disease COVID-19 spreads more easily in socially, economically, and culturally lively and densely populated countries [16]. Kapitsinis tried to identify the underlying factors that could drive the spread of COVID-19 in nine EU countries finding that demographics, average household, and business size had a significant impact on the coronavirus diffusion and consequences [17]. Farseev et al. also attempted to perform a statistical analysis in order to detect existing relationships between a few economic and public health factors with the spread of COVID-19 [20]. A review of the studies in the literature suggests that the higher the GDP, the higher were the number of COVID-19 cases presented [15,16].
Our research was triggered by some key questions. How was the epidemic growth in the different countries? How was this growth linked to crucial socio-economic factors? Can relationships be found between these factors and the detected cases? We adopted an exploratory approach where we analyze the simultaneous effect of several factors on the geographic spread of COVID-19. In particular, the hypothesis of this study is as follows:
Hypothesis (H1).
Economic and socio-political factors jointly influence the geographical diffusion of COVID-19.
In our study, mathematical parameters obtained by the curves of cases per country were analyzed, with a holistic approach, with respect to 20 economic and socio-political factors that may affect the contagion and the number of COVID-19 cases. The research is an exploratory study based on jointly analyzing factors that drive the spreading, and an innovative approach was proposed, considering many variables simultaneously, to uncover relationships not yet investigated. The current study was performed only on cases because of the high heterogeneity in how the deaths were counted and reported during the first phase of the pandemic, despite the fact that the number of cases itself can be biased as well due to the testing policy differences between the countries. The study includes seven sections. The first is a bibliographic review of previous COVID-19 pandemic studies that aimed to find relationships with social and economic factors. The second section introduces an overview of the COVID-19 pandemic. In a third section, an analysis of factors impacting the spread of the coronavirus is also introduced. The fourth part provides details about the methodology of the current study. The following section depicts the results of the research project and, ultimately, a discussion section presents outcomes in the context of our research with regard to previous researches, while in the last section, conclusions and future potential developments are drawn.

2. COVID-19 Pandemic Overview

The virus was first identified in December 2019 in Wuhan, China. The outbreak of a Public Health Emergency of International Concern was declared by the WHO (World Health Organization) in January 2020 and, then, in March 2020, it was declared to be of pandemic proportion [21]. From the beginning of the pandemic, the challenge that governments needed to face was unpredictable. The course of action had to focus on minimizing the deaths from coronavirus disease 2019 (COVID-19) while still trying to keep a minimum impact on the economy [22]. According to many studies, the pandemic was originated in China; from then, multiple measures were adopted and confirmed to be effective in containing the spread of the virus such as social distancing, quarantine, and the isolation of infected people, to cite the most relevant [23]. The measures adopted by China in the early part of 2020 to contain the epidemic were very stringent, and with the epidemic turning into a pandemic the question was whether all the countries around the world would be able to implement sufficient measures to control the spread. The most important factor that determines the course of the epidemic is the basic reproduction number (R0), which represents the average number of new cases provoked by one primary case when the entire population is widely susceptible to infection. The R0 value needs to be kept under control in order to stop the spread of the outbreak, this is reached either due to the influence of control measures or the depletion of the population susceptible to infection [22,24,25]. Four main factors were largely unknown at the beginning of the outbreak, and after several months they are still not completely clear—the fatality rate, whether the infectiousness begins before showing symptoms, how many asymptomatic cases there are, and the duration of the infectious period for COVID-19 [22,23,24]. These unknowns increase the complexity of controlling the outbreak, and each country put in place its own measures to contain the outbreak and trace the cases; the results are obviously very heterogeneous.

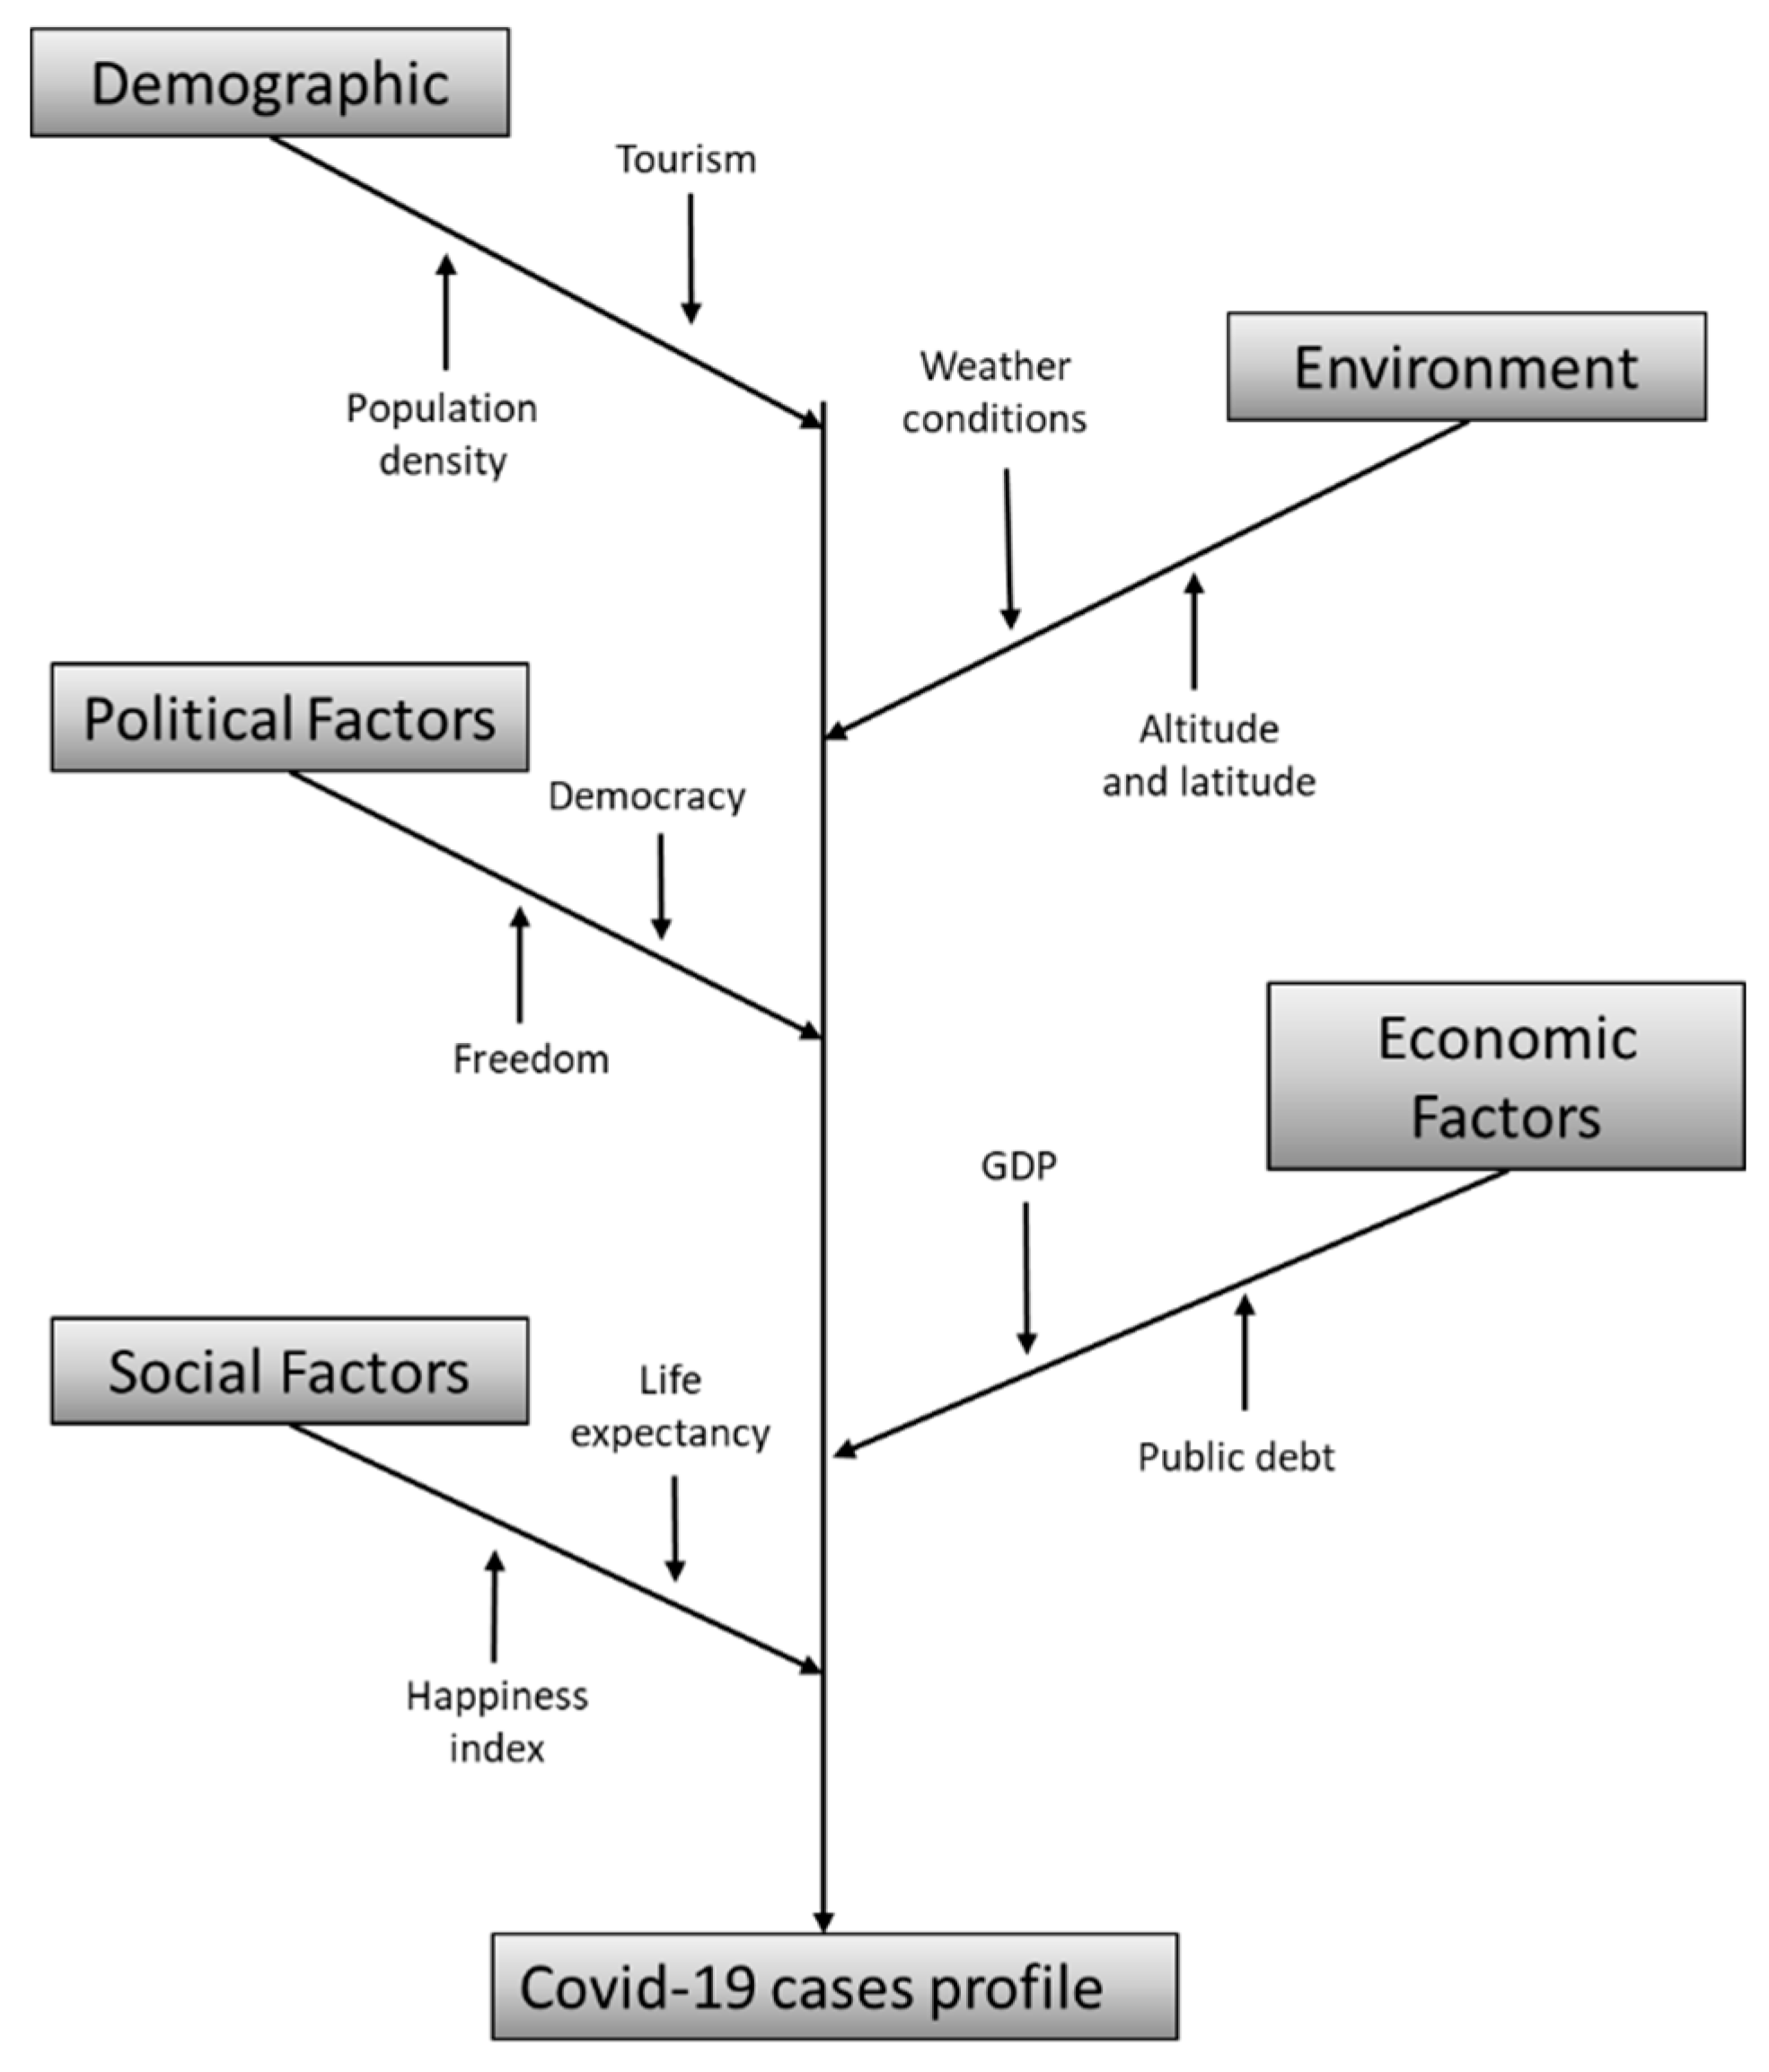
3. Factors Affecting COVID-19 Transmission

Many factors have played a role in the spread of the COVID-19 virus in the world’s population. One of the first factors to be analyzed was the weather conditions, with temperature and humidity as the main characters. Some studies showed that sunlight helps the recovery from the virus; however, a more complete combination of all climatic predictors suggested that the weather is correlated with the spread of the coronavirus [26], with temperature and humidity playing key roles in this scenario. In order to prevent the increase of the spreading linked to a decreased temperature and humidity, the government should adopt more flexible and stricter measures during these periods to avoid more severe waves of COVID-19 outbreaks [26]. In some further studies, it was shown how the effect of globalization had an impact on the spread of the virus. Today, more than ever, any part of the globe can be reached in 24 h, and this aspect sped up the spreading of the virus, especially when it was still undetected. In a case study in Thailand, tourism as a factor was investigated and a positive association was found with the proliferation of the virus [19]. A wider study conducted in Europe on social and economic factors provided a correlation between the spread of the virus and areas socially, economically, and culturally lively and, of course, highly densely populated [16]. The demographic and, thus, the age structure of the population was also studied to explain different scenarios in fatality rates and how the transmission evolves [27]. In other studies, the air pollution levels were observed to see whether they could have an impact on the spread of the coronavirus, finding a potential relationship [28]. A further study, conducted in Sao Paulo, Brazil, found that the spreading of the virus was positively correlated to the population density, confirming what was already widely studied, and negatively correlated to the social isolation rate, temperature, and UV radiation [29]. GDP and the health system are two of the most investigated factors; higher-resourcedhealth systems might have had an impact on how countries responded to the pandemic, maximized the control of the spread, and minimized the risk of mortality [17]. On the other hand, the GDP, the index of economic dynamics, is expected to be correlated with a higher mortality and, thus, a higher number of cases being tracked, even though there are a higher amount of resources available. Moreover, the population health, measured by the life expectancy and mortality of specific categories of the population, was found to be positively related to growth and economic welfare [30]. The Happiness index is also associated with the transmission because of the potential positive relationship with GDP and economic growth [31]. Indirectly, public debt is found to be inversely related to economic growth having an impact on COVID-19 spread; this suggests that the higher the debt the lower the COVID-19 diffusion [32]. The spread of the coronavirus was also analyzed in relation to the democracy of countries, linked to freedom, finding that more democratic countries often fail to provide an effective and fast response in emergency scenarios such as the COVID-19 pandemic. This could lead to a higher transmission rate with negative health effects, but the study showed that the fatality rate observed was, however, lower [33].
Figure 1 shows a fishbone diagram with all the main macro-categories that may have an impact on the spread of the coronavirus.

4. Methods

A review of economic and socio-political factors was performed among the world countries, 20 of them were first selected based on the results of previous studies. Table 1 shows the factors considered in the study with the relative definitions in the second column; they are mainly related to population distribution, welfare, and socio-political characteristics, macro-categories that the authors focused their attention on. Population density and, thus, forest area, agriculture area, and urban population have been analyzed in previous studies as have GDP, economic growth, democratic index, economic freedom, health spending as percentage of GDP, and tourism–international tourism revenue/GDP [15,16,17,18,19,20,29,31,32,33,34]. Since this research paper is an exploratory study, the remaining factors were considered because they are related to the macro-categories mentioned above but have not been investigated yet. A Pearson correlation study and a multivariate linear regression were conducted between the data extracted from theGlobalEconomy.com site, a platform with data on over 400 indicators for over 200 countries (Table 1), and mathematical parameters (Table 2) extrapolated from the curves of cases taken from the John Hopkins University (JHU) database [35] for 23 countries, which played a key role during the first epidemic wave [16]. The studied countries were among the first to face the emergency of the COVID-19 outbreak, and some countries neighboring these showed very low levels of infections. These countries were also among those with higher data integrity. TheGlobalEconomy.com database provides reliable and valuable data on foreign countries. Data are collected from multiple official sources, representing a crowd that collaborates to advance knowledge, such as the International Monetary Fund, the World Bank, the United Nations, and the World Economic Forum.
The data collected from John Hopkins University shows a complex heterogeneity. A complete list of countries was exported as an Excel worksheet, the columns containing the numerical values indicating the number of cases per day starting on 22 January 2020. The spreadsheet was exported on 31 May 2020, assuming this as the end of the first wave for the Northern Hemisphere. Multiple factors influenced the way countries collected and reported cases, resulting in very fragmented and non-uniform scenarios. Irregular mathematical shapes characterized these curves, showing peaks where multiple days of cases were grouped together and, subsequently, reported. Knowing that the cases’ increase should follow an approximate exponential growth, all the countries taken into consideration in the study had an approximate bell shape, with the only exceptions being China and France showing a sharp peak because of how the data were recorded.
A homemade code, developed in MATLAB environment, was used for the post-processing of the COVID-19 data, and the mathematical factors obtained are shown in Table 2. The COVID-19 global map was first shared by JHU on 22 January 2020. As said, a report was exported on 31 May 2020 and the mathematical factors, defined in the second column of Table 2, were obtained through the homemade MATLAB code.
Table 3 shows a list of the 23 countries taken into consideration in the study. The number of countries, that is the sample size N, can seem to be low for a complete statistical analysis, however, very intriguing indications on variables’ correlations can be achieved. The columns of Table 3 display only those factors that showed stronger correlations with the mathematical parameters compared to the other factors of Table 1. All factors were obtained from theGlobalEconomy.com database with the exception of the Democratic Index (2019) attained from The Economist Intelligence Unit (2020).
Ultimately, the mathematical pandemic data were then correlated with the economic and socio-political factors thanks to a bivariate correlation study using Pearson’s correlation index. Moreover, an ordinary least squares (OLS) linear regression analysis was also performed to explore, simultaneously, the effects of all independent variables for reaching more theoretically and empirically robust models. Both analyses were performed through SPSS (Statistical Package for the Social Sciences) Statistics 25.

5. Results

The correlation study produced engrossing results showing relationships between economic and social factors with mathematical characteristics of the cases curve. Figure 2 shows the scatter plot with the number of days spent to reach 1000 cases reported on the vertical axis and the economic freedom for 2020 on the horizontal axis. The economic freedom is positively associated with the variable days for 1000, indicating that countries with higher economic freedom spent a longer time reaching the first reported 1000 cases. People in wealthy countries with higher economic freedom have a higher ability to move and, therefore, are better able to spread the virus, showing more resistance in reporting the disease. Undeniably, people who live in rich countries go, on average, on a much higher number of trips, for holidays or work. In this sense, economic freedom certainly plays a key role.
Figure 3 shows a positive correlation of case growth between case one and the peak with health spending as a percent of GDP. A higher number of positives can be easily explained with a health care system more efficient to identify COVID-19 cases. This aspect is the key to reliably depicting the evolution of the epidemic in different countries; this result was also confirmed by a previous study [15].
The negative association between life expectancy and the growth of COVID-19 cases represents an intriguing result (Figure 4). These results may seem to contradict some previous conclusions. We believed that higher well-being indices, i.e., GDP, could be linked to a higher life expectancy, leading to the same correlations since GDP is positively associated with the spread of the virus [37]. Higher GDP results mean a longer life expectancy [38]. However, our results show that the longer the life expectancy, the lower is the growth in cases, as there is for a smaller social interaction and lower mobility for a relevant part of the population. This can be explained by the results of a previous study; younger groups of a population were found to have longer contacts with a higher frequency, contributing more to the spread of infectious diseases [39]. Let us take into consideration the nursing homes, representative of the population aging. In these environments, the virus spread has some limitations and propagates mainly through medical personnel and relatives’ visits, confirming our results [40]. Here, the capacity for the virus of spreading in the entire population decreases with a higher control inbound and outbound, even though the death rate is inevitably higher.
The unemployment rate is positively associated with the delay in days to identify the first case (Figure 5); this aspect may indicate that a society more vulnerable to economic issues is less responsive to the necessary behavioral measures to contain the spread of the coronavirus. It is also important to underline that the epidemic had a specific geographic evolution probably tied to tourism, business relationships, and other as yet unknown factors. This relationship between unemployment rate and first infected in days needs to be further investigated, especially accounting for tourism as a percentage of the GDP and the business relationships with the country believed to be at the origin of the epidemic.
Table 4 contains only those factors that were shown to be associated with coronavirus spread. Table 4 shows correlations between slope10d (see Table 2 for the definition) and the economic growth forecast 2019 and 2020 to confirm the correlation found with the GDP. The slope30d variable weakly correlates with the same economic growth factors, likely as a result of variability in the data. From the table, it is also visible that there is a negative correlation between the happiness index and the growth of cases in the first 30 days since the first case was identified. This relationship can be explained by a tendency of people to follow more containment measures thanks to a higher level of satisfaction and, probably, quality of life. The negative relationship, shown in Figure 6, between the happiness index and the spread of the virus (slope30d) might lead us to think that countries with the highest GDP are among those at the bottom of the happiness ranking, but some studies say roughly the opposite [30]. One explanation is that among the non-wealthy countries, there are those with higher happiness rates and vice versa. According to this theory, COVID-19 seems to spread more in rich countries but not those with a high happiness index.
The linear growth (slope of regression line drawn in the last 36 days before the peak) in Table 4 confirms the relationships found for the slope of regression line drawn between case 1 and the peak with the GDP, health spending as percent of GDP (year 2018), and life expectancy (2018).
The Democratic Index was also found to be negatively correlated with the slope of regression line drawn between case 1 and the subsequent 10 days and 30 days. This result is also very intriguing because it indicates that, at the first stage of the epidemic, the spread in the countries with a higher democratic index had, probably, a higher delay in being recorded, most likely because of the higher freedom and resistance to new rules and habits.
To thoroughly examine the relationships found in Table 4, a more robust multifactor model was built. Table 5 reports the results of the OLS model for the three dependent variables examined (i.e., incr slope 1 max, slope10d, linear growth), with the nine independent variables. The full model shows that the effect of GDP on COVID-19 spread is positive and significant (p-value < 0.05) considering both dependent variables incr slope 1 max and linear growth. This result is consistent with previous studies reported in the introduction section [13,14] and with the results of our correlation study. Similarly, the happiness index effect was found to be positive and significant (p-value < 0.10) for incr slope 1 max and positive and significant (p-value < 0.05) for linear growth. This interesting result confirms the findings of previous studies in which well-being is somehow linked to income and economic growth [31]. In addition, we found a negative and significant (p-value < 0.1) effect of life expectancy on the spread of the coronavirus. This result confirms the outcome of our correlation study, where the longer the life expectancy the lower is the increase in cases, due to limited social interaction and a reduced mobility for a considerable part of the population. The positive and significant (p-value < 0.10) effect of the economic growth forecast (2019) on the progression of the virus spread reinforces the previous relationships found with the GDP and happiness index. The negative and significant (p-value < 0.10) impact of economic freedom on the evolution of the virus spread could be explained by the overall economic freedom favoring group dynamics, limiting the proliferation of the virus. This result seems to contradict our previous relationships and, thus, other studies are required for further investigation of the phenomenon. Overall, the results confirm the hypothesis posited.

6. Discussion

In spite of known correlations already having been partially hypothesized, no actual studies, to the best of our knowledge, have tried to quantify these relationships more comprehensively. In fact, during the first phase of the pandemic, when the cases showed an increasing trend, different demographic, social, economic, and environmental factors were examined to see whether some of them could drive the coronavirus spread. The novelty of the study consists of an analysis of multiple factors simultaneously, as for an exploratory research. Table 5 illustrates the three most theoretically and empirically robust models in which significant relationships between the economic and socio-political factors with the virus spread were drawn. A consequent action to this research should be a deeper study to confirm the relationships’ existence with the assistance of more accurate and complex statistical techniques, using a big data analytics approach along with the support of artificial intelligence [15].
In a previous study, positive correlations were found between the Number of Health Physicians per 1000 Population, Health Total Expense (% of GDP), and GDP Per Capita (in USD) with the COVID-19 spread speed [20]. This result can be easily explained with the higher capability of wealthy countries to put in place more efficiently a tracking system, as confirmed in our study. In the current research paper, a different approach was used to confirm existing relationships between COVID-19 spread and demographic, social, economic, and environmental factors. As shown in Table 4 and Table 5, our study introduces significant correlations between social, political, and economic factors with the virus spread characteristics. The relevant correlations were recorded with regard to the relationships between the features of the epidemic curve and the figures related to the well-being of the countries, linked to GDP and GDP growth forecasts, as well as health expenditure. A higher GDP assures a more resourceful approach to the pandemic containing, detecting, and tracking cases in a more efficient way. Factors such as density and urban population that have already been fully investigated and explained by previous studies [16], were omitted in the current paper.
The different speeds of spreading in the different countries could also be influenced by different levels of exposure to adverse microbes. In poorer countries, people are usually more in contact with them, boosting their immune system [41]. Another reason is probably linked to the average age of people: in almost all the sub-Saharan countries, the average age is under 20 years, while in Germany and in Italy, for example, it is around 45 years; we are aware that COVID-19 presents a much higher severity for older people [34]. Initially, there was a lot of concern about poorer countries and, especially, Africa. It was hypothesized that the virus would cause catastrophic damages. Instead, despite having few and low-level health facilities, the cases and deaths remained mainly under control. While in rich countries an epidemic such as COVID-19 is perceived as extremely threatening for lives and economy, in poorer countries, a virus with low hospitalization and death rates is not considered of health and economic concern. In many African or Middle Eastern countries, there are situations of hunger, more deadly diseases, and even wars, which downgrade the severity of the coronavirus.
The positive correlation between a wealthy healthcare system and the number of detected cases may certainly be explained by a higher number of executed tests for the affluent nations. This results in a system better capable to detect, track, and contain more cases, and ultimately treat more people. These countries will also show a more reliable data scenario of COVID-19 cases and deaths. On the contrary, underprivileged nations may have less ability to report cases, resulting in out-of-control hidden scenarios. A better understanding of these relationships has ethical importance as well as providing fundamental tools to be more prepared for new potential epidemics, preventing their quick spread, and keeping their evolution under control. What may seem surprising is how more advanced social and economic systems are more difficult to stop and more vulnerable during a pandemic.
The positive relationships found between the GDP and economic growth with the spread of the virus through the OLS linear regression model are in line with previous studies [15]. The happiness index was found to be negatively associated with the spread of the virus in the correlation study to indicate that the spread of the coronavirus is more efficient where the level of happiness is lower, but a more robust analysis with linear regression disproved the previous results, confirming that the spread of the virus is higher in countries with a higher happiness index. This aligns with the findings of a study in which a higher happiness index is linked to better well-being in countries with higher income per capita [31]. Moreover, a negative effect of life expectancy was found on the virus spread; this result is illustrated as the tendency of younger people to interact with their peers more recurrently and for a longer time. The behavior difference of younger people compared with older groups makes them more effective spreaders of infectious diseases. Countries with a lower life expectancy should have, in proportion to the total population, a higher number of younger people who contribute more to the increase in the virus spread. The negative impact of economic freedoms on the evolution of the virus spread could be interpreted as showing that the overall economic freedom influences people’s behavior in a way that limits the proliferation of the virus. This result needs to be further analyzed. Overall, the OLS analysis permits a comprehensive overview of what impacts the geographical spread of COVID-19 had, by simultaneously considering several economic and social factors.
The data suggest that the wealthiest countries are mainly those that presented a higher number of cases. These countries are also among those that have adopted stricter lockdown measures with higher economic losses, and this was allowed thanks to their resources. This outbreak showed some weaknesses of human societies: with the virus introducing some geopolitical challenges, there was a vital need for transparent cooperation but it is likely this was not always the case. Big data, such as the collection of details of the worldwide virus spread, are the key to advancing knowledge towards a complete understanding of the phenomenon, and this crowd, constituted by healthcare institutions and researchers, can provide these data explicitly and implicitly. Monetary and social rewards to the crowd were also strategies adopted by governments to boost contributions to advance knowledge on the pandemic characteristics [9]. True data and a transparent course of actions are required in this case to fight a common enemy that can not be defeated with a global combined effort until it is under control in all the countries of the world. Looking at the different strategies and results could be an opportunity to better understand the vulnerability of our economic systems and their subtle balances brought to its knees by an invisible virus. The number of countries used in the research may seem low for a statistical study, but it is the first step to identify new relationships; further studies will be needed to confirm our results. The countries taken into consideration are those that played important roles in the first phase of the spread of the pandemic. Moreover, they showed more reliable data, with the exception of China and France reporting in a single day cases collected in a much wider time window. Further analysis considering a much bigger sample size N, where the data are purged by all the issues, will be necessary to confirm our findings and potentially discover further results.

7. Conclusions

Social, economic, and political variables were taken into consideration to understand which aspects could have played a key role in the growth of infections. This research consists of an exploratory study in which scientifically and practically interesting relationships have been found. The innovation of this study was to use an OLS linear regression to consider, simultaneously, the effects of all studied independent variables. New variables, such as unemployment rate and the happiness index, linked to the already analyzed factors, such as GDP and population density, were taken into consideration. The methodology also introduced original scientific elements such as various mathematical factors that were obtained and used for the analysis. However, further studies will be needed to confirm the identified effects. In so doing, the study advances previous studies that focused on a few aspects at a time, and provides a holistic overview of what drives COVID-19 spread. In addition to advancing scientific knowledge, the outcomes of the study will allow policymakers to play with those factors that show they have an impact on the spread of the virus. Moreover, optimal measures can be adopted to boost economic growth with a minimum impact on the social life.
The research is not without limitations since our study considered a limited number of countries and the spread of the virus only during a single “wave”. Future studies could confirm our findings taking into consideration the same factors collected in subsequent years. Moreover, pandemic data could be collected for a wider time window. The lessons learned with this pandemic being linked as well to all the features of humans’ life will be vital to preventing the onset of new epidemics, and this will benefit the economic, social, and environmental sustainability of human society. The economy will benefit as optimal containment measures could be adopted avoiding strict lockdown. The effect of minimum measures has also an impact on social sustainability for creating successful societies that promote well-being by understanding the basic needs of people related to places where they live and work. The amount of green space in the highly densely populated city emerges as a further need for creating places on a human scale that focus on air quality and physical and mental health. The pandemic is continuously evolving and it would be very interesting to confirm our results with additional studies. The contribution of the study aimed to discover a link between social, economic, and health sides endorsed and inspired by the philosopher Bernard Henri-Lévy: “the epidemic is a social phenomenon that has some medical aspects”.

Author Contributions

Conceptualization, L.D. and V.A.I.; methodology, L.D. and F.F.; software, L.D. and F.M.; validation, L.D., V.A.I., and F.M.; formal analysis L.D. and V.A.I.; investigation, L.D., V.A.I., and F.D.L.; data curation, L.D., V.A.I., and F.M.; writing—original draft preparation, L.D., V.A.I., and F.D.L.; writing—review and editing, L.D., V.A.I., F.M., F.D.L., and F.F.; supervision, L.D. and F.F. All authors have read and agreed to the published version of the manuscript.

Funding

This research received no external funding.

Institutional Review Board Statement

Not applicable.

Informed Consent Statement

Not applicable.

Data Availability Statement

I will provide all my data and implemented codes to whoever will request them.

Conflicts of Interest

The authors declare no conflict of interest.

References

  1. Grosse, M.; Pohlisch, J.; Korbel, J.J. Triggers of Collaborative Innovation in Online User Communities. J. Open Innov. Technol. Mark. Complex. 2018, 4, 59. [Google Scholar] [CrossRef] [Green Version]
  2. Li, M.; Chen, J.; Deng, Y. Scaling features in the spreading of COVID-19. arXiv 2020, arXiv:2002.09199. [Google Scholar]
  3. Biswas, K.; Khaleque, A.; Sen, P. Covid-19 spread: Reproduction of data and prediction using a SIR model on Euclidean network. arXiv 2020, arXiv:2003.07063. [Google Scholar]
  4. Jia, J.; Ding, J.; Liu, S.; Liao, G.; Li, J.; Duan, B.; Wang, G.; Zhang, R. Modeling the Control of COVID-19: Impact of Policy Interventions and Meteorological Factors. arXiv 2020, arXiv:2003.02985. [Google Scholar]
  5. Dinia, L.; Mangini, F.; Marella, M.A.; Frezza, F. Parallelism between risk and perception of risk among caregivers during anesthesia delivery. Eur. Rev. Med Pharmacol. Sci. 2019, 23, 3129–3141. [Google Scholar]
  6. Cori, L.; Bianchi, F.; Cadum, E.; Anthonj, C. Risk Perception and COVID-19. Int. J. Environ. Res. Public Health 2020, 17, 3114. [Google Scholar] [CrossRef]
  7. Dinia, L.; Mangini, F.; Frezza, F. Can the Perception of Risk Be Decreased among Caregivers during Anesthesia Delivery? In Proceedings of the 2018 IEEE International Symposium on Medical Measurements and Applications (MeMeA), Rome, Italy, 11–13 June 2018; pp. 1–6. [Google Scholar]
  8. Dinia, L.; Mangini, F.; Mileti, I.; Palermo, E.; Frezza, F. Adverse Patient Events in Anesthesia Delivery—Review and Analysis of Potentially Avoidable Events. In Proceedings of the 2020 IEEE International Symposium on Medical Measurements and Applications (MeMeA), Bari, Italy, 1–3 June 2020; pp. 1–5. [Google Scholar]
  9. Cappa, F.; Rosso, F.; Hayes, D. Monetary and Social Rewards for Crowdsourcing. Sustainability 2019, 11, 2834. [Google Scholar] [CrossRef] [Green Version]
  10. Cappa, F.; Rosso, F.; Capaldo, A. Visitor-Sensing: Involving the Crowd in Cultural Heritage Organizations. Sustainability 2020, 12, 1445. [Google Scholar] [CrossRef] [Green Version]
  11. Franzoni, C.; Sauermann, H. Crowd science: The organization of scientific research in open collaborative projects. Res. Policy 2014, 43, 1–20. [Google Scholar] [CrossRef] [Green Version]
  12. Natalicchio, A.; Petruzzelli, A.M.; Garavelli, A. Innovation problems and search for solutions in crowdsourcing platforms—A simulation approach. Technovation 2017, 64, 28–42. [Google Scholar] [CrossRef]
  13. Makridis, C.; Hartley, J. The Cost of COVID-19: A Rough Estimate of the 2020 US GDP Impact. Spec. Ed. Policy Brief 2020. [Google Scholar] [CrossRef]
  14. Maliszewska, M.; Mattoo, A.; Van Der Mensbrugghe, D. The Potential Impact of COVID-19 on GDP and Trade: A Preliminary Assessment. World Bank Policy Research Working Paper. 2020. Available online: https://ssrn.com/abstract=3573211 (accessed on 10 December 2021).
  15. Gangemi, S.; Billeci, L.; Tonacci, A. Rich at risk: Socio-economic drivers of COVID-19 pandemic spread. Clin. Mol. Allergy 2020, 18, 1–3. [Google Scholar] [CrossRef]
  16. Mogi, R.; Spijker, J. The influence of social and economic ties to the spread of COVID-19 in Europe. J. Popul. Res. 2021, 1–17. [Google Scholar] [CrossRef] [PubMed]
  17. Kapitsinis, N. The underlying factors of the COVID-19 spatially uneven spread. Initial evidence from regions in nine EU countries. Reg. Sci. Policy Pract. 2020, 12, 1027–1045. [Google Scholar] [CrossRef]
  18. Erdem, O. Freedom and stock market performance during Covid-19 outbreak. Financ. Res. Lett. 2020, 36, 101671. [Google Scholar] [CrossRef]
  19. Tantrakarnapa, K.; Bhopdhornangkul, B.; Nakhaapakorn, K. Influencing factors of COVID-19 spreading: A case study of Thailand. J. Public Health 2020, 19, 1–7. [Google Scholar] [CrossRef]
  20. Farseev, A.; Chu-Farseeva, Y.Y.; Yang, Q.; Loo, D.B. Understanding Economic and Health Factors Impacting the Spread of COVID-19 Disease. MedRxiv 2020. preprint. [Google Scholar] [CrossRef]
  21. Lai, C.C.; Shih, T.P.; Ko, W.C.; Tang, H.J.; Hsueh, P.R. Severe acute respiratory syndrome coronavirus 2 (SARS-CoV-2) and coronavirus disease-2019 (COVID-19): The epidemic and the challenges. Int. J. Antimicrob. Agents 2020, 55, 105924. [Google Scholar] [CrossRef]
  22. Anderson, R.M.; Heesterbeek, H.; Klinkenberg, D.; Hollingsworth, T.D. How will country-based mitigation measures influence the course of the COVID-19 epidemic? Lancet 2020, 395, 931–934. [Google Scholar] [CrossRef]
  23. Jindal, C.; Kumar, S.; Sharma, S.; Choi, Y.M.; Efird, J.T. The Prevention and Management of COVID-19: Seeking a Practical and Timely Solution. Int. J. Environ. Res. Public Health 2020, 17, 3986. [Google Scholar] [CrossRef]
  24. Fauci, A.S.; Lane, H.C.; Redfield, R.R. COVID-19—Navigating the Uncharted. N. Engl. J. Med. 2020, 382, 1268–1269. [Google Scholar] [CrossRef] [PubMed]
  25. Yang, Y.; Shang, W.; Rao, X. Facing the COVID-19 outbreak: What should we know and what could we do? J. Med. Virol. 2020, 92, 536–537. [Google Scholar] [CrossRef] [PubMed] [Green Version]
  26. Pramanik, M.; Udmale, P.; Bisht, P.; Chowdhury, K.; Szabo, S.; Pal, I. Climatic factors influence the spread of COVID-19 in Russia. Int. J. Environ. Health Res. 2020, 1–16. [Google Scholar] [CrossRef] [PubMed]
  27. Dowd, J.B.; Andriano, L.; Brazel, D.M.; Rotondi, V.; Block, P.; Ding, X.; Liu, Y.; Mills, M.C. Demographic science aids in understanding the spread and fatality rates of COVID-19. Proc. Natl. Acad. Sci. USA 2020, 117, 9696–9698. [Google Scholar] [CrossRef] [PubMed] [Green Version]
  28. Fattorini, D.; Regoli, F. Role of the chronic air pollution levels in the Covid-19 outbreak risk in Italy. Environ. Pollut. 2020, 264, 114732. [Google Scholar] [CrossRef] [PubMed]
  29. Nakada, L.Y.K.; Urban, R.C. COVID-19 pandemic: Environmental and social factors influencing the spread of SARS-CoV-2 in São Paulo, Brazil. Environ. Sci. Pollut. Res. 2020, 28, 40322–40328. [Google Scholar] [CrossRef]
  30. McKibbin, W.J.; Fernando, R. The Global Macroeconomic Impacts of COVID-19: Seven Scenarios. Asian Econ. Pap. 2021, 20, 1–30. [Google Scholar] [CrossRef]
  31. Clark, A.E.; Senik, C. IZA DP No. 5595: Will GDP Growth Increase Happiness in Developing Countries. In Measure For Measure: How Well Do We Measure Development; Peccoud, R., Ed.; STIN: Paris, France, 2011. [Google Scholar]
  32. Kumar, M.; Woo, J. Public Debt and Growth. IMF Working Papers, No. 10/174; International Monetary Fund: Washington, DC, USA, 2010. [Google Scholar]
  33. Karabulut, G.; Zimmermann, K.F.; Bilgin, M.H.; Doker, A.C. Democracy and COVID-19 outcomes. Econ. Lett. 2021, 203, 109840. [Google Scholar] [CrossRef]
  34. Sobotka, T.; Brzozowska, Z.; Muttarak, R.; Zeman, K.; di Lego, V. Age, gender and COVID-19 infections. MedRxiv 2020. submitted. [Google Scholar] [CrossRef]
  35. Dong, E.; Du, H.; Gardner, L. An interactive web-based dashboard to track COVID-19 in real time. Lancet Infect. Dis. 2020, 20, 533–534. [Google Scholar] [CrossRef]
  36. Economist Intelligence Unit. Democracy Index 2019. A Year of Democratic Setbacks and Popular Protest. 2020. Available online: https://ictlogy.net/bibliography/reports/projects.php?idp=4173&lang=ca (accessed on 10 December 2021).
  37. He, L.; Li, N. The linkages between life expectancy and economic growth: Some new evidence. Empir. Econ. 2020, 58, 2381–2402. [Google Scholar] [CrossRef]
  38. Kennelly, B.; O’Shea, E.; Garvey, E. Social capital, life expectancy and mortality: A cross-national examination. Soc. Sci. Med. 2003, 56, 2367–2377. [Google Scholar] [CrossRef]
  39. Mossong, J.; Hens, N.; Jit, M.; Beutels, P.; Auranen, K.; Mikolajczyk, R.; Massari, M.; Salmaso, S.; Tomba, G.S.; Wallinga, J.; et al. Social Contacts and Mixing Patterns Relevant to the Spread of Infectious Diseases. PLoS Med. 2008, 5, e74. [Google Scholar] [CrossRef] [PubMed]
  40. Ouslander, J.G.; Grabowski, D.C. COVID-19 in Nursing Homes: Calming the Perfect Storm. J. Am. Geriatr. Soc. 2020, 68, 2153–2162. [Google Scholar] [CrossRef]
  41. Nordling, L. Africa’s pandemic puzzle: Why so few cases and deaths? Science 2020, 369, 756–757. [Google Scholar] [CrossRef]
Figure 1. Fishbone diagram showing the main factors potentially influencing the coronavirus spread.
Sustainability 14 01768 g001
Figure 2. Scatter plot showing positive correlation between the number of days spent reaching 1000 cases and the economic freedom.
Sustainability 14 01768 g002
Figure 3. Scatter plot showing positive correlation between the slope of the regression line between case 1 and the peak and the health spending as percent of GDP.
Sustainability 14 01768 g003
Figure 4. Scatter plot showing negative correlation between the slope of the regression line between case 1 and the peak and the life expectancy.
Sustainability 14 01768 g004
Figure 5. Scatter plot showing positive correlation between the number of days to have the first case starting from 22 January 2020 and the unemployment rate.
Sustainability 14 01768 g005
Figure 6. Scatter plot showing negative correlation between the slope of regression line drawn between case 1 and the subsequent 30 days and the happiness index.
Sustainability 14 01768 g006
Table 1. List of investigated economic and socio-political factors with relative definitions. All factors were obtained from theGlobalEconomy.com database with the exception of the Democratic Index (2019) attained from The Economist Intelligence Unit [36].
FactorDefinition
Density (p/km2; 2018)Midyear population divided by land area in square kilometers provides the population density. The definition of population is based on the count of all residents regardless of legal status or citizenship, except for refugees not permanently settled in the country of asylum. Land area consists of a country’s total area, with the exception of area under national claims to continental shelf, inland water bodies, and privileged economic zones. Usually, the definition of inland water bodies covers major rivers and lakes.
Forest area (%; 2016)Forest area includes land under natural or planted stands of trees of at least 5 m in situ, whether productive or not.
Agriculture land (%; 2016)Agricultural land is the portion of land area that is farmable, under perpetual crops, and under perpetual pastures.
Urban population (%; 2018)Urban population includes people living in urban areas as defined by national statistical offices.
GDP (constant dollars; 2019)GDP at purchaser’s prices is the sum of gross value added by all resident producers in the economy plus any product taxes and minus any subsidies not covered in the value of the products.
Public debt (% GDP; 2019)Public debt is the common term for referring to general government gross debt. It is the nominal (face) value of total gross debt pending at the end of the period and built up within and between the government subsectors.
Pay gender gap (global gender gap index; 0–1) Average difference between the remuneration for men and women who are working.
Unemployment rate (%; 2019)Unemployment pertains to the share of the labor force available for and seeking employment that is, however, without work.
Economic growth forecast (2019)Year-on-year percent changes in constant price GDP. The base year is country-specific. Expenditure-based GDP is the total final expenditure at purchasers’ prices counting the f.o.b. value of services and exports of goods, less the f.o.b. value of services and imports of goods.
Economic growth forecast (2020)Year-on-year percent changes in constant price GDP. The base year is country-specific. Expenditure-based GDP is the total final expenditure at purchasers’ prices counting the f.o.b. value of services and exports of goods, less the f.o.b. value of services and imports of goods.
Government effectiveness (−2.25 weak; 2.25 strong)The index of government effectiveness captures perceptions of the quality of public services, the quality of policy formulation and implementation, the quality of the civil service and the degree of its independence from political pressures, and the credibility of the government’s commitment to such policies.
Political stability (−2.5 weak; 2.5 strong)The index of Political Stability and Absence of Violence/Terrorism quantifies perceptions of the chance that the government will be destabilized or overthrown by unconstitutional or violent means, including politically motivated violence and terrorism. The index represents a combination of several other indexes from the Economist Intelligence Unit, the World Economic Forum, and the Political Risk Services, among others.
Democratic index (0–10; 2019)The index intends to estimate the state of democracy in 167 countries.
Economic freedom, overall index (0–100; 2020)The overall index of economic freedom contains ten components grouped into four broad categories: Rule of Law; Limited Government; Regulatory Efficiency; Open Markets.
Health spending as percent of GDP (2018)Level of present health expenditure expressed as a percentage of GDP. Estimates of present health expenditures include healthcare services and goods consumed during each year. This indicator does not include capital health expenditures such as buildings, IT, machinery, and stocks of vaccines for outbreaks or emergencies.
Life expectancy (2018)Life expectancy at birth implies the number of years a newborn infant would live if prevailing patterns of mortality at the time of its birth were to stay the same throughout its life.
Globalization index (overall: political, economic, social) (0–100; 2017)The overall index of globalization includes the social, economic, and political dimensions of globalization. Higher values indicate greater globalization.
Fragile State Index 0 (low)–120 (high) (2019)The Fragile States Index assesses the vulnerability in pre-conflict, active conflict, and post-conflict situations. The index consists of twelve conflict risk indicators that are used to evaluate the condition of a state at any given moment: security apparatus, factionalized elites, economic decline, uneven economic development, group grievance, human flight and brain drain, state legitimacy, human rights and rule of law, demographic pressures, public services, refugees and IDPs, and external intervention. The higher the value of the index, the more “fragile” the country is.
Tourism–international tourism revenue/GDP (2018)International tourism receipts are expenditures by international inbound visitors, including payments to national carriers for international transport. These receipts cover any other prepayment made for services and goods or received in the destination country.
Happiness index (1–10; 2020)The Happiness ranking is a section of the World Happiness Report. The country scores are obtained from a survey in which respondents assess the quality of their current lives on a scale of 1 to 10.
Table 2. Mathematical parameters obtained through a homemade MATLAB code with relative definitions.
Mathematical ParametersDefinition
day_for_1000Number of days to reach 1000 cases starting from case 1
day_for_peakNumber of days to reach the peak starting from case 1
incr_slope_1_maxSlope of regression line drawn between case 1 and the peak
slope10dSlope of regression line drawn between case 1 and the subsequent 10 days
slope30dSlope of regression line drawn between case 1 and the subsequent 30 days
first_infected_in_daysNumber of days to have the first case from 22 January 2020
linear_growthSlope of regression line drawn in the last 36 days before the peak
Table 3. Values for 10 of the considered economic and socio-political factors exported on 31 July 2020 for the list of 23 countries under study.
CountryDensity (p/km2; 2018)GDP (Constant Dollars; 2019)Economic Growth Forecast (2019)Economic Growth Forecast (2020)Democratic Index (0–10; 2019)Health Spending as Percent of GDP (year 2018)Life Expectancy (2018)Happiness Index (1–10; 2020)Unemployment Rate (%; 2019)Economic Freedom, Overall Index (0–100; 2020)
Italy20520840.3−9.137.528.6783.356.399.2264
USA3620,5542.33−5.917.9616.8978.546.943.8777
Spain9414191.98−88.298.9883.436.414.767
China14813,6086.111.182.265.3576.75.124.4260
UK27528551.41−6.58.521081.267.163.8179
Brazil2518691.13−5.36.869.5175.466.3812.2254
Sweden255561.23−6.799.3910.982.567.356.8475
Albania105152.21−5.015.895.2678.464.8813.9667
Greece832181.85−10.047.437.7281.795.5118.0860
Japan34749710.65−5.167.9910.9584.215.872.4173
South Korea53016192.03−1.1887.5682.635.873.7174
Russia916581.34−5.473.115.3272.665.554.5561
France12229251.31−7.188.1211.2682.726.669.166
Germany23739480.57−6.958.6811.4380.997.083.274
Hong Kong7096362−1.19−4.826.02 84.935.512.7689
Singapore7953328.40.73−3.476.024.4683.156.383.6289
Finland182690.98−6.039.259.0481.737.816.5976
Portugal112246.72.16−88.039.4181.325.916.3367
New Zealand19185.862.2−7.219.269.2181.867.34.0784
Norway15489.31.15−6.279.8710.0582.767.493.3573
Taiwan 5892.71−4.037.73 6.46 77
Israel411308.73.5−6.297.867.5282.87.133.8674
Turkey1071240.50.94−54.094.1277.845.1313.4964
Table 4. Correlations between socio-economic and mathematical pandemic data. For each crossing in the table, the top value is the Pearson’s correlation index, the middle is the p-value, and the bottom is the sample size.
GDP (Constant Dollars; 2019)Economic Growth Forecast (2019)Economic Growth Forecast (2020)Democratic Index (0–10; 2019) *Health Spending as Percent of GDP (Year 2018)Economic Freedom, Overall Index (0–100; 2020)Life Expectancy (2018)Happiness Index (1–10; 2020)Unemployment Rate (%; 2019)
days for 1000 0.546 **
0.009
22
incr slope 1_max0.824 ** 0.491 * −0.489 *
0.000 0.028 0.025
22 20 21
slope10d0.485 *0.711 **0.630 **−0.576 **
0.0190.0000.0010.004
23232323
slope30d −0.693 ** −0.667 **
0.000 0.001
23 23
first infected in days 0.512 *
0.015
22
linear growth0.881 ** 0.556 * −0.524 *
0.000 0.011 0.015
22 20 21
* Correlation is significant at the 0.05 level (2-tailed). ** Correlation is significant at the 0.01 level (2-tailed).
Table 5. incr slope 1 max, slope10d, and linear growth are dependent variables, the factors listed in the rows are independent variables. Coefficient, std. error, and p-value are reported per each crossing. The significant (* stands for p-value < 0.1; ** stands for p-value < 0.05) correlations are highlighted in bold.
OLS Linear Regression Model
Incr Slope 1_MaxSlope10dLinear Growth
Prob > F 0.001Prob > F 0.002Prob > F 0.000
R Square 0.894R Square 0.849R Square 0.953
VariableCoefficient
Std. Error
p-value
Coefficient
Std. Error
p-value
Coefficient
Std. Error
p-value
GDP (constant dollars; 2019)0.023 **
0.009
0.028
0.003
0.003
0.328
0.001 **
0.000
0.011
Economic growth forecast (2019)−2.872
15.000
0.852
9.950 *
4.511
0.050
0.455
0.667
0.510
Economic growth forecast (2020)4.030
8.227
0.635
2.635
2.915
0.385
0.204
0.366
0.590
Democratic index (0–10; 2019) *−11.282
28.702
0.703
−2.921
10.500
0.786
−0.905
1.276
0.494
Health spending as percent of GDP (year 2018)−7.140
19.730
0.725
−5.309
7.130
0.472
0.111
0.877
0.902
Economic freedom, overall index (0–100; 2020)−3.270
2.777
0.266
−1.764 *
0.880
0.070
−0.090
0.123
0.480
Life expectancy (2018)−3.864
7.338
0.610
3.593
2.462
0.172
−0.620 *
0.326
0.086
Happiness index (1–10; 2020)57.426 *
27.103
0.060
13.390
9.106
0.169
2.959 **
1.205
0.034
Unemployment rate (%; 2019)5.910
4.210
0.191
−0.750
1.530
0.634
0.238
0.187
0.233
Intercept326.363
585.286
0.589
−181.707
207.190
0.399
43.008
26.018
0.129
* Correlation is significant at the 0.05 level (2-tailed). ** Correlation is significant at the 0.01 level (2-tailed). Only the significant correlations are highlighted in bold.
Publisher’s Note: MDPI stays neutral with regard to jurisdictional claims in published maps and institutional affiliations.

