Article

Short-Term Effects of Reclamation of Aquaculture Ponds to Paddy Fields on Soil Chemical Properties and Bacterial Communities in Eastern China Coastal Zone

1
School of Geographic Science, Nantong University, Nantong 226019, China
2
Jiangsu Yanjiang Institute of Agricultural Sciences, Nantong 226541, China
3
College of Life Sciences and Agronomy, Zhoukou Normal University, Zhoukou 466001, China
*
Authors to whom correspondence should be addressed.
A.H. and M.L. contributed equally to this work.
Sustainability 2022, 14(3), 1613; https://doi.org/10.3390/su14031613
Submission received: 7 January 2022 / Revised: 27 January 2022 / Accepted: 28 January 2022 / Published: 29 January 2022

Abstract

:
Large areas of tidal flats were previously developed into aquaculture ponds and were recently encouraged to be converted into paddy fields to fulfill food and economic needs in China. However, the influences of short-term rice cultivation at the reclaimed aquaculture ponds on soil chemical properties and bacterial communities are poorly understood. To address this issue, we collected mineral soil samples at 0–20 and 20–40 cm depths from non-cultivated soils and paddy fields after being reclaimed from aquaculture ponds in Nantong, China, and identified soil bacterial communities using high-throughput sequencing. The results suggested that rice cultivation significantly increased the accumulation of total soil carbon (TC) and dissolved organic carbon (WSOC). The pH, ammonium (NH4+), nitrate (NO3) and available phosphorus (AP) varied with the reclamation duration but did not show a unanimous tendency. Proteobacteria, Acidobacteria, Bacteroidetes, Chloroflexi and Planctomycetes dominated the bacterial community in both non-cultivated and cultivated soils after reclamation regardless of cultivation ages and soil depth. The variations in the diversity and composition of the soil microbial community were mainly associated with electrical conductivity (EC), WSOC, TC, NH4+ and NO3 in non-cultivated and cultivated lands. Here, we found that short-term rice cultivation at the reclaimed aquaculture ponds strongly influenced soil bacterial communities and chemical properties, especially in the 0–20 cm depth, in the coastal regions.

1. Introduction

Nowadays, the conflict of the expansion of construction land and the protection of cultivated land has attracted more and more attention in urbanizing China. It is difficult to maintain the “red line” of 120 million hectares of cultivated land proposed by the state [1]. The Chinese coastal zone, 95% of which is intertidal belt affected by soluble salt, occupies an area of 2.17 × 10⁶ hm2 [2,3]. As one of the most important land reserve resources, coastal mudflat area development will contribute to compensate for the losses of arable land [4]. More than 2.2 × 10⁴ km2 of coastal mudflats have been reclaimed mainly for agricultural and aquaculture purposes since the 1950s [5].
The coastal aquaculture ponds have increased continuously from 2612 km2 in 1984 to 13,075 km2 in 2016 in China, which have been the fastest developing and expanding land-use type in the coastal mudflat regions [6]. The reclamation of coastal mudflat areas for aquaculture ponds has brought a lot of economic benefits. However, it also leads to many negative effects on the coastal ecosystem, including reducing biodiversity in tidal flats and destructions of the coastal habitats of migratory birds [7,8]. For the sustainable development of the coastal ecosystem, in recent years, many of the previously used aquaculture ponds have been converted to other land use types. In coastal reclaimed soils, the salt content is relatively high and unfavorable for the growth and development of plants. However, the coastal reclamation area of Jiangsu has the advantages of a mild climate, abundant rainfall, sufficient light and heat of the sun and a long frost-free period, which provide the possibility for rice cultivation. During the whole rice-growing period, the rainfall and continuous irrigation has beneficial effects on leaching the soluble salts to deeper soil layer. Thus, in the regions with relatively abundant freshwater resources, rice planting is of great significance for the improvement and remediation of saline-alkali soil. Soil bacteria play a vital role in many soil processes and plant growth; previous studies have shown that soil microbial communities can be affected by cultivation and cultivation duration (e.g., decades) after reclamation [9,10]. However, the influence of short-term rice cultivation at the reclaimed aquaculture ponds on soil chemical properties and bacterial communities in the coastal areas of China has not been well studied.
Nantong, one of three main coastal cities in Jiangsu province, situated at the northern plain of the Yangtze River next to the East China Sea, has abundant mudflats soil resources and a long history of mudflats reclamation. Understanding how soil bacterial communities respond to land-use changes is of great importance to the soil’s healthy and sustainable agricultural development. Thus, we conducted a study to compare soil chemical properties and bacterial community differences between cultivated and non-cultivated lands’ reclaimed aquaculture ponds. We hypothesized that the cultivation of rice and its duration would affect the chemical properties of the reclaimed soils and bacterial community composition. In this study, the objectives were to examine (1) the soil bacterial community composition and diversity in between paddy soils after one or two years of rice cultivation and in non-cultivated soils reclaimed from aquaculture ponds and (2) the key soil chemical variables that caused the differences in soil bacterial communities between cultivated and non-cultivated soils.

2. Materials and Methods

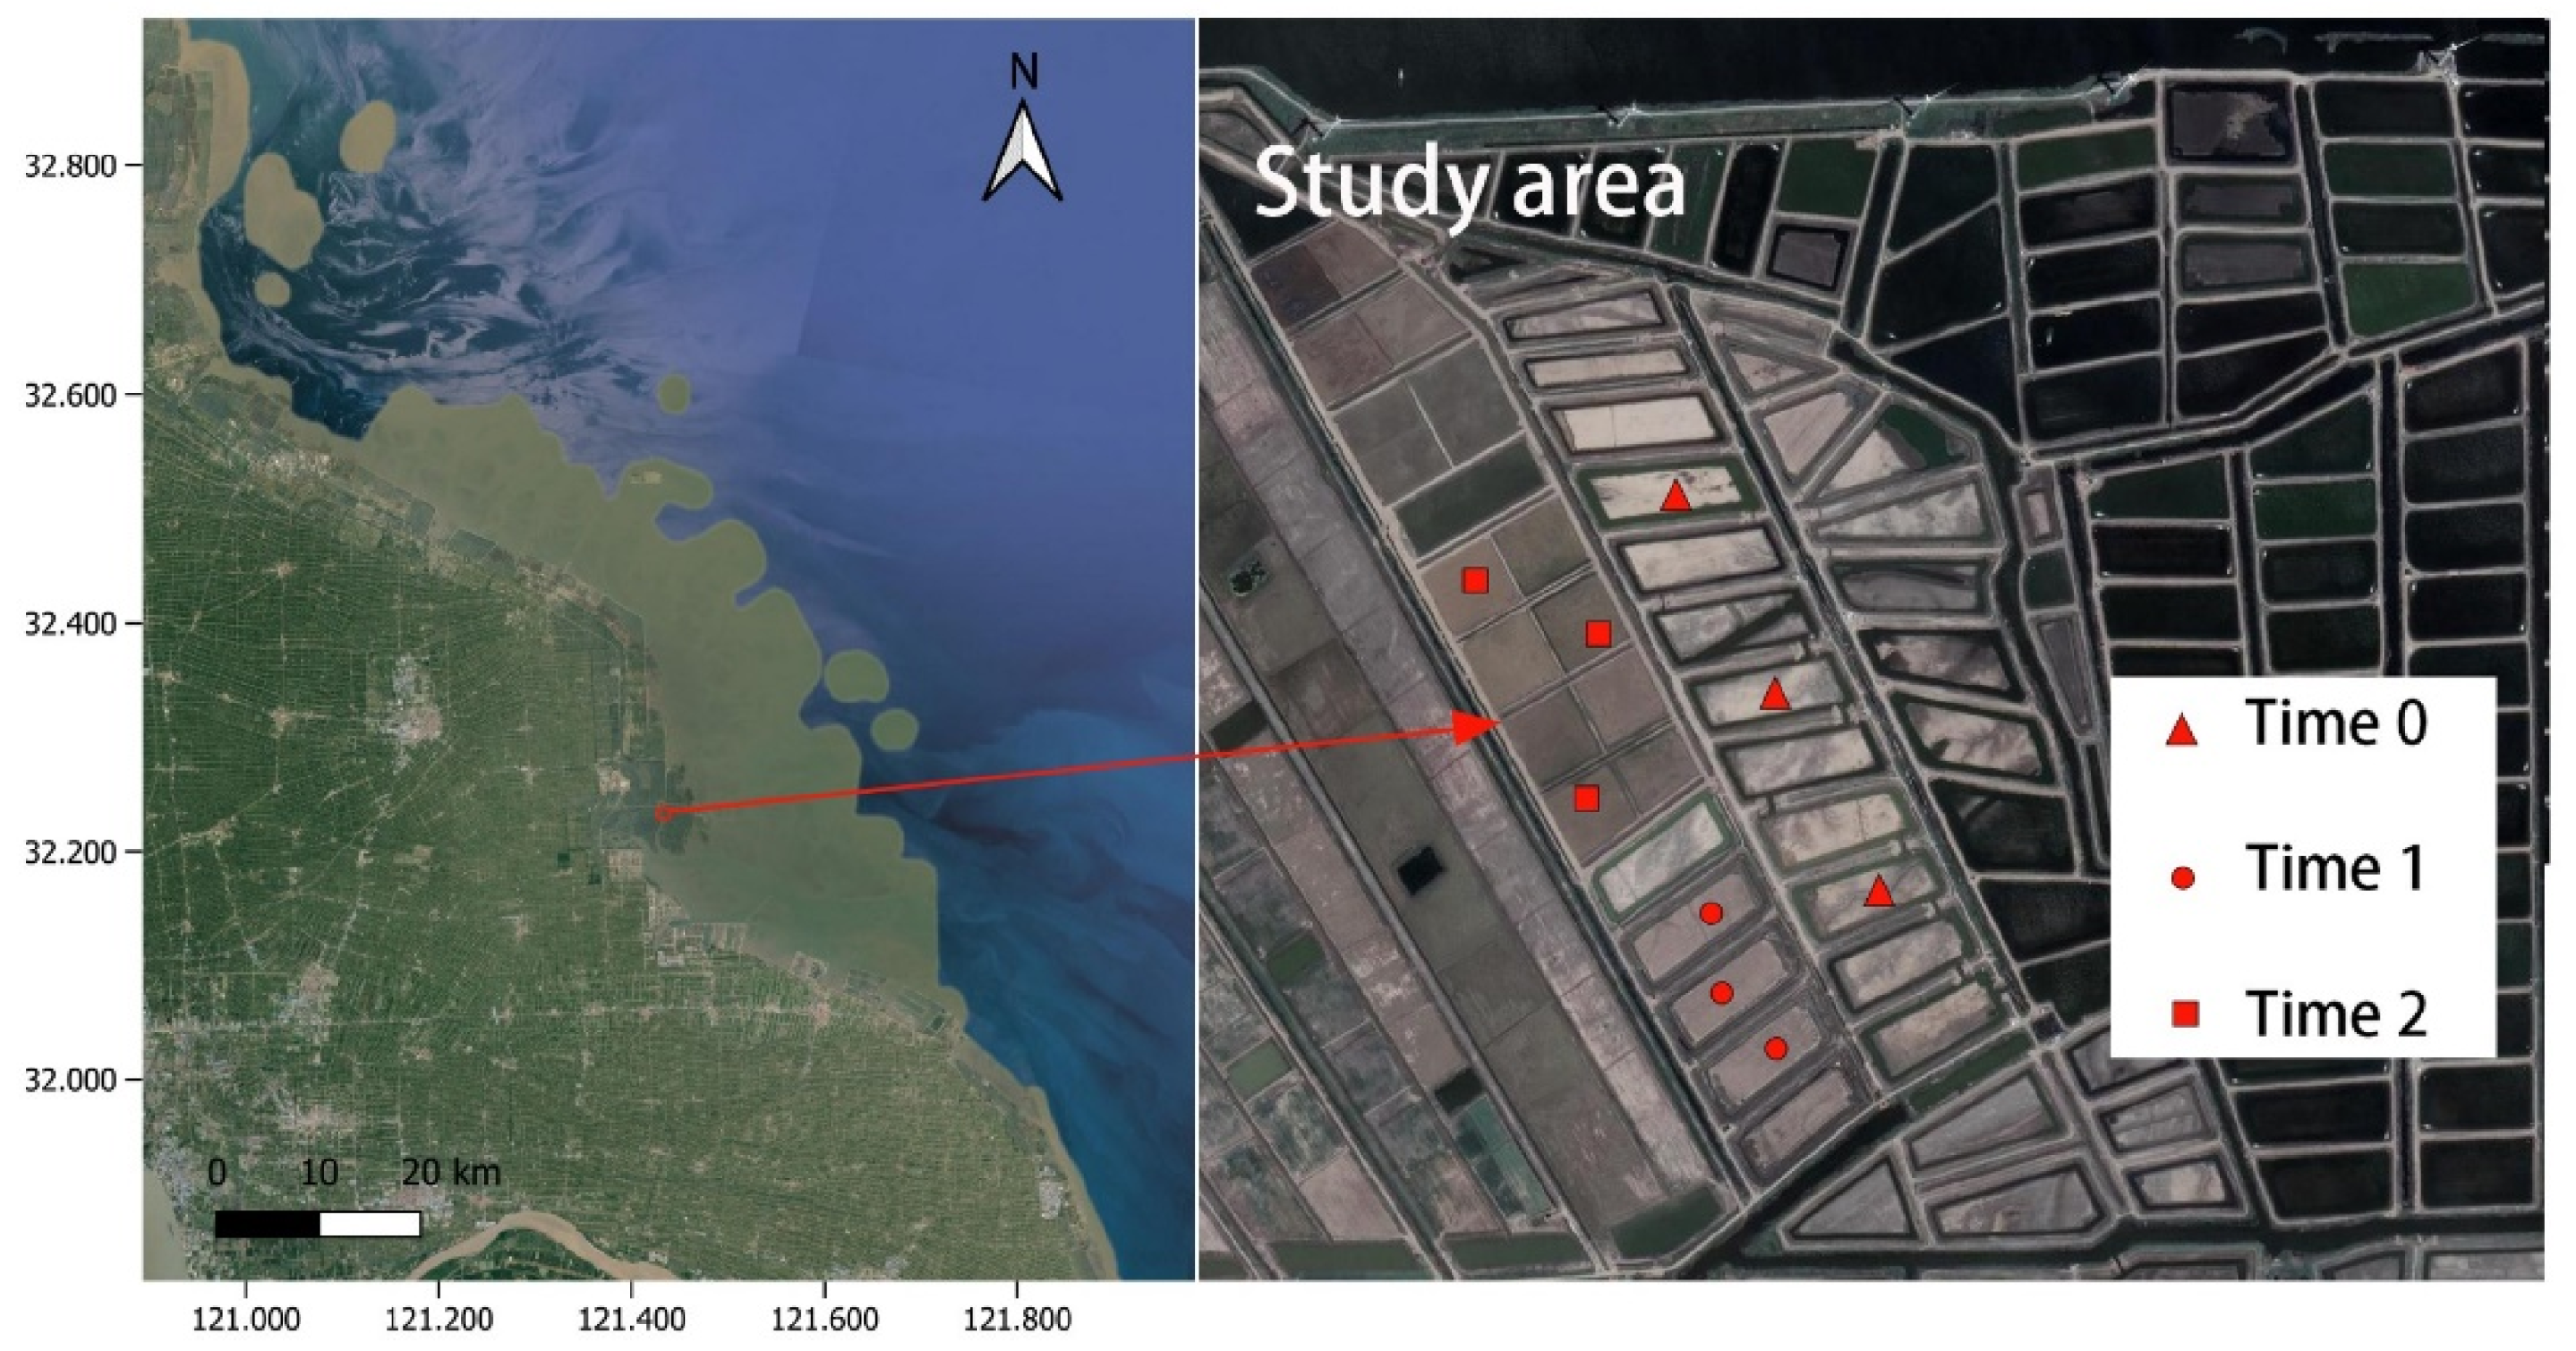
2.1. Study Site Information and Sample Collection

The reclamation sites of coastal aquaculture ponds (121°18′ E, 32°32′ N) are shown in Figure 1, which is located in Rudong County of Nantong in Jiangsu Province, China. The experimental sites belong to the northern subtropical oceanic monsoon climate zone. The annual average temperature and precipitation are 14.8 °C and 1074.6 mm, respectively. The primary soil type of Rudong was classified as Mollic Fluvisols [11]. Soils in this reclamation area are characterized by high content of sand due to the deposition of modern marine and fluvial sediments.
The experimental plots were reclaimed from mariculture ponds of tidal flats. The feed of aquaculture ponds was supplied with frozen and crushed fish and shrimps. The paddy fields were continuously flooded with fresh water to a depth of about 0.08 m and then drained for two weeks before harvest. According to the local fertilization and pest management practice, the compound fertilizer was applied as basal fertilizer (N 15%, P2O5 15%, K2O 15%) for 750 kg·ha−1, and the nitrogen fertilizer was top-dressed with 180 and 225 kg·ha−1 of urea at tiller and heading stages, respectively. Soil samples from the areas of non-cultivated (Time 0) and after 1 (Time 1) and 2 (Time 2) years of rice cultivation at 0–20 and 20–40 cm depths were collected in November 2019 after rice was harvested. Three randomized sampling plots (30 × 20 m) were established in each sampling site. Soil samples were collected using a 6-cm-diameter hollow auger. Samples taken from five points in each plot were mixed in a single sample. The soil samples were placed in sterile zip-lock plastic bags and rapidly transferred to an insulated cooler with ice packs. After transfer to the laboratory, the fresh soil samples were passed through a 2.0-mm mesh screen to remove fine roots and litter. About 30 g of each sample was preserved at −80 °C prior to DNA extraction. The remaining soil samples were air dried in the shade and ground to pass through a 0.85- and 0.149-mm sieve before further analysis.

2.2. Analysis of Soil Chemical Properties

Soil properties were determined, including pH, electrical conductivity (EC), water-soluble organic carbon (WSOC), Olsen P (available phosphorus, AP), total carbon (TC), total nitrogen (TN), ammonium (NH4+-N) and nitrate (NO3-N). The soil pH was measured in a 1:2.5 (w/v) soil/water extracts using a pH meter (F2-Standard, Mettler Toledo, Shanghai, China). EC was measured in a 1:5 (w/v) soil/water suspension using a portable conductivity meter (F3-Standard, Mettler Toledo, Shanghai, China). WSOC was obtained by extracting 10.0 g air-dried soil with an addition of 20 mL ddH2O. After shaking on a reciprocal shaker at 180 rpm for 1 h and centrifuging at 4000 rpm for 10 min, the supernatant was then filtered through a 0.45-μm filter membrane. The concentration of WSOC was determined by a TOC analyzer (Analytik Jena AG multi N/C3100, Jena, Germany) [12]. The Olsen P was extracted from 2.5 g of soil in 40-mL 0.5 M NaHCO3 at 180 rpm for 30 min, and the concentration of P in the filtrates was determined using molybdenum blue colorimetry with a UV spectrophotometer at 660 nm [13]. TC and TN were measured via combustion method using an elemental analyzer (Elementar Vario EL CUBE, Langenselbold, Germany). NH4+-N and NO3-N were extracted by shaking 5 g of fresh soil in 20 mL 1 M KCl solution for 1 h and then analyzed by a continuous flow autoanalyzer (Skalar San++, Breda, Holland) [14].

2.3. DNA Extraction and PCR Amplification

A 0.5 g soil sample was used for soil DNA extraction following the manufacturer’s protocol using the FastDNA SPIN Kit (MP Biomedicals, Santa Ana, CA, USA). The quality of soil DNA was determined by electrophoresis on 1% agarose gels. The concentration of extracted DNA was quantified using a NanoDrop-2000 spectrophotometer at OD260 nm/OD280 nm (NanoDrop Technologies, Wilmington, NC, USA). The V3 and V4 hypervariable regions of 16S rRNA genes were amplified by using the primers 515F (5′-GTGCCAGCMGCCGCGG-3′) and 907R (5′-CCGTCAATTCMTTTRAGTTT-3′) for sequencing [15]. The PCR amplification of 16S rRNA gene was performed in a 50 μL volume containing 25 μL 2 × GoTaq® Green Master Mix (Promega), 1.5 μL of each primer (10 μM), 10 μL of the 10-fold dilution DNA template, and the final volume was adjusted to 50 μL with ddH2O. The PCR amplifications were performed in triplicate per sample and mixed together to form a composite sample. Purified PCR products were pooled equimolarly using the MiSeq Reagent Kit V3 and sequenced by Majorbio Company (Shanghai, China) on the Illumina MiSeq paired end 300 platform. All sequence data can be obtained through the accession number of PRJNA785020 in the NCBI SRA database.

2.4. Bioinformatics Analysis for Raw Sequences

The QIIME2 software was applied to process raw sequences [16]. The high-quality reads were generated after merging two pair ends of raw sequences, filtering low-quality reads and removing chimeras. An amplicon sequence variants (ASVs) table was created by grouping all unique sequences. The Silva 132 database (https://www.arb-silva.de/, accessed on: 12 December 2019) was used to annotate taxonomic information.

2.5. Prediction of Bacterial Community Function

The PICRUSt2 (https://github.com/picrust/picrust2, accessed date: 23 January 2022) was used to predict the functional composition of the soil metagenome [17]. The Kyoto Encyclopedia of Genes and Genomes (KEGG) pathway subsystem hierarchy level three was employed based on identified KEGG orthology pathways. Differences in bacterial community biological function between Time 1 (Time 2) and Time 0 were analyzed using t-test with Bonferroni multiple test correction and visualized using heatmap in STAMP software (v2.1.3) [18].

2.6. Statistical Analysis

All data analysis was conducted using R software [19]. The alpha diversity indices (Chao1, Shannon and Pielou’s evenness) were calculated using the R package ‘Vegan’ (v 2.5.7) in R [20]. The effects of rice cultivation on soil chemical properties, bacterial alpha diversity indices and the relative abundance of the dominant phyla and class were tested by one-way analysis of variance, using the R package ‘car’. Post hoc comparisons of means were tested using Tukey’s HSD method. To evaluate variations in the bacterial community composition, non-metric multidimensional scaling (NMDS) based on the Bray–Curtis dissimilarity of the filtered ASVs (ASVs that do not appear more than 5 times in more than half of the samples were removed) [21] was performed using the R package ‘phyloseq’ [22]. Differences among bacterial communities based on the filtered ASVs from non-cultivated and cultivated soils at 0–20 and 20–40 cm depths were tested using permutational multivariate analysis of variance (PERMANOVA; adonis function in the R package ‘vegan’). Relationships with soil chemical properties of diversity indexes and relative abundance of dominant phyla were tested using Pearson correlation analysis.

3. Results

3.1. Soil Chemical Properties

Soil pH, EC, TC, WSOC, NH4+, NO3 and AP were significantly different at both 0–20 and 20–40 cm depths among the non-cultivated and cultivated plots (Table 1). Soil pH was higher in Time 0 and Time 1 than that of Time 2 at 0–20 cm depth, and the soil pH of Time 0 was lowest at 20–40 cm depth compared to Time 1 and Time 2. Soil EC was significantly lower and TC and WSOC were significantly higher in Time 1 and Time 2 than in Time 0 at both 0–20 and 20–40 cm depths (Table 1). Soil NH4+ and NO3 concentrations were higher in Time 0 than in Time 1 and Time 2 at both 0–20 and 20–40 cm depths. Soil TN was not significantly different among the non-cultivated and cultivated plots at both 0–20 and 20–40 cm depths.

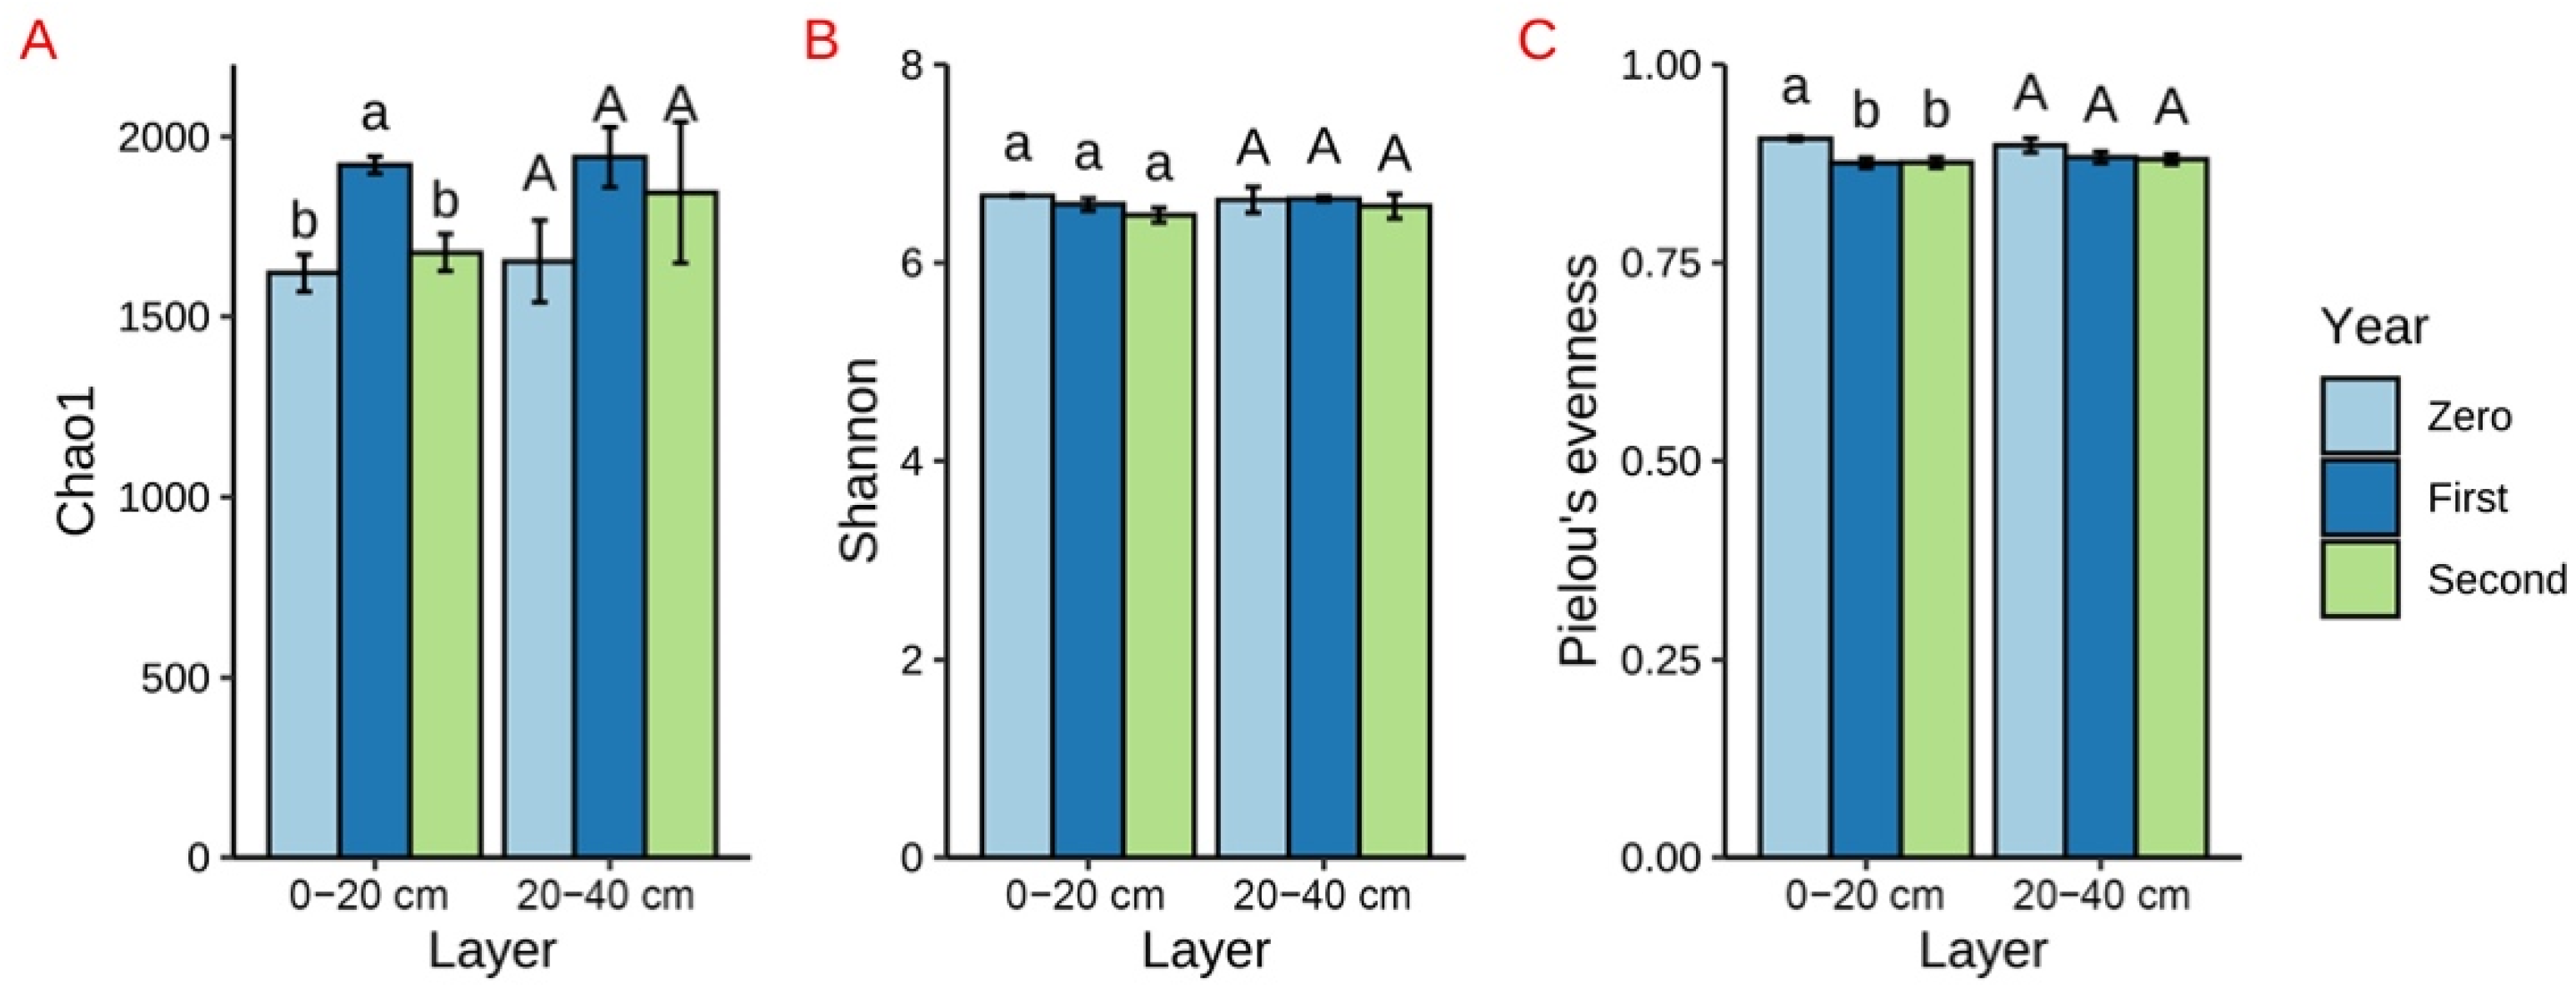
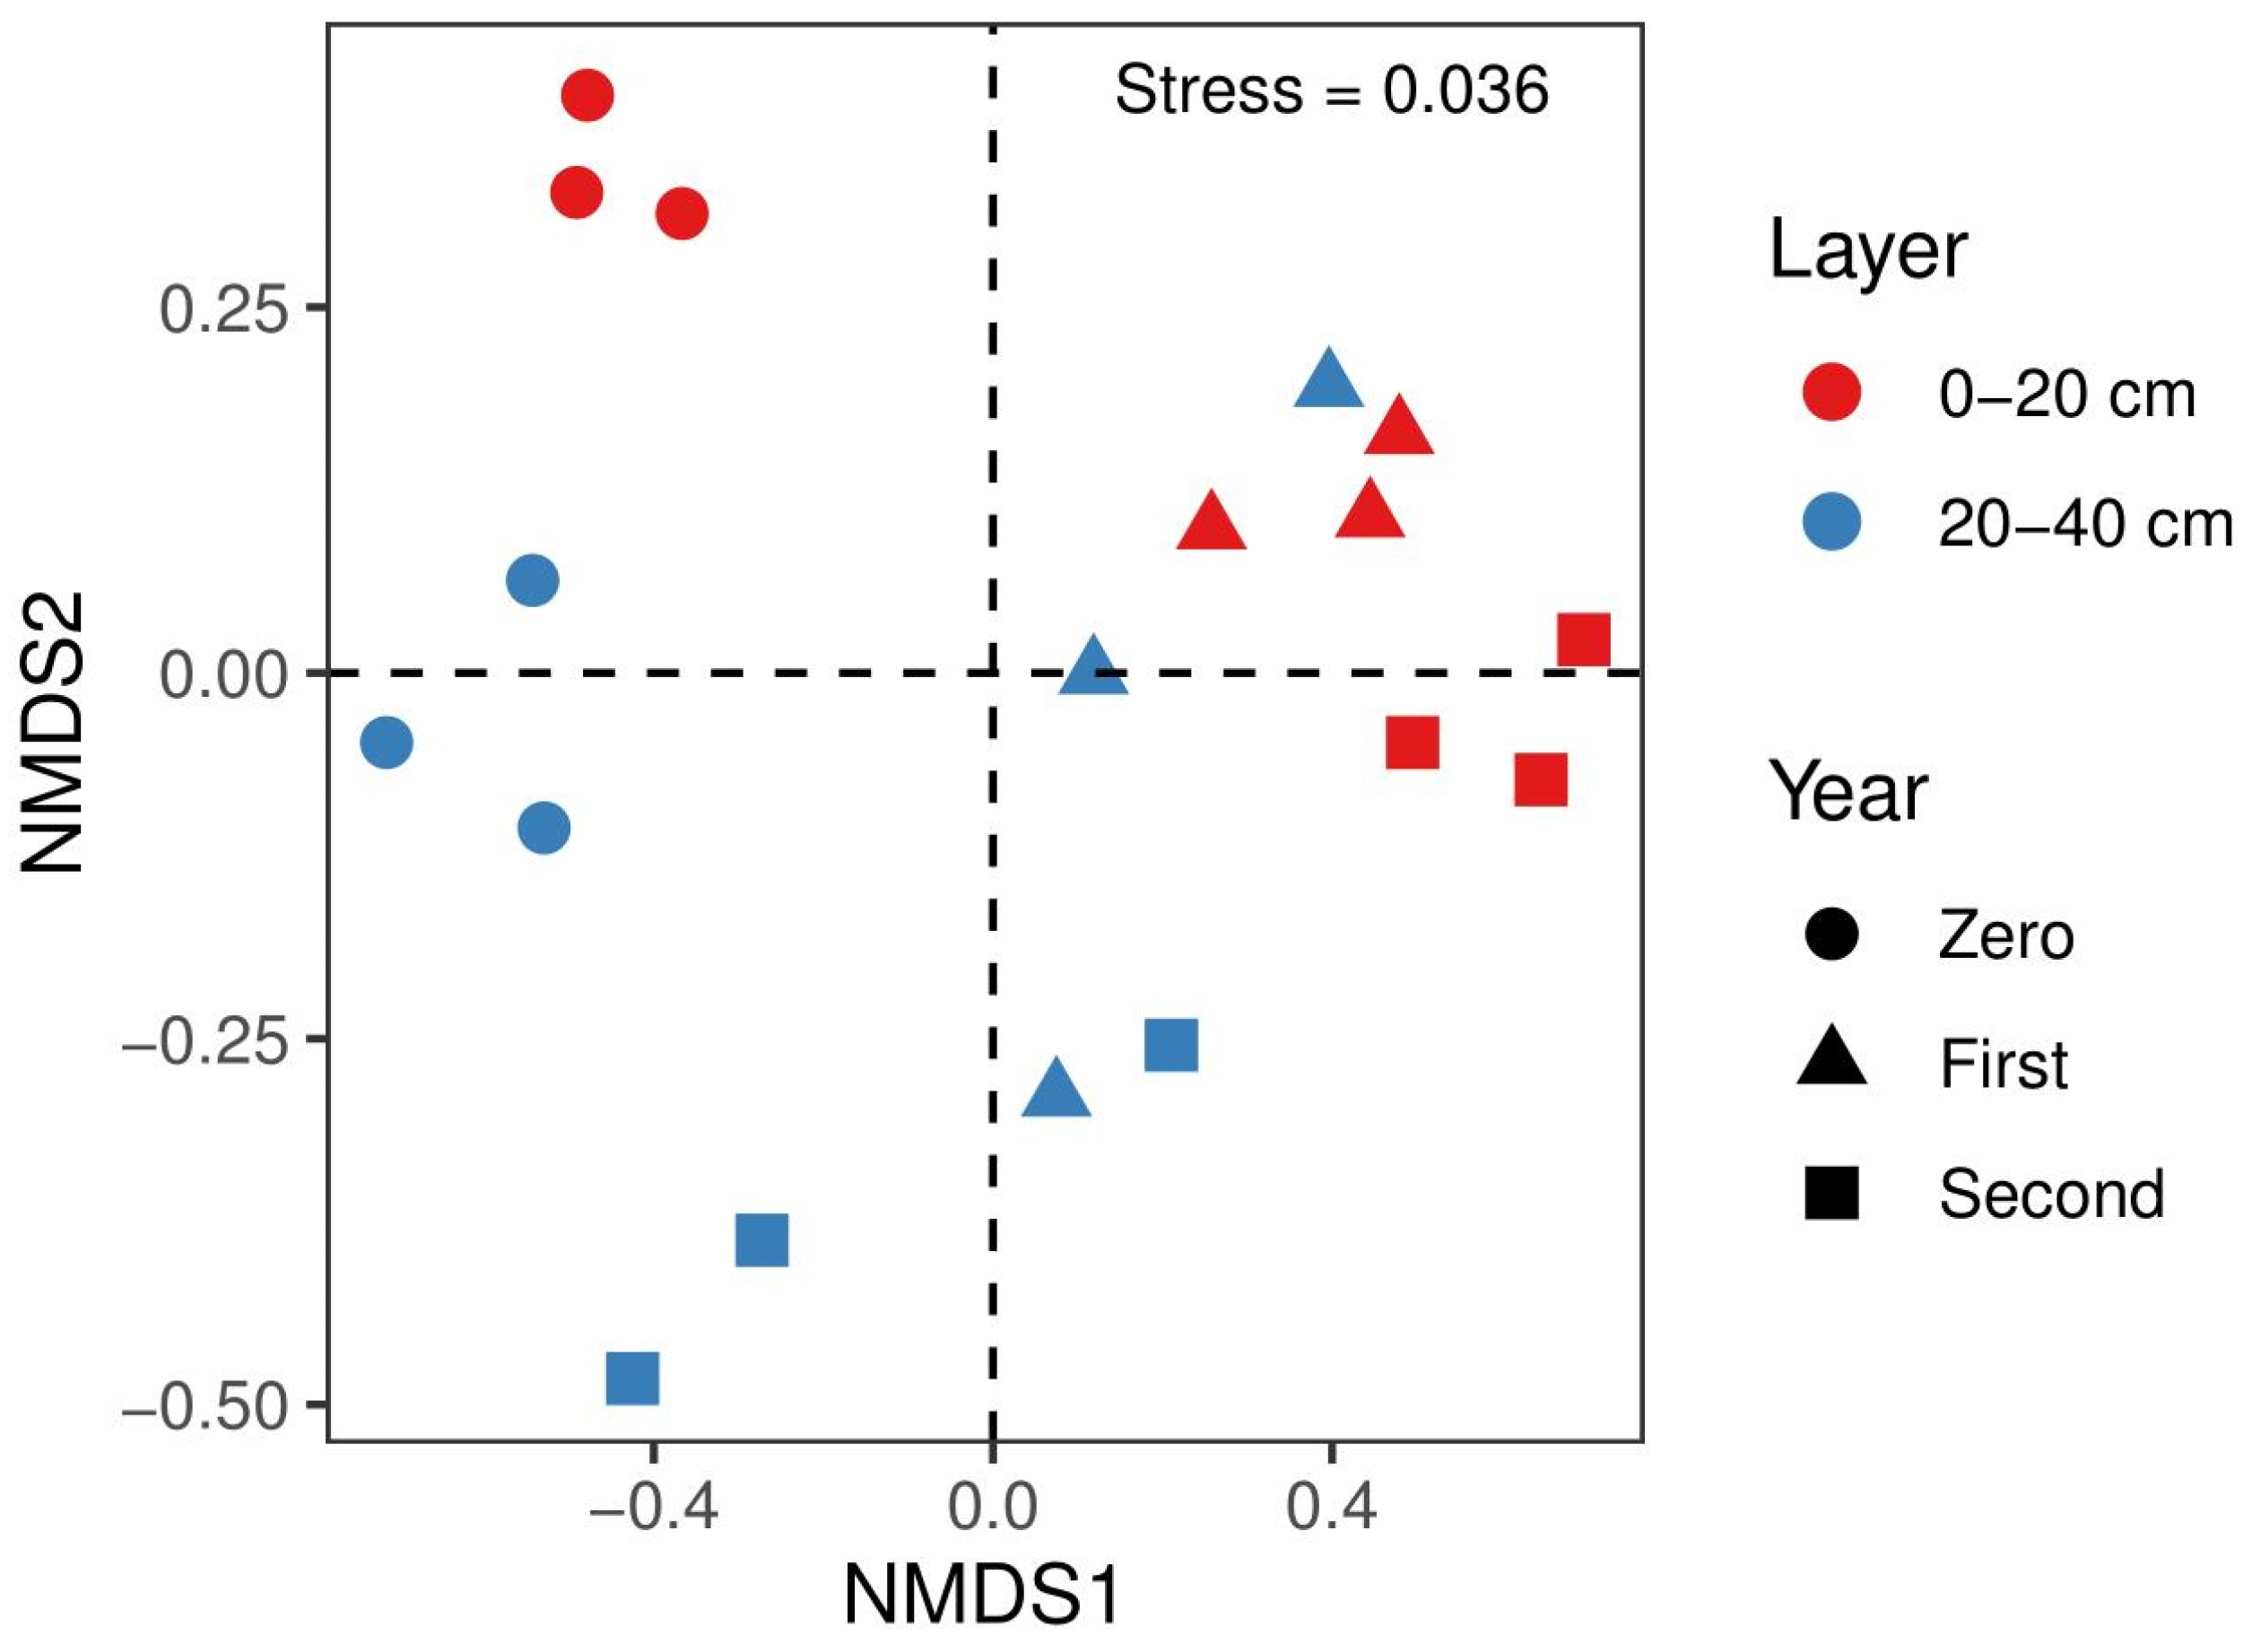
3.2. Diversity and Structure of Bacterial Communities

At 0–20 cm depth, the Chao1 diversity and Pielou’s evenness index of bacterial communities were highest at Time 1 and Time 0, respectively, and there was no difference in the Shannon diversity of bacterial communities between non-cultivated and cultivated soils reclaimed from aquaculture ponds of tidal flats. However, bacterial alpha diversities (Chao1, Shannon and Pielou’s evenness) were not significantly different in the non-cultivated and cultivated soils at 20–40 cm depth (Figure 2).
After filtering out low-occurrence and poorly represented ASVs (which did not appear more than 5 times in more than half of the samples), a final stress value of 0.036 was generated from the NMDS ordination (Figure 3, stress value < 0.05 indicates good fit). The samples of cultivated and non-cultivated soils were clearly separated along NMDS axis 1 (Figure 3). Soil bacterial community structures differed significantly between Time 0 and Time 1 (R2 = 0.50, p = 0.009, PERMANOVA) and between Time 0 and Time 2 (R2 = 0.40, p = 0.012, PERMANOVA) but did not differ significantly between Time 1 and Time 2 (R2 = 0.16, p = 0.339, PERMANOVA). Soil bacterial community structures also differed significantly between 0–20 and 20–40 cm depths (R2 = 0.19, p = 0.012, PERMANOVA).

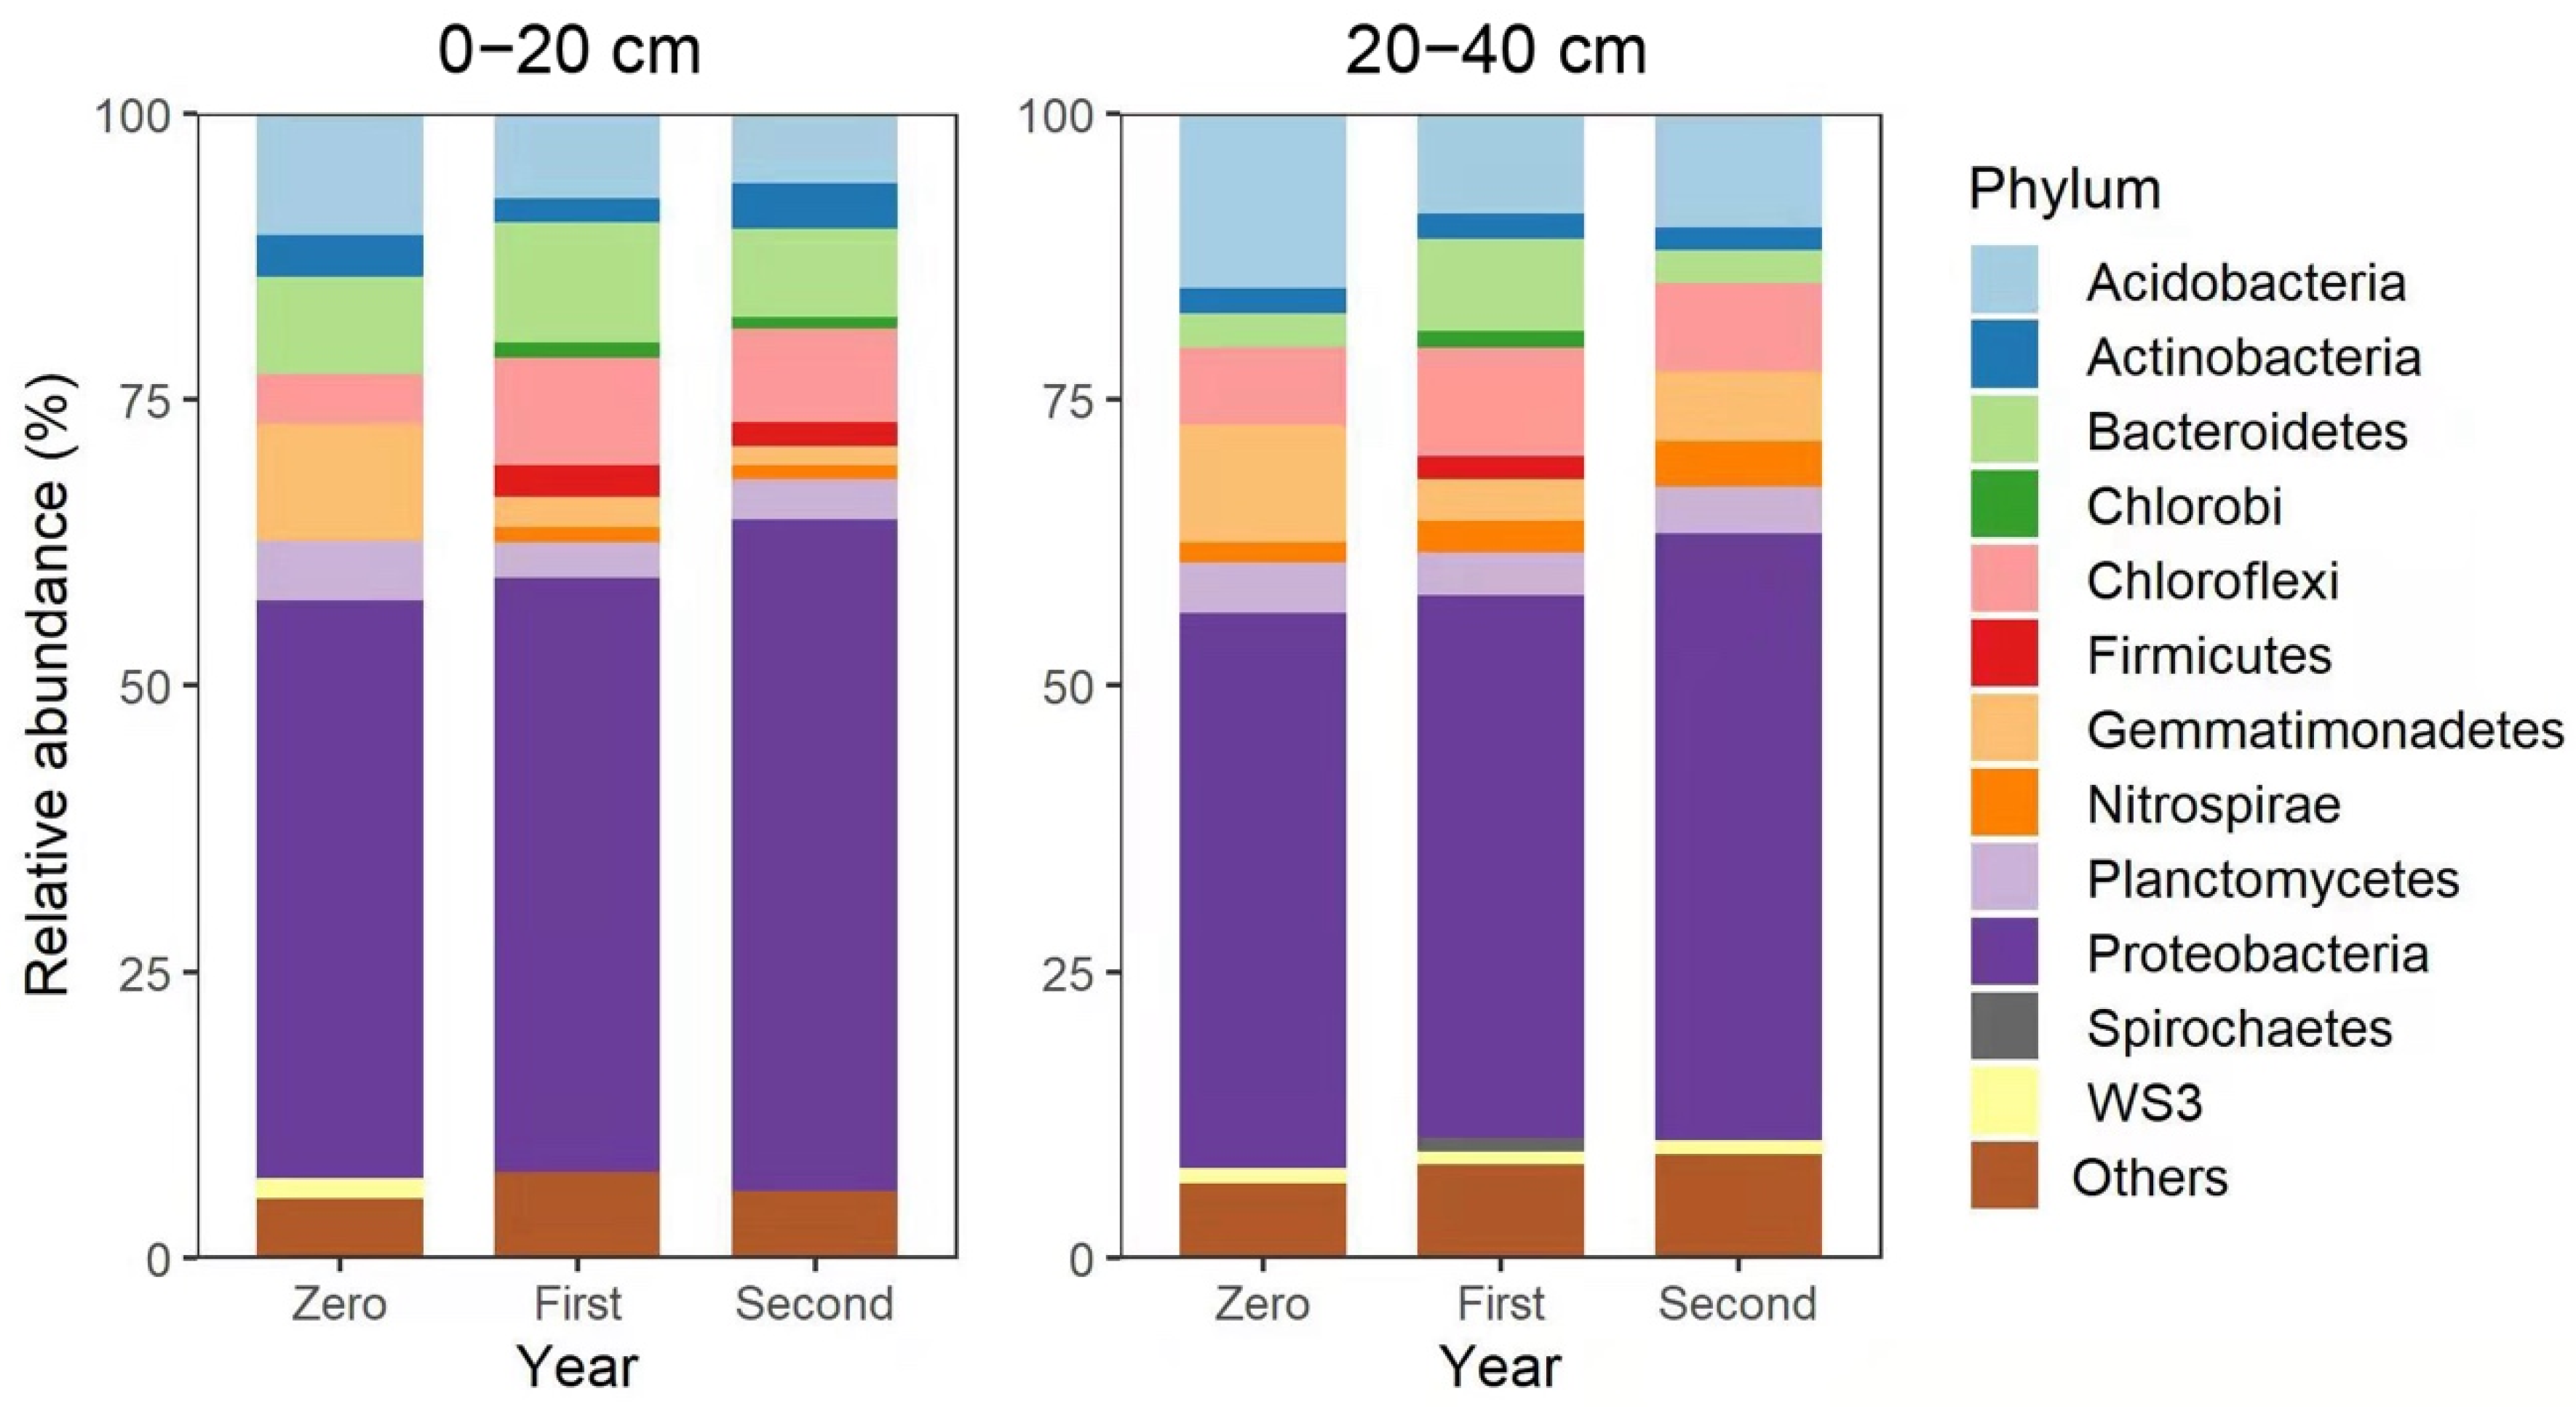
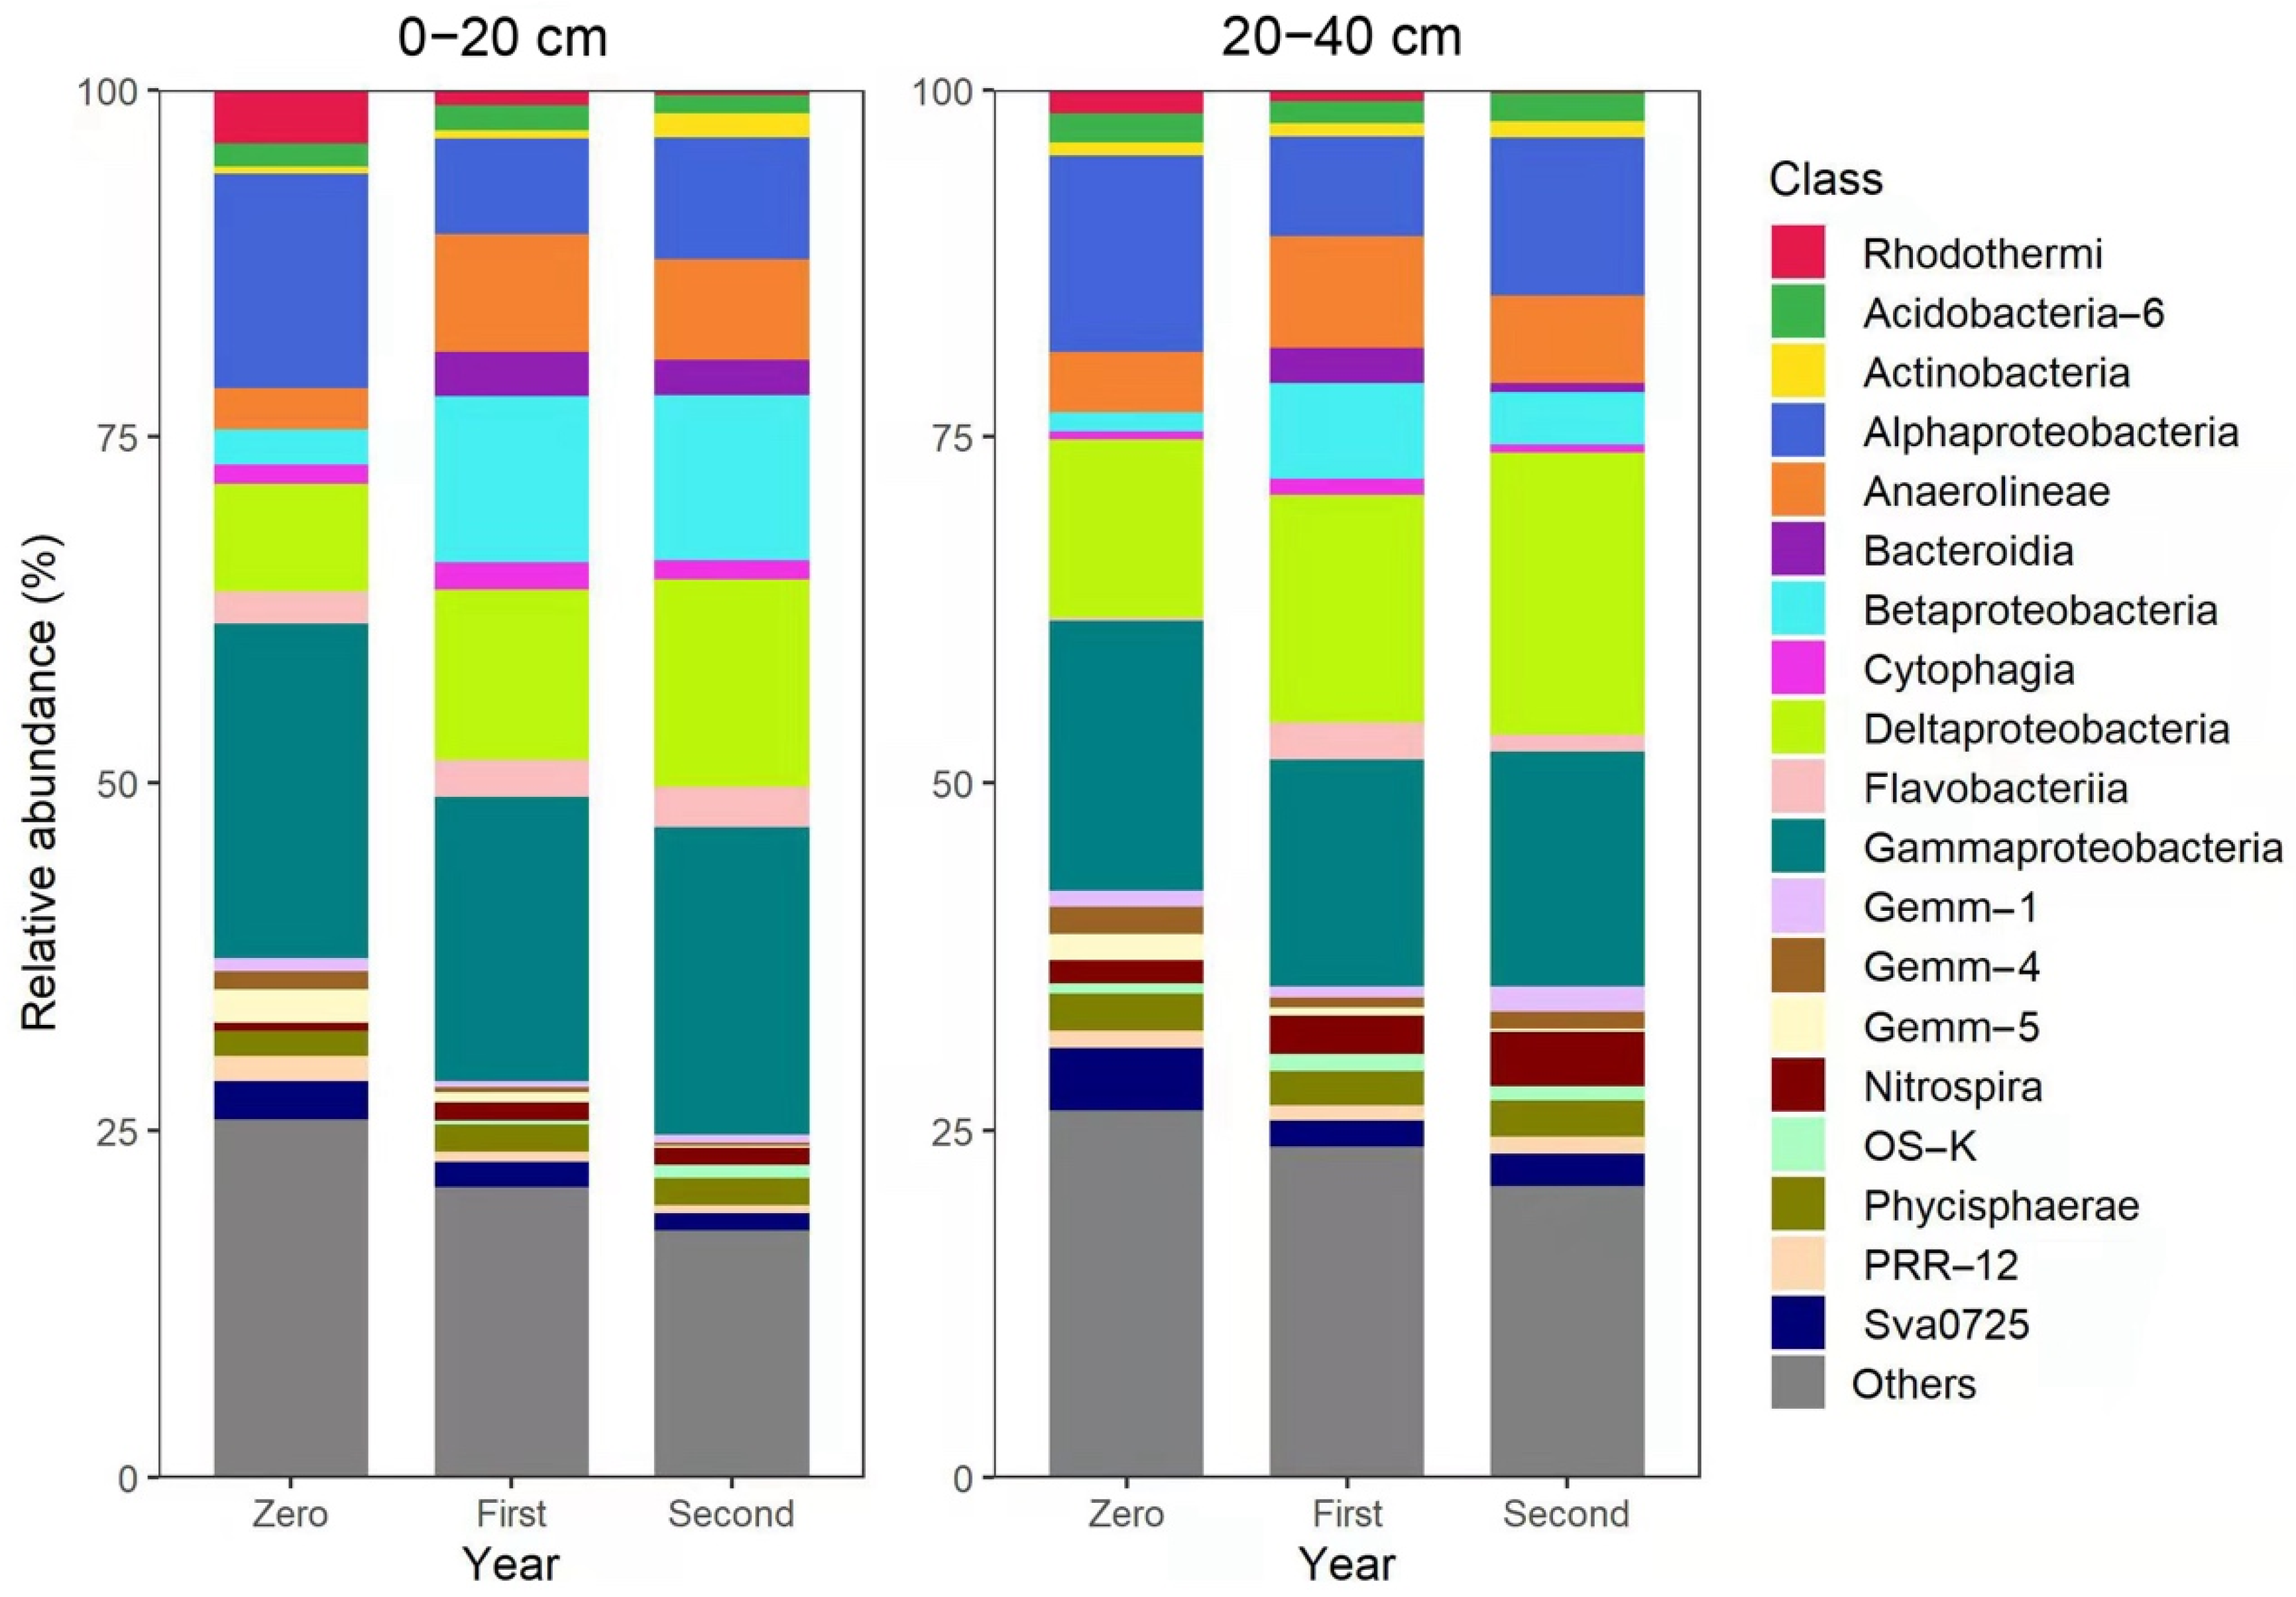
3.3. Composition of Bacterial Communities

At the phylum rank, the bacterial communities’ composition was similar at both depths in the non-cultivated and cultivated soils, with Proteobacteria, Acidobacteria, Gemmatimonadetes and Bacteroidetes being the predominant phyla (Figure 4). On the other hand, their relative abundance was affected by the duration of cultivation at each depth (Table S1). At the 0–20 cm depth, the relative abundance of Proteobacteria, Chloroflexi, Firmicutes in reclaimed soils was higher than in Time 0, whereas the relative abundance of Acidobacteria, Planctomycetes and WS3 in reclaimed soils was lower than in Time 0; the relative abundance of Nitrospirae was not significantly different in different plots. At the 20–40 cm depth, the relative abundance of Acidobacteria in Time 0 was higher than in reclaimed soils. The relative abundance of Gemmatimonadetes was the lowest, whereas the relative abundance of Bacteroidetes was the highest in Time 1 as compared to Time 0 and Time 2. However, the relative abundance of Proteobacteria, Chloroflexi, Planctomycetes, Nitrospirae, Actinobacteria, Firmicutes and WS3 was not significantly different in the non-cultivated and cultivated soils (Table S1).
Gammaproteobacteria, Deltaproteobacteria, Alphaproteobacteria, Betaproteobacteria and Anaerolineae were the predominant classes in all studied soils (Figure 5). The relative abundance of 13 and 7 classes of the top 20 dominant classes was significantly different among soils with different cultivation durations at the 0–20 and 20–40 cm depth, respectively (Table S2).

3.4. Correlation between Bacterial Communities and Chemical Properties

Relationship of diversity indexes and dominant bacterial phyla with chemical properties is shown in Table 2. The Chao1 value was positively correlated with pH and negatively correlated with EC and NH4+. The Shannon and Pielou’s evenness values were positively correlated with EC, NH4+ and NO3 and negatively correlated with WSOC and TC. The relative abundance of the dominant bacterial phyla was positively or negatively correlated with one or several of the soil chemical properties as well (Table 2).

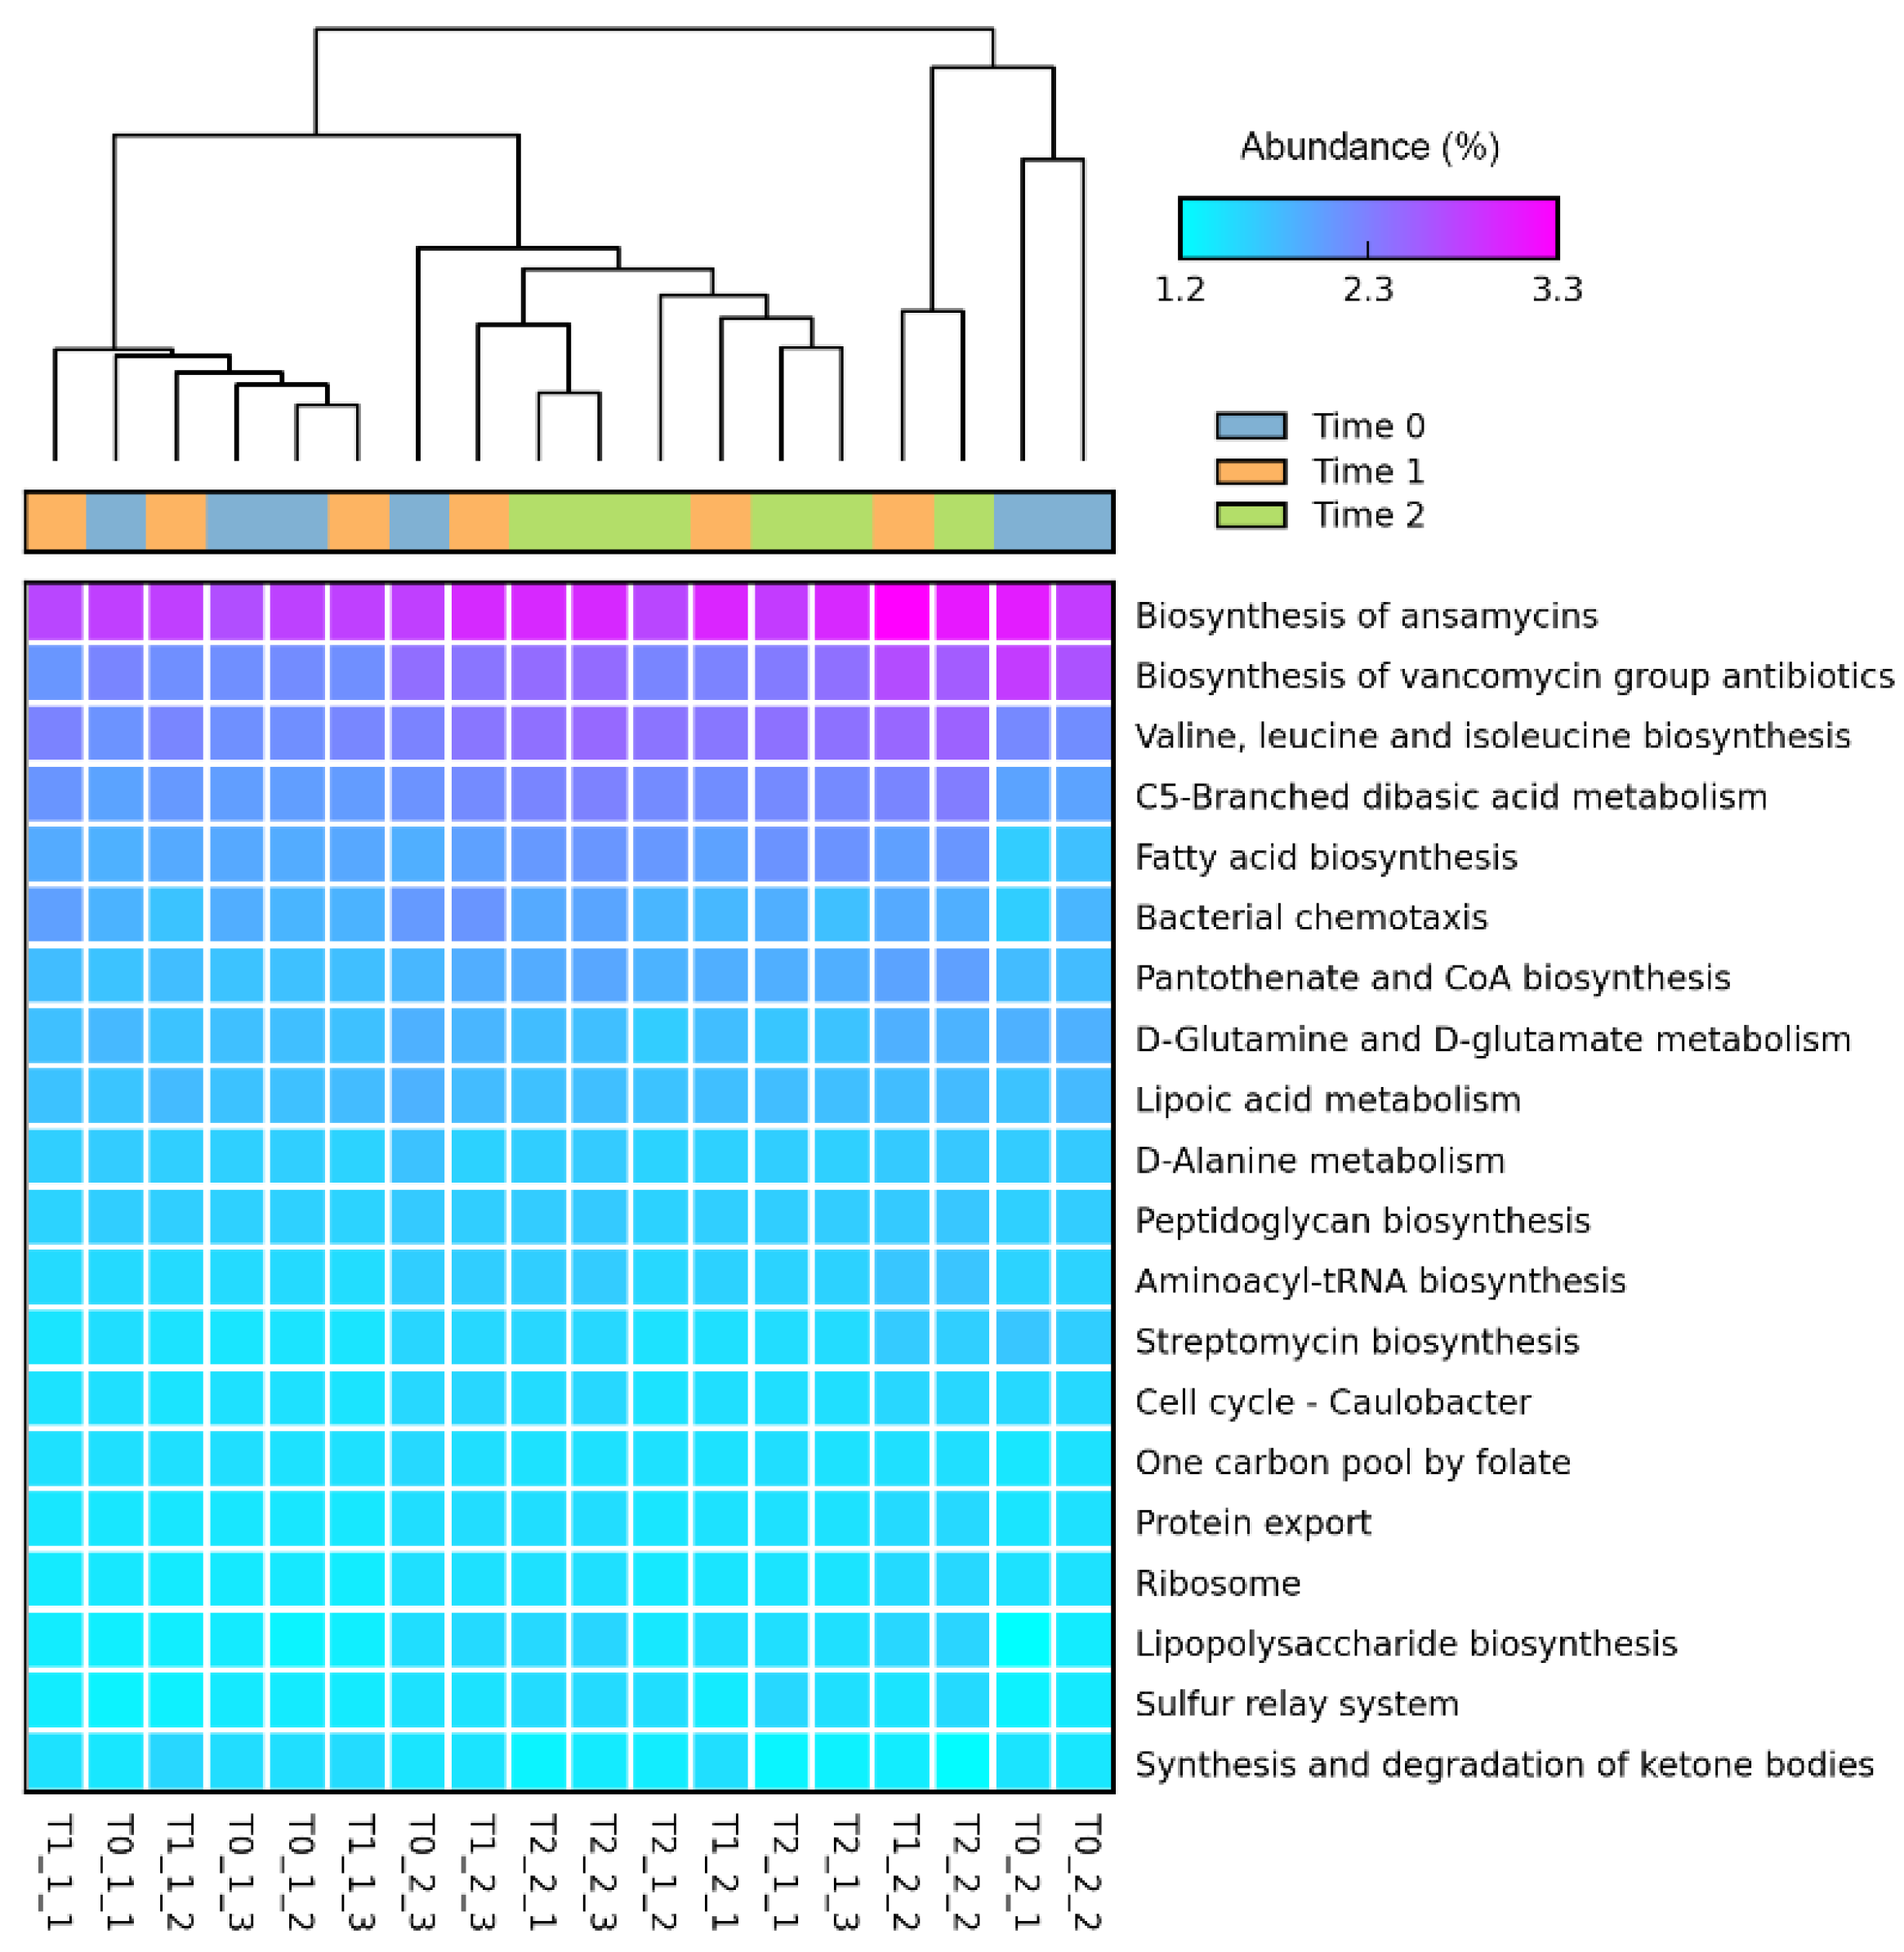
3.5. Bacterial Functional Genes

We predicted the functional gene composition according to the sequencing data using PICRUSt2. The functional groups (top 20 abundant KEGG pathways) heatmap showed that the functional composition between Time 0 and Time 1 samples was more similar than that between Time 0 and Time 2 (Figure 6). Compared with Time 0, Time 1 had a decreased abundance of steroid biosynthesis groups and an increased abundance of DNA replication groups (Figure S1); Time 2 had a decreased abundance of nitrogen metabolism, dioxin degradation, base excision repair, methane metabolism, glycolysis/gluconeogenesis, two-component system, DNA replication, peroxisome and ribosome biogenesis in eukaryotes groups and an increased abundance of valine/leucine/isoleucine biosynthesis, meiosis yeast, thiamine metabolism, nicotinate and nicotinamide metabolism, taurine and hypotaurine metabolism, C5-branched dibasic acid metabolism, pantothenate and CoA biosynthesis and fatty acid biosynthesis groups (Figure S2).

4. Discussion

The reclamation of tidal mudflats and salt marshes and their conversion to agricultural lands have significant effects on the ecosystem of the coastal areas, especially on soil physicochemical properties [23]. As the most salt-sensitive species among cereals [24,25], rice has been successfully grown in salt-affected soils because the irrigation and rainwater in paddy fields can wash down salts and effectively alleviate the detrimental effects of salinity on rice growth [26,27]. Our results showed that rice cultivation at the reclaimed aquacultural ponds significantly influenced soil chemical properties and the bacterial community composition that support our hypotheses.

4.1. Effect of Rice Cultivation in Reclaimed Lands on Soil Chemical Properties

Rice cultivation significantly decreased the soil EC at both 0–20 cm and 20–40 cm soil depths due to the flooding growth conditions of rice, indicating that rice planting at the reclaimed aquaculture ponds resulted in a significant decrease in soil salinity through washing the soluble salts to a deeper soil layer, which is consistent with some of the previous findings [28,29,30]. The decreased pH in Time 2 plots at topsoil (0–20 cm) mainly attributed to the secretion of protons of rice roots, accompanying the release of organic acid anions, thus resulting in the acidification of the rhizosphere soil [29]. However, the pH of the subsoil (20–40 cm) was obviously higher than that of the topsoil in the cultivated lands (Table 1). A recent study also showed that the pH of topsoil was lower than those in the subsoil at different cultivation ages after 16–60 years of reclamation [30]. The reason is mainly due to the higher leaching of carbonates and salts in the rice-based cropping systems [31,32,33].
Rice cultivation after reclamation has significantly increased the contents of TC and WSOC (Table 1), irrespective of soil depth, indicating that rice cultivation at the reclaimed aquaculture ponds increases organic matter accumulation in the soil. The conversion of reclaimed aquaculture ponds into agricultural lands significantly increases the stocks of soil total, labile, recalcitrant organic C and N and concentrations of WSOC [34]. Furthermore, soil TC increased significantly with the duration of reclamation, especially in 20–40 cm soil depth, which is consistent with the finding of Zhang et al. [35] that TC in paddy land was higher than that in the upland with the same cultivation duration. Soil C is susceptible to land-use conversions, especially in coastal reclaimed croplands; some field management practices, such as the application of fertilizer and organic manure and irrigation, may contribute to the increase in TC [23,36]. In the present study, no difference was found in the content of TN among all soil samples. This result indicated that, during short-term cultivation after reclamation, the nitrogen addition in the reclaimed croplands probably reached a balance with the uptake and utilization of nitrogen by rice plants, and no surplus of nitrogen remained in the soil. Nitrogen, as an essential macro-element, is usually taken up by roots in two main forms, NH4+-N and NO3-N [37]. Soil NH4+-N and NO3-N decreased with the duration of cultivation in both 0–20 cm and 20–40 cm soil depths, and the concentration of NH4+-N was always higher than that of NO3-N. The process of nitrification can be significantly inhibited by soil salinity [38,39], which probably led to a higher concentration of NH4+-N in the reclaimed land. Furthermore, it is widely believed that rice plants prefer NH4+-N over NO3-N as the predominant N source in flooded, anaerobic paddy soils [40,41]. Generally, the Olsen P with less than 10 mg·kg−1 is considered to be difficult to maintain the normal growth of crops [42]. In our results, except for the topsoil in the non-cultivated soils, the Olsen P was less than 10 mg kg−1, which should be inadequate for rice growth in the reclaimed soils. As a result, these soils need to depend on a higher input for P fertilizers to sustain rice production.

4.2. Effect of Rice Cultivation and Its Duration in Reclaimed Lands on Soil Bacterial Community and Bacterial Functional Groups

The composition and diversity of bacteria in an ecosystem reflect how they respond to changing environmental conditions [43]. Therefore, analyzing soil microbial diversity will provide a basis for the long-term sustainability of the reclaimed croplands that were converted from the reclaimed aquaculture ponds. In this study, the diversity of soil bacterial communities was affected by rice planting after reclamation (Figure 2). The bacterial diversity and evenness, as represented by Shannon index and Pielou’s evenness, were decreased by rice cultivation after reclamation in the 0–20 cm soil layer (Figure 3), although the differences in Shannon indices among non-cultivated and cultivated soils were not significant. The decreasing in bacterial diversity and evenness could be caused by rice cultivation after reclamation which can lead to the replacement of some vulnerable microbial populations by some dominant soil microbial populations adapted to the anaerobic flooded environment of rice growth, thus resulting in the reduced bacterial diversity [29]. According to the results of NMDS, rice cultivation after reclamation significantly influenced the soil bacterial community composition, and the bacterial composition (at the class rank) was clearly different between the paddy soils and non-cultivated soils. However, there was no significant difference between the composition of bacterial communities in the soil of one year and two years of rice planting after the reclamation, indicating that a short-term rice cultivation did not change soil bacterial community composition.
Regarding bacterial composition, Proteobacteria, Acidobacteria, Bacteroidetes, Chloroflexi and Planctomycetes were the dominant bacterial phyla in the reclaimed soils, in accordance with other reports in mudflats and paddy soils [29,44,45]. The phylum Proteobacteria, which includes many bacteria that are responsible for nitrogen fixation and are involved in the soil nitrogen cycle, often accounts for the largest proportion in soil [29]. Moreover, Proteobacteria are the most common bacterial phylum in saline soils and possess high salt tolerance [46]. The present study showed an overwhelming dominance of Proteobacteria in paddy fields, and the relative abundance of Proteobacteria gradually increased with rice cultivation duration, probably due to some Proteobacteria preferring to decompose lignocellulose and the cellulose of crop residues [47,48]. Furthermore, the relative abundance of Chloroflexi and Nitrospirae also showed a rapid increase in rice-cultivated soils after reclamation. A possible reason would be that Proteobacteria, Chloroflexi and Nitrospirae are more feasibly adapted to agricultural ecosystems that make them more competitive relative to other bacteria phyla. In addition, there was no significant difference in the diversity indexes and relative abundance of most bacterial phyla in the 20–40 cm soil layer between the cultivated and non-cultivated soils. These results indicated that rice planting mainly affected the bacterial community composition in the topsoil after the relatively short-term cultivation time.
Previous studies have reported that there was not a robust correlation between com-munity composition and ecological function due to functional redundancy [49,50]. We observed more significant differences between Time 2 and Time 0 soil samples than between Time 1 and Time 0 soil samples in bacterial functional groups, which indicated that the ecology function of soil bacterial communities might have delayed changes after the bacterial community’s composition changes.

4.3. Effects of Soil Chemical Properties on Soil Bacterial Community

The relationships between the relative abundance of the dominant bacterial phyla and soil chemical properties suggest that changes in soil chemical properties strongly affect the bacterial composition and structure of the reclaimed coastal soils (Table 2). As salinity is one of the stressful environmental factors for soil microorganisms, it has been reported that EC is one of the major factors that affect soil bacterial communities in many ecosystems [51]. Rice cultivation led to a noticeable decline in soil EC, especially in the topsoil, which might benefit some bacteria growth, such as Gemmatimonadetes, Planctomycetes and WS3 in our study. Lauber et al. [52] found soil pH has largely driven the changes in the relative abundances of Acidobacteria, Actinobacteria and Bacteroidetes across large spatial scales. In this study, we found the relative abundances of Actinobacteria, Proteobacteria and Nitrospirae were correlated to pH in the coastal area. Furthermore, some copiotrophic groups, such as proteobacteria and Bacteroidetes, can fast grow in a high nutrient availability soil environment, and are thus positively correlated with WSOC and TC; this finding agrees with Huang et al. [53]. The relative abundance of Acidobacteria and Gemmatimonadetes was significantly lower in paddy soils than that of non-cultivated soils. Acidobacteria is recognized as representatives of oligotrophic taxa, which inhabit nutrient-poor environments [54,55]. In this study, the abundance of Acidobacteria was significantly and negatively correlated with the WSOC and TC in the reclaimed soils which agrees with this statement. Gemmatimonadetes has been confirmed to prefer drier soils and neutral pH, and its relative abundance is inversely associated with soil moisture [56]. Therefore, lower relative abundance of Gemmatimonadetes was found in the cultivated soils, probably due to the regular irrigation increased soil water content. Wang, Wang and Yu et al. [57] revealed that the relative abundance of Proteobacteria increased and the relative abundance of Acidobacteria decreased with the increase in NH4+-N and NO3-N concentrations following nitrogen addition in acid soils. However, we observed an opposite effect, probably due to the soil we studied being alkaline (pH > 8) which affects the effect of NH4+-N and NO3-N concentrations on the relative abundance of Proteobacteria and Acidobacteria.

5. Conclusions

Our study demonstrated that rice cultivation significantly changes soil chemical properties, bacterial diversity and composition after being reclaimed from aquaculture ponds. Compared with non-cultivated soils after reclamation, rice cultivation improved the properties of saline soil, resulting in the decreased soil pH and salinity in the topsoil and the increased accumulation of TC and WSOC. Proteobacteria, Acidobacteria, Bacteroidetes, Chloroflexi and Planctomycetes were the dominated bacterial phyla in the reclaimed lands, irrespective of reclamation ages and soil depth. The diversity and composition changes of soil bacterial communities were mainly associated with the variations in EC, WSOC, TC, NH4+ and NO3 in the reclaimed lands. These results help to understand the roles of rice cultivation in shifting soil chemical properties and their subsequent impacts on soil bacterial community in the reclaimed lands from aquaculture ponds which, in turn, will help improve the utilization of coastal saline soils for rice production.

Supplementary Materials

The following are available online at https://www.mdpi.com/article/10.3390/su14031613/s1, Table S1: The relative abundance of the dominant phyla in soils across different soil layers and reclaimed times, Table S2: The relative abundance of the dominant class (top 20) in soils across different soil layers and reclaimed times.

Author Contributions

Conceptualization, A.H., M.L. and B.L.; data curation, J.L. and M.L.; funding acquisition, A.H., N.Z., M.Z. and S.J.; methodology, M.Z. and S.G.; supervision, J.L. and B.L.; validation, S.J., L.X. and N.Z.; visualization, J.L. and M.Z.; writing—original draft, A.H. and J.L.; writing—review and editing, A.H., J.L., N.Z. and B.L. All authors have read and agreed to the published version of the manuscript.

Funding

This research was funded by the Natural Science Foundation of Jiangsu Province of China (BK20190921), the Natural Science Foundation of Nantong City of China (MS22020032), the College Students Innovation and Entrepreneurship Training Projects of Jiangsu Province (202110304110Y) and the Research Project of Henan Provincial Department of Science and Technology (212102110062).

Institutional Review Board Statement

Not applicable.

Informed Consent Statement

Not applicable.

Data Availability Statement

The raw data in this study were deposited in the NCBI Sequence Read Archive database with the accession number PRJNA785020.

Conflicts of Interest

The authors declare no conflict of interest.

References

  1. Lei, N. Practice of reconstruction soils engineering in Shaanxi province. In IOP Conference Series: Earth and Environmental Science; IOP Publishing Ltd.: Bristol, UK, 2021; Volume 692, p. 042069. [Google Scholar] [CrossRef]
  2. Long, X.; Liu, L.; Shao, T.; Shao, H.; Liu, Z. Developing and sustainably utilize the coastal mudflat areas in China. Sci. Total Environ. 2016, 569–570, 1077–1086. [Google Scholar] [CrossRef]
  3. Wang, Z.; Zhuang, J.; Zhao, A.; Li, X. Types, harms and improvement of saline soil in Songnen Plain. In IOP Conference Series: Materials Science and Engineering; IOP Publishing Ltd.: Bristol, UK, 2018; Volume 322, p. 052059. [Google Scholar] [CrossRef]
  4. Vargas, R.; Pankovoy, E.I.; Balyuk, S.A.; Krasilnikov, P.V.; Hasanhanova, G.M. Handbook for Saline Soil Management: Eurasian Soil Partnership Implementation Plan; FAO: Rome, Italy, 2018. [Google Scholar]
  5. An, S.; Li, H.; Guan, B.; Zhou, C.; Wang, Z.; Deng, Z.; Zhi, Y.; Liu, Y.; Xu, C.; Fang, S.; et al. China’s natural wetlands: Past problems, current status, and future challenges. AMBIO J. Hum. Environ. 2007, 36, 335–342. [Google Scholar] [CrossRef] [Green Version]
  6. Ren, C.; Wang, Z.; Zhang, Y.; Zhang, B.; Chen, L.; Xi, Y.; Xiao, X.; Doughty, R.B.; Liu, M.; Jia, M.; et al. Rapid expansion of coastal aquaculture ponds in China from landsat observations during 1984–2016. Int. J. Appl. Earth Obs. Geoinf. 2019, 82, 101902. [Google Scholar] [CrossRef]
  7. Yang, H.Y.; Chen, B.; Barter, M.; Piersma, T.; Zhou, C.F.; Li, F.S.; Zhang, Z.W. Impacts of tidal land reclamation in Bohai Bay, China: Ongoing losses of critical Yellow Sea waterbird staging and wintering sites. Bird Conserv. Int. 2011, 21, 241–259. [Google Scholar] [CrossRef] [Green Version]
  8. Duan, H.; Zhang, H.; Huang, Q.; Zhang, Y.; Hu, M.; Niu, Y.; Zhu, J. Characterization and environmental impact analysis of sea land reclamation activities in China. Ocean Coast. Manag. 2016, 130, 128–137. [Google Scholar] [CrossRef]
  9. Zhang, X.; Liao, X.; Huang, L.; Shan, Q.; Hu, A.; Yan, D.; Zhang, J.; Long, X.E. Soil profile rather than reclamation time drives the mudflat soil microbial community in the wheat-maize rotation system of Nantong, China. J. Soils Sediments 2021, 21, 1672–1687. [Google Scholar] [CrossRef]
  10. Wan, S.; Liao, X.; Zhou, T.T.; Wu, Y.; Hu, A.; Yan, D.; Zhang, J.; Long, X.E. Shift in archaeal community along a soil profile in coastal wheat-maize rotation fields of different reclamation ages. Land Degrad. Dev. 2021, 32, 4162–4173. [Google Scholar] [CrossRef]
  11. IUSS Working Group WRB. World Reference Base for Soil Resources 2014, Update 2015: International Soil Classification System for Naming Soils and Creating Legends for Soil Maps; FAO: Rome, Italy, 2015. [Google Scholar]
  12. Li, Y.; Zhang, J.; Chang, X.S.; Jiang, P.; Zhou, G.; Fu, S.; Yan, E.; Wu, J.; Lin, L. Long-term intensive management effects on soil organic carbon pools and chemical composition in Moso bamboo (Phyllostachys pubescens) forests in subtropical China. Forest Ecol. Mang. 2013, 303, 121–130. [Google Scholar] [CrossRef]
  13. Olsen, S.R.; Cole, C.V.; Watanabe, F.S.; Dean, L. Estimation of Available Phosphorus in Soils by Extraction with Sodium Bicarbonate; Circular (No. 939); USDA Press: Washington, DC, USA, 1954.
  14. Kachurina, O.M.; Zhang, H.; Raun, W.R.; Krenzer, E.G. Simultaneous determination of soil aluminum, ammonium- and nitrate-nitrogen using 1 M potassium chloride extraction. Commun. Soil Sci. Plan. 2000, 31, 893–903. [Google Scholar] [CrossRef]
  15. Ren, G.; Ren, W.; Teng, Y.; Li, Z. Evident bacterial community changes but only slight degradation when polluted with pyrene in a red soil. Front. Microbiol. 2015, 6, 22. [Google Scholar] [CrossRef] [PubMed]
  16. Bolyen, E.; Rideout, J.R.; Dillon, M.R.; Bokulich, N.A.; Abnet, C.C.; Al-Ghalith, G.A.; Alexander, H.; Alm, E.J.; Arumugam, M.; Asnicar, F.; et al. Reproducible, interactive, scalable and extensible microbiome data science using QIIME 2. Nat. Biotechnol. 2019, 37, 852–857. [Google Scholar] [CrossRef] [PubMed]
  17. Douglas, G.M.; Maffei, V.J.; Zaneveld, J.R.; Yurgel, S.N.; Brown, J.R.; Taylor, C.M.; Huttenhower, C.; Langille, M.G.I. PICRUSt2 for prediction of metagenome functions. Nat. Biotechnol. 2020, 38, 685–688. [Google Scholar] [CrossRef] [PubMed]
  18. Parks, D.H.; Tyson, G.W.; Hugenholtz, P.; Beiko, R.G. STAMP: Statistical analysis of taxonomic and functional profiles. Bioinformatics 2014, 30, 3123–3124. [Google Scholar] [CrossRef] [PubMed] [Green Version]
  19. R Core Team. A Language and Environment for Statistical Computing; R Foundation for Statistical Computing; R Core Team: Vienna, Austria, 2018. [Google Scholar]
  20. Oksanen, J. Vegan: Ecological diversity. R Project 2018. Available online: https://cran.r-project.org/web/packages/vegan/vignettes/diversity-vegan.pdf (accessed on 23 January 2022).
  21. Bray, J.R.; Curtis, J.T. An ordination of the upland forest communities of southern Wisconsin. Ecol. Monogr. 1957, 27, 325–349. [Google Scholar] [CrossRef]
  22. McMurdie, P.J.; Holmes, S. phyloseq: An R package for reproducible interactive analysis and graphics of microbiome census data. PLoS ONE 2013, 8, e61217. [Google Scholar] [CrossRef] [Green Version]
  23. Li, J.; Pu, L.; Zhu, M.; Zhang, J.; Li, P.; Dai, X.; Xu, Y.; Liu, L. Evolution of soil properties following reclamation in coastal areas: A review. Geoderma 2014, 226–227, 130–139. [Google Scholar] [CrossRef]
  24. Lutts, S.; Kinet, J.M.; Bouharmont, J. Effects of salt stress on growth, mineral nutrition and proline accumulation in relation to osmotic adjustment in rice (Oryza Sativa L.) cultivars differing in salinity resistance. Plant Growth Regul. 1996, 19, 207–218. [Google Scholar] [CrossRef]
  25. Munns, R.; Tester, M. Mechanisms of salinity tolerance. Annu. Rev. Plant Biol. 2008, 59, 651–681. [Google Scholar] [CrossRef] [Green Version]
  26. Ismail, A.M.; Heuer, S.; Thomson, M.J.; Wissuwa, M. Genetic and genomic approaches to develop rice germplasm for problem soils. Plant Mol. Biol. 2007, 65, 547–570. [Google Scholar] [CrossRef]
  27. Singh, R.K.; Redoña, E.; Refuerzo, L. Varietal improvement for abiotic stress tolerance in crop plants: Special reference to salinity in rice. In Abiotic Stress Adaptation in Plants: Physiological, Molecular and Genomic Foundation; Pareek, A., Sopory, S.K., Bohnert, H.J., Eds.; Springer: Dordrecht, The Netherlands, 2010; pp. 387–415. [Google Scholar]
  28. Xu, Y.; Pu, L.; Zhu, M.; Li, J.; Zhang, M.; Li, P.; Zhang, J. Spatial variation of soil salinity in the coastal reclamation area, Eastern China. J. Coast. Res. 2014, 30, 411–417. [Google Scholar] [CrossRef]
  29. Xu, Z.; Shao, T.; Lv, Z.; Yue, Y.; Liu, A.; Long, X.; Zhou, Z.; Gao, X.; Rengel, Z. The mechanisms of improving coastal saline soils by planting rice. Sci. Total Environ. 2020, 703, 135529. [Google Scholar] [CrossRef] [PubMed]
  30. Fu, Q.; Ding, N.; Liu, C.; Lin, Y.; Guo, B. Soil development under different cropping systems in a reclaimed coastal soil chronosequence. Geoderma 2014, 230–231, 50–57. [Google Scholar] [CrossRef]
  31. Zou, P.; Fu, J.; Cao, Z. Chronosequence of paddy soils and phosphorus sorption–desorption properties. J. Soils Sediments 2011, 11, 249–259. [Google Scholar] [CrossRef]
  32. Cui, J.; Liu, C.; Li, Z.; Wang, L.; Chen, X.; Ye, Z.; Fang, C. Long-term changes in topsoil chemical properties under centuries of cultivation after reclamation of coastal wetlands in the Yangtze Estuary, China. Soil Tillage Res. 2012, 123, 50–60. [Google Scholar] [CrossRef]
  33. Kalbitz, K.; Kaiser, K.; Fiedler, S.; Kölbl, A.; Amelung, W.; Bräuer, T.; Cao, Z.; Don, A.; Grootes, P.; Jahn, R.; et al. The carbon count of 2000 years of rice cultivation. Glob. Change Biol. 2013, 19, 1107–1113. [Google Scholar] [CrossRef] [PubMed]
  34. Yang, W.; Xia, L.; Zhu, Z.; Jiang, L.; Cheng, X.; An, S. Shift in soil organic carbon and nitrogen pools in different reclaimed lands following intensive coastal reclamation on the coasts of Eastern China. Sci. Rep. 2019, 9, 5921. [Google Scholar] [CrossRef] [PubMed]
  35. Zhang, H.; Wu, P.; Yin, A.; Yang, X.; Zhang, X.; Zhang, M.; Gao, C. Organic carbon and total nitrogen dynamics of reclaimed soils following intensive agricultural use in Eastern China. Agric. Ecosyst. Environ. 2016, 235, 193–203. [Google Scholar] [CrossRef]
  36. Wang, X.; Yan, F.; Su, F. Changes in coastline and coastal reclamation in the three most developed areas of China, 1980–2018. Ocean Coast. Manag. 2021, 204, 105542. [Google Scholar] [CrossRef]
  37. Li, S.X.; Wang, Z.H.; Stewart, B.A. Chapter Five-responses of crop plants to ammonium and nitrate N. In Advances in Agronomy; Sparks, D.L., Ed.; Academic Press: Cambridge, MA, USA, 2013; Volume 118, pp. 205–397. [Google Scholar] [CrossRef]
  38. Ye, L.; Peng, C.; Tang, B.; Wang, S.; Zhao, K.; Peng, Y. Determination effect of influent salinity and inhibition time on partial nitrification in a sequencing batch reactor treating saline sewage. Desalination 2009, 246, 556–566. [Google Scholar] [CrossRef]
  39. Zhu, H.; Yang, J.; Yao, R.; Wang, X.; Xie, W.; Zhu, W.; Liu, X.; Cao, Y.; Tao, J. Interactive effects of soil amendments (biochar and gypsum) and salinity on ammonia volatilization in coastal saline soil. Catena 2020, 190, 104527. [Google Scholar] [CrossRef]
  40. Zhao, X.; Chen, R.; Shen, R. Coadaptation of plants to multiple stresses in acidic soils. Soil Sci. 2014, 179, 503–513. [Google Scholar] [CrossRef]
  41. Hu, A.; Zheng, M.; Sun, L.; Zhao, X.; Shen, R. Ammonium alleviates manganese toxicity and accumulation in rice by down-regulating the transporter gene OsNramp5 through rhizosphere acidification. Front. Plant Sci. 2019, 10, 1194. [Google Scholar] [CrossRef] [PubMed] [Green Version]
  42. Pierzynski, G.M. Methods of Phosphorus Analysis for Soils, Sediments, Residuals, and Waters; North Carolina State University: Raleigh, NC, USA, 2000. [Google Scholar]
  43. Cheng, Z.; Chen, Y.; Zhang, F. Effect of reclamation of abandoned salinized farmland on soil bacterial communities in arid Northwest China. Sci. Total Environ. 2018, 630, 799–808. [Google Scholar] [CrossRef] [PubMed]
  44. Delgado-Baquerizo, M.; Oliverio, A.M.; Brewer, T.E.; Benavent-González, A.; Eldridge, D.J.; Bardgett, R.D.; Maestre, F.T.; Singh, B.K.; Fierer, N. A global atlas of the dominant bacteria found in soil. Science 2018, 359, 320–325. [Google Scholar] [CrossRef] [Green Version]
  45. Zhang, Y.; Li, Q.; Chen, Y.; Dai, Q.; Hu, J. Dynamic change in enzyme activity and bacterial community with long-term rice cultivation in mudflats. Curr. Microbiol. 2019, 76, 361–369. [Google Scholar] [CrossRef]
  46. Zheng, W.; Xue, D.; Li, X.; Deng, Y.; Rui, J.; Feng, K.; Wang, Z. The responses and adaptations of microbial communities to salinity in farmland soils: A molecular ecological network analysis. Appl. Soil Ecol. 2017, 120, 239–246. [Google Scholar] [CrossRef]
  47. Sato, K.; Kato, Y.; Taguchi, G.; Nogawa, M.; Yokota, A.; Shimosaka, M. Chitiniphilus shinanonensis gen. nov., sp. nov., a novel chitin-degrading bacterium belonging to betaproteobacteria. J. Gen. Appl. Microbiol. 2009, 55, 147–153. [Google Scholar] [CrossRef] [Green Version]
  48. Rocker, D.; Brinkhoff, T.; Grüner, N.; Dogs, M.; Simon, M. Composition of humic acid-degrading estuarine and marine bacterial communities. FEMS Microbiol. Ecol. 2012, 80, 45–63. [Google Scholar] [CrossRef] [Green Version]
  49. Wu, X.; Li, J.; Ji, M.; Wu, Q.; Wu, X.; Ma, Y.; Sui, W.; Zhao, L.; Zhang, X. Non-synchronous structural and functional dynamics during the coalescence of two distinct soil bacterial communities. Front. Microbiol. 2019, 10, 1125. [Google Scholar] [CrossRef]
  50. Rosenfeld, J.S. Functional redundancy in ecology and conservation. Oikos 2002, 98, 156–162. [Google Scholar] [CrossRef] [Green Version]
  51. Shi, P.; Zhang, Y.; Hu, Z.; Ma, K.; Wang, H.; Chai, T. The response of soil bacterial communities to mining subsidence in the west China aeolian sand area. Appl. Soil Ecol. 2017, 121, 1–10. [Google Scholar] [CrossRef]
  52. Lauber, C.; Hamady, M.; Knight, R.; Fierer, N. Pyrosequencing-based assessment of soil pH as a predictor of soil bacterial community structure at the continental scale. Appl. Environ. Microb. 2009, 75, 5111–5120. [Google Scholar] [CrossRef] [PubMed] [Green Version]
  53. Huang, T.; Liu, W.; Long, X.E.; Jia, Y.; Wang, X.; Chen, Y. Different responses of soil bacterial communities to nitrogen addition in moss crust. Front. Microbiol. 2021, 12, 665975. [Google Scholar] [CrossRef] [PubMed]
  54. Fierer, N.; Bradford, M.A.; Jackson, R.B. Toward an ecological classification of soil bacteria. Ecology 2007, 88, 1354–1364. [Google Scholar] [CrossRef] [PubMed]
  55. Ling, N.; Chen, D.; Guo, H.; Wei, J.; Bai, Y.; Shen, Q.; Hu, S. Differential responses of soil bacterial communities to long-term n and p inputs in a semi-arid steppe. Geoderma 2017, 292, 25–33. [Google Scholar] [CrossRef]
  56. DeBruyn, J.M.; Nixon, L.T.; Fawaz, M.N.; Johnson, A.M.; Radosevich, M. Global biogeography and quantitative seasonal dynamics of gemmatimonadetes in soil. Appl. Environ. Microbiol. 2011, 77, 6295–6300. [Google Scholar] [CrossRef] [Green Version]
  57. Wang, Q.; Wang, C.; Yu, W.; Turak, A.; Chen, D.; Huang, Y.; Ao, J.; Jiang, Y.; Huang, Z. Effects of nitrogen and phosphorus inputs on soil bacterial abundance, diversity, and community composition in Chinese fir plantations. Front. Microbiol. 2018, 9, 1543. [Google Scholar] [CrossRef]
Figure 1. Map of the study area.
Sustainability 14 01613 g001
Figure 2. Effect of the duration of cultivation on soil bacterial alpha diversity (A) Chao1, (B) Shannon, and (C) Pielou’s evenness) at 0–20 and 20–40 cm depths. Different lowercase (0–20 cm) and uppercase (20–40 cm) letters indicate significant differences among plots.
Sustainability 14 01613 g002
Figure 3. Non-metric multidimensional scaling (NMDS) ordination of soil bacterial communities after filtering out low-occurrence and poorly represented ASVs in non-cultivated and cultivated soils.
Sustainability 14 01613 g003
Figure 4. Effect of duration of cultivation on the composition of soil bacterial communities at the phylum rank.
Sustainability 14 01613 g004
Figure 5. Effect of duration of cultivation on the composition of soil bacterial communities at the class rank.
Sustainability 14 01613 g005
Figure 6. Heatmap of the top 20 abundant bacterial functional groups among soil samples. Where T0, T1 and T2 represent Time 0, Time 1 and Time 2, respectively, numbers in the middle (1, 2) represent samples from 0–20 and 20–40 cm, respectively; the last numbers (1, 2 and 3) represent replicate.
Sustainability 14 01613 g006
Table 1. Chemical properties of the soil of non-cultivated and cultivated plots at 0–20 and 20–40 depth (cm). Values are means ± SE. Different lowercase and uppercase letters indicate significant differences among different reclamation times at 0–20 and 20–40 cm depth, respectively (p < 0.05).
Soil Layers/
Reclaimed Times
0–20 cm20–40 cm
Time 0Time 1Time 2Time 0Time 1Time 2
pH8.54 ± 0.01 a8.56 ± 0.04 a8.39 ± 0.02 b8.68 ± 0.02 B8.96 ± 0.04 A8.91 ± 0.01 A
EC (ds m−1)6.42 ± 0.27 a1.30 ± 0.03 b1.13 ± 0.08 b3.57 ± 0.03 A1.57 ± 0.04 B1.47 ± 0.02 B
TC (g kg−1)2.87 ± 0.15 b3.62 ± 0.05 a3.56 ± 0.19 a2.48 ± 0.08 C2.79 ± 0.03 B3.15 ± 0.02 A
TN (g kg−1)0.60 ± 0.02 a0.63 ± 0.01 a0.57 ± 0.02 a0.60 ± 0.00 A0.60 ± 0.03 A0.59 ± 0.01 A
WSOC (mg kg−1)46.74 ± 1.23 b66.65 ± 0.51 a71.12 ± 4.19 a24.97 ± 0.07 B29.87 ± 1.88 A32.87 ± 0.46 A
NH4+ (mg kg−1)22.52 ± 1.39 a15.28 ± 0.81 b10.27 ± 0.30 c29.82 ± 0.89 A17.31 ± 2.02 B12.44 ± 0.86 C
NO3 (mg kg−1)3.06 ± 0.07 a2.58 ± 0.02 b2.15 ± 0.02 c2.83 ± 0.03 A2.58 ± 0.05 B2.38 ± 0.02 C
AP (mg kg−1)10.34 ± 0.76 a9.17 ± 0.16 a7.18 ± 0.33 b6.52 ± 0.23 B8.41 ± 0.28 A8.67 ± 0.26 A
Table 2. Pearson correlation coefficients for the relationship of bacterial diversity indexes and relative abundance of major phyla with soil chemical properties.
pHECWSOCAPTCTNNH4+NO3
Diversity indexesChao10.39 **−0.45 **−0.030.110.180.15−0.29 *−0.22
Shannon0.190.33 *−0.29 *0.19−0.33 *0.130.34 *0.43 **
Pielou’s evenness−0.050.75 **−0.35 **0.16−0.54 **0.020.62 **0.68 **
Major phylaProteobacteria−0.48 **−0.29 *0.60 **−0.040.58 **−0.16−0.55 **−0.57 **
Acidobacteria0.240.49 **−0.72 **−0.28 *−0.79 **0.120.78 **0.60 **
Gemmatimonadetes0.110.78 **−0.56 **0.01−0.70 **0.140.73 **0.75 **
Bacteroidetes−0.40 **0.000.65 **0.55 **0.52 **0.14−0.230.04
Chloroflexi0.23−0.80 **0.16−0.240.37 **−0.05−0.44 **−0.56 **
Planctomycetes0.020.77 **−0.40 **0.20−0.52 **−0.130.51 **0.62 **
Nitrospirae0.66 **−0.42 **−0.46 **−0.22−0.110.03−0.32 *−0.27 *
Actinobacteria−0.66 **0.31 *0.42 **0.060.26−0.29 *−0.120.02
Firmicutes−0.14−0.67 **0.58 **0.020.61 **−0.12−0.51 **−0.57 **
WS30.200.71 **−0.50 **0.23−0.55 **0.100.51 **0.66 **
* p < 0.05, ** p < 0.01.
Publisher’s Note: MDPI stays neutral with regard to jurisdictional claims in published maps and institutional affiliations.

