Article

Comparative Analysis of Five Widely-Used Multi-Criteria Decision-Making Methods to Evaluate Clean Energy Technologies: A Case Study

by
Saeed Khojaste Effatpanah
1,
Mohammad Hossein Ahmadi
1,*,
Pasura Aungkulanon
2,*,
Akbar Maleki
1,
Milad Sadeghzadeh
3,
Mohsen Sharifpur
4,5,* and
Lingen Chen
6
1
Faculty of Mechanical and Mechatronics Engineering, Shahrood University of Technology, Shahrood 3619995161, Iran
2
Faculty of Engineering, King Mongkut’s University of Technology North Bangkok, Bangkok 10800, Thailand
3
Renewable Energy and Environmental Engineering Department, University of Tehran, Tehran 14399571, Iran
4
Department of Mechanical and Aeronautical Engineering, University of Pretoria, Pretoria 0002, South Africa
5
Department of Medical Research, China Medical University Hospital, China Medical University, Taichung 404, Taiwan
6
Institute of Thermal Science and Power Engineering, Wuhan Institute of Technology, Wuhan 430205, China
*
Authors to whom correspondence should be addressed.
Sustainability 2022, 14(3), 1403; https://doi.org/10.3390/su14031403
Submission received: 18 December 2021 / Revised: 17 January 2022 / Accepted: 19 January 2022 / Published: 26 January 2022

Abstract

:
Over the last decade, the total primary energy consumption has increased from 479 × 1015 BTU in 2010 to 528 × 1015 BTU in 2020. To address this ever-increasing energy demand, as well as prevent environmental pollution, clean energies are presented as a potential solution. In this regard, evaluating and selecting the most appropriate clean energy solution for a specific area is of particular importance. Therefore, in this study, a comparative analysis in Jiangsu province in China was performed by describing and implementing five prominent multi-criteria decision-making methods in the field of energy technology selection, including SAW, TOPSIS, ELECTRE, VIKOR, and COPRAS. The decision problem here consists of four clean energy options, including solar photovoltaic, wind, nuclear, and biomass, which have been evaluated by twelve basic and important criteria for ranking clean energy options. The obtained results, according to all five MCDM methods, indicate that solar photovoltaic was the optimal option in this study, followed by wind energy. The nuclear and biomass options placed third and fourth, respectively, except in the ELECTRE method ranking, in which both options scored the same and thus neither was superior. Finally, by conducting a comprehensive two-stage sensitivity analysis, in the first stage, it was found that changes in the weights of land use and water consumption criteria had the greatest impact on the performance of options, among which biomass and nuclear showed high sensitivity to variations in criteria weights. In the second stage, by defining five scenarios, the ranking of options was evaluated from different aspects so that the decision maker/organization would be able to make appropriate decisions in different situations.

1. Introduction

Global primary energy consumption drastically increased from 479 × 1015 BTU in 2010 to 528 × 1015 BTU in 2020 [1]. However, different sources of fossil fuels have different expenses and carbon pollutants [2]. Increasing concerns about global warming because of the impact of fossil fuels have forced many countries to concentrate on developing and implementing emerging clean energy sources, such as hydro, wind, solar, biomass, and nuclear [3].
Choosing an eligible clean energy source should be specific to a particular region, and this choice involves various complex equations. For instance, wind energy is an efficient source of energy that is not currently cost-effective. On the other hand, nuclear energy, which has high utilization risk in terms of safety, has lower operating expenses compared to others. Choosing the right clean energy solution is significant for a specific area because appropriate decisions will create opportunities for new markets and jobs. Moreover, the most appropriate source of clean energy also acts as a constructive factor in improving the construction of energy use and the local economy. Nevertheless, using clean energy resources also has several technical hindrances and relatively high production costs, at least in the foreseeable future. However, the choice of alternative energy sources has absorbed the focus of researchers and governments [4].
The greenization trend is causing governments to enact new policies to move from conventional low energy conversion systems to sustainable and highly efficient clean energy systems. Achieving such systems without appropriate planning to meet the goal of sustainable energy is very challenging. The inclusion of multiple criteria, stakeholders, and conflicting objectives has completely evolved energy planning methods from a simple single-objective system to more complex systems [5]. Conventional single-objective decision making is only practical for small systems because it is mainly about maximizing or minimizing a particular element. In order to provide useful solutions that satisfy multiple goals and criteria, a proper planning system is required to overcome the increasing demand for energy with a sustainable development perspective that considers the main political, social, economic, and environmental aspects. One of the practical methods that considers multi-defined aspects to solve complex energy planning problems is multi-criteria decision making (MCDM). Multi-criteria decision analysis essentially stems from operations research, which encompasses an array of methods with a logical foundation in other fields [6]. MCDM analysis techniques are broadly employed in the public sector in the agricultural programming, migration, education, investment, transportation, defense, healthcare, energy, environmental, and private sectors [7,8,9].
The complexity and variety of energy planning issues make single-objective optimization analysis obsolete. MCDM has increasingly become an area of focus in energy planning because it enables the decision-maker to consider all the criteria associated with the problem to make appropriate decisions according to priority. MCDM is an assessment tool with which to tackle environmental, social, financial, technical, and institutional obstacles in the field of energy planning [10]. Furthermore, MCDM helps the decision maker to determine special standards based on their significance in addition to other goals.
There are several MCDM approaches that are used independently or combined with other methods to select the best option as well as to prioritize the options. Each of the proposed approaches has its own benefits and drawbacks in general and as regards a particular application. None of the proposed MCDM methods prevails over the others. However, several approaches can be applied to solve an MCDM problem and the results can be compared [11]. The analytic hierarchy process (AHP) method, for example, is commonly employed in energy applications to evaluate power plants and prioritize development. Dimic et al. [12] carried out a study considering different classifications of criteria, such as political, economic, social, cultural, physical, and technological, and introduced key performance indicators for selecting the best renewable energy sources in MCDM issues. The authors applied the fuzzy AHP method in a case study and noted the need to develop a customizable model for renewable energy-related projects to promote sustainable development goals. Altintas et al. [13] combined gray relationship analysis (GRA) and fuzzy AHP methods in order to develop a hybrid MCDM model to evaluate and analyze the overall energy sustainability performance of 35 OECD member countries.
Laxman et al. [14] categorized the various obstacles to the development of RE in Nepal into six categories (social, political, technical, economic, executive, and geographical) using the AHP method. They reported that the two economic and political obstacles were the major obstacles to the development of RE in Nepal.
In addition, other methods, such as simple additive weighting (SAW), technique for order of preference by similarity to ideal solution (TOPSIS), elimination et choix traduisant la realité (ELECTRE), preference ranking organization method for enrichment evaluations (PROMETHEE), viekriterijumsko kompromisno rangiranje (VIKOR), and integrated methods, are commonly used to solve multi-objective RE problems. For example, Ukoba et al. [15] analyzed and evaluated eight optimal renewable energy systems by 15 different criteria from environmental, technical, economic and socio-cultural categories using the TOPSIS–AHP combined method.
Sengul et al. [16] used a fuzzy TOPSIS method with a numerical example under a fuzzy environment considering nine criteria (such as land used, operating and maintenance cost, installed capacity, efficiency, capital investment, job creation, carbon dioxide emission) to rank the RE sources of Turkey. The results of their study indicated that hydropower is the most RE supply system in Turkey. Using the MCDM concept and the ELECTRE method, Erdin and Ozkaya [17] considered seven different geographical areas in Turkey and selected the best locations for renewable energy sources such as solar, wind, hydroelectric, geothermal, and biomass. They found that renewable solar and hydropower sources are the most suitable options for electricity generation in Turkey. Witt and Klumpp [18] developed a multi-period MCDM method based on the PROMETHEE method and assessed the best and worst renewable energy transition routes for the German energy sector, taking into account deep uncertainties and defining different scenarios in 2005, 2010, 2015, and 2020.
Peng et al. [19] presented a new MCDM model by integrating the ELECTRE III method, Z numbers, and the regret theory. They assessed the investment risk for different RE sources, taking into account 16 different criteria and 5 new energy source options. They reported that solar energy was the best option. Lee and Chang [20] ranked Taiwan’s RE sources using four methods: ELECTRE, TOPSIS, VIKOR, and weighted sum method (WSM). They also performed a double-stage sensitivity analysis to assess the sensitivity of each individual criterion to the change in their weights and the effect of the change in the weights of the criteria on the ranking of the alternatives.
Some researchers also used MCDM methods alone to perform decision analysis. Yilan et al. [21] evaluated seven sustainable technologies for electricity generation, including natural gas, coal, hydropower (dam), hydropower (river), wind, geothermal, and solar photovoltaic, using 12 different criteria for Turkey. In their study, they used the WSM method to rank alternatives. According to their results, hydropower technologies were the best alternatives for generating electricity. Karunathilake et al. [22] selected the best zero-net energy system alternative and investigated various technologies for generating electricity from RE sources. In their study, which used the fuzzy TOPSIS MCDM method, they showed that the best environmental choice was small-scale hydropower and the best economic choice was biofuel combustion. Additionally, Katal and Fazelpour [23] used the MCDM VIKOR method to evaluate five different types of power plants in Iran, including wind farms, gas power plants, CHPs, hydropower, and combined cycle power plants, by five criteria (power, area, efficiency, production cost, and CO2 emissions). They reported that the hydropower plant was the best choice.
In recent years, the application of merged MCDM methods has become an area of focus in several fields, especially in energy, renewable energy, and sustainability. In this regard, Lee et al. [24] introduced a combined MCDM model consisting of the VIKOR, fuzzy analytic network (FANP), and interpretive structural modeling (ISM) methods to select the best location for a solar photovoltaic power plant. Zhao et al. [25] presented a new MCDM model by integrating Fuzzy–Delphi, the best–worst method (BWM), Shannon entropy, and the VIKOR method. The authors performed a comprehensive multi-criteria decision analysis (MCDA) by implementing the proposed model and considering 21 important sub-criteria for five different power grid companies.
Štreimikienė et al. [26] used AHP and additive ratio assessment (ARAS) to assess power generation technologies based on economic, technological, environmental, social, and political criteria. Yucenur et al. [27] selected the most convenient city for the establishment of biogas plants in Turkey using the integrated SWARA (step-wise weight assessment ratio analysis) and COPRAS (complex proportional assessment) MCDM methods utilizing 12 different indicators. Ervural et al. [28] evaluated energy investment planning using a proposed integrated model comprising AHP methods, target planning (energy policy target), and fuzzy TOPSIS. Ramezanzade et al. [29] employed four MCDM methods, including MOORA (multi-objective optimization based on ratio analysis), VIKOR, ARAS, and EDAS (evaluation based on distance from average solution), in a fuzzy environment to rank renewable energy projects in North Khorasan province, Iran. For this purpose, 30 different criteria were considered and by conducting evaluations in a fuzzy environment, it was reported that solar and small hydropower projects are the most suitable renewable projects, respectively.
Wang et al. [30] evaluated four energy distribution systems (gas turbine, fuel cell, photovoltaic, and internal combustion engine) by means of eight different criteria, including capital cost, operating cost, energy consumption, primary energy efficiency rate, technological maturity, annual CO2/NOx emissions, and social acceptance. They used a combination of two MCDM methods, interval DEMATEL (decision making trial and evaluation laboratory) and interval VIKOR, and reported that the photovoltaic scenario was the best alternative.
This study aims to comprehensively study the solutions of clean energy sources for electricity generation in Jiangsu province in China with the help of five widely used MCDM methods. For this purpose, five multi-criteria decision-making methods, namely SAW, TOPSIS, ELECTRE, VIKOR, and COPRAS, have been described and implemented. Using a set of widely used MCDM methods, a complete comparison between ranking results can be made, and finally a highly reliable prioritization can be provided that was not carried out in [4]. On the other hand, in [4] the evaluation was conducted by considering only seven criteria, which does not seem to be comprehensive enough for prioritizing options in the field of clean energy. Therefore, some of the most important effective criteria in decision making in this field, such as system life, water consumption, system efficiency, etc., are included in the multi-criteria decision analysis process. In addition, the reference study was performed in a fuzzy environment; thus, comparing the results of this study with the results of the reference study will be useful for a better understanding of the performance of MCDM methods. Finally, this study tries to provide a complete model for decision-makers by providing a ranking and performing two types of sensitivity analysis by evaluating the effect of changes in criteria weights on the performance of options (defining five different scenarios) and evaluating how options are ranked.

1.1. Case Study: Jiangsu Province

The geographical location of Jiangsu province is shown in Figure 1. Jiangsu, with an area of about 102,000 square kilometers and a population of about 80 million, is one of China’s most populous provinces. Since 1990, Jiangsu has been one of China’s most advanced provinces. On the other hand, with rapid economic growth and vast urbanization, scarcities of resources and environmental pollution have become important problems in Jiangsu’s development.
The reducing effect on energy supply caused by adaptation to clean energy sources is a critical factor in the long-term development of Jiangsu province to guarantee economic development and the growth of urbanization [3,31]. Possible clean energy sources that can be used by Jiangsu are solar photovoltaic, wind, hydro, biomass, geothermal, and nuclear. However, geothermal, due to the low temperature of geothermal resources in this region, is not a practical solution for power generation and can only be used for low-temperature heating applications [3]. Moreover, the development of most water resources in Jiangsu has already been implemented [32]. Therefore, in this investigation, four types of clean energy are considered, namely solar photovoltaic, wind, biomass, and nuclear energy. It is worth noting that solar energy is generally the strongest option with 83 terawatt hours per year for potential exploitation in Jiangsu [33].
Figure 1. Geographical location of Jiangsu province in China [34].
Sustainability 14 01403 g001
Now the basic problem for Jiangsu province is how to prioritize and rank clean energy sources to find the convenient clean energy strategy for designation and implementation. Since clean energy is not only a solution to energy shortages and is a solution to reduce climate changes and environmental pollutions [35], other factors such as technological, environmental, social and economic factors must also be included. The total sustainability rates of clean energy sources should be determined on the basis of all relevant criteria to comprehensively evaluate energy sources [36]. Energy sources can then be prioritized based upon those values. The MCDM is a viable method for evaluating clean energy sources, since various criteria should be considered.

1.2. Multi-Criteria Decision-Making Approach

As stated in the Introduction, decision-making analysis is an excellent tool for problem solving and is characterized by multiple operators, criteria, and goals. MCDM issues generally consist of five different components, namely: purpose, decision-making preferences, alternatives, criteria, and outcomes [37,38]. MCDM can be categorized as shown in Figure 2. In MCDM, the inherent features are covered, which leads to fewer options being considered, thus making the prioritization difficult—making evaluation more difficult as well. The final output is obtained by comparing different options according to each available criterion [38,
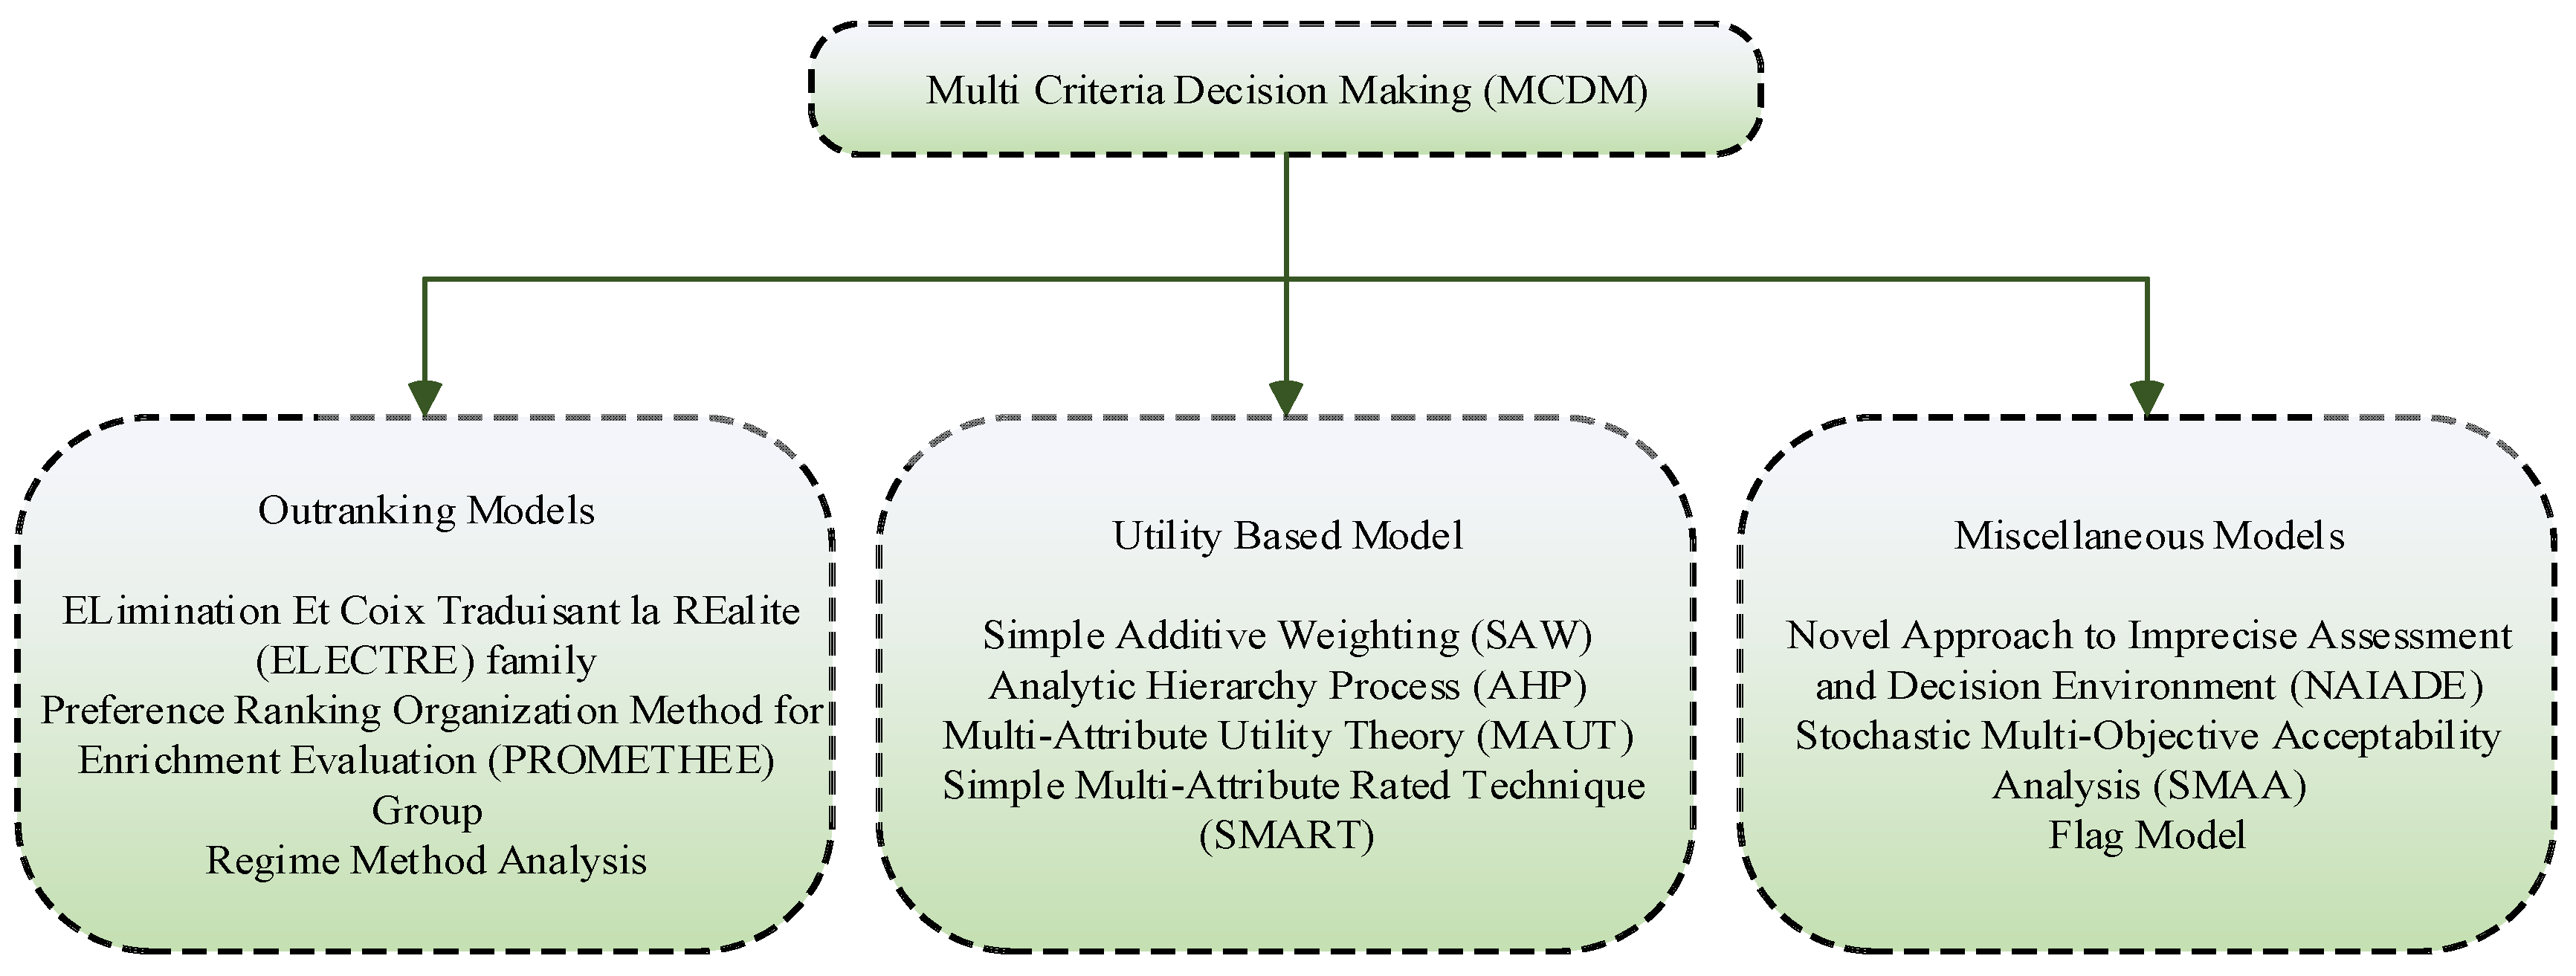
39]. A classification of such models is presented in 
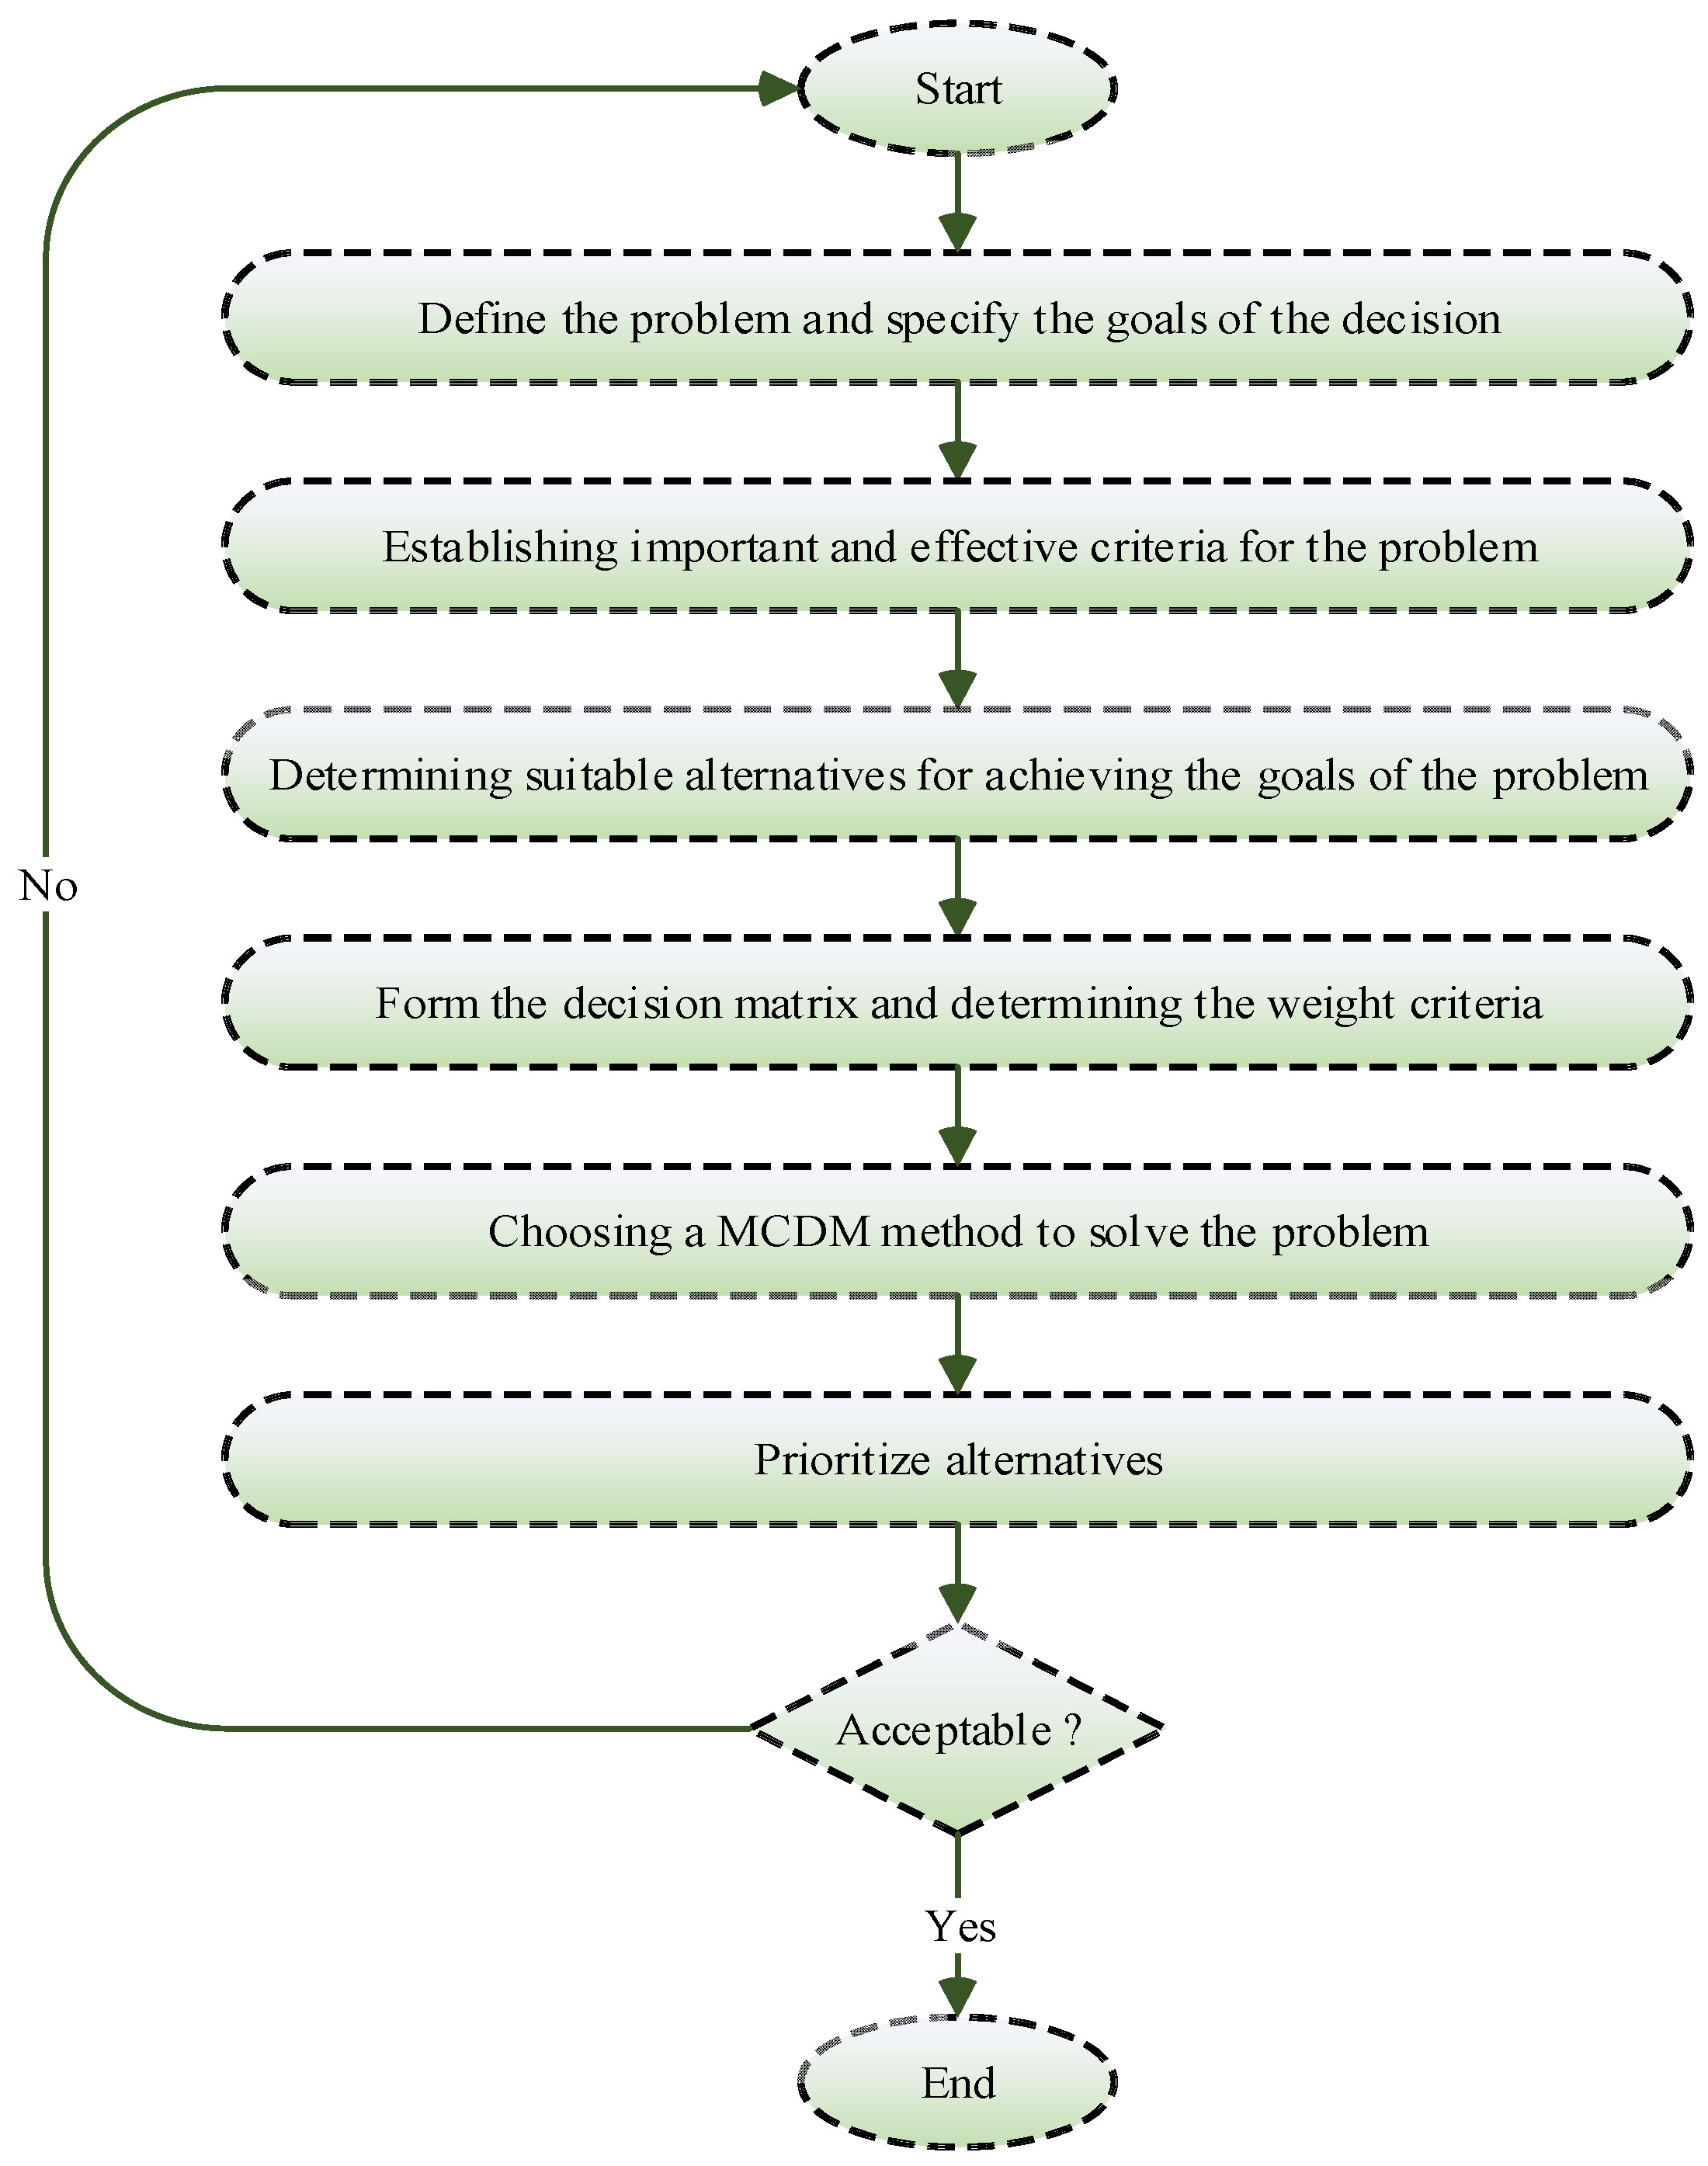
Figure 3. A schematic overview of the MCDM approach is shown in Figure 4.
The classification of MCDM methods presented in Figure 4 is only a small component of these methods. Many MCDM methods have been developed and introduced by researchers, each of which has been developed on a specific basis. In general, none of the MCDM methods can be considered superior to the others, so the selection and application of one MCDM method depends on expert opinion and the type of decision problem. Some MCDM methods, due to their nature, can be appropriate and useful in certain study fields (depending on the type and scale of the initial decision data). In the field of energy, some MCDM methods are more widely used and more reliable than others [40,41]. In this study, we try to provide a comprehensive review and comparison of clean energy sources by selecting different MCDM methods from different groups of categories of these methods. In this regard, five MCDM methods (SAW, TOPSIS, ELECTRE, VIKOR, and COPRAS) have been selected. Each of these methods has strengths and weaknesses. Some of these are summarized in Table 1. The SAW method is one of the oldest and simplest decision-making methods that has a compensatory nature and has been widely used in the field of energy systems engineering [37]. TOPSIS is also a method of compensatory nature and is one of the most accepted and reliable methods of MCDM, which in this study has been used to rank clean energy options. The third method, ELECTRE, is based on the law of pairwise comparisons. This method also considers the incompatibility between the options and has a non-compensatory nature, which has made it one of the most widely used outranking methods. For problems that have conflicting and incomparable criteria, the use of the VIKOR method is suggested. In this method, it is assumed that the compromise solution can be acceptable for conflict resolution analysis. The last MCDM method used in this study is the COPRAS method, which is referred to as a real MCDM method and takes less time to introduce than the other methods.
Figure 2. Multi-criteria decision-making classification [42].
Sustainability 14 01403 g002
Figure 3. Multi-criteria decision-making models [43].
Sustainability 14 01403 g003
Figure 4. A common process for multi-criteria decision analysis.
Sustainability 14 01403 g004

2. Materials and Methods

2.1. Determination of Criteria Weights

Each issue that the decision maker confronts may include several criteria. Therefore, a sufficient knowledge of the significance of each criterion is of notable interest. Thereby, a weight is assigned to each criterion so that the criteria weights’ summation is equal to the one. These weights indicate the relative importance and degree of superiority of each criterion compared with the other criteria for decision making. There are various methods to evaluate the weights of criteria. Some of the most important ones are the Shannon entropy, LINMAP, least squares, and special vector techniques.

Implementation of Shannon Entropy Method

The Shannon entropy method, introduced by Shannon and Weaver in 1974, is a multi-criteria decision-making method for calculating the weights of criteria. This method can be applied when the data of a decision matrix are completely clear. Entropy represents the value of uncertainty in a continuous probability distribution. The basic idea of this method is that the higher the dispersion in the values of a criterion, the more important the criterion is [37].
Shannon showed an inverse relationship between the probability of an event occurring and the resulting information. The more likely an event is to occur, the less information it can obtains and vice versa. With the acquisition of new information, uncertainties actually decrease and the value of new information is equal to the value by which the uncertainties decrease. As a result, uncertainties and information are interdependent parameters. Assume that m alternatives ( A 1 ,   A 2 , ,   A m ) and n criteria ( C 1 ,   C 2 , ,   C n ) are available for a decision-making problem. The decision matrix would be as follows:
D M = [ a 11 a 12 a 1 n a 21 a 22 a 2 n a m 1 a m 2 a m n ] = [ a i j ] m × n
where a i j is the i -th alternative and j -th criterion.
To calculate the weights of the criteria, we must perform the four steps presented in Figure 5.
Step 1: The decision matrix is normalized using the following equation:
P i j = a i j i = 1 m a i j             i = 1 , 2 , 3 , ,   m       &       j = 1 , 2 , 3 , ,   n
where P i j denotes the normalized value of each array in the decision matrix.
Step 2: The reliability of each index ( E j ) is calculated using the following equation:
E j = k i = 1 m P i j × L n   P i j     ,         k = 1 l n   ( m )
Step 3: The uncertainty of each indicator ( d j ) is obtained by the following equation:
d j = 1 E j
Step 4: Finally, the weight of each indicator ( W j ) is calculated from the following equation:
W j = d j j = 1 n d j

2.2. SAW Method

The simple additive weighting (SAW) or weighted sum method (WSM) is the simplest MCDM method. In 1967, this method was presented by Fishburn [44]. In this method, only the decision matrix and the vector of criteria weights used for evaluation are required. Since this method uses a linear increment function to represent decision makers’ preferences, it can be considered the simplest and most direct method of dealing with multi-criteria decision problems [45,46]. The steps involved in this method are shown in the flowchart in Figure 6.
Step 1: Quantifying the decision matrix.
To perform multi-criteria decision-making calculations, all decision matrix values need to be quantitative. If there are qualitative values in the decision matrix, the qualitative values should be converted into quantitative values using Table 2 and Table 3.
Step 2: linear descaling (normalization) of decision matrix values.
The criteria values with different dimensions must be converted to dimensionless criteria values. In the SAW method, a linear method is used for normalization and the following equations are used for positive and negative criteria, respectively.
n i j = a i j M a x   a i j
n i j = 1 a i j M a x   1 a i j
where n i j   indicates the normalized value of each array in the decision matrix.
Step 3: Obtain the weights of the criteria and multiply them by the normalized decision matrix calculated in the previous step.
In the present paper, the Shannon entropy method is used to obtain the criteria weights.
Step 4: Rank the alternatives and select the best alternative ( A * ) according to the following equation:
A * = { A i   |   M a x   j = 1 n n i j W j }

2.3. TOPSIS Method

The technique for order of preference by similarity to ideal solution (TOPSIS) method is based on a simple principle: the best choice should have the closest possible distance from the ideal positive solution in geometric terms while being the furthest possible distance from the ideal negative solution [47]. This model undertakes that each criterion is uniformly increasing or decreasing its benefit.
The TOPSIS model was proposed by Hwang and Yoon [48] in 1981, and it is one of the best multi-criteria decision-making methods for ranking alternatives. In this method, m alternatives are evaluated by n criteria, which is based on the two concepts of “ideal solution” and “similarity to ideal solution”. Ideal solution, as its name implies, is the best solution that is not generally possible in practice and one tries to approach it in order to measure the similarity of a design (or alternative) to an ideal and anti-ideal solution. The distance of that design (or alternative) from the ideal and anti-ideal solution is measured and then the alternatives are ranked based on the ratio of the distance from the anti-ideal solution to the total distance from the ideal and anti-ideal solution. In this method it is assumed that the desirability of each criterion is uniformly incremental or decreasing, the criteria are independent of each other, and the distance between the ideal and the anti-ideal solutions is calculated in Euclidean terms [49].
To apply this method to multi-criteria decision problems, we can follow the steps in the flowchart in Figure 7.
Step 1: Normalize the decision matrix.
At this stage, we attempt to transform the criteria values with different dimensions into dimensionless criteria values. In the TOPSIS method, the following equation is used for normalization:
n i j = a i j i = 1 m a i j 2
Step 2: Determine the criteria weight matrix W n × n .
The Shannon entropy method is used to determine the criteria weight matrix.
Step 3: Form the weighted normalized matrix of V m × n .
The weighted normalized matrix ( V m × n ) is obtained through multiplying the diagonal matrix of criteria weights ( W n × n ) by the normalized decision matrix ( N m × n ) according to the following equation:
V m × n = N m × n × W n × n
Step 4: Determine the ideal positive solution and the ideal negative solution.
The following equations are used to determine the ideal positive and negative solutions, respectively.
A + = { V i + , , V n + } = { ( M A X   i v i j ,   j J ) ( M I N   i v i j ,   j J ) } i = 1 , 2 , , m
A = { V i , , V n } = { ( M I N   i v i j ,   j J ) ( M A X   i v i j ,   j J ) } i = 1 , 2 , , m
where A + indicates the ideal positive solution that represents the least possible risk, and A indicates the ideal negative solution that represents the highest possible risk.
Step 5: Calculate the distance between the ideal positive and negative solutions.
The degree of deviation between the ideal positive solution ( d i + ) and ideal negative solution ( d i ) for each alternative using the Euclidean method are calculated from the following equations, respectively.
d i + = j = 1 n ( V i j V j + ) 2               i = 1 , 2 , , m
d i = j = 1 n ( V i j V j ) 2               i = 1 , 2 , , m
Step 6: Calculate the similarity index ( C l i ) to the ideal positive solution and rank the alternatives.
The similarity index indicates the score of each alternative and is calculated based on the following equation:
C l i = d i d i +
The closer the indicator is to 1, the better the alternative.

2.4. ELECTRE Method

The elimination et choix traduisant la realité (ELECTRE) method was presented by Benjamin, Zinc, and Susman in 1966 and modified and upgraded by Zinc in 1971. There are two main steps for most ELECTRE methods: creating ranking relationships (outranking) and exploiting these relationships to achieve the final score of the alternatives. Different ELECTRE models may vary in terms of how they specify the scoring schemes between the different alternatives and how they use these schemes to achieve the final scoring assessment for different alternatives [50,51,52,53].
The distinctive element of ELECTRE is how it utilizes a scoring scheme by making pairwise comparisons between alternatives separately based on each criterion. This approach is based on studying the relations between ratings and the concepts of coordination. The construction of the scoring scheme is such that it enables the comparison of options. The ELECTRE method uses the concordance and discordance of the criteria as well as the threshold values to assess the scoring schemes between the available options [37]. To decide based on the ELECTRE method, one must first proceed to the formation of a weighted normalized matrix ( V m × n 
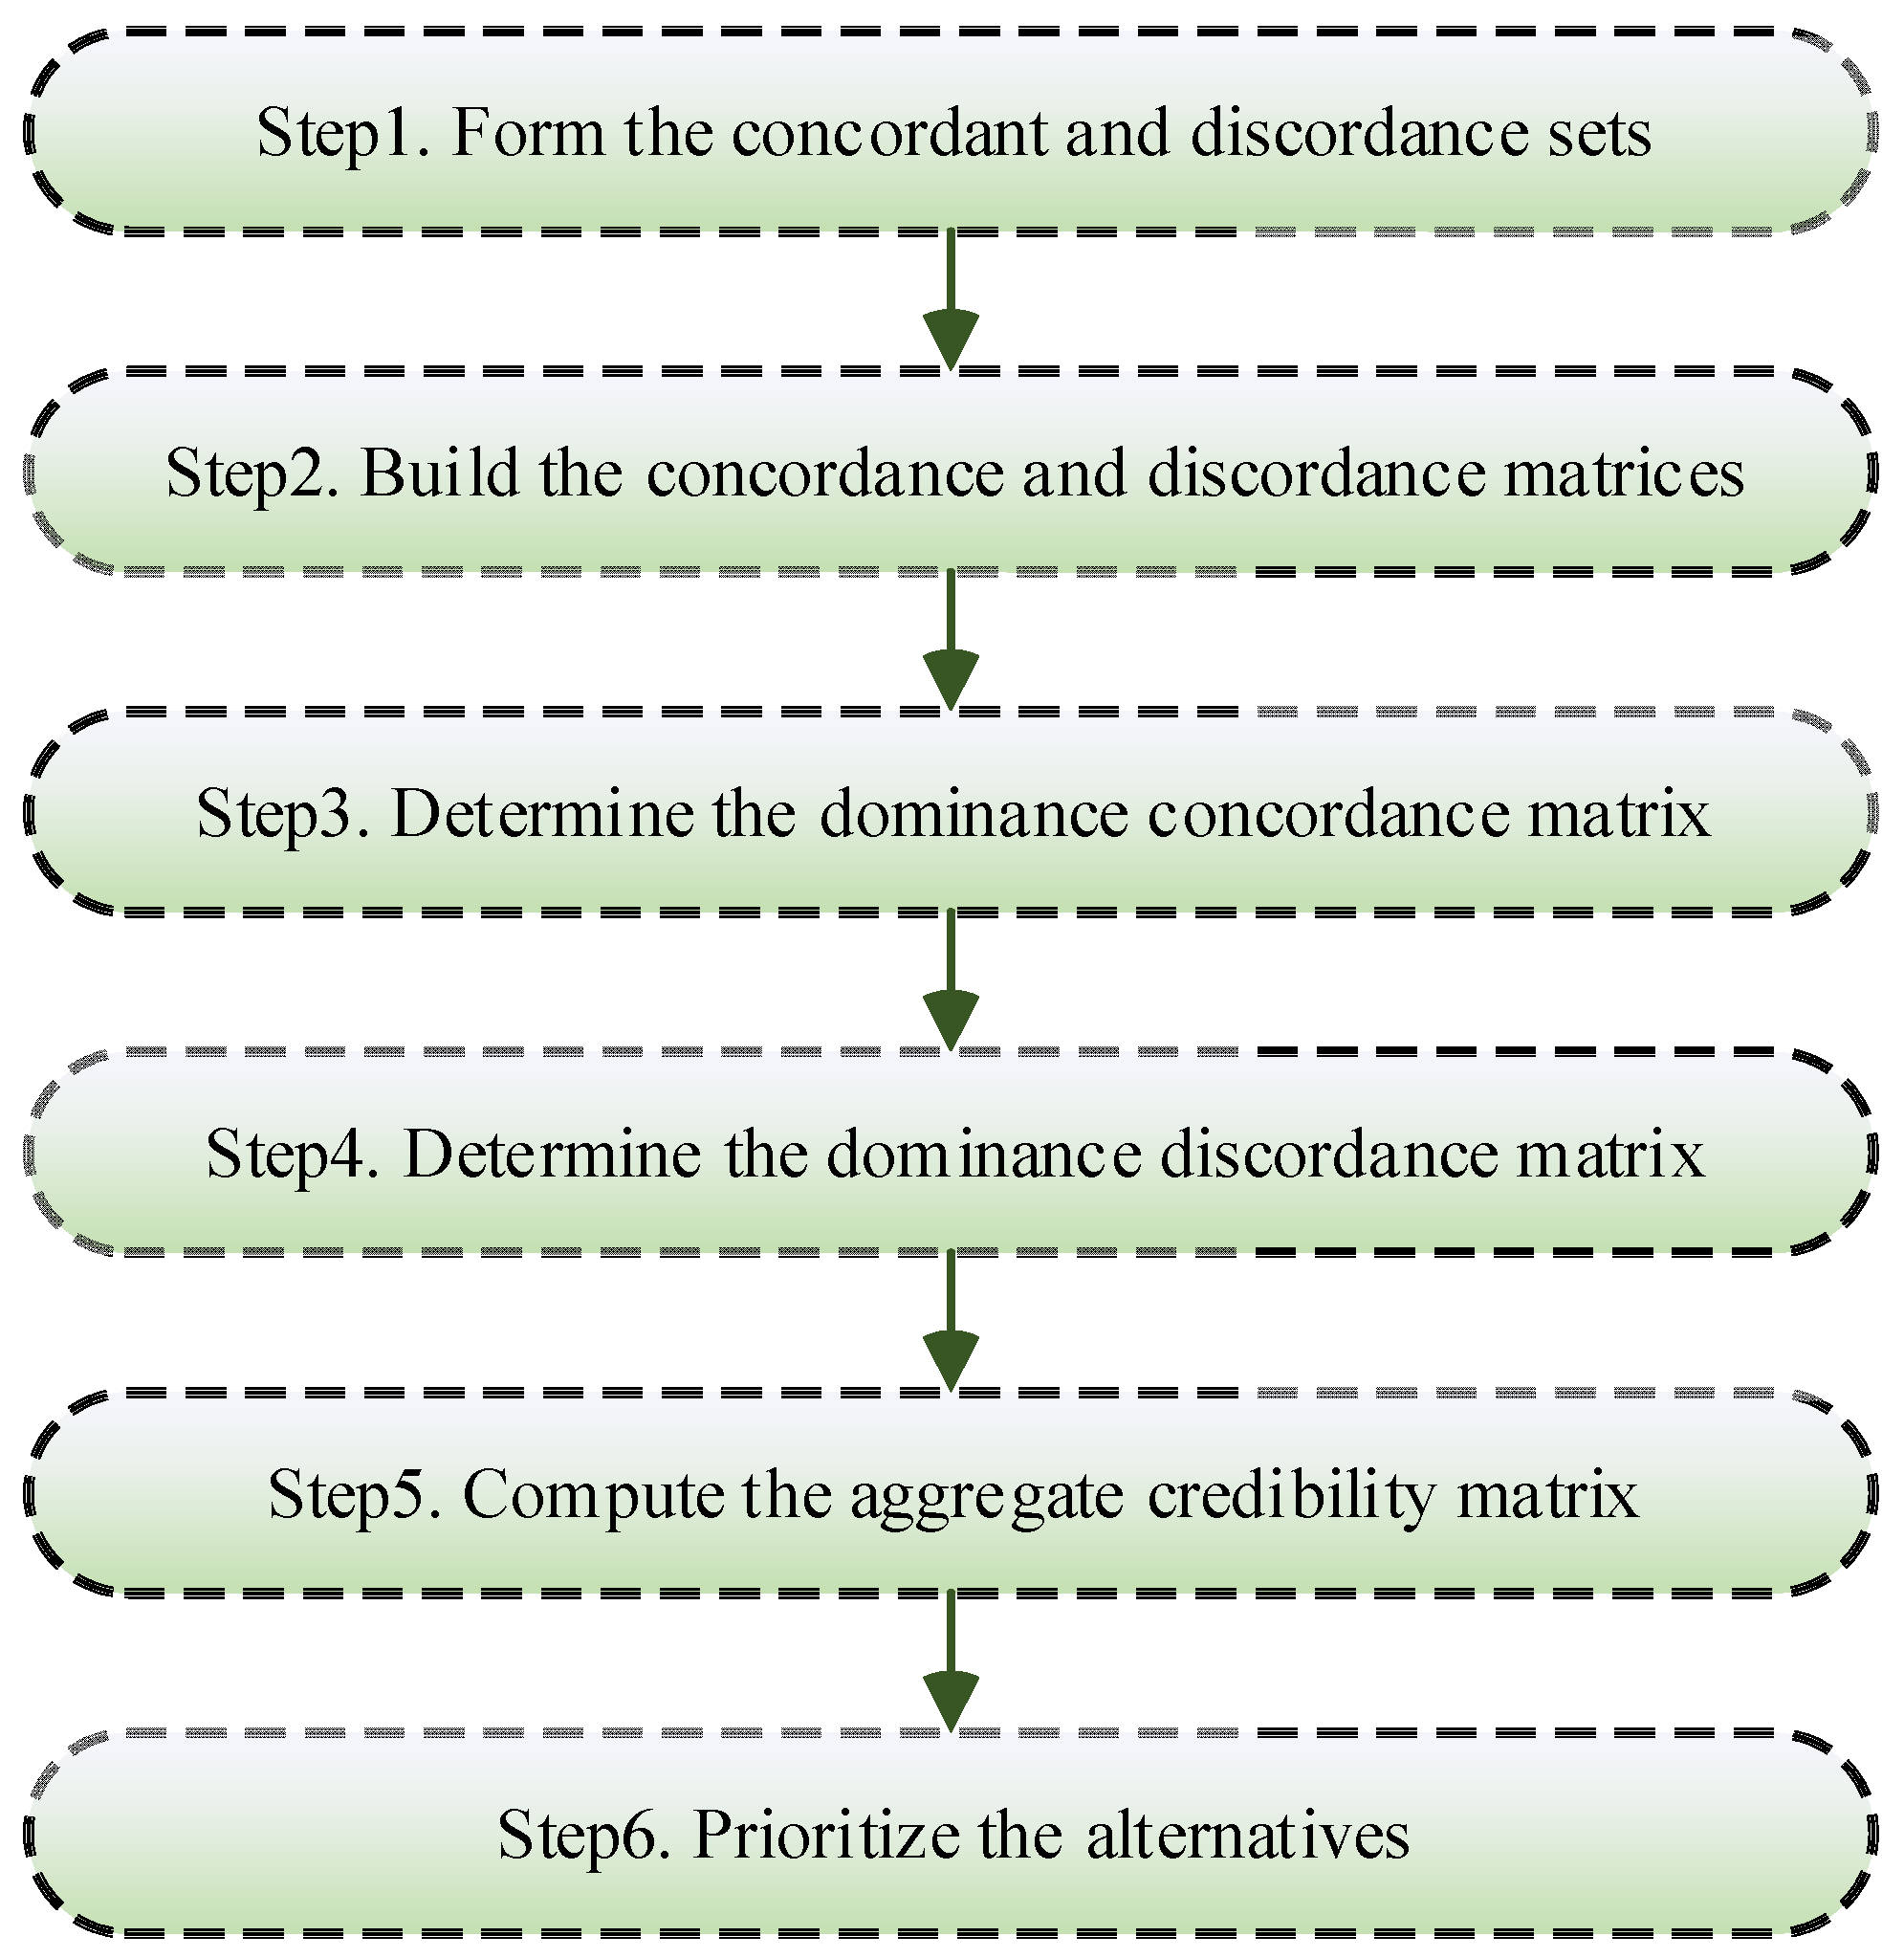
)—similar to the TOPSIS method. To apply this method we must follow the steps in Figure 8.
Step 1: Form concordance and discordance sets.
At this stage, all alternatives are evaluated according to all criteria. The concordance set of the alternatives of k and l , denoted by S k , l , will contain all the criteria under which A k   is more desirable than A l . A discordance set of k and l alternatives, denoted by D k , l , will include all the criteria under which A k   is less desirable than A l . The following equations are used, respectively, to create concordance and discordance sets for the positive criteria:
S k , l = { j   |   V k , j V l , j }               j = 1 , 2 , , n
D k , l = { j   |   V k , j < V l , j }               j = 1 , 2 , , n
Additionally, to create concordance and discordance sets for the negative criteria, the following equations are used, respectively:
S k , l = { j   |   V k , j V l , j }               j = 1 , 2 , , n
D k , l = { j   |   V k , j > V l , j }               j = 1 , 2 , , n
Step2: Construct concordance and discordance matrixes.
The concordance matrix I k , l   and the discordance matrix N I k , l are square matrices ( m × m ) whose main diameter is without value. Other elements of this matrix are derived from the sum of the weights of the criteria belonging to the concordance and discordance sets, which in mathematical language will be according to the following equations, respectively:
I k , l = W j             j S k , l
N I k , l = M A X   | ν k , j ν l , j |     ,         j D k , l M A X   | ν k , j ν l , j |     ,         j = 1 , 2 , , n
These indexes express the relative importance of the alternative A k   over   A l . The value of this numerical criterion is between zero and one. The larger the value, the more superior A k is to   A l .
Step3: Form the dominance concordance matrix.
To form a revised concordance matrix represented by H , one needs to define a threshold I ¯ according to the following equation. The elements of the effective concordance matrix H are determined with respect to the concordance matrix I and by the following equations:
I ¯ = l = 1 m   k = 1 m   I k , l m ( m 1 )
i f :     I k , l I ¯   H k , l = 1
i f :     I k , l < I ¯   H k , l = 0
Step 4: Form the dominance discordance matrix.
At this stage, the effective uncoordinated matrix represented by G, like the effective coordinate matrix, needs to define a threshold ( N I ¯ ) , which is determined by the values of this matrix via the following equations:
N I ¯ = l = 1 m   k = 1 m   N I k , l m ( m 1 )
i f :     N I k , l N I ¯   G k , l = 0
i f :     N I k , l < N I ¯   G k , l = 1
Step 5: Form the dominated total matrix.
The revised total matrix F is obtained by multiplying every element of the dominated concordance matrix by every element of the dominated discordance matrix G according to the following equation:
F k , l = H k , l   · G k , l
Step 6: Prioritize the alternatives and select the best alternative.
Finally, the dominated total matrix F expresses the partial outranking of the alternatives so that if F k , l = 1 , it can be said that A k   is superior to A l . Of course, this preference may be affected by other alternatives. Therefore, A k is the superior alternative, if for at least one L , F k , l = 1 and for others F k , l = 0 .

2.5. VIKOR Method

The basics of the VIKOR model were first presented by Yu [54] and Zeleny [55] and later supported by Opricovic and Tzeng [56,57]. The model was developed for multi-criteria optimization of complex systems and to solve decision-making problems with respect to contradictory and disproportionate criteria (different units of measurement). In the VIKOR method, a multi-criteria measurement is developed for compromise rankings using the L P metric, which is used as a cumulative function in a compromise programming method. The   L P measurement provides the distance of A j   as an alternative to the ideal solution. Each of the different alternatives A 1 ,   A 2 ,   ,   A J ,   which are measured against different criteria C 1 ,   C 2 ,   ,   C i , is indicated by f i j .
L P , j = { i = 1 n [ W i ( f i * f i j ) ( f i * f i ) ] p } 1 p           ;           1 p           ;             j = 1 , 2 , ,   J
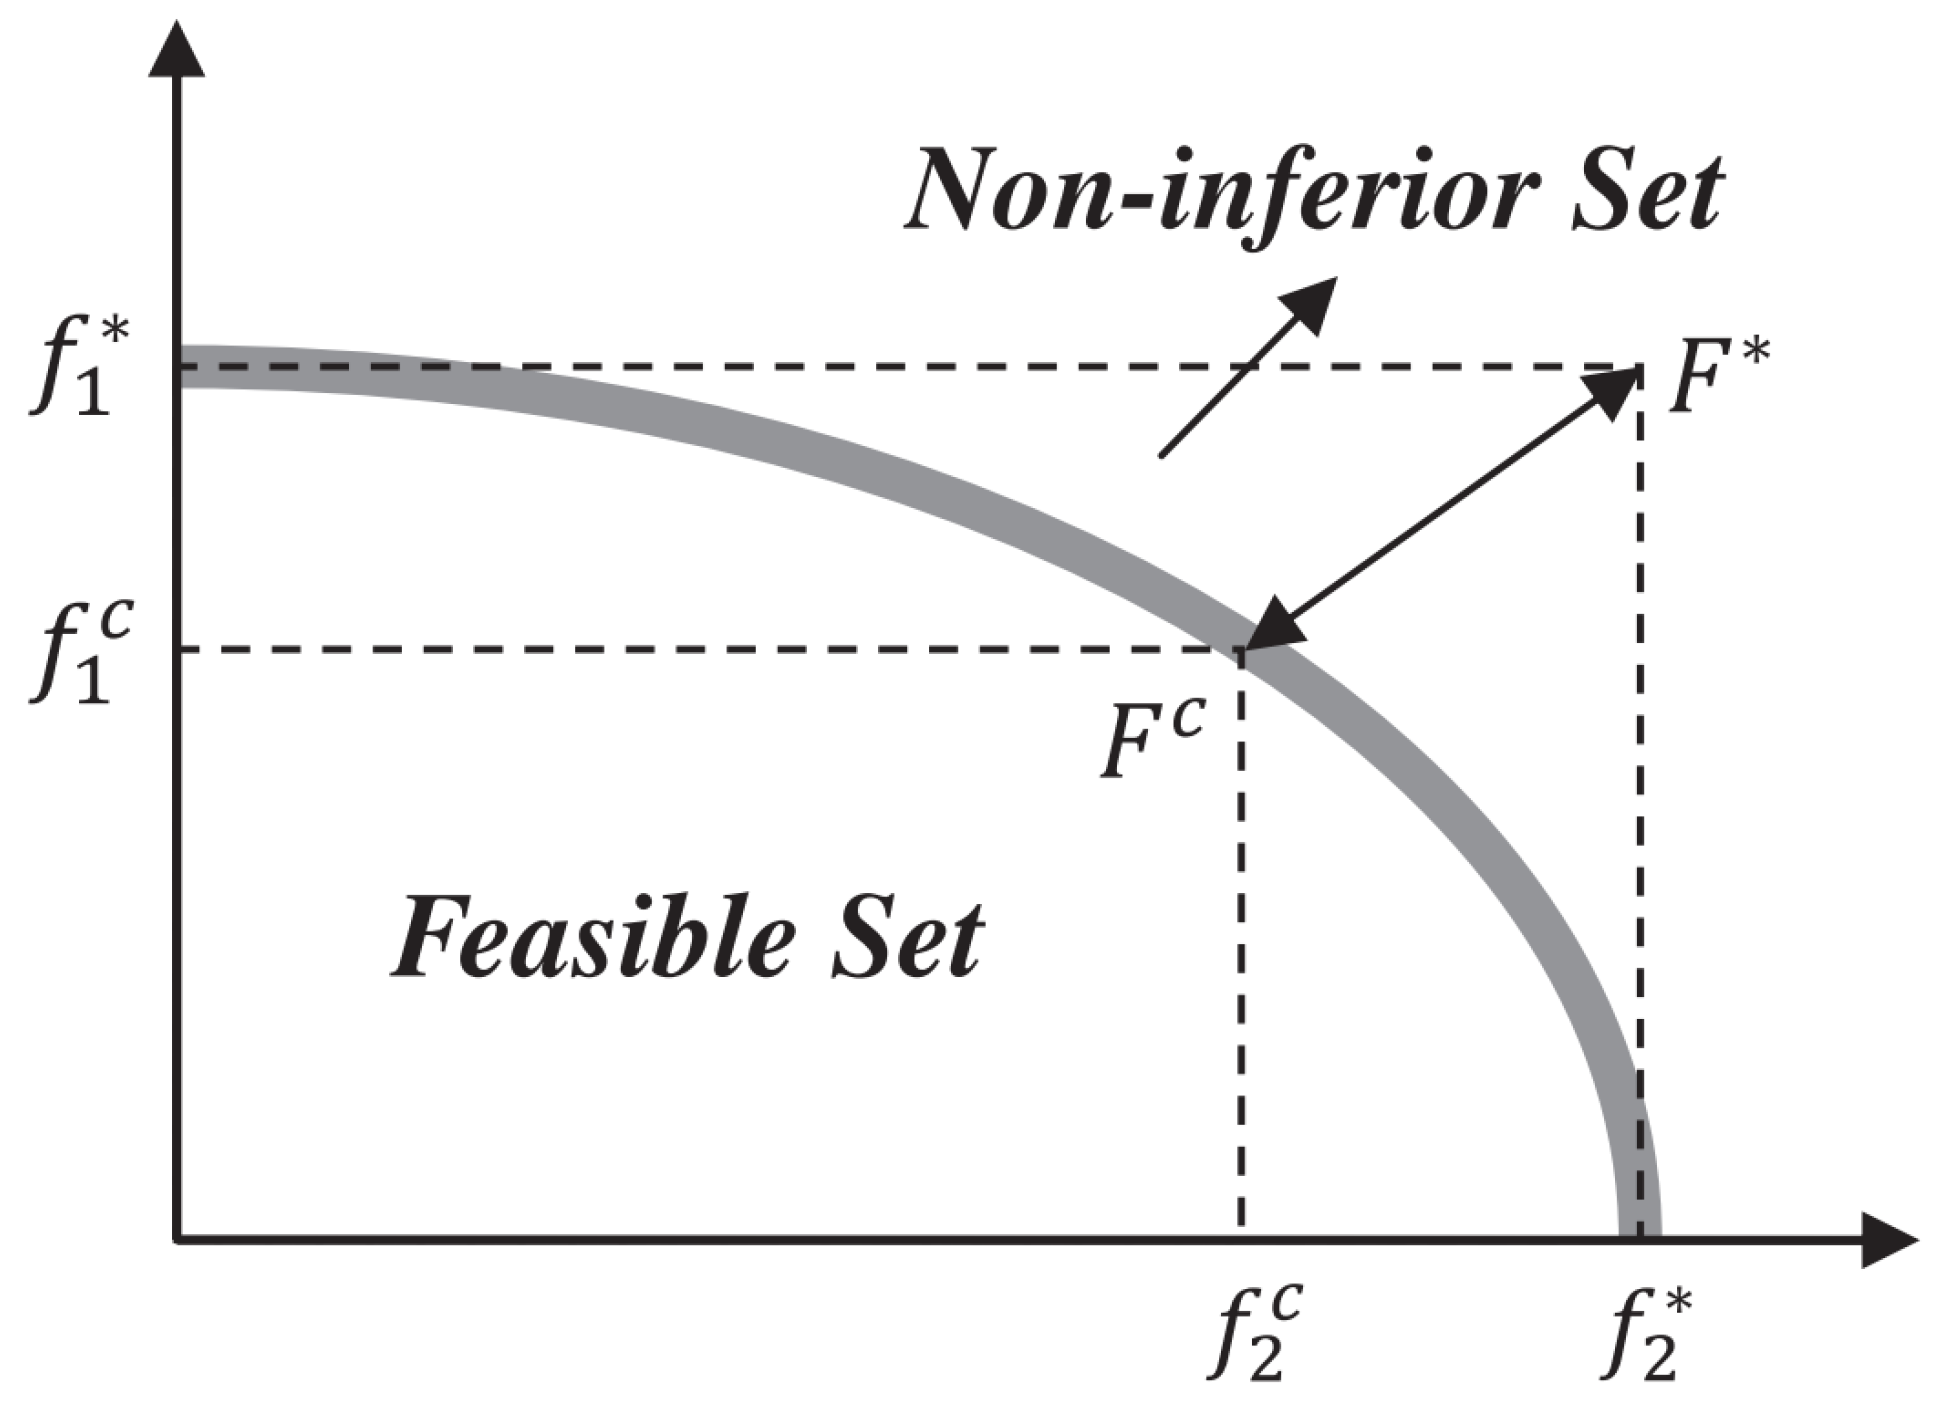
In this model, compromise ranking is achieved by comparing the degree of closeness with the ideal solution. VIKOR’s key feature is that it maximizes the benefits of the group and minimizes the individual regret so that its compromise solution can be accepted by decision makers. VIKOR’s compromise solution F C , as shown in Figure 9, is based on the closeness to the ideal solution F * among all the solutions, which results in the compromise of two criteria, f 1 *   and f 2 C [58].
To implement the VIKOR method, the steps presented in Figure 10 must be taken.
Step 1: Determine the positive ideal solution f j * and the negative ideal solution f j for every criterion.
f j * = { M a x   f i j   |   j I 1 }     ,       f j * = { M i n   f i j   |   j I 2 }
f j = { M i n   f i j   |   j I 1 }     ,       f j * = { M a x   f i j   |   j I 2 }
where   I 1 and I 2 are the set of positive and negative criteria, respectively.
Step 2: Calculate the benefit S i and regret R i values:
S i = j = 1 n w j ( f j * f i j ) / ( f j * f j )
R i = M a x [ w j ( f j * f i j ) / ( f j * f j ) ]
Step 3: Calculate the VIKOR index Q i for every criterion:
Q i = ν ( ) + ( 1 ν ) ( R i R * R R * )
where S * = min S i , S = max S i , R * = min R i , R = max R i and ν is weight assigned to maximum group utility, whereas ( 1 ν ) is the weight of individual regret. Generally, ν is considered 0.5. However, it can also be any value between 0 and 1.
Step 4: Rank the alternatives with respect to the calculated values of Q i in an incremental order, where the alternative with the lowest Q i is preferred.

2.6. COPRAS Method

Complex proportional asessment (COPRAS) is one of the most accepted multi-criteria decision-making methods and was introduced and used by Zavadskas and Kaklauskas in 1994 [59]. COPRAS is one of the methods that has been developed rapidly and has been used in various fields such as medicine, materials, energy, etc. In this method, the ranking of options is done step by step by considering the ideal and worst solutions based on the relative and direct dependence on their degree of application and importance [60]. In addition, it is possible to use this method to maximize or minimize a criterion (when more than one criterion is available) [61]. To use the COPRAS method, the steps illustrated in Figure 11 must be implemented.
Step 1: De-scale (normalize) the decision matrix.
In this method, the following equation is used to normalize the decision matrix and to make the values comparable:
n i j = a i j i = 1 m a i j
Step 2: Form a balanced normalized decision matrix.
Similar to the TOPSIS method, by applying the weight of the criteria to the normalized decision matrix, the weighted normalized decision matrix is calculated according to the following equation:
V m × n = N m × n × W n × n
Step 3: Calculate the sum of the weighted normalized values for the positive (useful) S i + and negative (non-useful) S i criteria.
For each of the options, the sum of the balanced normalized values according to the type of criteria are obtained as follows:
S i + = j = 1 n a i j +         ;           i = 1 , 2 , , m
S i = j = 1 n a i j           ;           i = 1 , 2 , , m
In above equations, + and − represent the useful and non-useful, respectively.
Step 4: Calculate the relative importance or priority of each of the options ( Q i ).
To do this, S m i n must first be specified, which represents the minimum value of S i . Q i is then set for each of the options as follows:
Q i = S i + + S m i n × i = 1 m S i S i × i = 1 m ( S m i n / S i )
Step 5: Determine the percentage of efficiency ( U D i ) and rank the options.
In the last step, to rank (prioritize) the options, U D i is determined for each of the options as follows:
U D i = Q i Q m a x × 100
where Q m a x denotes the maximum relative importance among options. The highest value of U D i   indicates the best option for selection.

3. Selection of Evaluation Criteria

Common criteria that serve as a basis for RE solution assessment are: technical, economic, environmental, and social policy aspects. The priorities or interests of different stakeholders can be met by using different assessment techniques. For instance, technological readiness level (TRL), lifetime, investment cost, O&M cost, and feed-in-tariff (FIT) may be most important factors for investors. Meanwhile, carbon dioxide emissions, land use, and water consumption are the most important matters for governments and job creation and safety are the biggest concerns for people. A thorough list of crucial evaluation criteria is provided, taking into account all the views of major stakeholders, the accessibility of specific current information for Jiangsu, and the possibility of ranking solutions. Table 4 shows the list of criteria used to assess the alternatives for clean energy resources available in Jiangsu province. Available clean energy alternatives include solar photovoltaic, wind, nuclear and biomass. The reasons for choosing the evaluation criteria listed in Table 4 are explained below.

3.1. Technology Readiness Level (TRL)

Because Jiangsu is a developed province and is located in China, the TRL criterion must not be neglected. TRL can be a factor when evaluating clean energy alternatives by designing, manufacturing, and installing related equipment, transmitting or storing generated energy, etc., given that this technology can be transferred to any county. TRL values for wind, solar, and biomass energy are considered according to Ref. [64], where “1” specifies that TRL is confirmed by the government of Jiangsu, while “3” means that TRL is at a very low level. Additionally, TRL is set to “3” for nuclear power since clean energy sources require the most technological focus. It is noteworthy that Russia supports the nuclear power technologies in Jiangsu province.

3.2. Safety

Safety criterion can be a benchmark for the technical assessment of technology and also a social criterion for demonstrating the impact of different energy systems on society and people [37]. Safety values are determined according to the specific characteristics of each clean energy alternative [63]. The risk of nuclear energy is small, but because of the possibility of nuclear leakage or explosion its potential is high. Wind energy technology has a high probability but relatively low impact with the potential for birds to fly into installed turbines, unusual scenery effects, and moderate noise pollution. Because obtaining a cardinal number for safety matters is not easy, a range of 1 to 4 is applied to specify the relative safety of any other technology. The value 4 is applied to represent the most secure technologies.

3.3. Efficiency

The amount of useful output that can be received from input energy in a system is called the energy efficiency of that system. In other words, energy efficiency is the ratio of useful energy output to energy input in a system. This parameter has a range for different technologies and in this study the average value of the reported values is used. The energy efficiencies of solar photovoltaic, wind energy, nuclear energy, and biomass have been extracted from [65,66].

3.4. Lifetime

The lifetime of any energy system is the average expected time during which that system can remain fully operational. Each power generation system, due to its nature, can provide service over a certain period of time and it is clear that over time the probability of failure of a system increases. The average lifetime data for solar photovoltaic and wind technologies are derived from [65] and for nuclear and biomass technologies from [26].

3.5. Investment Cost (IC)

The investment cost (IC) for each technology can vary depending on its nature. However, in general the IC includes items such as the cost of purchasing mechanical equipment, installation of equipment, engineering services, construction of required structures, construction of communication routes with the network, etc. Information on IC in solar PV, wind, nuclear, and biomass in Jiangsu province is adopted from [67,68,69,70], respectively. (The conversion exchange rate of the US Dollar to the Chinese Yuan was 6.139).

3.6. Operation and Maintenance (O&M) Costs

This economic indicator consists of two important parts: (1) Operating costs, which consist of staff wages and the total cost of fuel, products, and services required to operate an energy system, and (2) Maintenance costs, which includes the total cost of repairing and servicing the system in order to increase the lifetime of the system and its proper operation during the expected life. The average of the reported values for this parameter is extracted from [33].

3.7. Feed-in-Tarrif (FIT)

FIT is a feed-in tariff for the purchase of each kWh of electricity generated by clean energy sources, often set by the government to encourage the use of clean energy in designated areas for energy production. The amount of this tariff for different technologies is determined according to the conditions of energy resources in the country, government policy, the level of maturity of technologies, and other issues. FIT values for solar photovoltaic, wind, nuclear, and biomass in Jiangsu are calculated using methods in [68,69,70,71], respectively.

3.8. Carbon Dioxide ( C O 2 ) Emission

Carbon dioxide emissions are one of the most important criteria when selecting the best clean energy option and evaluating the sustainability of renewable energy sources. Although energy systems powered by renewable energy sources such as solar and wind do not emit any carbon dioxide during the power generation process, the manufacturing and installation processes of these technologies, as well as the disposal or recycling of equipment after the end of their lifetime, will be accompanied by greenhouse gas emissions. Therefore, in fact, this measure indicates the amount of carbon dioxide emissions in the life cycle of each of the clean energy options. Carbon dioxide emission values for solar photovoltaic, wind and biomass technologies have been calculated by [64] and for nuclear by [72].

3.9. Land Use

The required land is obtained by biomass energy in Jiangsu according to [70,73]. Based on those findings, the land needed for solar photovoltaics and wind energy could be quantified with respect to [64]. Additionally, since there is only one nuclear power plant in Jiangsu, the required land is calculated according to the data on the nuclear company’s website [74].

3.10. Water Consumption

The water consumption index indicates the amount of water that is consumed and wasted during the production of each unit of energy in different technologies. Water consumption is one of the most important parameters for the sustainability of energy systems; for this reason, it is necessary to consider this indicator when deciding on the choice of clean power generation technology. Water consumption values for different options were obtained from [66].

3.11. Job Creation

Due to the population density of the region and its economic condition, creating new jobs is also important for Jiangsu. The values of this criterion are calculated according to [75,76,77].

3.12. 2050 Installed Capacity Projection

The installed capacity projection for 2050 for each of the clean energy options in Jiangsu province is based on a study conducted in [33]. In this study, the installed capacity projection for 2050 is based on an ambitious policy scenario to move towards a sustainable energy path that will lead to a major improvement in the efficiency of Jiangsu’s energy system. It should be noted that the values reported for this criterion are subject to the full use of renewable energy sources that can be used in Jiangsu province.
Obviously, other criteria like environmental impacts are necessary for Jiangsu. For instance, birds can be damaged with wind turbines, leakage of toxic substances can adversely influence the marine life balance, and the utilization of biomass energy may cause food-related safety problems. However, due to the fact that statistical data are scarce and in some cases inaccessible, other possible influential criteria have not been considered in this study.
Table 5 summarizes the values for each clean energy solution according to each criterion. Each criterion has a different unit, so it is necessary to perform normalization before performing the evaluation.

4. Results and Discussion

The aim of this study is to select the optimal alternative among the four clean energy technologies selected for energy production in Jiangsu province, China as evaluated by 12 criteria. To do so, the Shannon entropy method is used to calculate the criteria weight and then five widely used MCDM methods (SAW, TOPSIS, ELECTRE, VIKOR, and COPRAS) are used and the results of each are discussed.

4.1. Evaluation Criteria Weights

Here, the Shannon entropy method is used to calculate the weights of the criteria in all five methods. We calculate the weight for each criterion using the available decision matrix (Table 5). The results are the summarized in Table 6.
In Table 5, the third column represents the criteria weights. As can be seen, the maximum calculated weight is associated with the land use criterion with a value of 0.2734 because dispersion in the values of this criterion is high. After that, water consumption, job creation, 2050 projection installed capacity, and CO2 emission criteria have the highest dispersion and maximum impact, respectively.

4.2. SAW Method Ranking

In the SAW method, the calculations are carried out directly and simply. The criteria weight matrix is used to calculate the normalized matrix. For this purpose, the normalized matrix is calculated linearly (Table 7). Finally, by multiplying the linear normalized matrix by the weight matrix, the final matrix that represents the ranking of the alternatives is obtained. According to Table 8, the ranking is as follows:
Solar PV > Wind > Nuclear > Biomass.
Table 7. The linear normalized values of the decision matrix.
CriterionA1A2A3A4
C1110.33330.5000
C20.75000.50000.25001
C30.425010.82500.7500
C40.41670.333310.5000
C50.720010.63160.7499
C60.14520.10930.35051
C70.38170.963410.5597
C80.56250.900010.2000
C910.10.13760.0100
C100.500010.00200.0034
C1110.20240.16670.2500
C120.214310.14290.4286
Table 8. Ranking the alternatives by the SAW method.
TechnologyA1A2A3A4
Values0.66110.55620.26670.2574
Outranking1234

4.3. TOPSIS Method Ranking

In the TOPSIS method, the weights calculated for the criteria in the previous section are used. In this method, the norm method is used to normalize the decision matrix and the normalized decision matrix can be seen in Table 9. Then, by obtaining the weighted normalized matrix, the positive ideal solution ( A + ) and the negative ideal solution ( A ) are determined, which are illustrated in Table 10.
Finally, by calculating the distance of every alternative to the criteria from positive to negative ideal solution and calculating the closeness index to the ideal solution, the ranking of the alternatives is conducted by the TOPSIS method. According to Table 11, the ranking is:
Solar PV > Wind > Nuclear > Biomass.
Table 11. Ranking alternatives by the TOPSIS method.
A1A2A3A4
Values0.82090.76970.53310.2536
Outranking1234

4.4. ELECTRE Method Ranking

In ELECTRE ranking, normalizing is used as in the TOPSIS method. Similar to the TOPSIS method (Table 9). First, the weighted normalized matrix ( V ) is calculated and then the concordance ( S k , l ) and discordance sets ( D k , l ) are determined. Then, with the help of the specified sets, one creates the concordance matrix ( I ) and the discordance matrix ( N I ) in the form of matrices (Equations (29) and (30)). In the following, the threshold values for concordance and discordance matrices are obtained by applying Equations (22) and (25), where I ¯ = 0.5030 and N I ¯ = 0.6530 . Finally, by means of Equations (23), (24), (26) and (27), I and N I are converted into a revised concordance matrix ( H ) and a revised discordance matrix ( G ) and by multiplying every element of matrix H by elements of matrix G , the revised total matrix ( F ) is obtained using Equation (31).
I = [ 0 . 5560 0 . 7718 0 . 7230 0 . 4803 0 . 5122 0 . 7537 0 . 2282 0 . 4878 0 . 4243 0 . 2770 0 . 2463 0 . 5757 ]
N I = [ 0 . 8035 0 . 1307 0 . 1430 1 0 . 2038 0 . 2179 1 1 0 . 3374 1 1 1 ]
F = [ 0 1 1 0 1 1 0 0 0 0 0 0 ]
According to the matrix, the final ranking result obtained from this method shows that the optimal alternatives for Jiangsu are Solar PV and Wind, which are superior to the other alternatives with a double domination.

4.5. VIKOR Method Ranking

When ranking the alternatives by the VIKOR method, the calculated weights for the criteria (according to Table 6) are used. The values of the positive ideal solution and the negative ideal solution are determined according to Equations (30) and (31). The values of the positive ideal solution f j * will be the largest value for the positive effect criteria and the lowest value for the negative effect criteria. Additionally, the values of the negative ideal solution ( f j ) will be the smallest value for the positive effect criteria and the largest value for the negative effect criteria. Based on this, Table 12 shows the vectors f j * and f j for seven different criteria in this study. Finally, utilizing Equations (32)–(34) the values of R , S , and Q are calculated for each alternative, the results of which are listed in Table 13.

4.6. COPRAS Method Ranking

In the COPRAS method, the normalization of the decision matrix is different from that of the other methods presented in this study. By applying Equation (35) to the initial decision matrix, the normalized decision matrix is obtained according to Table 14. Then, by multiplying the diameter matrix of the criteria weights ( W n × n ) in the normalized decision matrix ( N m × n ), the weighted normalized matrix ( V m × n ) is calculated, which is given in Table 15. With the balanced normalized matrix, the sum of the total balanced normalized values for the positive ( S i + ) and negative ( S i ) criteria for each of the clean energy options is calculated and can be seen in the second and third columns of Table 15, respectively. Finally, to calculate the relative priority for each of the options based on Equation (39), the first the parameter S m i n = 0.0626 is determined and then Q i and the efficiency Q i are calculated for all four clean energy options and are summarized in the 4th and 5th columns of Table 16. As can be seen in the ranking of options using the COPRAS method, the best option is solar photovoltaic and the other options are prioritized as follows:
Solar PV > Wind > Nuclear > Biomass.
Table 14. Normalized values of the initial decision matrix in the COPRAS method.
CriterionA1A2A3A4
C10.14290.14290.42860.2857
C20.30000.20000.10000.4000
C30.14170.33330.27500.2500
C40.18520.14810.44440.2222
C50.26180.18850.29840.2513
C60.34620.46010.14350.0503
C70.40650.16110.15520.2772
C80.2000.12500.11250.5625
C90.00850.08450.06140.8455
C100.00250.00130.63050.3657
C110.61760.12500.10290.1544
C120.12000.56000.08000.2400
Table 15. Weighted normalized values of the initial decision matrix in the COPRAS method.
CriterionA1A2A3A4
C10.00520.00520.01550.0104
C20.01060.00710.00350.0141
C30.00200.00460.00380.0034
C40.00590.00470.01420.0071
C50.00110.00080.00130.0011
C60.02680.03550.01110.0039
C70.01100.00440.00420.0075
C80.01560.00970.00880.0439
C90.00230.02310.01680.2312
C100.00060.00030.14730.0855
C110.06280.01270.01050.0157
C120.01050.04880.00700.0209
Table 16. Calculated values of different parameters of the COPRAS method in order to prioritize clean energy alternatives.
Alternative S i + S i Q i   U i   Rank
A10.09170.06260.41481001
A20.07790.07910.333580.412
A30.03900.20500.137633.173
A40.06130.38340.114027.494

4.7. Comparing Results

In the present study we used five widely used MCDM methods (SAW, TOPSIS, ELECTRE, VIKOR and COPRAS) to evaluate four clean energy alternatives using 12 different criteria for Jiangsu province in China. The results obtained by the various methods are compared with the results obtained from [4] in Table 17. In [4], two methods, ordered weighting averaging (OWA) and Choquet integral, were used in the fuzzy environment. In both, solar PV is the preferred alternative and wind is in second place. However, the biomass and nuclear alternatives used in both methods are in different positions. In this study, five widely used MCDM methods are used to evaluate the ranking. According to the results listed in Table 17, the ranking obtained with the SAW, TOPSIS, VIKOR, and COPRAS methods is:
Solar PV > Wind > Nuclear > Biomass.
The ranking of clean energy options with the ELECTRE method is:
Solar PV > Wind> Biomass = Nuclear.
This indicates the same priority of Biomass and Nuclear, both of which are in the third rank. This shows that ranking based on the extracted decision matrix is highly reliable, and a decision maker can make a decision with complete confidence according to that priority.

5. Sensitivity Analysis

In the previous sections, the weights of the criteria are calculated according to the data extracted from the relevant references. Since the criteria weights directly affect the ranking of the alternatives, it is necessary to consider variations in the weight of the criteria and how they affect the classification of the options. Therefore, two sensitivity analysis models are considered to show how changes are made in the ranking of alternatives as a result of variations in the weights of the criteria. First, an incremental and decreasing rate of 15%, 30%, and 45% is applied to all criteria and in order to maintain a sum of the weights equal to 1, when the weight of one criterion increases/decreases, the rest of the weights of the criteria must decrease/increase proportionally. In order to obtain higher-precision calculations and to save time, the developed code in MATLAB software was used and the obtained sensitivity analysis outputs are demonstrated in Figure 12. To report changes in the performance value of every clean energy alternative as a result of variations in the weight of the criteria, the TOPSIS method is used. As can be seen in Figure 12, the majority of the changes occurred in the land use (C9) criterion, in which biomass is the most sensitive alternative. This means that by changing the weight of the C9 criterion, the performance of the options (especially biomass) changes significantly compared to other criteria. Based on the diagram of the C9 criterion, it is clear that as the weight of this criterion decreases, the performance of the biomass option increases significantly, while other options, especially nuclear ones, have an inverse relationship with biomass. Meanwhile, increasing the weighting of the C9 criterion increases their performance. The large changes in the C9 criterion are due to its higher weight, which shows its crucial role in the performance of clean energy options.
After C9, water consumption (C10) and O&M costs (C6) are more sensitive than the other criteria. According to the chart related to the C10 criterion, it is clear that the inverse of the nuclear option has a great effect on the weight changes of this index, the performance of which decreases significantly with an increase in the weight of the C10 criterion. Meanwhile other clean energy options, especially biomass, directly improve their performance by increasing the weight of C10. However, as can be seen in Figure 12F, C6, it is only biomass that has a significant direct impact on changes in the weight of this index. In addition, it should be noted that job creation criteria (C11) and installed capacity projection for 2050 (C12) in the next categories are criteria that are sensitive to weight changes. In C11, wind energy is the most sensitive option to weight changes of this criterion, and its performance is inversely related to C11 weight changes. Finally, C12 is included in the list of sensitive criteria where solar photovoltaic is the most effective option against changes in its weight. Its performance is inversely related to changes in the weight of this criterion. In contrast, changes in the weight of investment cost measures (C5), efficiency (C3), FIT (C7), TRL (C1), and lifetime (C4) have little effect on the performance of clean energy options. This is due to the low weight of these criteria in the decision-making process. Changes in the weight of the two criteria of CO2 emission (C8) and safety (C2) also have little effect on the performance of the options, except for biomass, which, unlike other clean energy options, is inversely related to the change in weight of the C8 benchmark. Additionally, according to the C2 criterion diagram, it is clear that biomass has a positive effect on the weight of this criterion. In summary, it could be said that by applying the weight change rates to criteria with lower weight, less effect on the performance of alternatives is experienced.
Second, there are five different scenarios for assessing the effect of criteria weight variations on ranking clean energy alternatives, which are listed in Table 18. In the first scenario, the significance of all aspects is assumed to be constant, and the other four scenarios focus on technical, economic, environmental, and social-policy aspects, respectively. The five defined scenarios are evaluated by 12 criteria using the five methods described in this study (SAW, TOPSIS, ELECTRE, VIKOR, and CORPAS). To be precise in calculating and saving time, the code developed in MATLAB software was used. The results of ranking based on scenarios and various methods are illustrated in Figure 13. As expected, the results of ranking are different for every scenario and the biggest variations in prioritizing occurred for the biomass alternative, which is highly sensitive to criteria weight variations.
In the first scenario, where all four technical, economic, environmental, and socio-political dimensions are given the same weight, the wind energy option in the four decision-making methods of SAW, ELECTRE, VIKOR, and COPRAS is chosen as the most attractive option. According to the TOPSIS method, solar photovoltaic is the most attractive option. In this scenario, solar photovoltaic is the most common option in the second place. However, the biomass and nuclear options have different positions in different MCDM methods.
From a technical point of view, the ranking of options with the SAW method is similar to the first scenario, but the ranking with other MCDM methods is different. With the TOPSIS and COPRAS methods, the positions of biomass and nuclear options have been swapped, and with the ELECTRE method solar photovoltaic and biomass are in joint first place, overcoming other options. However, with the VIKOR method, a completely different ranking is obtained from other methods, and biomass is the superior option according to this method.
In the third scenario, which focuses on the economic perspective of the options, the most frequent option in the first priority is wind energy. However, in the TOPSIS and VIKOR methods, the nuclear and biomass methods have been selected as attractive options. It is noteworthy that among the clean energy options, solar photovoltaic is the third or fourth priority using various methods (except for the COPRAS method, where A1 is in second place). That is, from an economic point of view, solar photovoltaic will not be an attractive option for investors.
In the fourth scenario, the emphasis is on minimizing the negative environmental impacts. The results depict that wind energy is the best choice, followed by solar photovoltaic. Based on the results obtained from the ELECTRE method, two options of solar photovoltaic and wind with the same priority are in first place and nuclear and biomass are in second place with the same priority. From an environmental point of view, it is illustrated that biomass has the worst performance and that nuclear is in third place.
In the last scenario, wind energy is the preferred option with the three methods of SAW, ELECTRE, and COPRAS, while with the other two methods, TOPSIS and VIKOR, solar photovoltaic is the preferred option. In this scenario, biomass overtakes nuclear and is in third place due to nuclear being less socially acceptable than biomass.
As described, different rankings have been obtained from the different perspectives defined in the five scenarios presented. Depending on the preferences and priorities that a decision-maker has, the best clean energy option will be selected based on the proposed scenarios. However, if an optimal decision is to be made considering all the various technical, economic, environmental, and socio-political aspects, a single overall ranking among the clean energy options considered for Jiangsu province in China can be applied.
For this purpose, an aggregation approach is utilized to obtain a comprehensive ranking considering the sensitivity analysis and MCDM models. In the aggregation approach, the best choice receives a k score (for example, 4 score) for being the first choice, k-1 score (3 score) for being the second choice, and so on. The alternative with the greatest number of points is the best choice. Therefore, the ranking results after applying the aggregation method are shown in Figure 13F.

6. Conclusions

The evaluation of clean energy sources is of particular importance for governments because making the right decision provides opportunities for new economic markets and job creation. For this purpose, in this article, four clean energy alternatives suitable for Jiangsu province, including solar photovoltaic, wind, nuclear, and biomass, were evaluated using the 12 criteria of technology readiness level (TRL), safety, efficiency, lifetime, investment cost, O&M costs, feed-in-tariff (FIT), carbon dioxide emission, land use, water consumption, job creation, and 2050 projection installed capacity. The results of implementing the five extensively used MCDM methods of SAW, TOPSIS, ELECTRE, VIKOR, and COPRAS to evaluate and rank these clean energy alternatives, as well as perform a two-stage sensitivity analysis, are summarized as follows:
(1) In this study, the environmental aspect has the highest weight and the greatest impact on the evaluation of options with a value of 0.5851, with land use criteria (C9) and water consumption (C10) having the highest weight and the most important role in evaluating the options in this category with values of 0.2734 and 0.2337, respectively.
(2) The ranking of alternatives based on the initial decision matrix was obtained using the four methods of SAW, TOPSIS, VIKOR, and COPRAS as solar PV > wind > nuclear > biomass. When using the ELECTRE method, the ranking is the same but the nuclear and biomass both have the same score and neither dominates the other.
(3) Given that the prioritization of clean energy options through the five different MCDM methods used in this study is on the basis of the same decision matrix extracted from the references, the presented rankings are highly reliable.
(4) Solar photovoltaic and wind energy are the top two alternatives in the study, so a combination of these two sources of clean energy increases efficiency and technological benefits, as well as reducing costs.
(5) Land use among all criteria has the highest weight and the highest sensitivity to the rate of change of weight, so it is possible to achieve significant improvements in their overall performance by making minor positive changes in land use.
(6) The investment cost criterion in this study has the lowest weight and the lowest sensitivity to weight change rates; therefore, it is possible to make significant improvements in their overall performance by applying improvements in other aspects of clean energy alternatives, especially environmental and social aspects.
(7) By defining five different scenarios and presenting the final ranking resulting from the five MCDM methods used in this study, the decision maker can find the proper ranking with respect to the special conditions and the relative importance of technological, economic, environmental, and social-policy aspects (Figure 13).
Finally, future work may include a comparative study of the use of different weighted methods—either subjective or objective methods. In addition, adding more appropriate options to the decision-making problem can make the work more comprehensive and improve the decision-making process. The use of hybrid multi-criteria decision-making methods in such studies will also improve the scientific content of the work and increase the attractiveness of the project.

Author Contributions

Conceptualization, S.K.E., M.H.A. and A.M.; methodology, S.K.E. and M.H.A.; software, M.S. (Milad Sadeghzadeh) and A.M.; validation, P.A. and M.S. (Milad Sadeghzadeh); formal analysis, M.H.A. and P.A.; in-vestigation, M.H.A., M.S. (Milad Sadeghzadeh) and M.S. (Mohsen Sharifpur); resources, S.K.E. and L.C.; data curation, S.K.E. and M.S. (Milad Sadeghzadeh); writing—original draft preparation, S.K.E.; writing—review and editing, M.H.A., M.S. (Mohsen Sharifpur), L.C. and P.A.; visualization, S.K.E. and M.S. (Mohsen Sharifpur); supervision, M.H.A., M.S. (Mohsen Sharifpur) and L.C. All authors have read and agreed to the published version of the manuscript.

Funding

This research received no external funding.

Institutional Review Board Statement

Not applicable.

Informed Consent Statement

Not applicable.

Data Availability Statement

Not applicable.

Conflicts of Interest

The authors declare no conflict of interest.

References

  1. Statistical Review of World Energy (2021), 70th ed. 2021. Available online: https://www.bp.com (accessed on 9 January 2022).
  2. Sahraei-Ardakani, M.; Blumsack, S.; Kleit, A. Estimating zonal electricity supply curves in transmission-constrained electricity markets. Energy 2015, 80, 10–19. [Google Scholar] [CrossRef]
  3. Yuan, J.; Xu, Y.; Zhang, X.; Hu, Z.; Xu, M. China’s 2020 clean energy target: Consistency, pathways and policy implications. Energy Policy 2014, 65, 692–700. [Google Scholar] [CrossRef]
  4. Zhang, L.; Zhou, P.; Newton, S.; Fang, J.; Zhou, D.; Zhang, L. Evaluating clean energy alternatives for Jiangsu, China: An improved multi-criteria decision-making method. Energy 2015, 90, 953–964. [Google Scholar] [CrossRef]
  5. Mabin, V.; Beattie, M. A Practical Guide to Multi-Criteria Decision Analysis, 5th ed.; Victoria University of Wellington: Wellington, New Zealand, 2006. [Google Scholar]
  6. Köksalan, M.M.; Wallenius, J.; Zionts, S. Multi Criteria Decision-Making from Early History to the 21st Century; World Scientific: Singapore, 2011; pp. 1–16. [Google Scholar]
  7. Gregory, R.; Failing, L.; Harstone, M.; Long, G.; McDaniels, T.; Ohlson, D. Structured Decision-Making: A Practical Guide to Environmental Management Choices; John Wiley & Sons: Hoboken, NJ, USA, 2012. [Google Scholar]
  8. Thokala, P.; Devlin, N.; Marsh, K.; Baltussen, R.; Boysen, M.; Kalo, Z.; Longrenn, T.; Mussen, F.; Peacock, S.; Watkins, J.; et al. Multiple Criteria Decision Analysis for Health Care Decision Making—An Introduction: Report 1 of the ISP—MCDA Emerging Good Practices Task Force. Value Health 2016, 19, 1–13. [Google Scholar] [CrossRef] [Green Version]
  9. Hayashi, K. Multicriteria analysis for agricultural resource management: A critical survey and future perspectives. Eur. J. Oper. Res. 2000, 122, 486–500. [Google Scholar] [CrossRef]
  10. Tsoutsos, T.; Drandaki, M.; Frantzeskaki, N.; Iosifidis, E.; Kiosses, I. Sustainable energy planning by using multi-criteria analysis application in the island of Crete. Energy Policy 2009, 37, 1587–1600. [Google Scholar] [CrossRef]
  11. Mulliner, E.; Malys, N.; Maliene, V. Comparative analysis of MCDM methods for the assessment of sustainable housing affordability. Omega 2016, 59 Pt B, 146–156. [Google Scholar] [CrossRef]
  12. Dimić, V.; Milošević, M.; Milošević, D.; Stević, D. Adjustable Model of Renewable Energy Projects for Sustainable Development: A Case Study of the Nisava District in Serbia. Sustainability 2018, 10, 775. [Google Scholar] [CrossRef] [Green Version]
  13. Altintas, K.; Vayvay, O.; Apak, S.; Cobanoglu, E. An Extended GRA Method Integrated with Fuzzy AHP to Construct a Multidimensional Index for Ranking Overall Energy Sustainability Performances. Sustainability 2020, 12, 1602. [Google Scholar] [CrossRef] [Green Version]
  14. Ghimire, L.P.; Kim, Y. An analysis on barriers to renewable energy development in the context of Nepal using AHP. Renew. Energy 2018, 129, 446–456. [Google Scholar] [CrossRef]
  15. Ukoba, M.O.; Diemuodeke, O.E.; Alghassab, M.; Njoku, H.I.; Imran, M.; Khan, Z.A. Composite Multi-Criteria Decision Analysis for Optimization of Hybrid Renewable Energy Systems for Geopolitical Zones in Nigeria. Sustainability 2020, 12, 5732. [Google Scholar] [CrossRef]
  16. Şengül, Ü.; Eren, M.; Eslamian Shiraz, S.; Gezder, V.; Şengül, A.B. Fuzzy TOPSIS method for ranking RE supply systems in Turkey. Renew. Energy 2015, 75, 617–625. [Google Scholar] [CrossRef]
  17. Erdin, C.; Ozkaya, G. Correction: Erdin, C. and Ozkaya, G. Turkey’s 2023 Energy Strategies and Investment Opportunities for Renewable Energy Sources: Site Selection Based on ELECTRE. Sustainability 2019, 11, 2136. [Google Scholar] [CrossRef] [Green Version]
  18. Witt, T.; Klumpp, M. Multi-Period Multi-Criteria Decision Making under Uncertainty: A Renewable Energy Transition Case from Germany. Sustainability 2021, 13, 6300. [Google Scholar] [CrossRef]
  19. Peng, H.; Shen, K.; He, S.; Zhang, H.; Wang, J. Investment risk evaluation for new energy resources: An integrated decision support model based on regret theory and ELECTRE III. Energy Convers. Manag. 2019, 183, 332–348. [Google Scholar] [CrossRef]
  20. Lee, H.-C.; Chang, C.-T. Comparative analysis of MCDM methods for ranking RE sources in Taiwan. Renew. Sustain. Energy Rev. 2018, 92, 883–896. [Google Scholar] [CrossRef]
  21. Yilan, G.; Kadirgan, M.N.; Çiftçioğlu, G.A. Analysis of electricity generation options for sustainable energy decision making: The case of Turkey. Renew. Energy 2020, 146, 519–529. [Google Scholar] [CrossRef]
  22. Karunathilake, H.; Hewage, K.; Merida, W.; Sadiq, R. RE selection for net-zero energy communities: Life-cycle based decision making under uncertainty. Renew. Energy 2019, 130, 558–573. [Google Scholar] [CrossRef]
  23. Katal, F.; Fazelpour, F. Multi-criteria evaluation and priority analysis of different types of existing power plants in Iran: An optimized energy planning system. Renew. Energy 2018, 120, 163–177. [Google Scholar] [CrossRef]
  24. Lee, A.H.I.; Kang, H.-Y.; Liou, Y.-J. A Hybrid Multiple-Criteria Decision-Making Approach for Photovoltaic Solar Plant Location Selection. Sustainability 2017, 9, 184. [Google Scholar] [CrossRef]
  25. Zhao, H.; Zhao, H.; Guo, S. Comprehensive Performance Evaluation of Electricity Grid Corporations Employing a Novel MCDM Model. Sustainability 2018, 10, 2130. [Google Scholar] [CrossRef] [Green Version]
  26. Štreimikienė, D.; Šliogerienė, J.; Turskis, Z. Multi-criteria analysis of electricity generation technologies in Lithuania. Renew. Energy 2016, 85, 148–156. [Google Scholar] [CrossRef]
  27. Yücenur, G.N.; Çaylak, Ş.; Gönül, G.; Postalcıoğlu, M. An integrated solution with SWARA&COPRAS methods in RE production: City selection for biogas facility. Renew. Energy 2020, 145, 2587–2597. [Google Scholar]
  28. Cayir Ervural, B.; Evren, R.; Delen, D. A multi-objective decision-making approach for sustainable energy investment planning. Renew. Energy 2018, 126, 387–402. [Google Scholar] [CrossRef]
  29. Ramezanzade, M.; Karimi, H.; Almutairi, K.; Xuan, H.A.; Saebi, J.; Mostafaeipour, A.; Techato, K. Implementing MCDM Techniques for Ranking Renewable Energy Projects under Fuzzy Environment: A Case Study. Sustainability 2021, 13, 12858. [Google Scholar] [CrossRef]
  30. Wang, Z.; Xu, G.; Wang, H.; Ren, J. Distributed energy system for sustainability transition: A comprehensive assessment under uncertainties based on interval multi-criteria decision-making method by coupling interval DEMATEL and interval VIKOR. Energy 2019, 169, 750–761. [Google Scholar] [CrossRef]
  31. Zhang, L.; Zhou, D.-Q.; Zhou, P.; Chen, Q.-T. Modelling policy decision of sustainable energy strategies for Nanjing city: A fuzzy integral approach. Renew. Energy 2014, 62, 197–203. [Google Scholar] [CrossRef]
  32. Kong, Y.; Wang, J.; Kong, Z.; Song, F.; Liu, Z.; Wei, C. Small hydropower in China: The survey and sustainable future. Renew. Sustain. Energy Rev. 2015, 48, 425–433. [Google Scholar] [CrossRef]
  33. Hong, L.; Lund, H.; Mathiesen, B.V.; Moller, B. 2050 pathway to an active renewable € energy scenario for Jiangsu province. Energy Policy 2013, 53, 267–278. [Google Scholar] [CrossRef] [Green Version]
  34. Franco-Chinese Exchange Committee. Available online: https://cefc-paris.fr/2014/11/18/fiche-jiangsu/ (accessed on 18 January 2022). (In Chinese).
  35. Mourmouris, J.C.; Potolias, C. A multi-criteria methodology for energy planning and developing RE sources at a regional level: A case study Thassos, Greece. Energy Policy 2013, 52, 522–530. [Google Scholar] [CrossRef]
  36. Liu, G. Development of a general sustainability indicator for RE systems: A review. Renew. Sustain. Energy. Rev. 2014, 31, 611–621. [Google Scholar] [CrossRef]
  37. Zopounidis, C.; Doumpos, M. Multiple Criteria Decision Making—Applications in Management and Engineering; Springer: Berlin/Heidelberg, Germany, 2017. [Google Scholar]
  38. Wang, J.J.; Jing, Y.-Y.; Zhang, C.-F.; Zhao, J.-H. Review on multi-criteria decision analysis aid in sustainable energy decision-making. Renew. Sustain. Energy Rev. 2009, 13, 2263–2278. [Google Scholar] [CrossRef]
  39. Hwang, C.L.; Yoon, K. Multiple Attribute Decision Making: Methods and Applications: A State-of-the-Art Survey; Springer Science & Business Media: Berlin/Heidelberg, Germany, 2012; Volume 186. [Google Scholar]
  40. Siksnelyte-Butkiene, I.; Zavadskas, E.K.; Streimikiene, D. Multi-Criteria Decision-Making (MCDM) for the Assessment of Renewable Energy Technologies in a Household: A Review. Energies 2020, 13, 1164. [Google Scholar] [CrossRef] [Green Version]
  41. Siksnelyte, I.; Zavadskas, E.K.; Streimikiene, D.; Sharma, D. An Overview of Multi-Criteria Decision-Making Methods in Dealing with Sustainable Energy Development Issues. Energies 2018, 11, 2754. [Google Scholar] [CrossRef] [Green Version]
  42. San Cristóbal, J.R. Multi Criteria Analysis in the Renewable Energy Industry; Springer: London, UK, 2012. [Google Scholar]
  43. Polatidis, H.; Haralambopoulos, D.A.; Munda, G.; Vreeker, R. Selecting an Appropriate Multi-Criteria Decision Analysis Technique for Renewable Energy Planning. Energy Sources Part B Econ. Plan. Policy 2006, 1, 181–193. [Google Scholar] [CrossRef]
  44. Fishburn, P.C. (Ed.) Letter to the editor—Additive utilities with incomplete product set: Applications to priorities and assignments. Oper. Res. 1967, 15, 537–542. [Google Scholar] [CrossRef]
  45. Moghimi, M.; Yazdi, M.T. Applying Multi-Criteria Decision-Making (MCDM) Methods for Economic Ranking of Tehran-22 Districts to Establish Financial and Commercial Centers (Case: City of Tehran). Urban Econ. Manag. 2020, 5, 43–55. [Google Scholar] [CrossRef] [Green Version]
  46. Afshari, A.; Mojahed, M.; Yusuff, R.M. Simple additive weighting approach to personnel selection problem. Int. J. Innov. Manag. Technol. 2010, 1, 511–515. [Google Scholar]
  47. Wang, J.-J.; Jing, Y.-Y.; Zhang, C.-F.; Shi, G.-H.; Zhang, X.-T. A fuzzy multi-criteria decision-making model for trigeneration system. Energy Policy 2008, 36, 3823–3832. [Google Scholar] [CrossRef]
  48. Hwang, C.L.; Yoon, K. Multiple Attribute Decision Making-Methods and Application: A State-of-the-art Survey; Springer: New York, NY, USA, 1981. [Google Scholar]
  49. Chitsaz, N.; Banihabib, M.E. Comparison of different multi criteria decision-making models in prioritizing flood management alternatives. Water Resour. Manag. 2015, 29, 2503–2525. [Google Scholar] [CrossRef]
  50. Benayoun, R.; Roy, B.; Sussman, N. Manual de Reference du Programme Electre; Direction Scientifiques SEMA: Pairs, France, 1966. [Google Scholar]
  51. Roy, B. Classement et choix en presence de points de vue multiples. Methode Electre R.I.R.O 1968, 8, 57–75. [Google Scholar] [CrossRef]
  52. Roy, B. ELECTRE III: Un algorithme de classements fonde sur une representation floue des preference en presence de criteres multiples. Cahiers de CERO 1978, 20, 3–24. [Google Scholar]
  53. Roy, B.; Bertier, P. La Methode ELECTRE II: Une Methode au Media-Planning; North-Holland: Amsterdam, The Netherland, 1973. [Google Scholar]
  54. Yu, P.L. A class of solutions for group decision problems. Manag. Sci. 1973, 19, 936–946. [Google Scholar] [CrossRef]
  55. Zeleny, M. Multiple Criteria Decision Making; Mc-Graw-Hill: New York, NY, USA, 1982. [Google Scholar]
  56. Opricovic, S. Multi-Criteria Optimization of Civil Engineering Systems; Faculty of Civil Engineering: Belgrade, Serbia, 1998. [Google Scholar]
  57. Opricovic, S.; Tzeng, G.-H. Multicriteria planning of post-earthquake sustainable reconstruction. Comput.-Aided Civil Infrastruct. Eng. 2002, 17, 211–220. [Google Scholar] [CrossRef]
  58. Shemshadi, A.; Shirazi, H.; Toreihi, M.; Tarokh, M.J. A fuzzy VIKOR method for supplier selection based on entropy measure for objective weighting. Expert Syst. Appl. 2011, 38, 12160–12167. [Google Scholar] [CrossRef]
  59. Zavadskas, E.K.; Kaklauskas, A.; Sarka, V. The new method of multicriteria complex proportional assessment of projects. Technol. Econ. Dev. Econ. 1994, 1, 131–139. [Google Scholar]
  60. Hezera, S.; Gelmez, E.; Özceylan, E. Comparative analysis of TOPSIS, VIKOR and COPRAS methods for the COVID-19 Regional Safety Assessment. J. Infect. Public Health 2021, 14, 775–786. [Google Scholar] [CrossRef]
  61. Podvezko, V. The comparative analysis of MCDA methods SAW and COPRAS. Eng. Econ. 2011, 22, 134–146. [Google Scholar] [CrossRef] [Green Version]
  62. Thiam, D.R. An energy pricing scheme for the diffusion of decentralized renewable technology investment in developing countries. Energy Policy 2011, 39, 4284–4297. [Google Scholar] [CrossRef]
  63. Evans, A.; Strezov, V.; Evans, T.J. Assessment of sustainability indicators for renewable energy technologies. Renew. Sustain. Energy Rev. 2009, 13, 1082–1088. [Google Scholar] [CrossRef]
  64. Du, X.-W. Study on RE Development Strategies: The Comprehensive Volume; China Electric Power Press: Beijing, China, 2008. (In Chinese) [Google Scholar]
  65. Ali, T.; Chiu, Y.-R.; Aghaloo, K.; Jaudat Nahian, A.; Ma, H. Prioritizing the existing power generation technologies in Bangladesh’s clean energy scheme using a hybrid multi-criteria decision-making model. J. Clean. Prod. 2020, 267, 121901. [Google Scholar] [CrossRef]
  66. Khan, I. Sustainability challenges for the south Asia growth quadrangle: A regional electricity generation sustainability assessment. J. Clean. Prod. 2020, 243, 118639. [Google Scholar] [CrossRef]
  67. Wang, Z.-Y.; Ren, D.-M.; Gao, H. RE in China 2012; China Chemical Industry Press: Beijing, China, 2012. (In Chinese) [Google Scholar]
  68. Chinese Energy Development Strategy Research Group. Study on Strategies for China’s Energy Development Part II; Tsinghua University Press: Beijing, China, 2013. (In Chinese) [Google Scholar]
  69. Chinese Energy Development Strategy Research Group. Study on Strategies for China’s Energy Development Part I; Tsinghua University Press: Beijing, China, 2013. (In Chinese) [Google Scholar]
  70. Zhang, Q.; Zhou, D.-Q.; Zhang, L.-B.; Lu, H. The Research of New Energy Industries in China; Science Press: Beijing, China, 2013. (In Chinese) [Google Scholar]
  71. Price Bureau of Jiangsu Province. Trade-in Tariff Released Firstly in 2014 by Jiangsu. Available online: http://www.solarzoom.com/article-54235-1.html (accessed on 28 March 2021). (In Chinese).
  72. Jiang, Z.-Y. Nuclear power development for greenhouse gases emission reduction under climate change. Adv. Clim. Change Res. 2010, 6, 376–380. (In Chinese) [Google Scholar]
  73. News Center of Polar Power. The New Biomass Power Generation Project of Cady Company. Available online: Http://news.bjx.com.cn/html/20120626/369077.shtml (accessed on 28 March 2021). (In Chinese).
  74. Tianwan Nuclear Power Station in Lianyungang, Jiangsu. Available online: http://www.vara.cn/news/phsslxt/8789321.html (accessed on 28 March 2021). (In Chinese).
  75. Moreno, B.; Lopez, A.J. The effect of renewable energy on employment. The case of Asturias (Spain). Renew. Sustain. Energy Rev. 2008, 12, 732–751. [Google Scholar] [CrossRef]
  76. Lehr, U.; Nitsch, J.; Kratzat, M.; Lutz, C.; Edler, D. RE and employment in Germany. Energy Policy 2008, 36, 108–117. [Google Scholar] [CrossRef]
  77. Wei, M.; Patadia, S.; Kammen, D.M. Putting renewables and energy efficiency to work: How many jobs can the clean energy industry generate in the US. Energy Policy 2010, 38, 919–931. [Google Scholar] [CrossRef]
Figure 5. Flowchart of the process of calculating the weights of the criteria by the Shannon entropy method.
Sustainability 14 01403 g005
Figure 6. Flowchart for the implementation of the SAW method.
Sustainability 14 01403 g006
Figure 7. Flowchart of the implementation steps of the TOPSIS method.
Sustainability 14 01403 g007
Figure 8. Flowchart of steps for implementing the ELECTRE method.
Sustainability 14 01403 g008
Figure 9. Ideal compromise solution diagram [58].
Sustainability 14 01403 g009
Figure 10. Flowchart for Implementing the VIKOR method.
Sustainability 14 01403 g010
Figure 11. Flowchart of the implementation steps of the COPRAS method.
Sustainability 14 01403 g011
Figure 12. Performance changes diagrams of (A): C1, (B): C2, (C): C3, (D): C4, (E): C5, (F): C6, (G): C7, (H): C8, (I): C9, (J): C10, (K): C11, and (L): C12 criteria for the rate of change of their weights in the TOPSIS method.
Sustainability 14 01403 g012aSustainability 14 01403 g012b
Figure 13. The results of the final ranking of alternatives using the five MCDM methods of (A) SAW, (B) TOPSIS, (C) ELECTRE, (D) VIKOR, and (E) COPRAS and (F) after applying an aggregation method under five different scenarios.
Sustainability 14 01403 g013aSustainability 14 01403 g013b
Table 1. A summary of the strengths, weaknesses, classification, and complexity of the MCDM methods used in the present study.
MethodClassificationComplexityStrengthsWeaknesses
SAWRatio-based (Scoring) methodVery lowAble to compensate for different criteria. Due to its simple structure, it does not require a complex computer program to implement.Does not work properly with multidimensional problems where the criteria have different units. It is not possible to consider several preferences in this method.
TOPSISDistance-based methodLowEasy to understand the governing rules and the implementation process is straightforward. Both positive and negative ideal solutions are considered in this method.Euclidean distance performance makes no distinction between positive and negative values in calculations. Interaction between criteria is not considered in this method.
ELECTREOutranking methodVery highCan be used for both quantitative and qualitative indicators. Has the ability to take into account uncertainty and ambiguity.Complicated and time consuming calculations. Sometimes cannot determine the optimal option and just leaves out the options with fewer wins to get a better view of the available options.
VIKORDistance-based methodLowAn effective way to begin system design when decision-making preferences are not clear. This method determines the stability intervals in the criteria weights.Does not work well in conflicting situations. Interaction between criteria is not considered in this method.
COPRASRatio-based (Scoring) methodLowApplies the effect of positive and negative criteria separately. It is a solid method and is suitable for evaluating a single alternative.In the case of data diversity, it provides unstable results and may not reflect the true nature of the data. The ranking results will be sensitive to small changes in the data.
Table 2. Alternative values for bias scaling for positive criteria.
QualityVery lowLowModerateHighVery high
Quantity13579
Table 3. Alternative values for bias scaling for negative criteria.
QualityVery highHighModerateLowVery low
Quantity13579
Table 4. Criteria evaluation for Jiangsu’s clean energy options.
AspectCriterionTypeUnitBrief Description
TechnicalTRLNegative---Clean energy technical development evaluation in Jiangsu.
SafetyPositive---Effective clean energy-related risk factor for people.
EfficiencyPositive%Refers to how much input fuel or resources can be converted into useful output.
LifetimePositiveyearThe average expected time that an energy system will be fully operational.
EconomicInvestment costNegativeUSD/kWExpenditure on equipment and installation.
O&M costsNegativeUSD/kWMaintenance cost of an energy system and operational costs, including employees’ salaries and the capital spent for the fuel, products, and services for an energy system.
FITNegativeUSD/kWhCertifying power purchase from renewable technology at a constant tariff during a specified time [62].
Environmental CO 2 EmissionNegativeg/kWh Amount   of   CO 2 emitted to the atmosphere when clean energy is utilized to produce electrical power.
Land useNegativeAcre/TWhLand area needed for the implementation of the technology.
Water consumptionNegativeL/kWhRefers to the amount of water that is lost or evaporated from an energy system that cannot be returned to the source.
Social-policyJob creationPositiveJob-year/GWhCreation of possible job opportunities.
2050 projection installed capacityPositiveGWInstalled capacities of clean energy technologies are projected on the basis of Jiangsu’s exploitable renewable energy resources [63].
Table 5. Initial decision matrix.
CriterionUnit(A1) Solar PV(A2) Wind(A3) Nuclear(A4) Biomass
C1TRL-1132
C2Safety-3214
C3Efficiency%17403330
C4Lifetimeyear25206030
C5Investment costUSD/kW2036146623211955
C6O&M costsUSD/kW19.6926.178.162.86
C7FITUSD/kWh0.17920.0710.06840.1222
C8CO2 emissiong/kWh1610945
C9Land useAcre/TWh2.4424.417.73244
C10Water consumptionL/kWh0.0080.00421.16
C11Job creationJob-year/GWh0.840.170.140.21
C122050 projection installed capacityGW301402060
Table 6. Weighted values of the criteria calculated by the Shannon entropy method.
AspectCriterionCriterion WeightRankAspect WeightRank
Technical(C1) TRL0.036370.11743
(C2) Safety0.03538
(C3) Efficiency0.013811
(C4) Lifetime0.03209
Economic(C5) Investment cost0.0043120.10874
(C6) O&M cost0.07736
(C7) FIT0.027110
Environmental(C8) CO2 emission0.078050.58511
(C9) Land use0.27341
(C10) Water consumption0.23372
Social-policy(C11) Job creation0.101630.18882
(C12) 2050 projection installed capacity0.08724
Table 9. Normalized values of the decision matrix by the norm method.
CriterionA1A2A3A4
C10.25820.25820.77460.5164
C20.54770.36510.18260.7303
C30.27300.64230.52990.4817
C40.33630.26910.80720.4036
C50.51710.37230.58950.4965
C60.58130.77260.24090.0844
C70.75210.29800.28710.5129
C80.32250.20150.18140.9069
C90.00990.09920.07210.9924
C100.00350.00170.86500.5017
C110.94020.19030.15670.2351
C120.19170.89440.12780.3833
Table 10. The vectors of the best ( A + ) and worst ( A ) calculated values.
C1C2C3C4C5C6C7C8C9C10C11C12
A + 0.00940.02580.00890.02580.00160.00650.00780.01410.00270.00040.09560.0780
A 0.02810.00640.00380.00860.00250.05970.02030.07070.27130.20210.01590.0111
Table 12. The values of the positive ideal solution ( f j * ) and negative ideal solution ( f j ) for various criteria.
C1C2C3C4C5C6C7C8C9C10C11C12
( f j * ) 14406014662.860.068492.440.0040.84140
( f j ) 311720232126.170.17924524420.1420
Table 13. Calculated values of benefit   S , regret R , and VIKOR index Q for different clean energy alternatives.
Alternative S R Q Rank
A10.23490.079901
A20.25780.09730.06962
A30.53750.23370.72263
A40.70010.273414
Table 17. Comparison of the results obtained from different MCDM methods used in this study and [4].
Based onMethodRank
1234
[4]Choquet integralSolar PVWindBiomassNuclear
OWASolar PVWindNuclearBiomass
Present StudySAWSolar PVWindNuclearBiomass
TOPSISSolar PVWindNuclearBiomass
ELECTRESolar PVWindBiomass *Nuclear *
VIKORSolar PVWindNuclearBiomass
COPRASSolar PVWindNuclearBiomass
*: Indicates that the ranking is the same.
Table 18. Criteria category weights based on different defined scenarios.
Criteria CategoryScenario 1 (Equal Weight)Scenario 2 (Technical Domination)Scenario 3 (Economic Domination)Scenario 4 (Environmental Domination)Scenario 5 (Social-Policy Domination)
Technical0.250.50.1670.1670.167
Economic0.250.1670.50.1670.167
Environmental0.250.1670.1670.50.167
Social-policy0.250.1670.1670.1670.5
Publisher’s Note: MDPI stays neutral with regard to jurisdictional claims in published maps and institutional affiliations.

