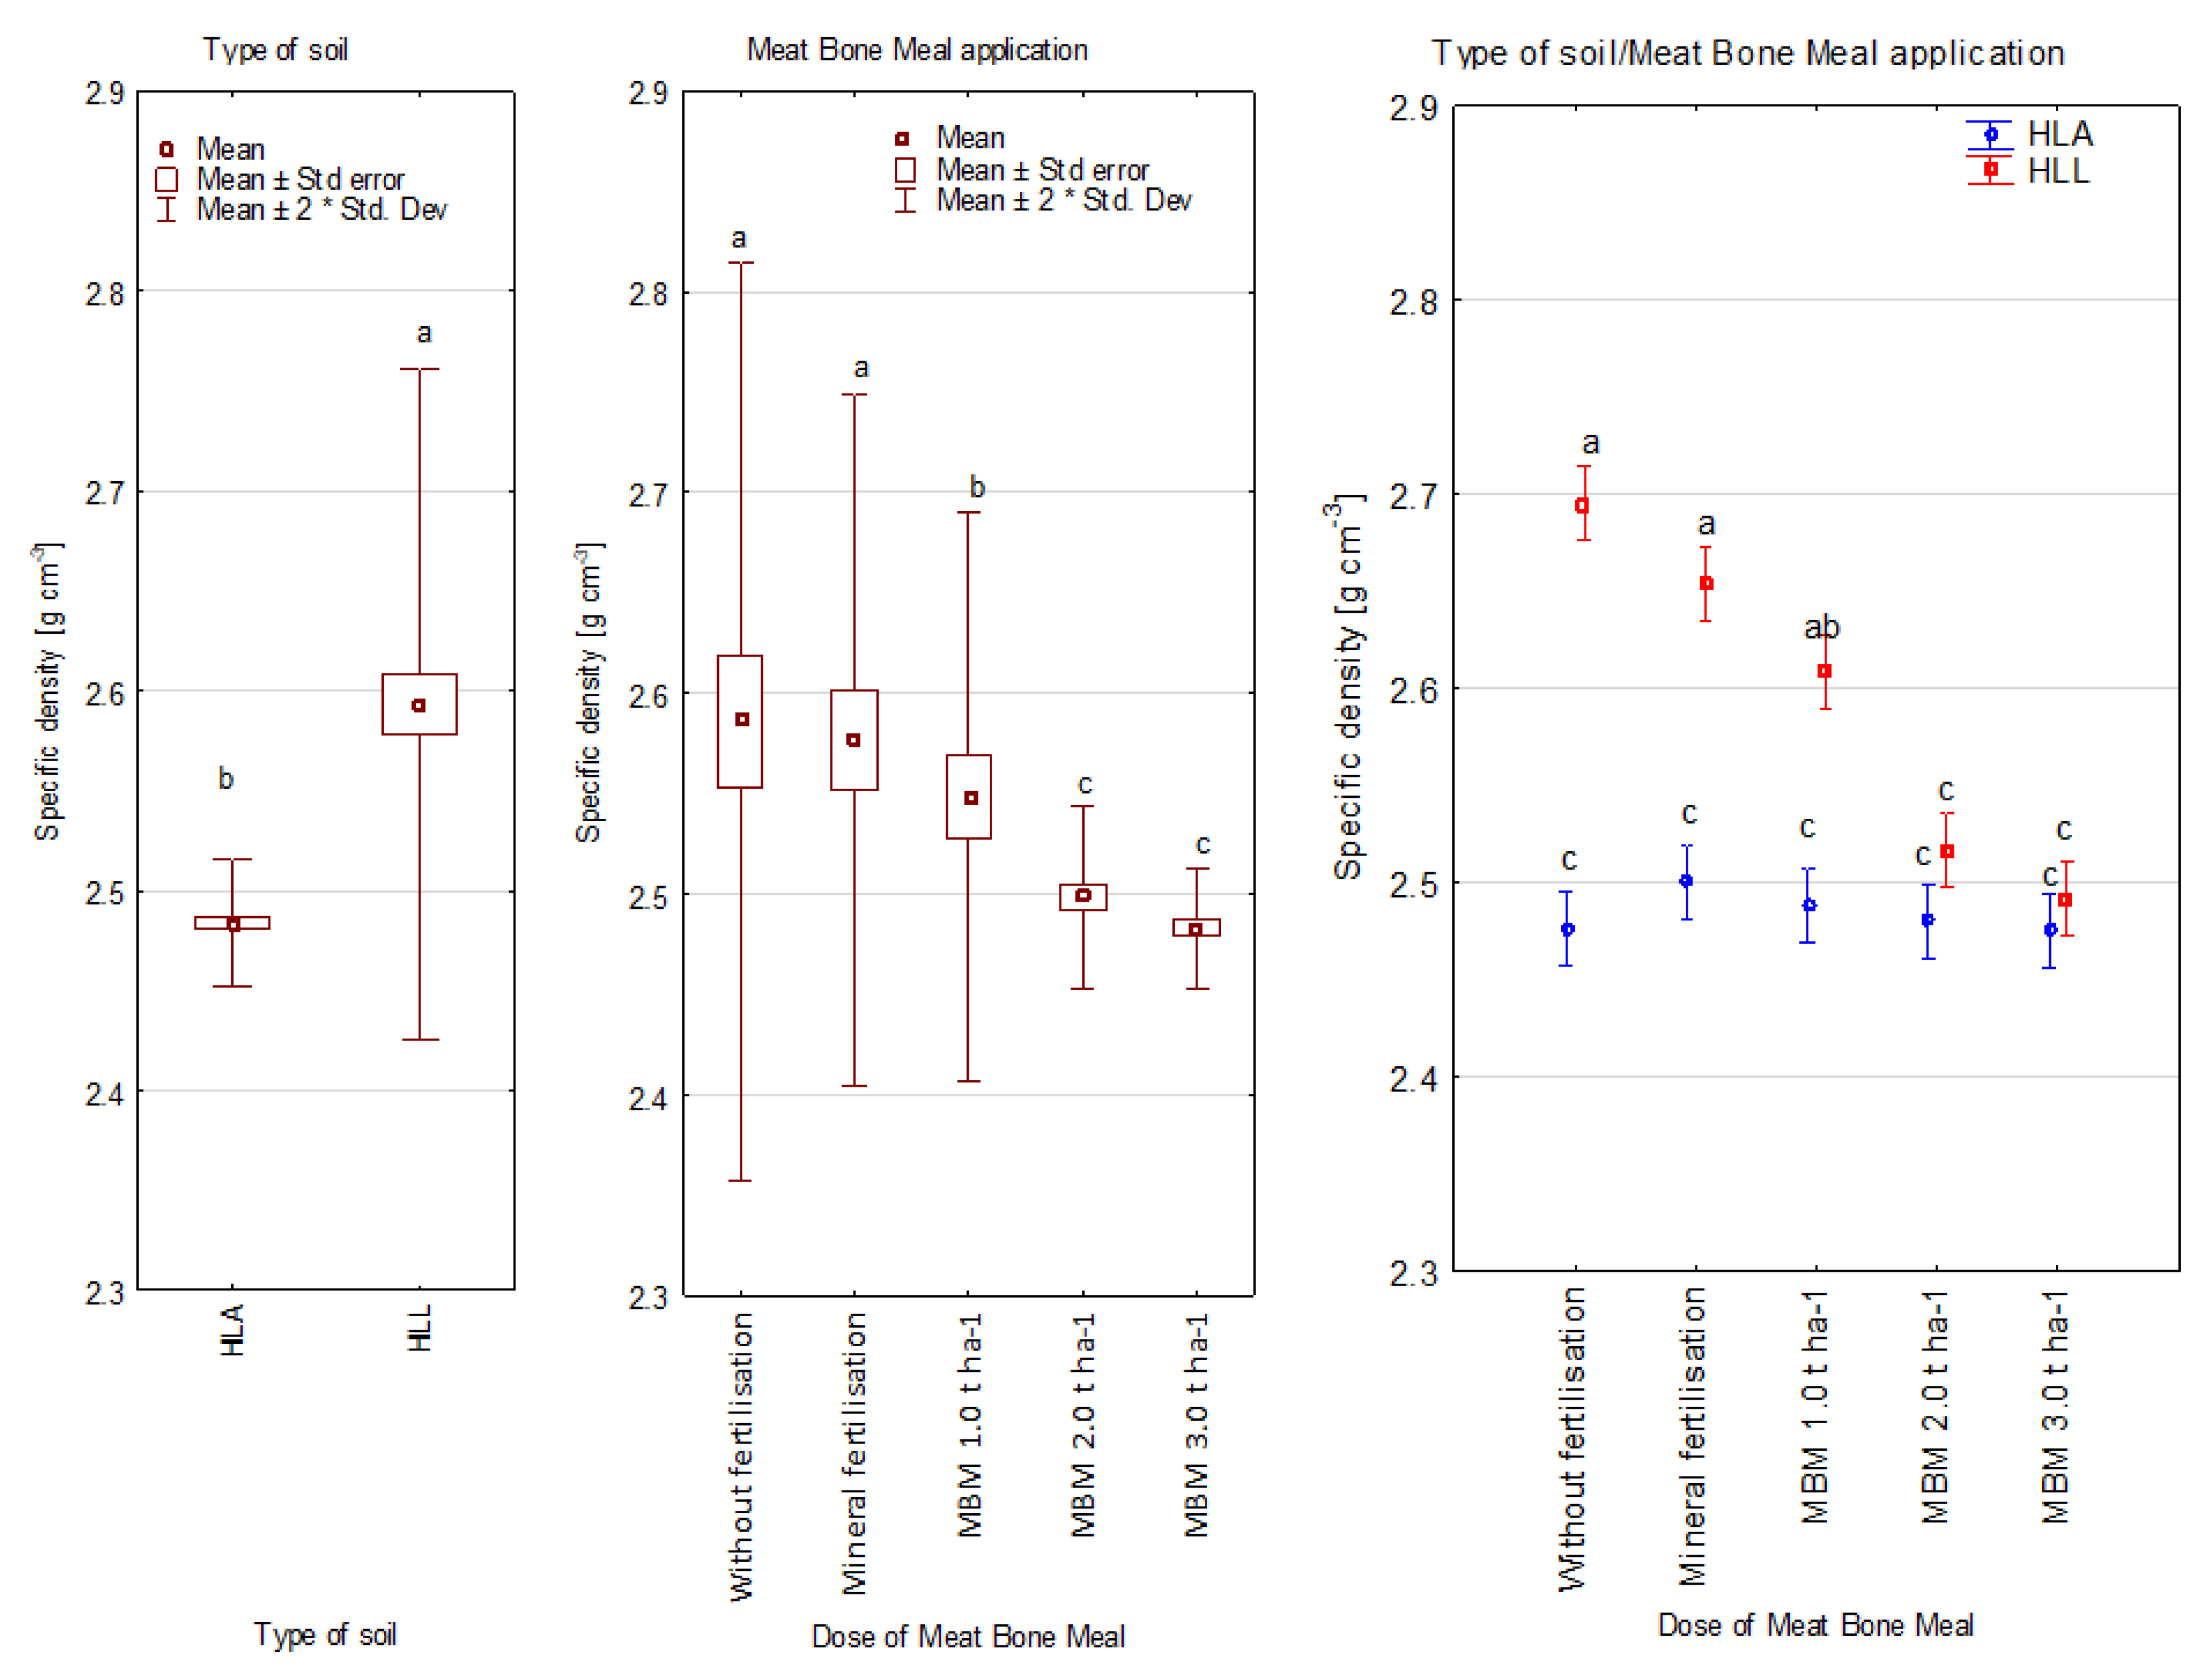
Figure 1.
Specific density of soil depending on soil type, meat and bone meal application, soil type/meat and bone meal application, g cm−3. a,b,c—statistically homogenous groups (Tukey’s test); HLA—Haplic Luvisol Arenic soil; HLL—Haplic Luvisol Loamic soil.
Figure 1.
Specific density of soil depending on soil type, meat and bone meal application, soil type/meat and bone meal application, g cm−3. a,b,c—statistically homogenous groups (Tukey’s test); HLA—Haplic Luvisol Arenic soil; HLL—Haplic Luvisol Loamic soil.
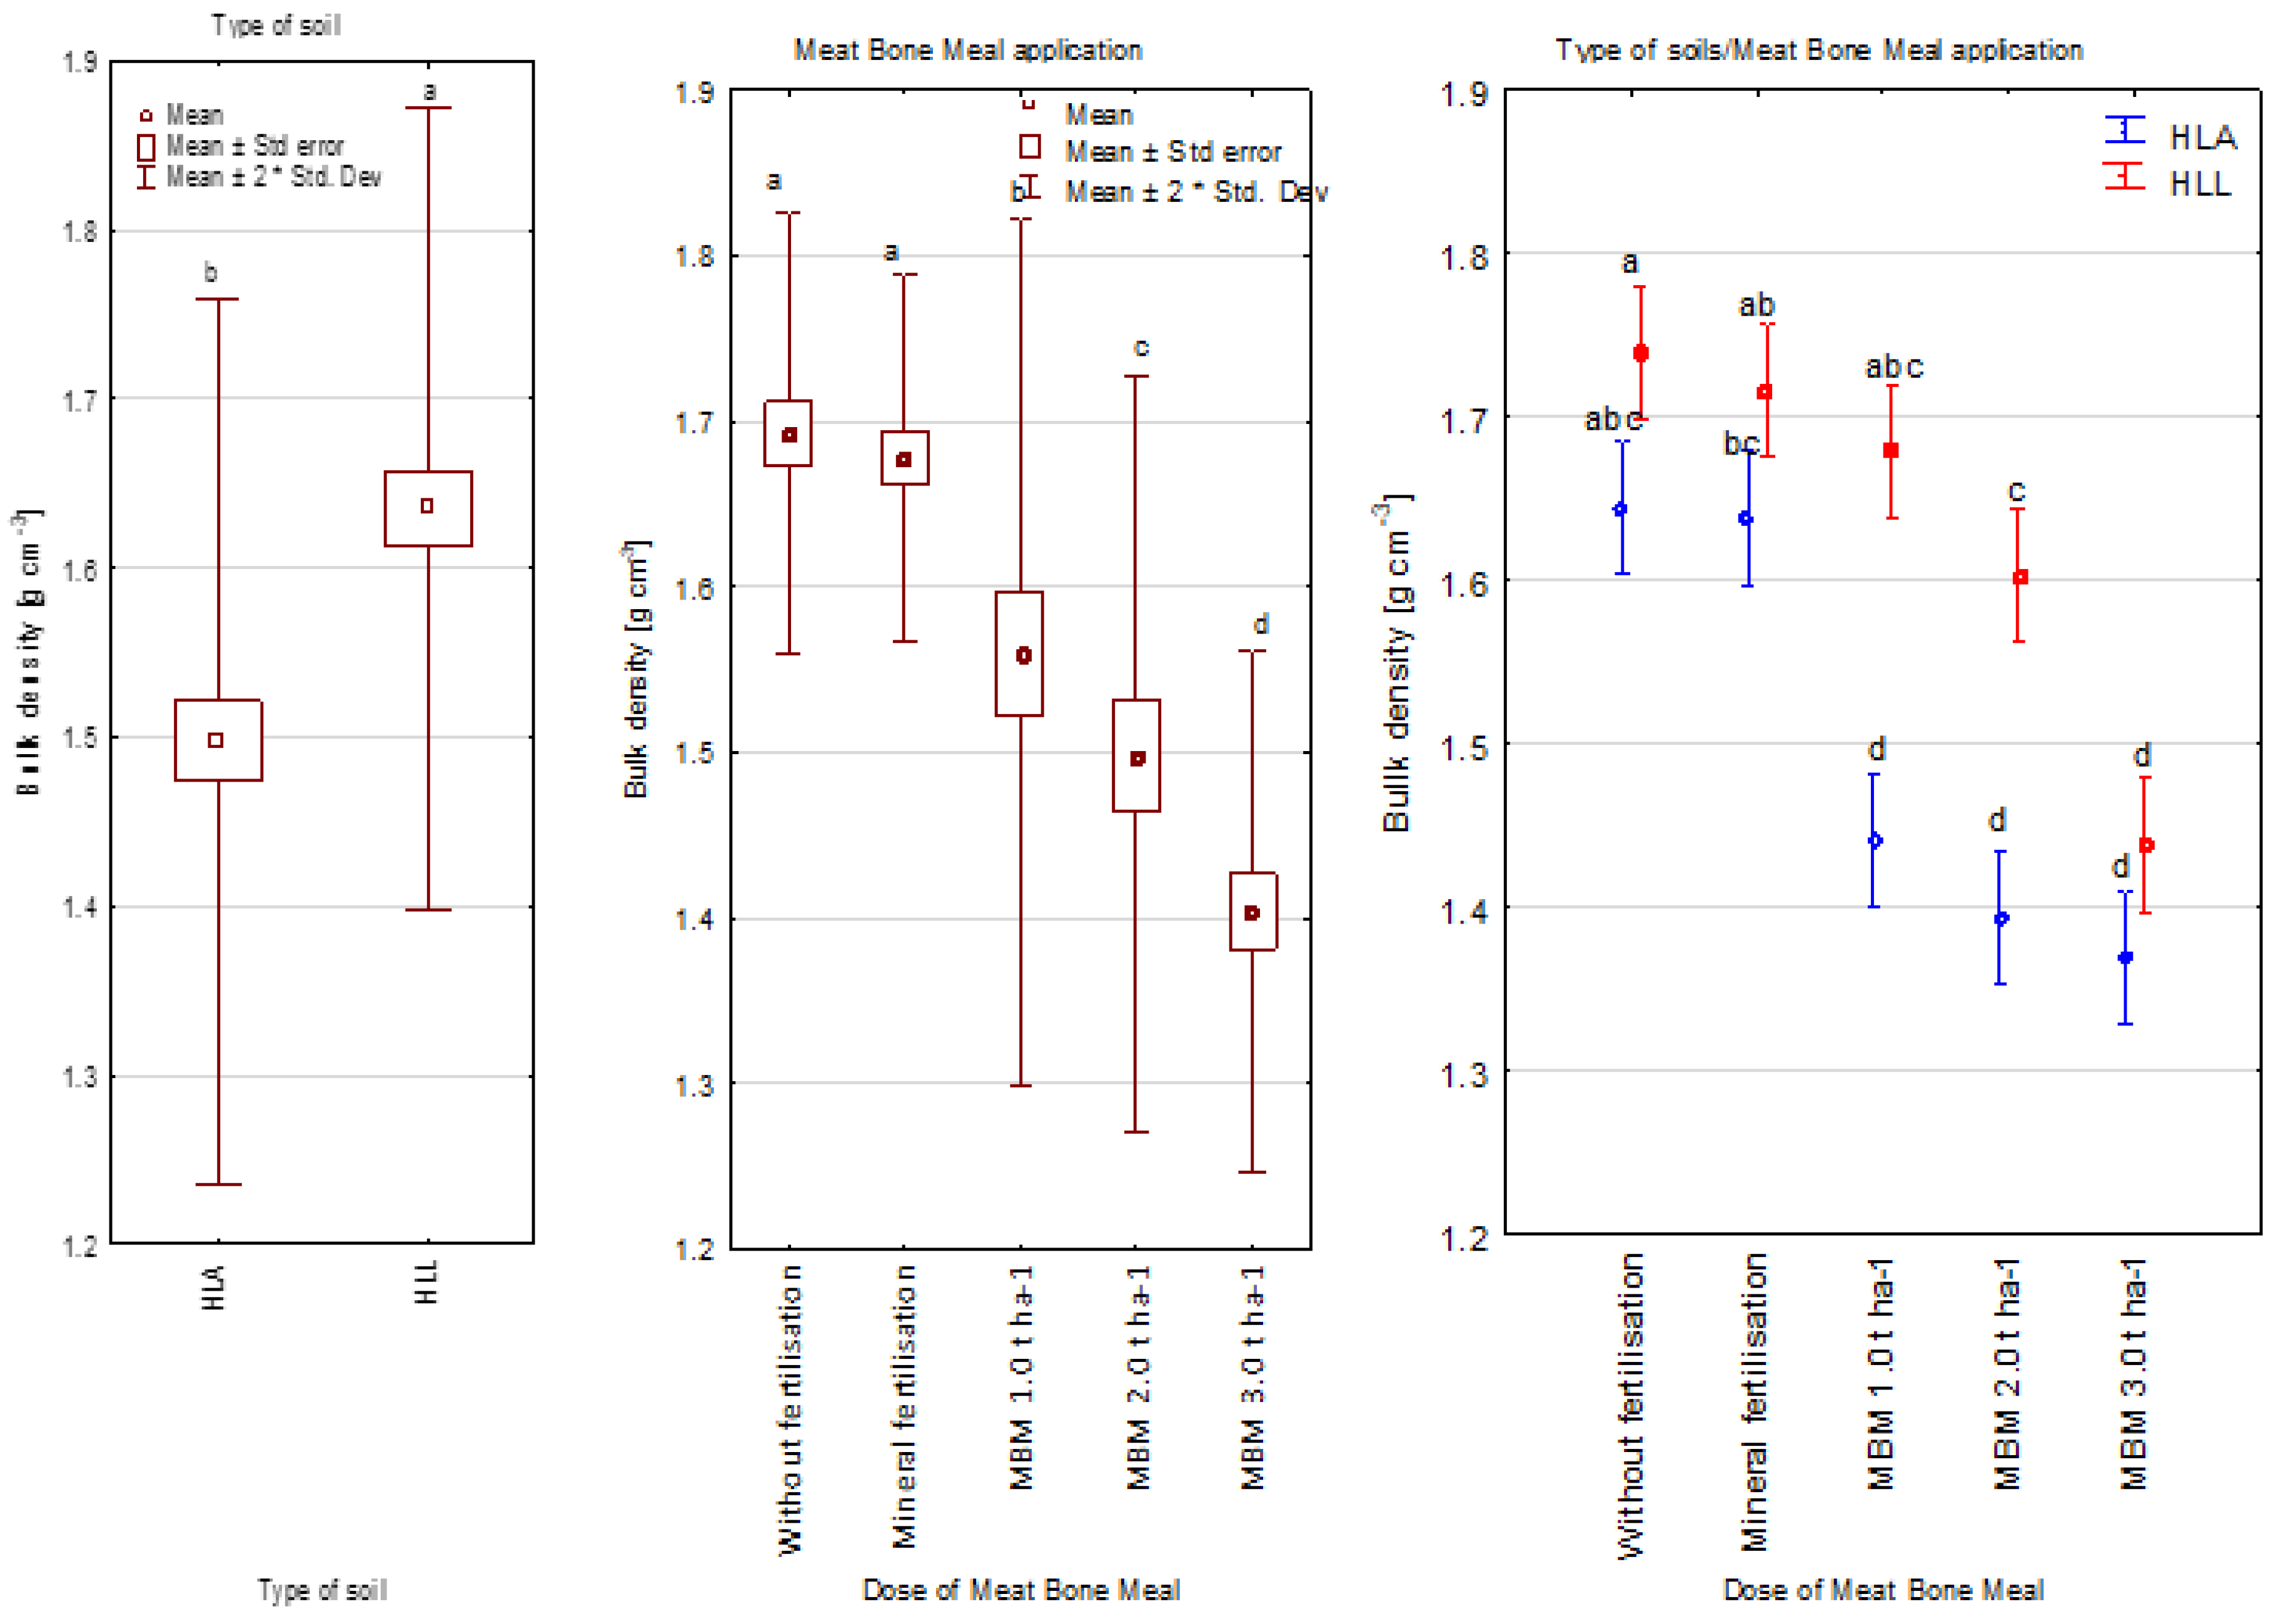
Figure 2.
Bulk density of soil depending on soil type, meat and bone meal application, soil type/meat and bone meal application, g cm−3. a,b,c,d—statistically homogenous groups (Tukey’s test); HLA—Haplic Luvisol Arenic soil; HLL—Haplic Luvisol Loamic soil.
Figure 2.
Bulk density of soil depending on soil type, meat and bone meal application, soil type/meat and bone meal application, g cm−3. a,b,c,d—statistically homogenous groups (Tukey’s test); HLA—Haplic Luvisol Arenic soil; HLL—Haplic Luvisol Loamic soil.
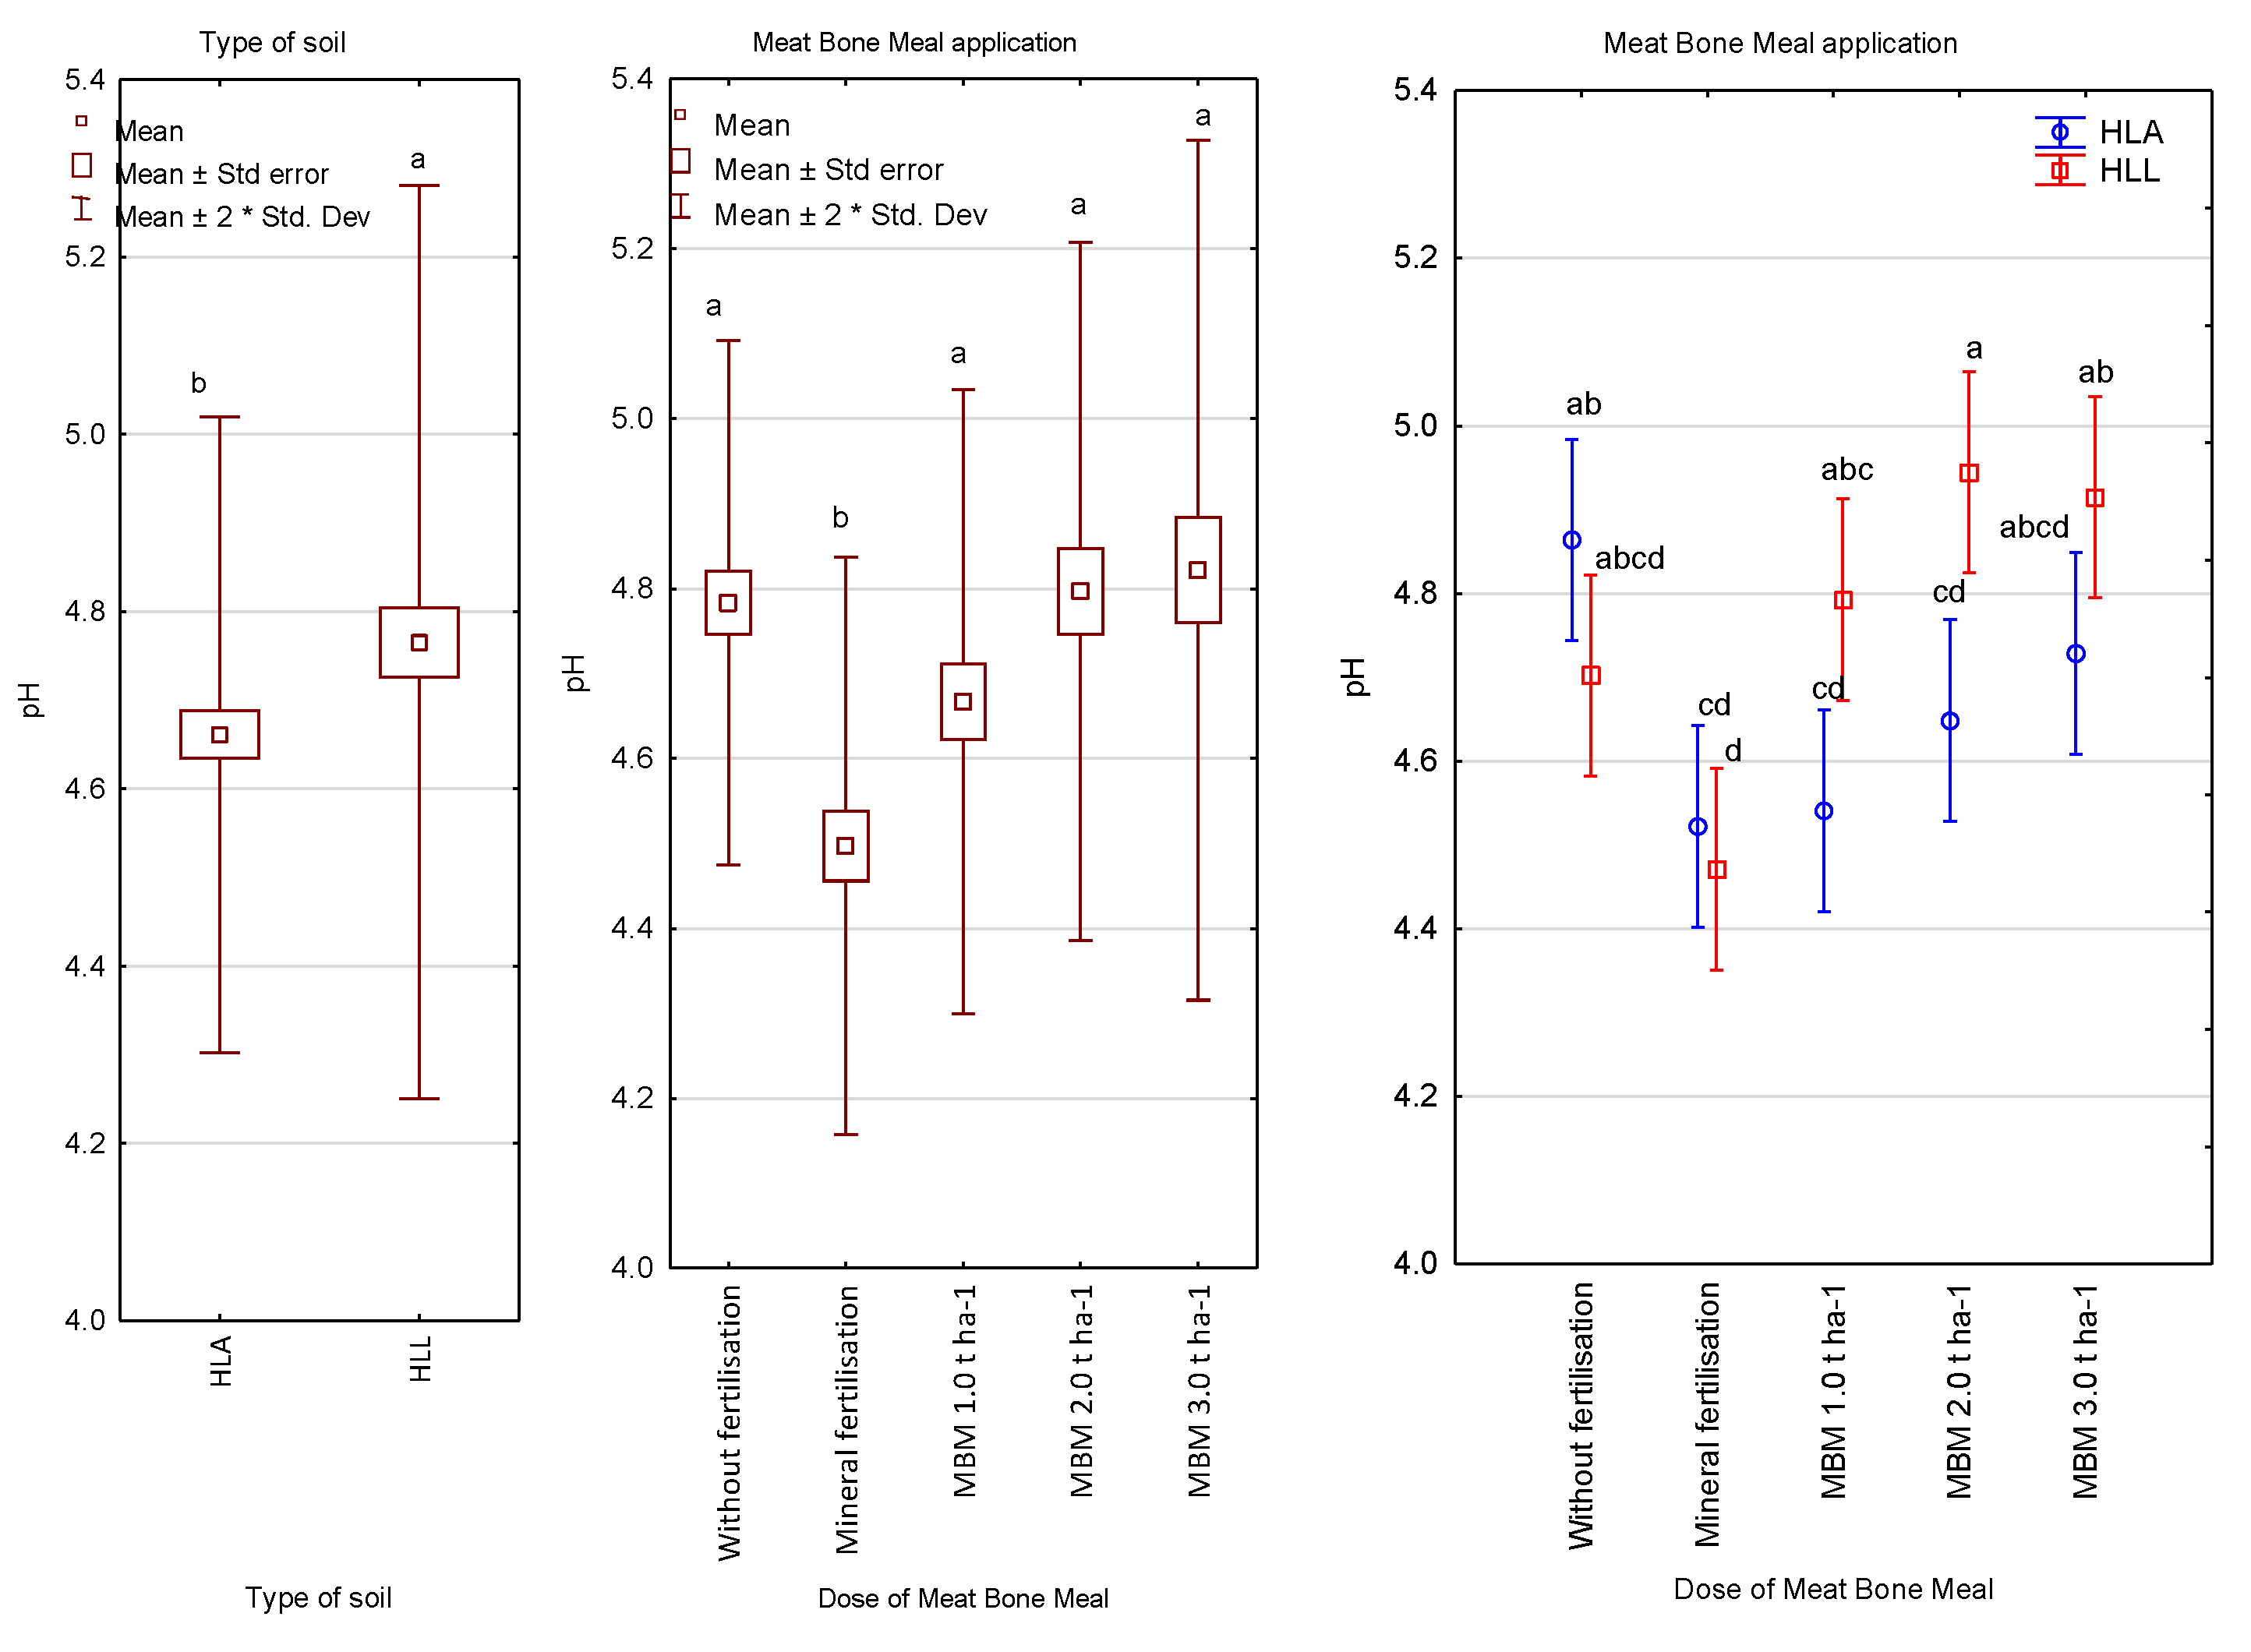
Figure 3.
Soil pH depending on soil type meat and bone meal application, soil type/meat and bone meal application. a,b,c,d—statistically homogenous groups (Tukey’s test); HLA—Haplic Luvisol Arenic soil; HLL—Haplic Luvisol Loamic soil.
Figure 3.
Soil pH depending on soil type meat and bone meal application, soil type/meat and bone meal application. a,b,c,d—statistically homogenous groups (Tukey’s test); HLA—Haplic Luvisol Arenic soil; HLL—Haplic Luvisol Loamic soil.
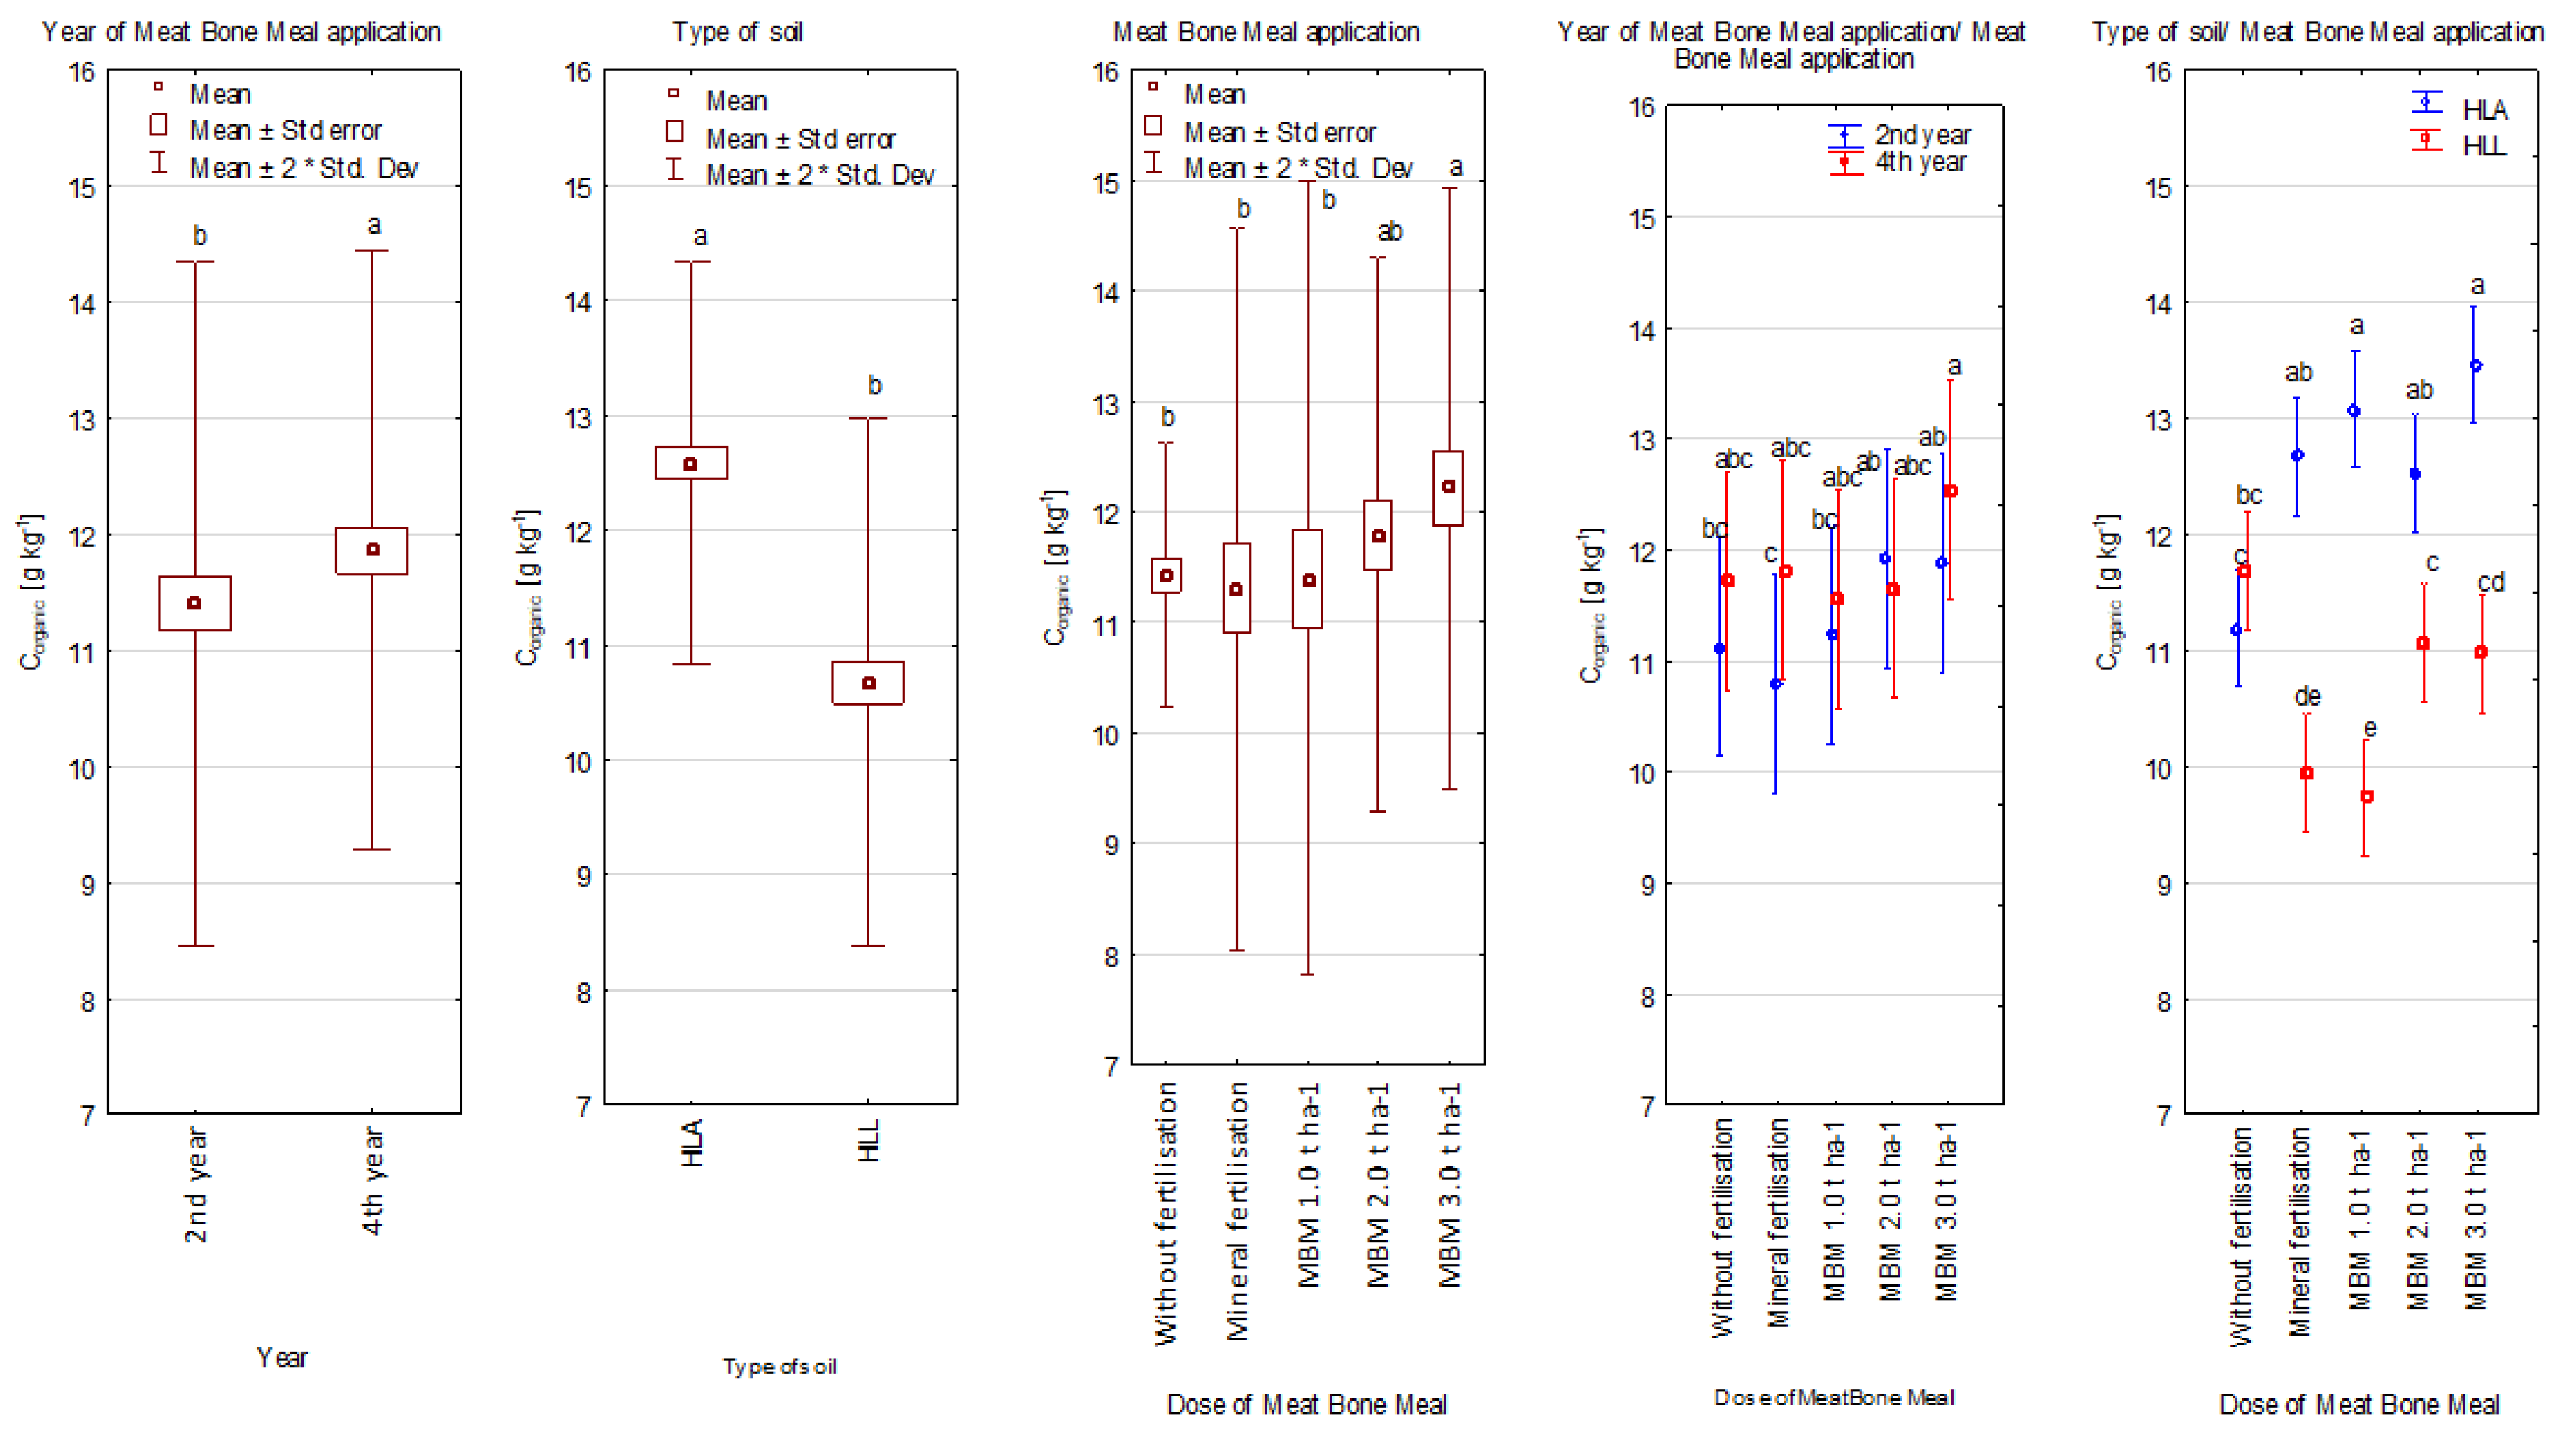
Figure 4.
Concentration of organic carbon in the soil, depending on the year of meat and bone meal application, soil type meat and bone meal application, year of meat and bone meal application/meat and bone meal application, soil type/meat and bone meal application, g kg−1. a,b,c,d,e—statistically homogenous groups (Tukey’s test); HLA—Haplic Luvisol Arenic soil; HLL—Haplic Luvisol Loamic soil.
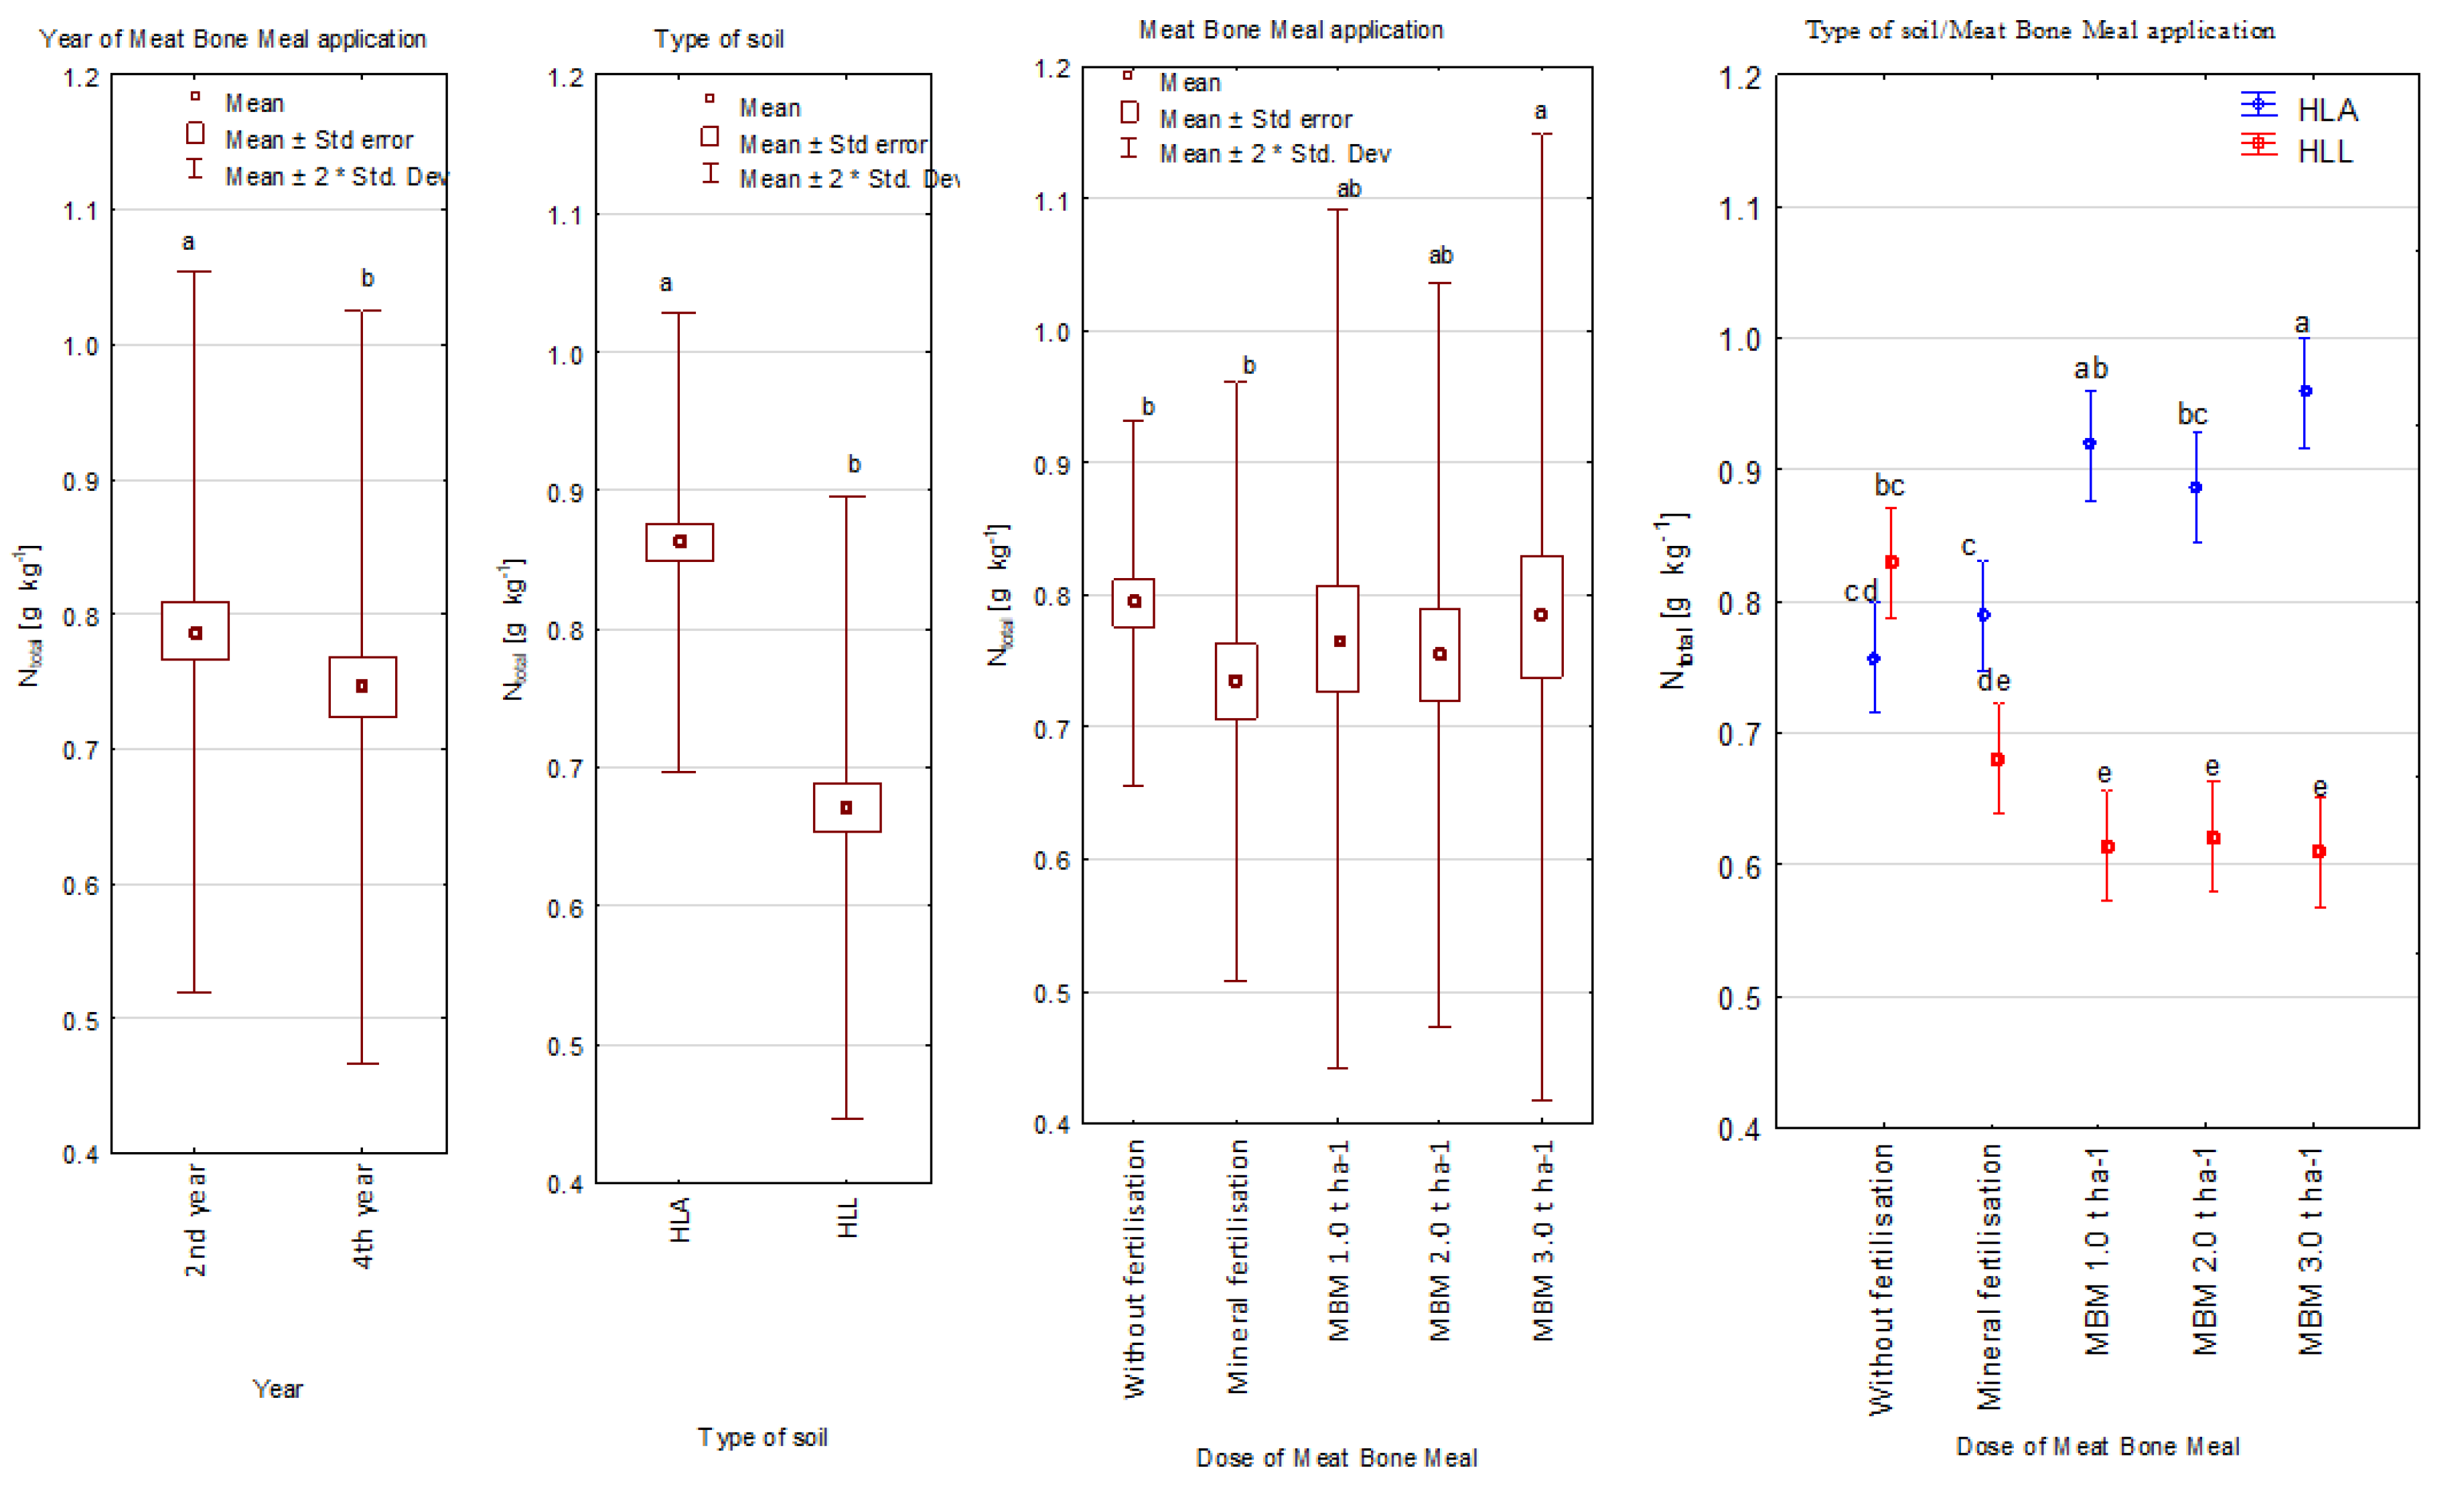
Figure 5.
Concentration of total nitrogen in the soil depending on the year of meat and bone meal application, soil type meat and bone meal application, soil type/meat and bone meal application, g kg−1. a,b,c,d,e—statistically homogenous groups (Tukey’s test); HLA—Haplic Luvisol Arenic soil; HLL—Haplic Luvisol Loamic soil.
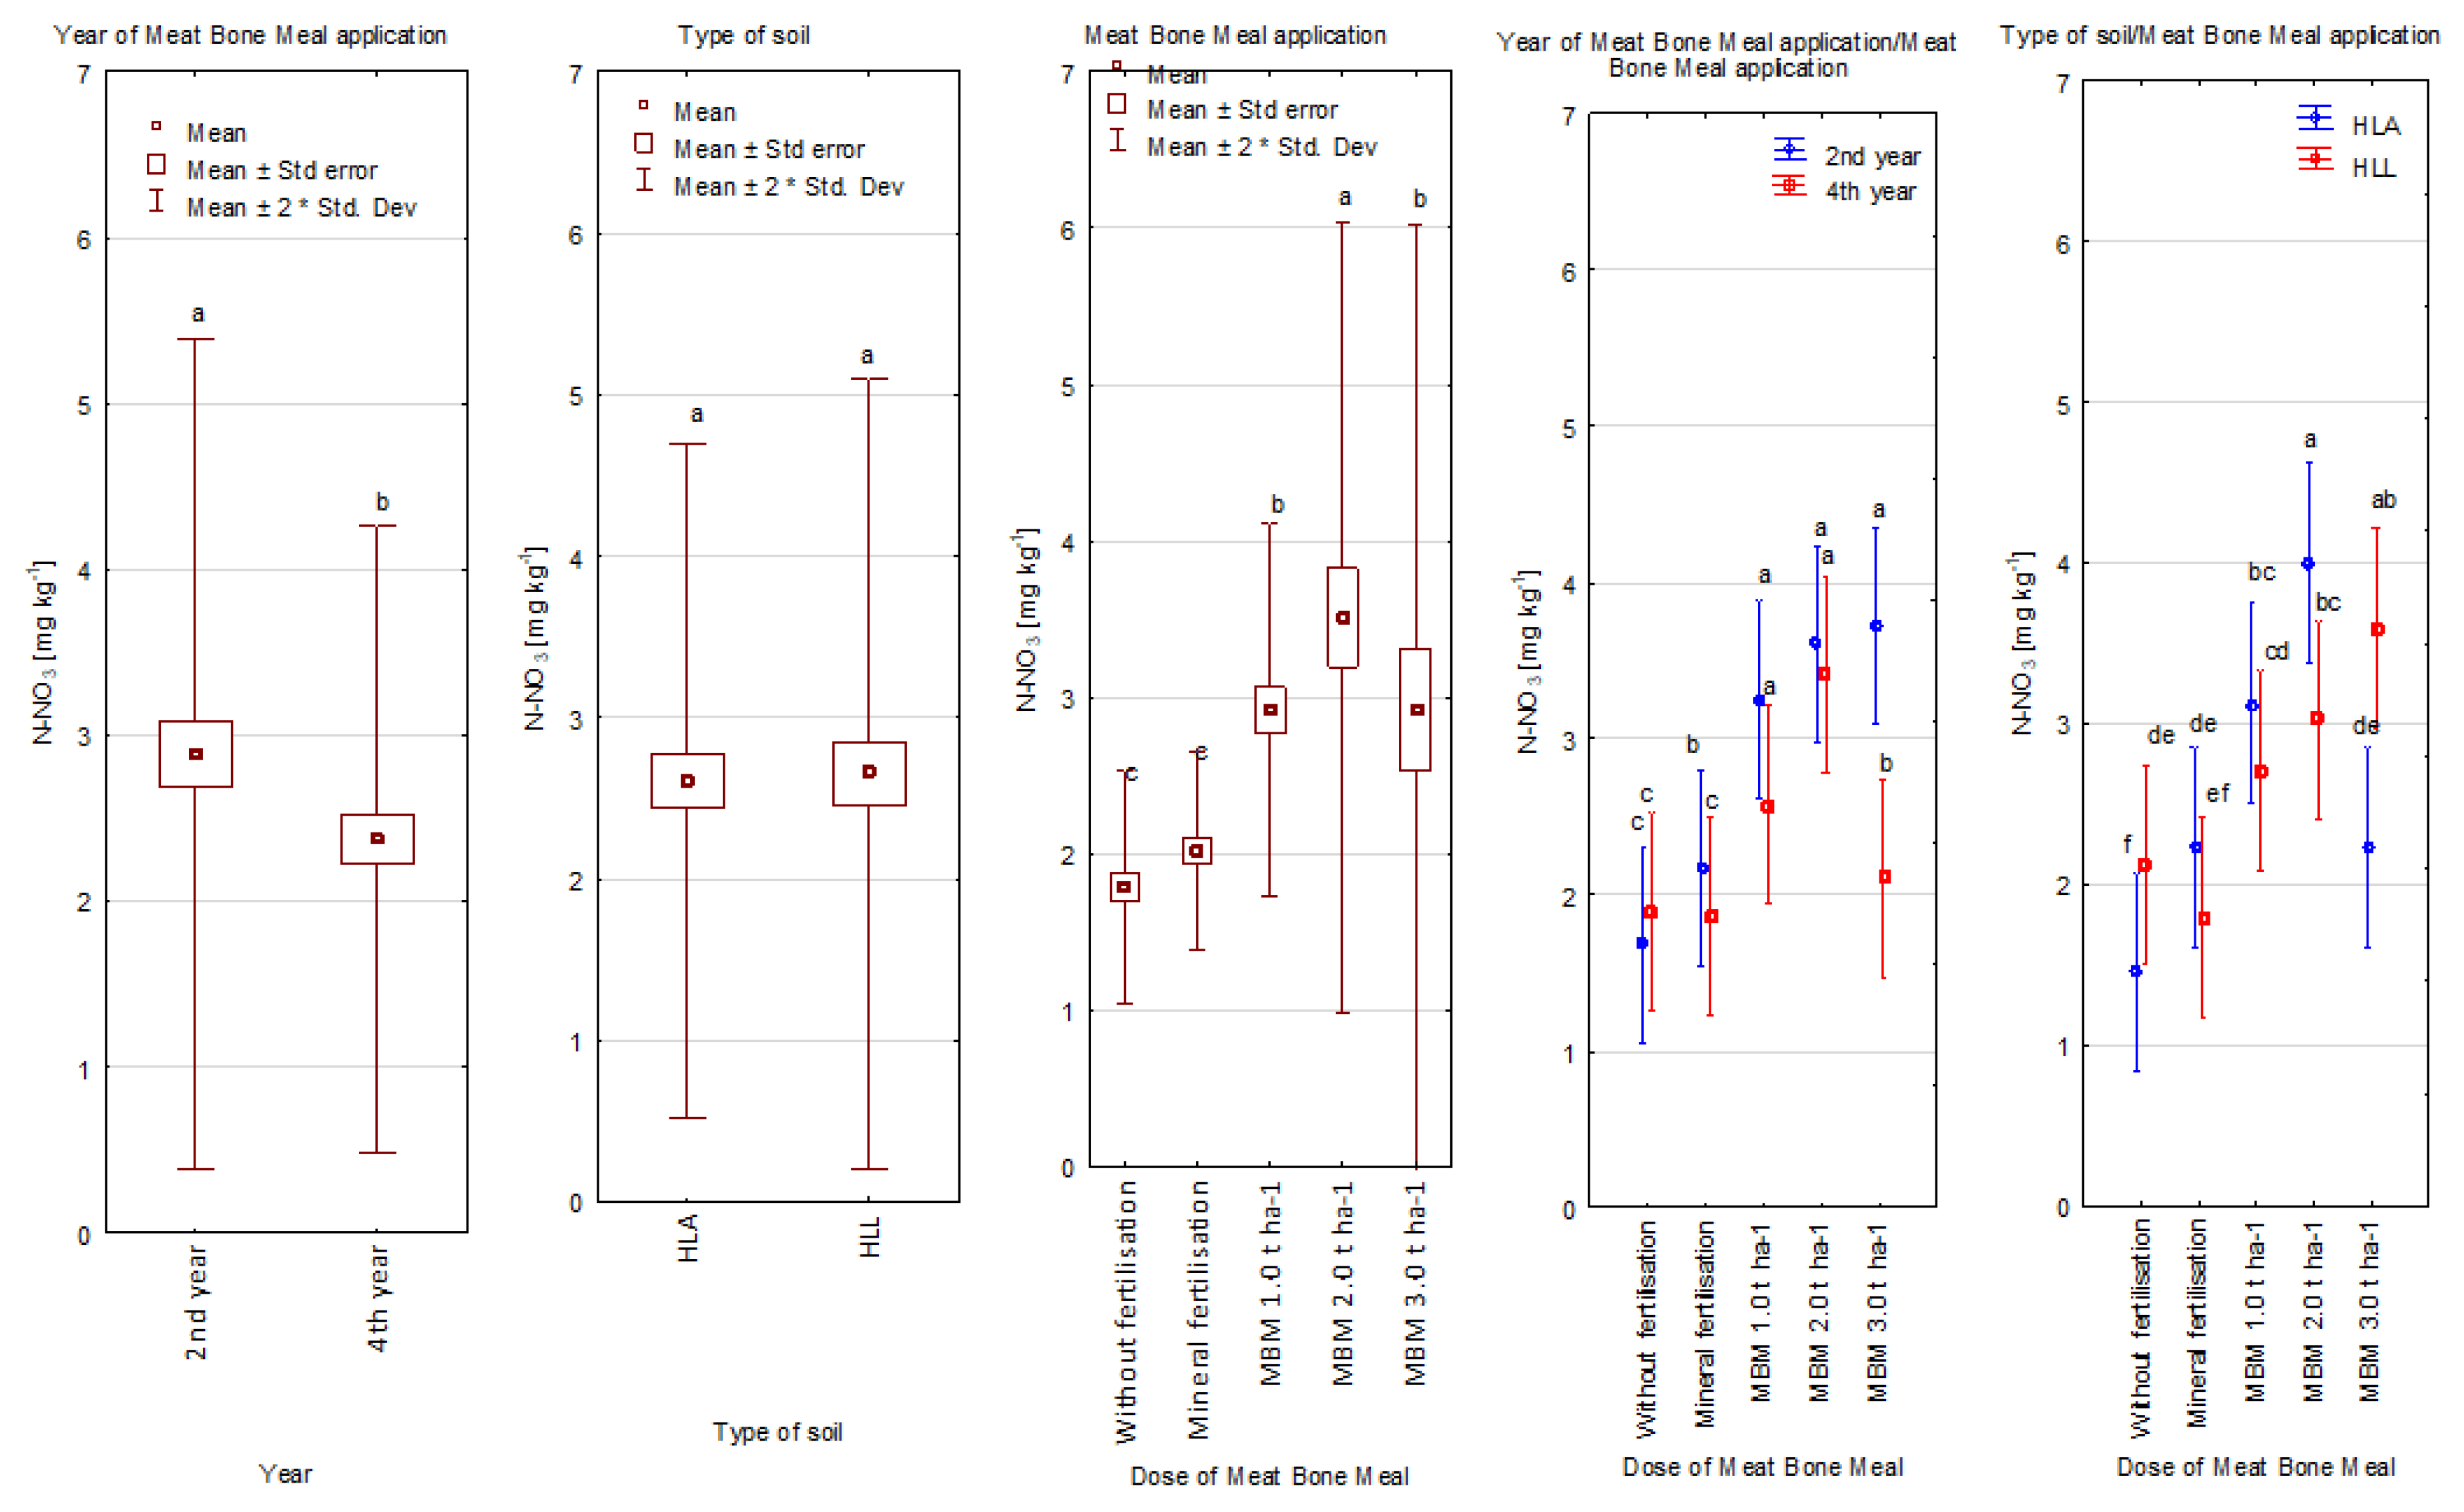
Figure 6.
Concentration of N–NO3 in soil depending on the year of meat and bone meal application, soil type and meat and bone meal application, year of meat and bone meal application/meat and bone meal application, soil type/meat and bone meal application, mg kg−1. a,b,c,d,e,f—statistically homogenous groups (Tukey’s test); HLA—Haplic Luvisol Arenic soil; HLL—Haplic Luvisol Loamic soil.
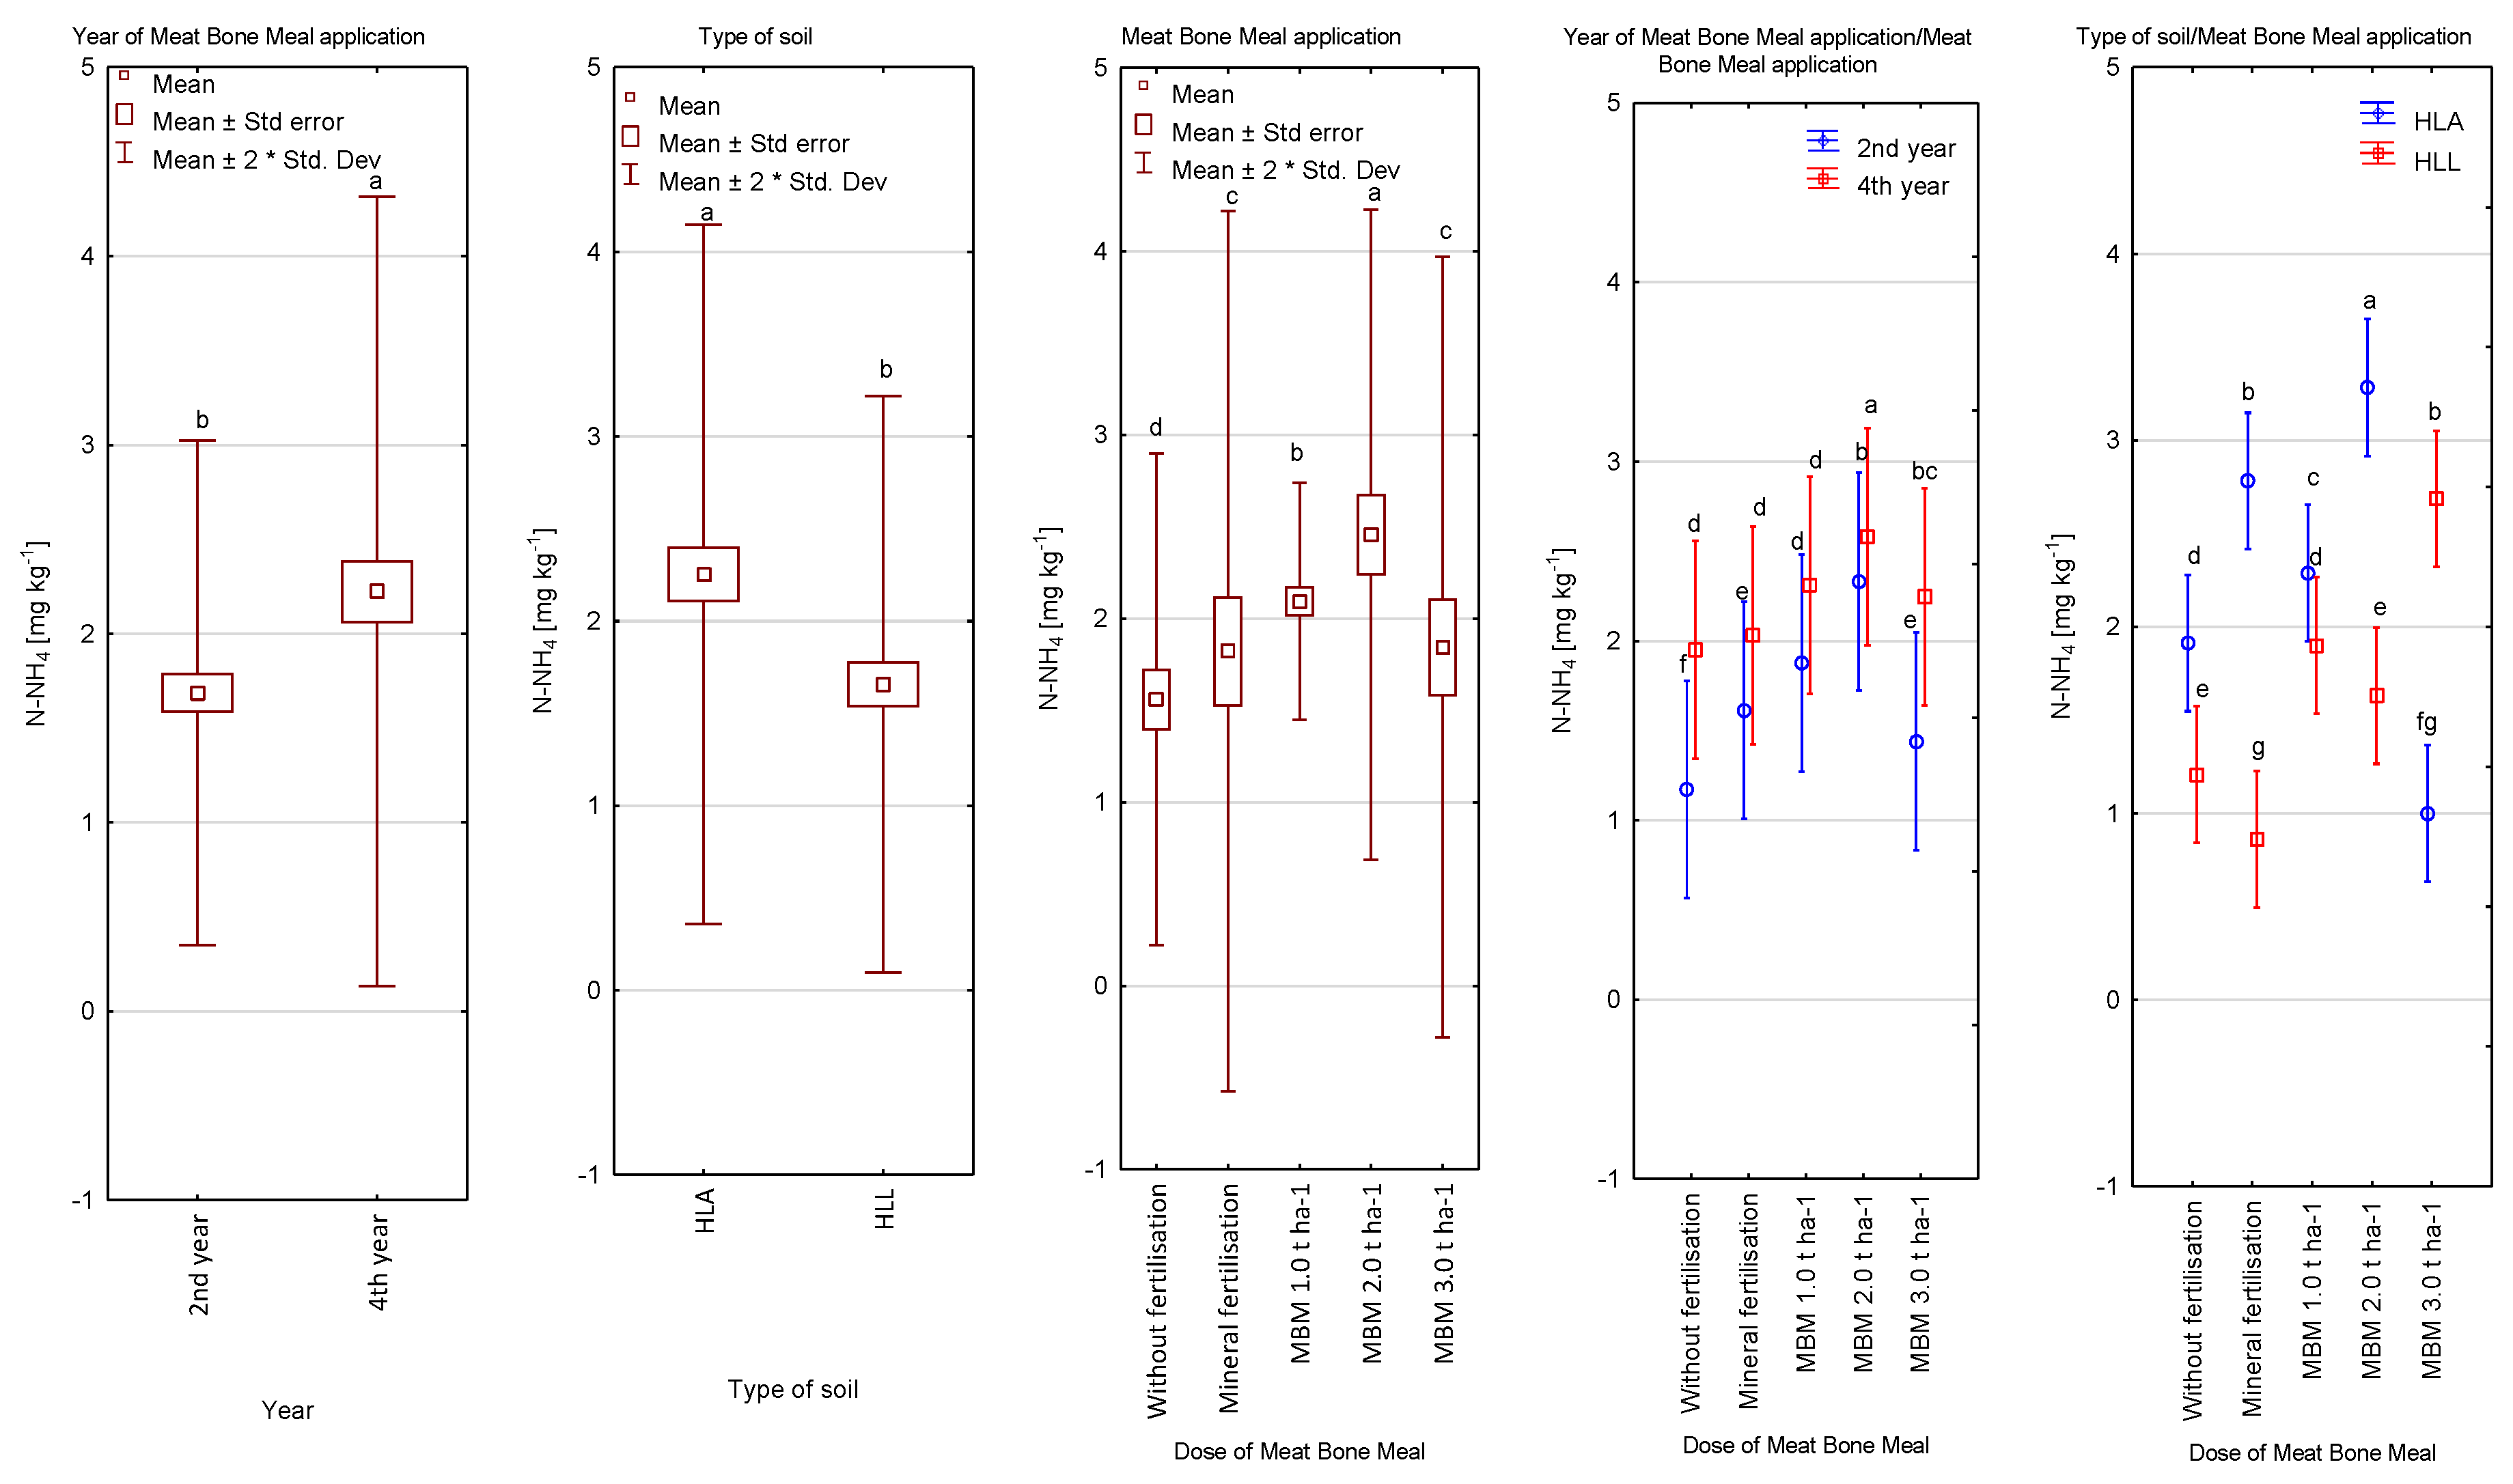
Figure 7.
Concentration of N–NH4 in soil depending on the year of meat and bone meal application, soil type meat and bone meal application, year of meat and bone meal application/meat and bone meal application, soil type/meat and bone meal application, mg kg−1. a,b,c,d,e,f,g—statistically homogenous groups (Tukey’s test); HLA—Haplic Luvisol Arenic soil; HLL—Haplic Luvisol Loamic soil.
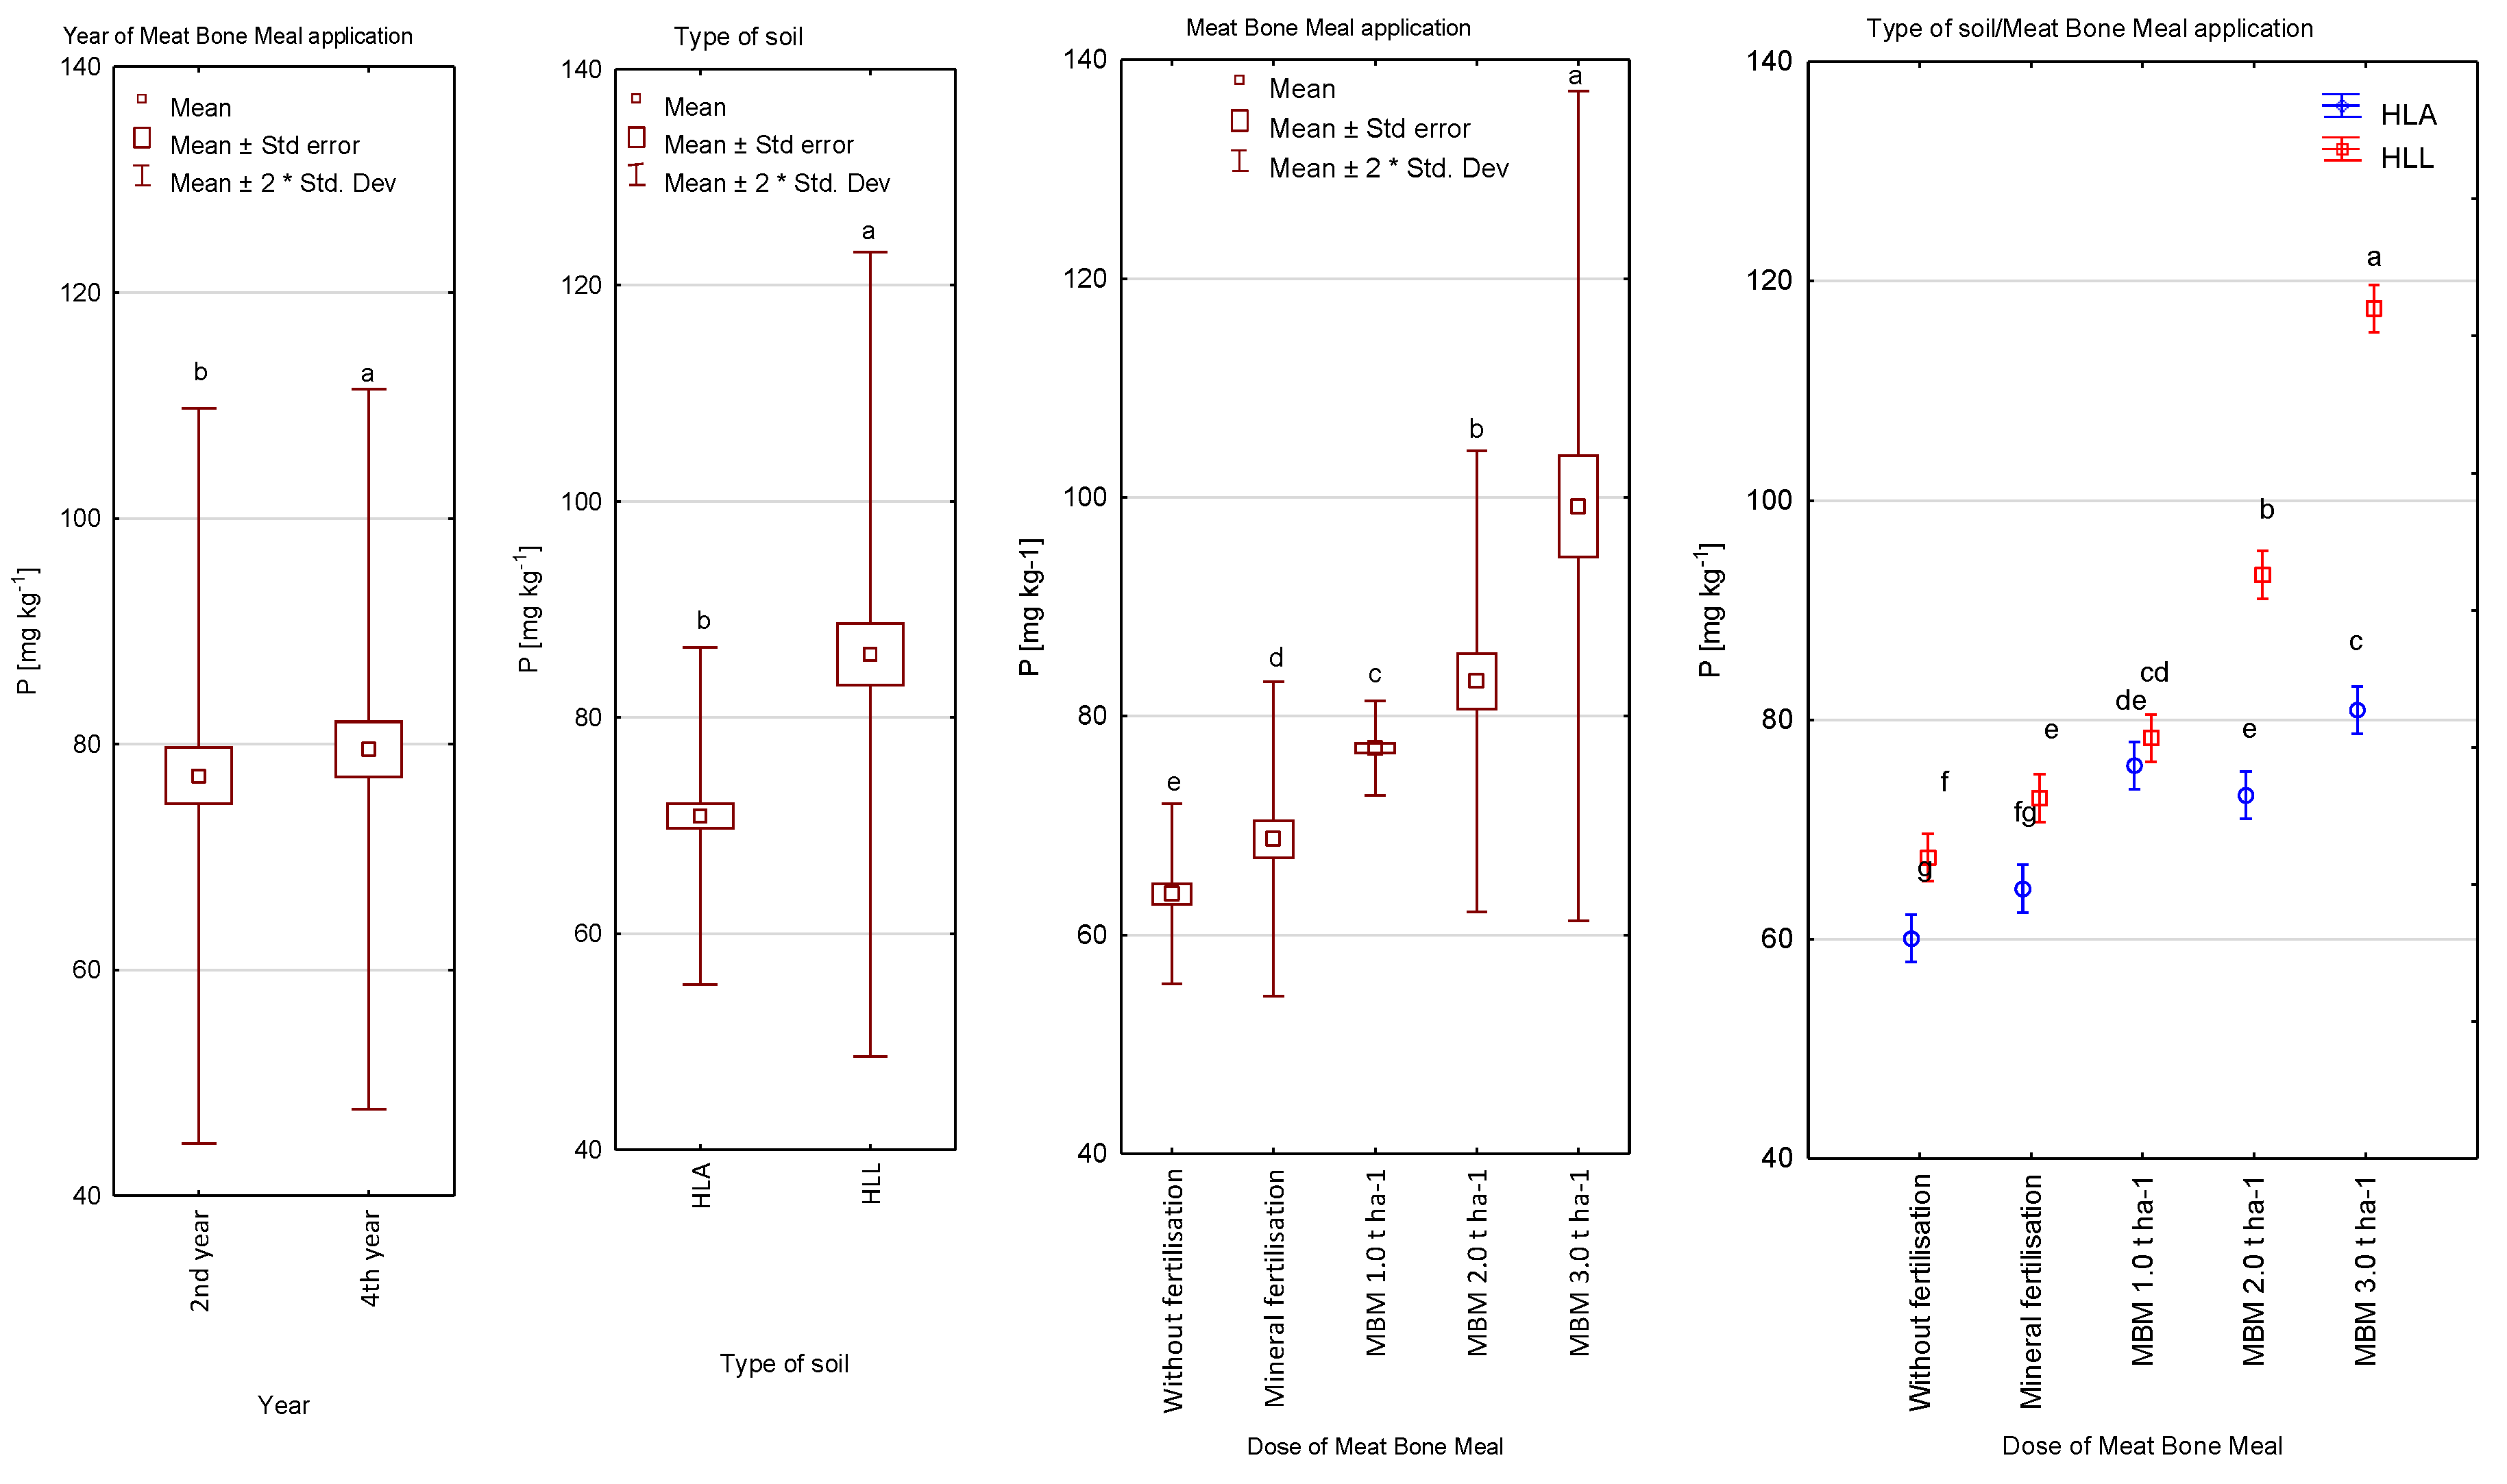
Figure 8.
Concentration of P in soil depending on the year of meat and bone meal application, soil type; meat and bone meal application, soil type/meat and bone meal application, mg kg−1. a,b,c,d,e,f,g—statistically homogenous groups (Tukey’s test); HLA—Haplic Luvisol Arenic soil; HLL—Haplic Luvisol Loamic soil.
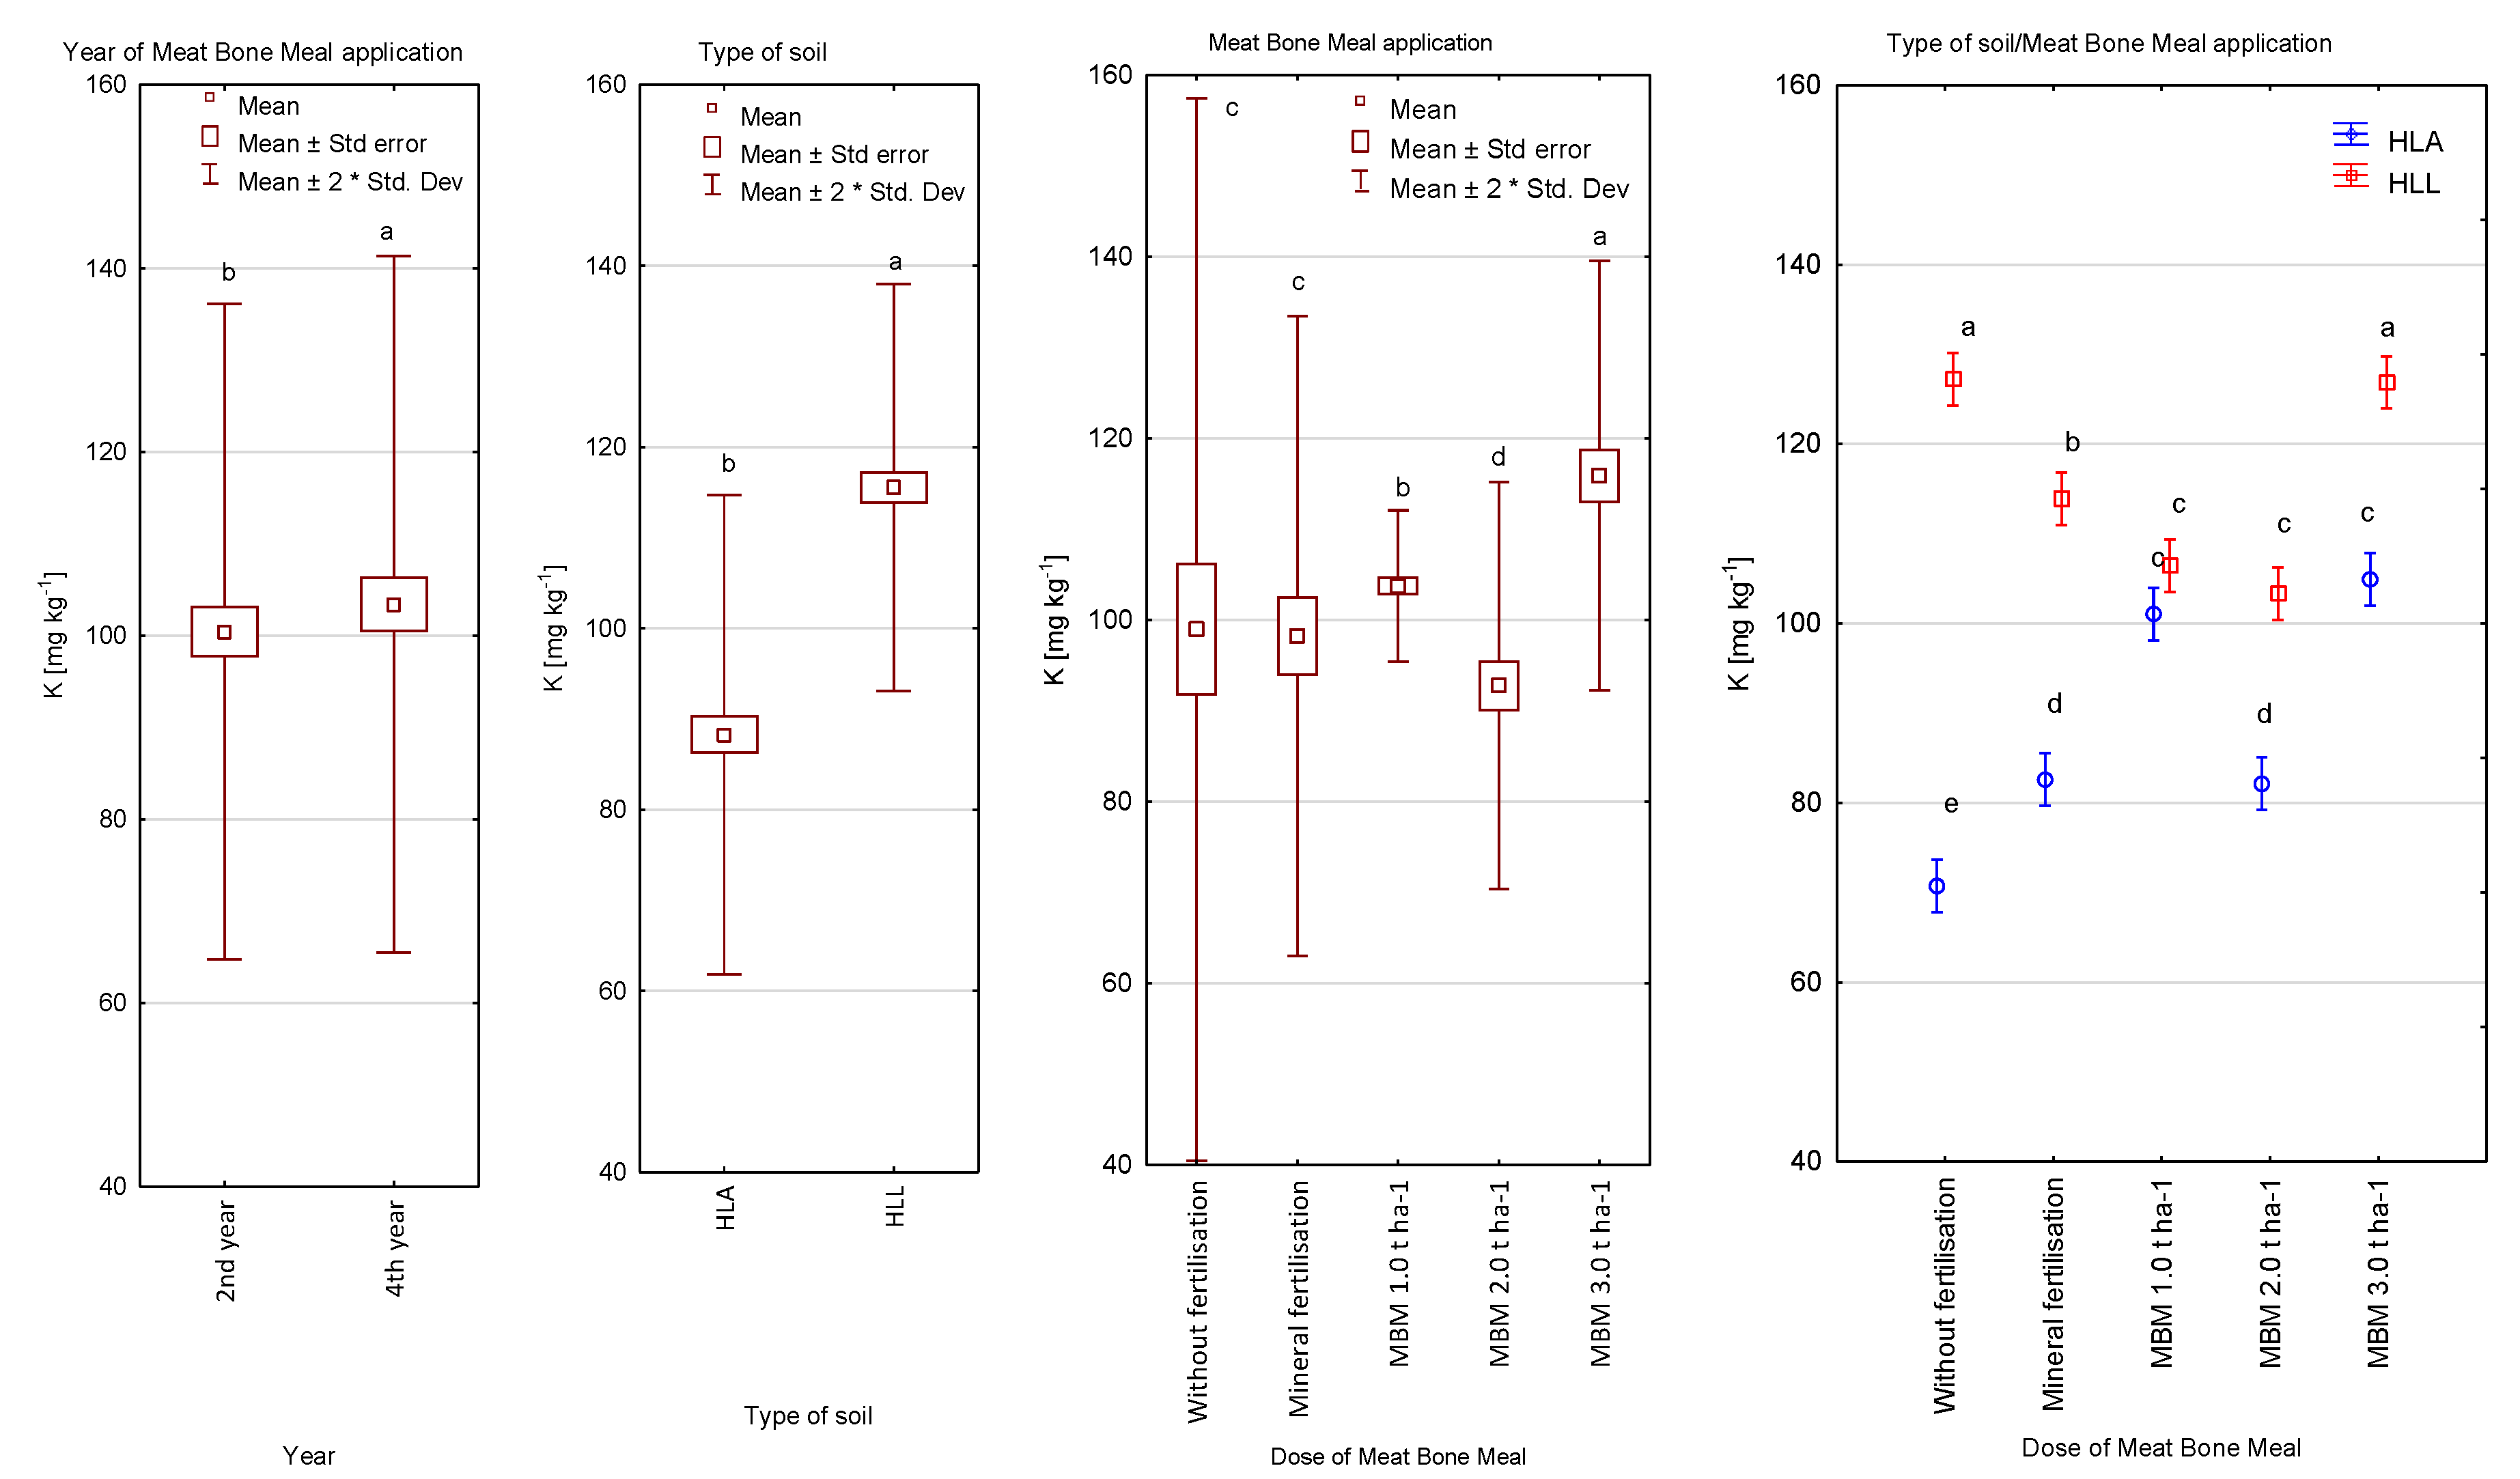
Figure 9.
Concentration of K in soil, depending on the year of meat and bone meal application, soil type, meat and bone meal application, soil type/meat and bone meal application, mg kg−1. a,b,c,d,e—statistically homogenous groups (Tukey’s test).
Figure 9.
Concentration of K in soil, depending on the year of meat and bone meal application, soil type, meat and bone meal application, soil type/meat and bone meal application, mg kg−1. a,b,c,d,e—statistically homogenous groups (Tukey’s test).
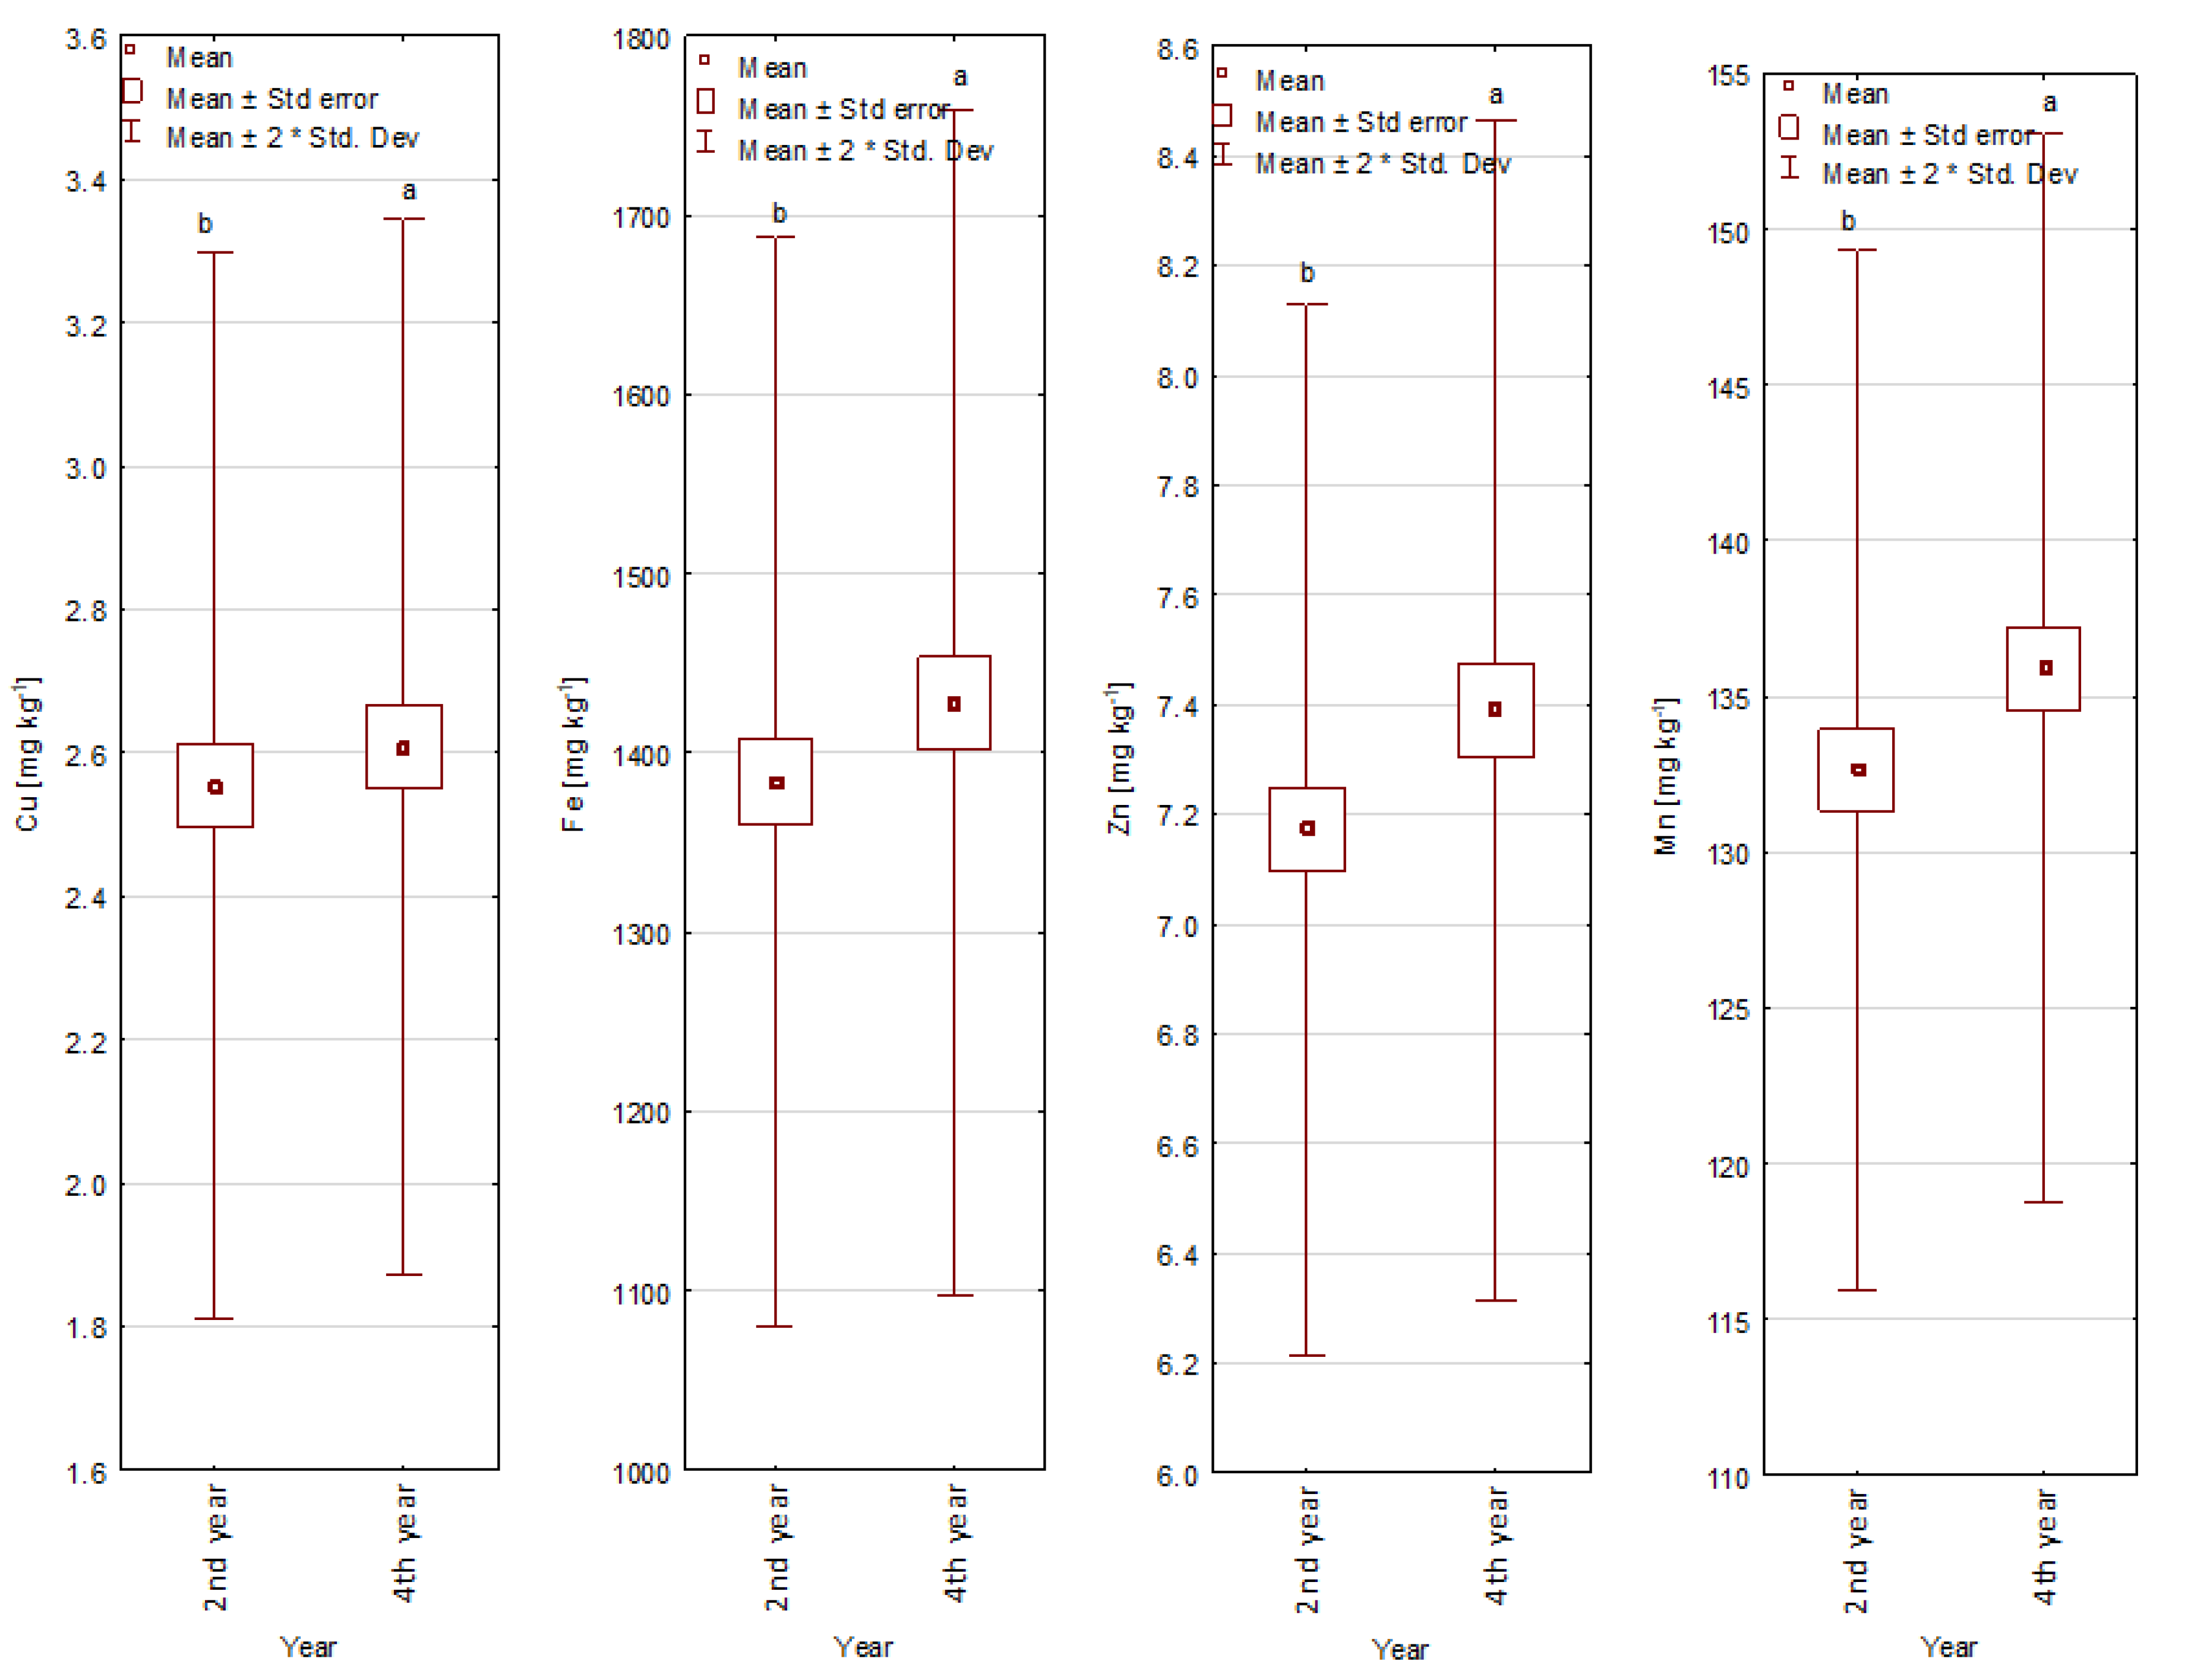
Figure 10.
Concentrations of Cu, Fe, Zn, and Mn in soil depending on the year of meat and bone meal application, mg kg−1. a,b—statistically homogenous groups (Tukey’s test).
Figure 10.
Concentrations of Cu, Fe, Zn, and Mn in soil depending on the year of meat and bone meal application, mg kg−1. a,b—statistically homogenous groups (Tukey’s test).
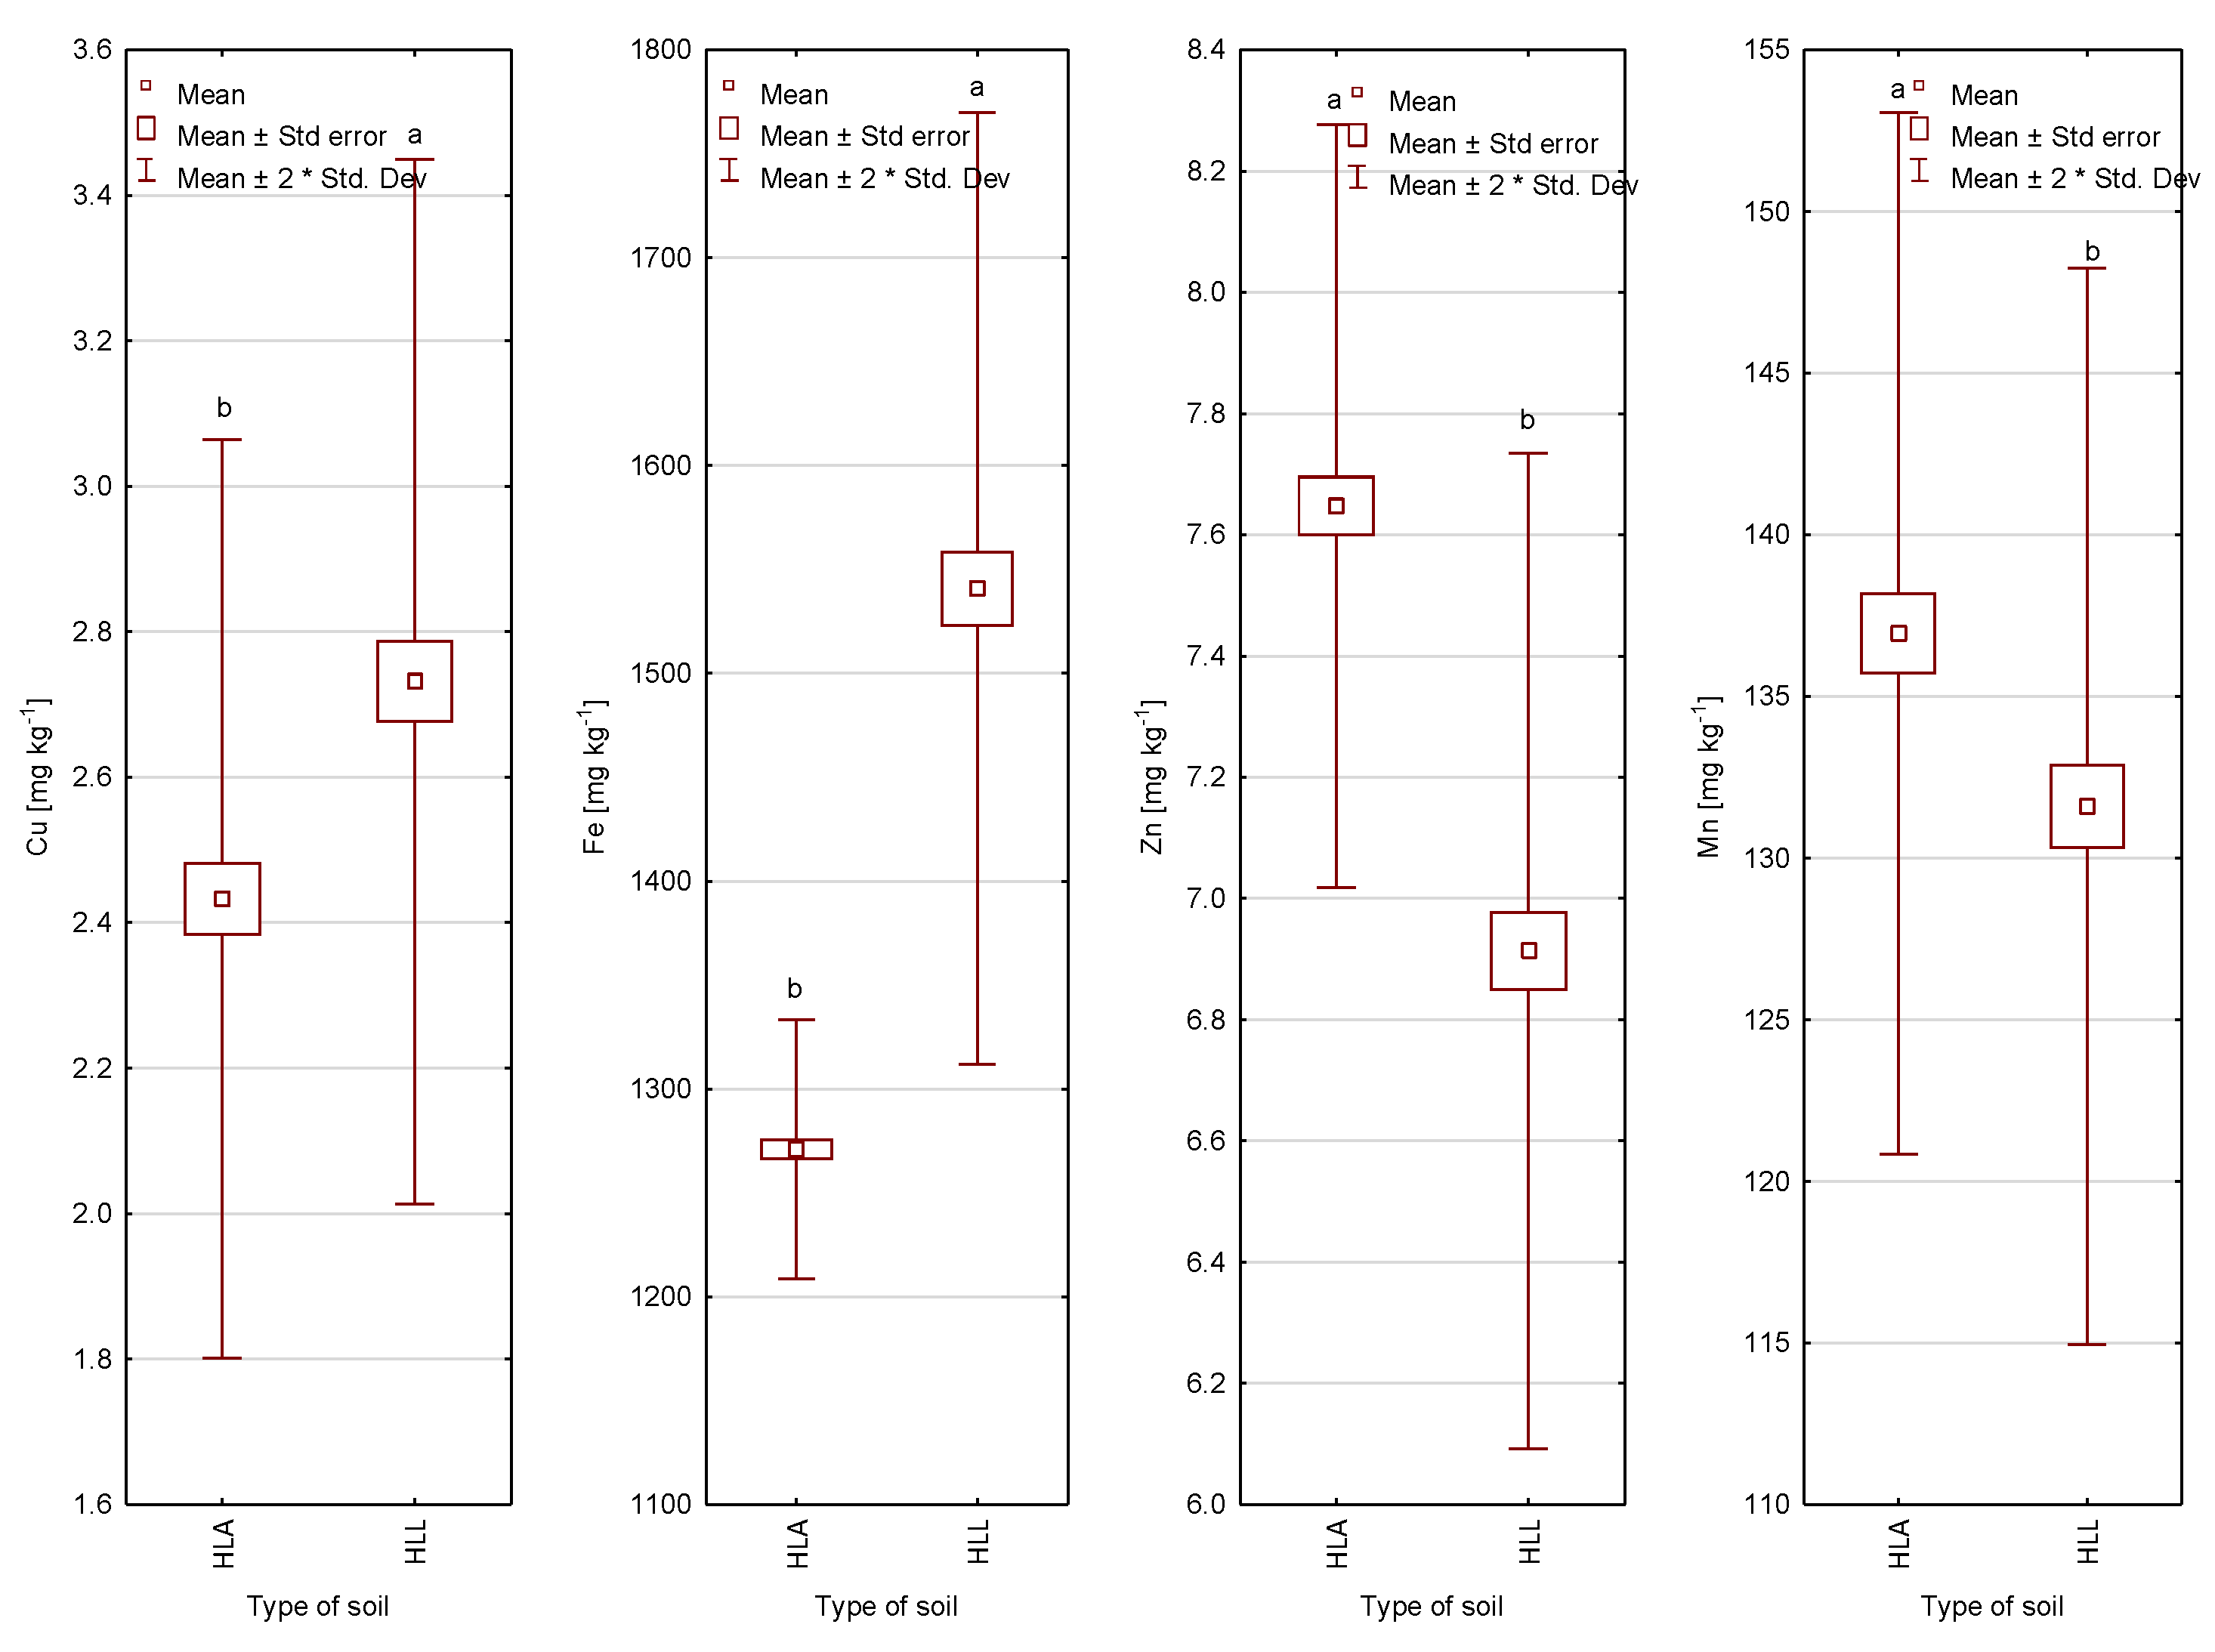
Figure 11.
Concentrations of Cu, Fe, Zn and Mn in soil depend on soil type, mg kg−1. a,b—statistically homogenous groups (Tukey’s test).
Figure 11.
Concentrations of Cu, Fe, Zn and Mn in soil depend on soil type, mg kg−1. a,b—statistically homogenous groups (Tukey’s test).
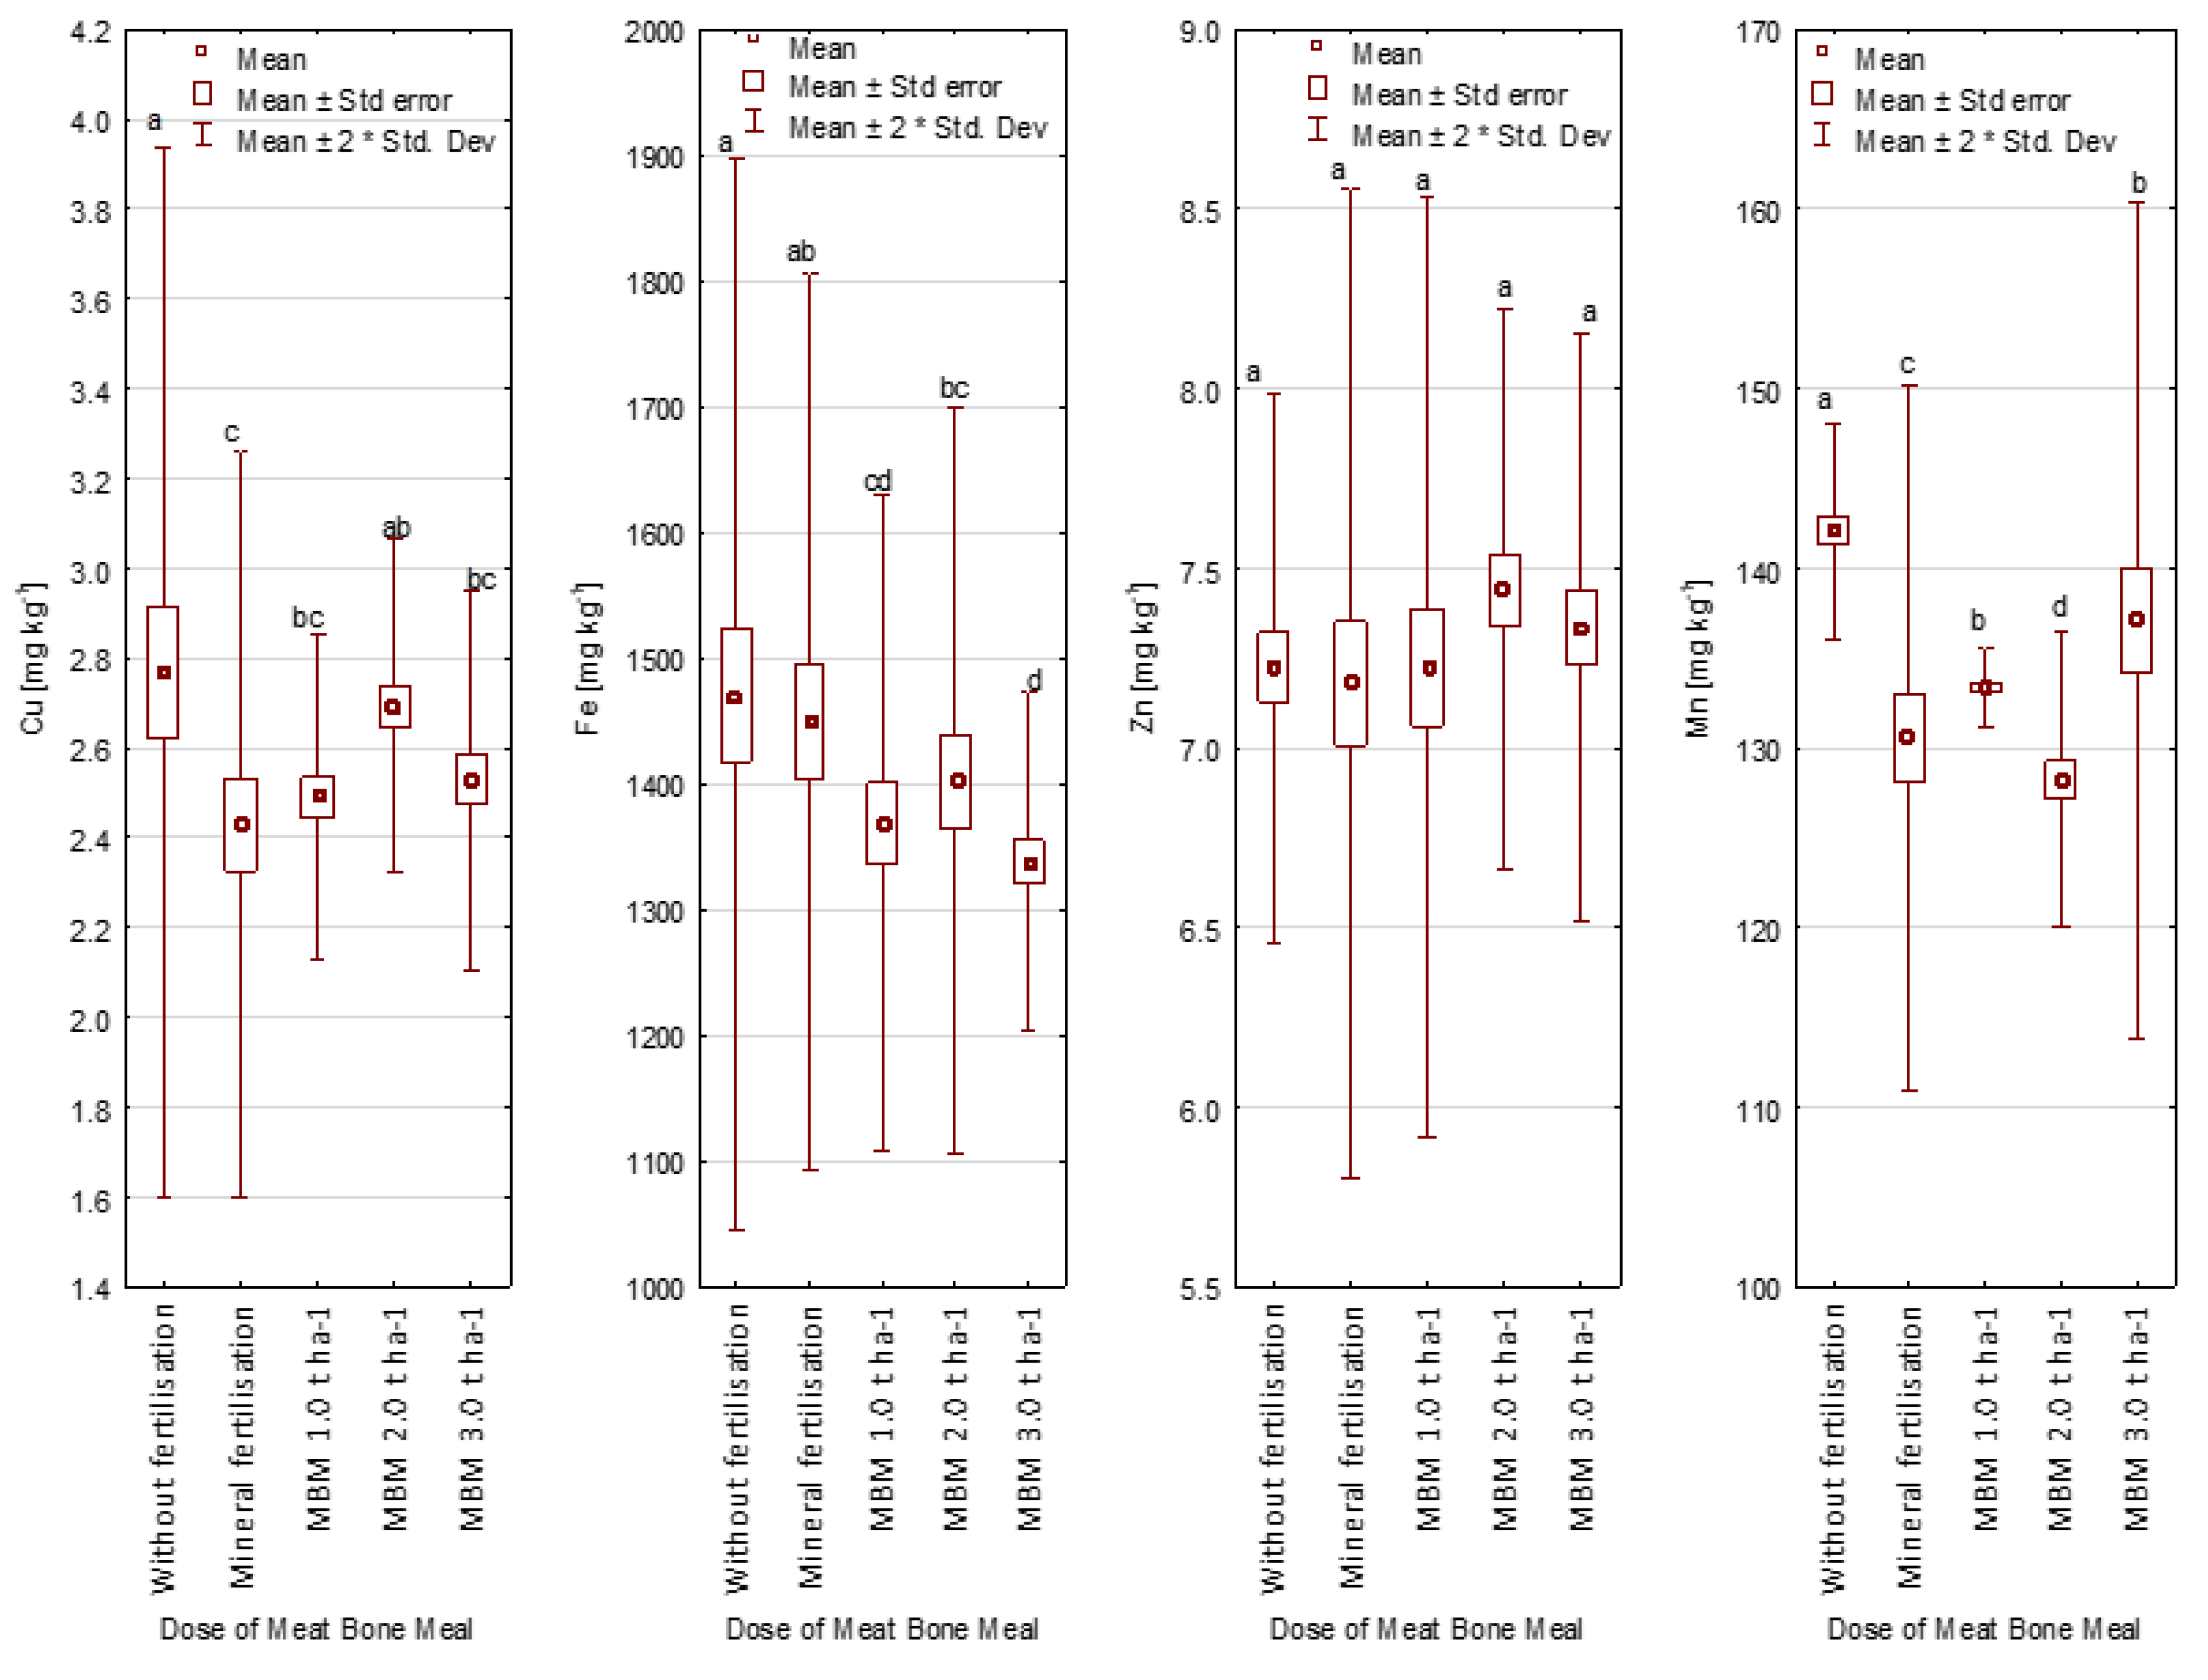
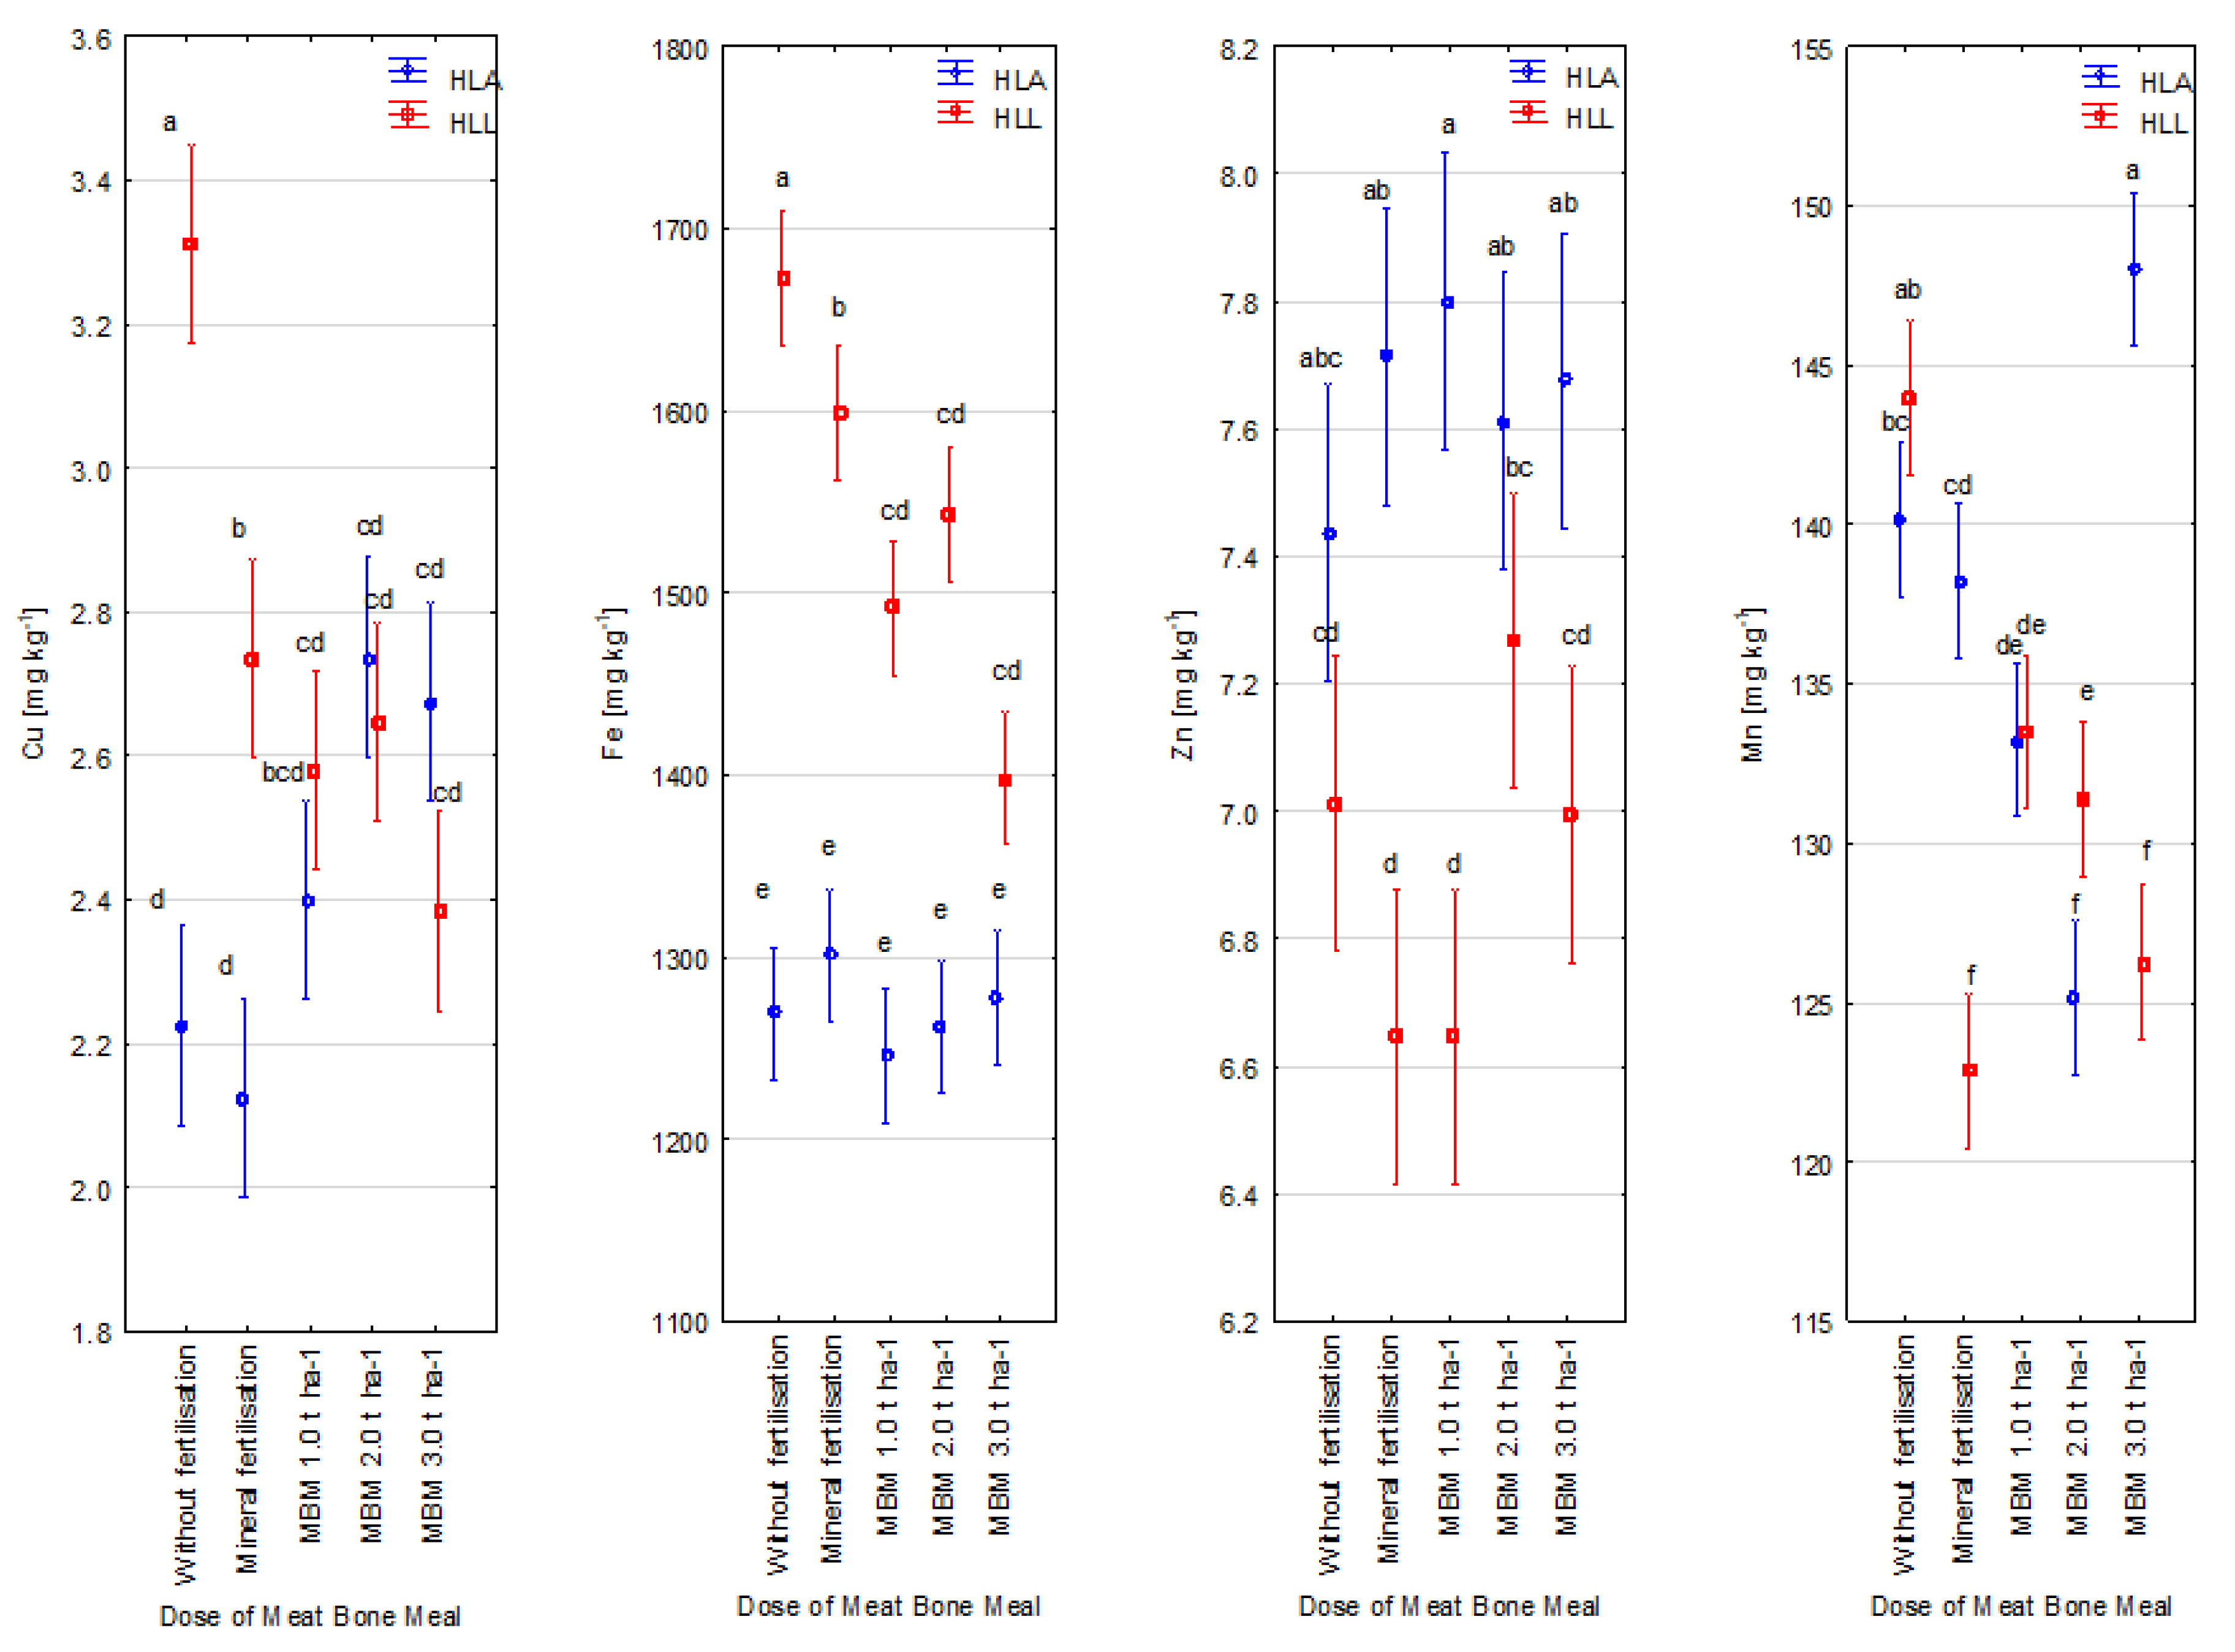
Figure 12.
Concentrations of Cu, Fe, Zn, and Mn in soil depending on meat and bone meal application, mg kg−1. a,b,c,d—statistically homogenous groups (Tukey’s test).
Figure 12.
Concentrations of Cu, Fe, Zn, and Mn in soil depending on meat and bone meal application, mg kg−1. a,b,c,d—statistically homogenous groups (Tukey’s test).
Figure 13.
Concentrations of Cu, Fe, Zn, and Mn in soil depending on soil type/meat and bone meal application, mg kg−1. a,b,c,d,e,f—statistically homogenous groups (Tukey’s test).
Figure 13.
Concentrations of Cu, Fe, Zn, and Mn in soil depending on soil type/meat and bone meal application, mg kg−1. a,b,c,d,e,f—statistically homogenous groups (Tukey’s test).
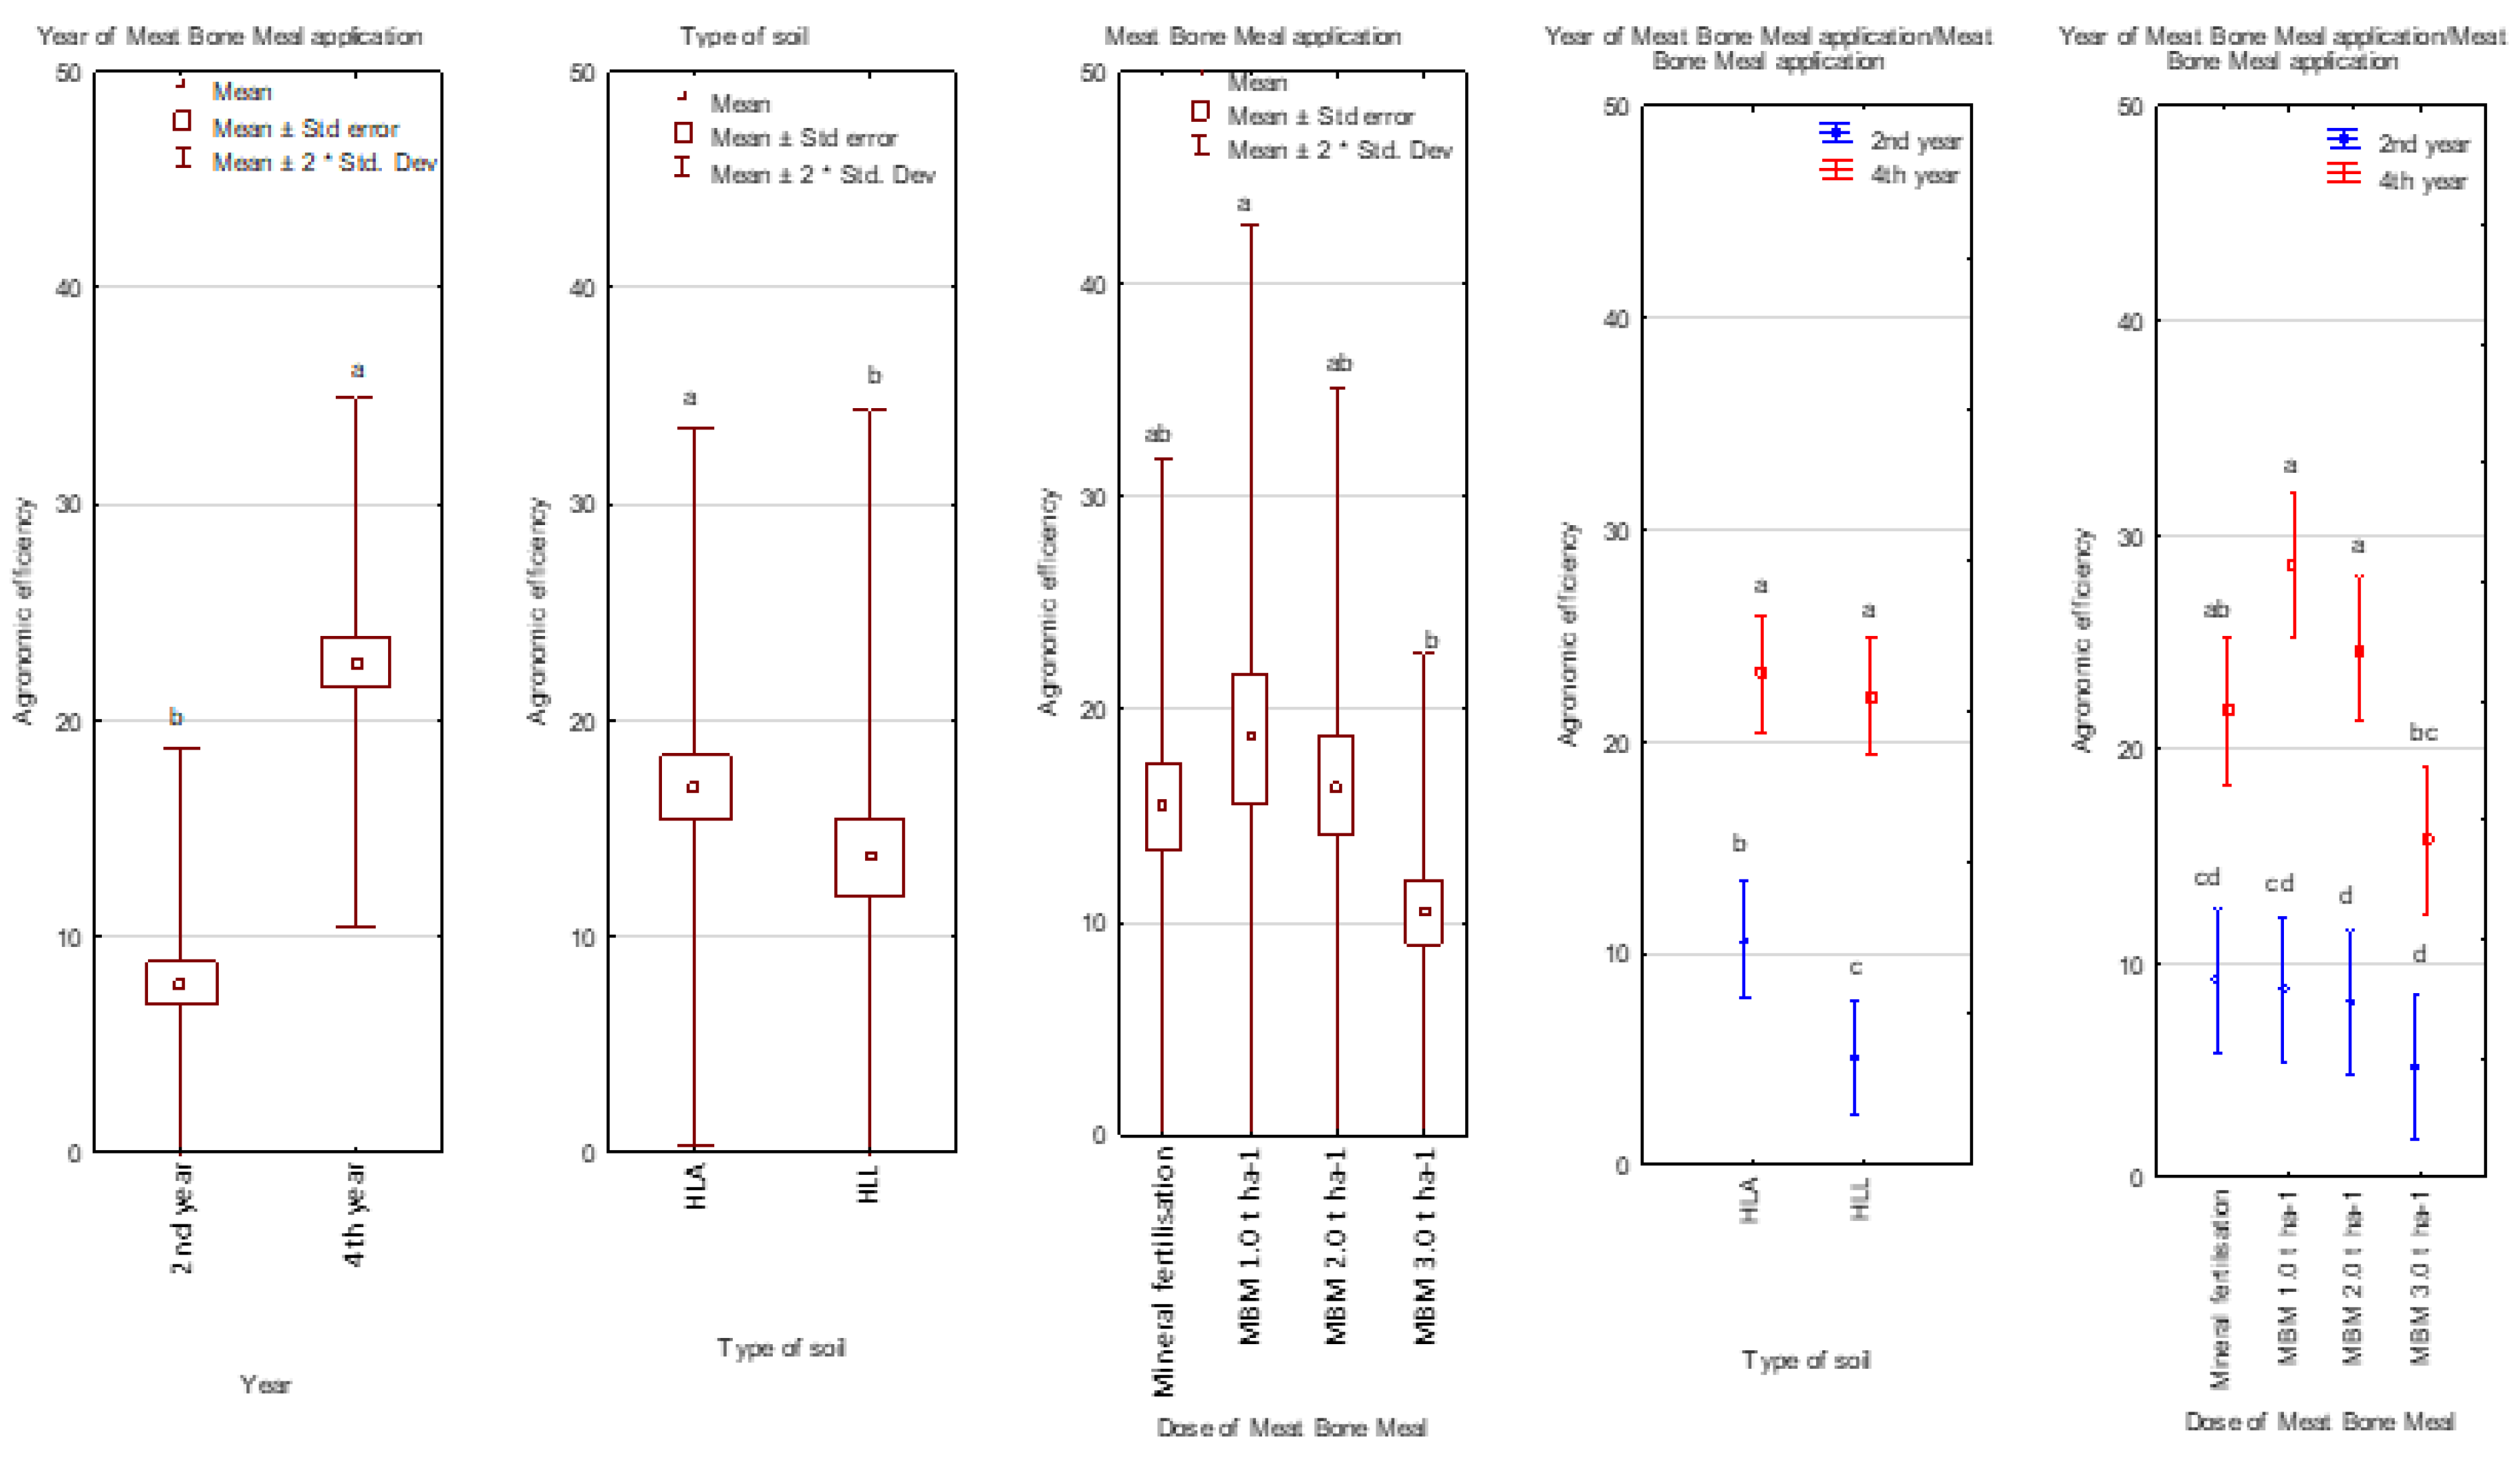
Figure 14.
Agronomic efficiency (AE) depending on the year of meat and bone meal application, soil type meat and bone meal application, year of meat and bone meal application/soil type year of meat and bone meal application/meat and bone meal application. a,b,c,d,e,f—statistically homogenous groups (Tukey’s test ); HLA—Haplic Luvisol Arenic soil; HLL—Haplic Luvisol Loamic soil.
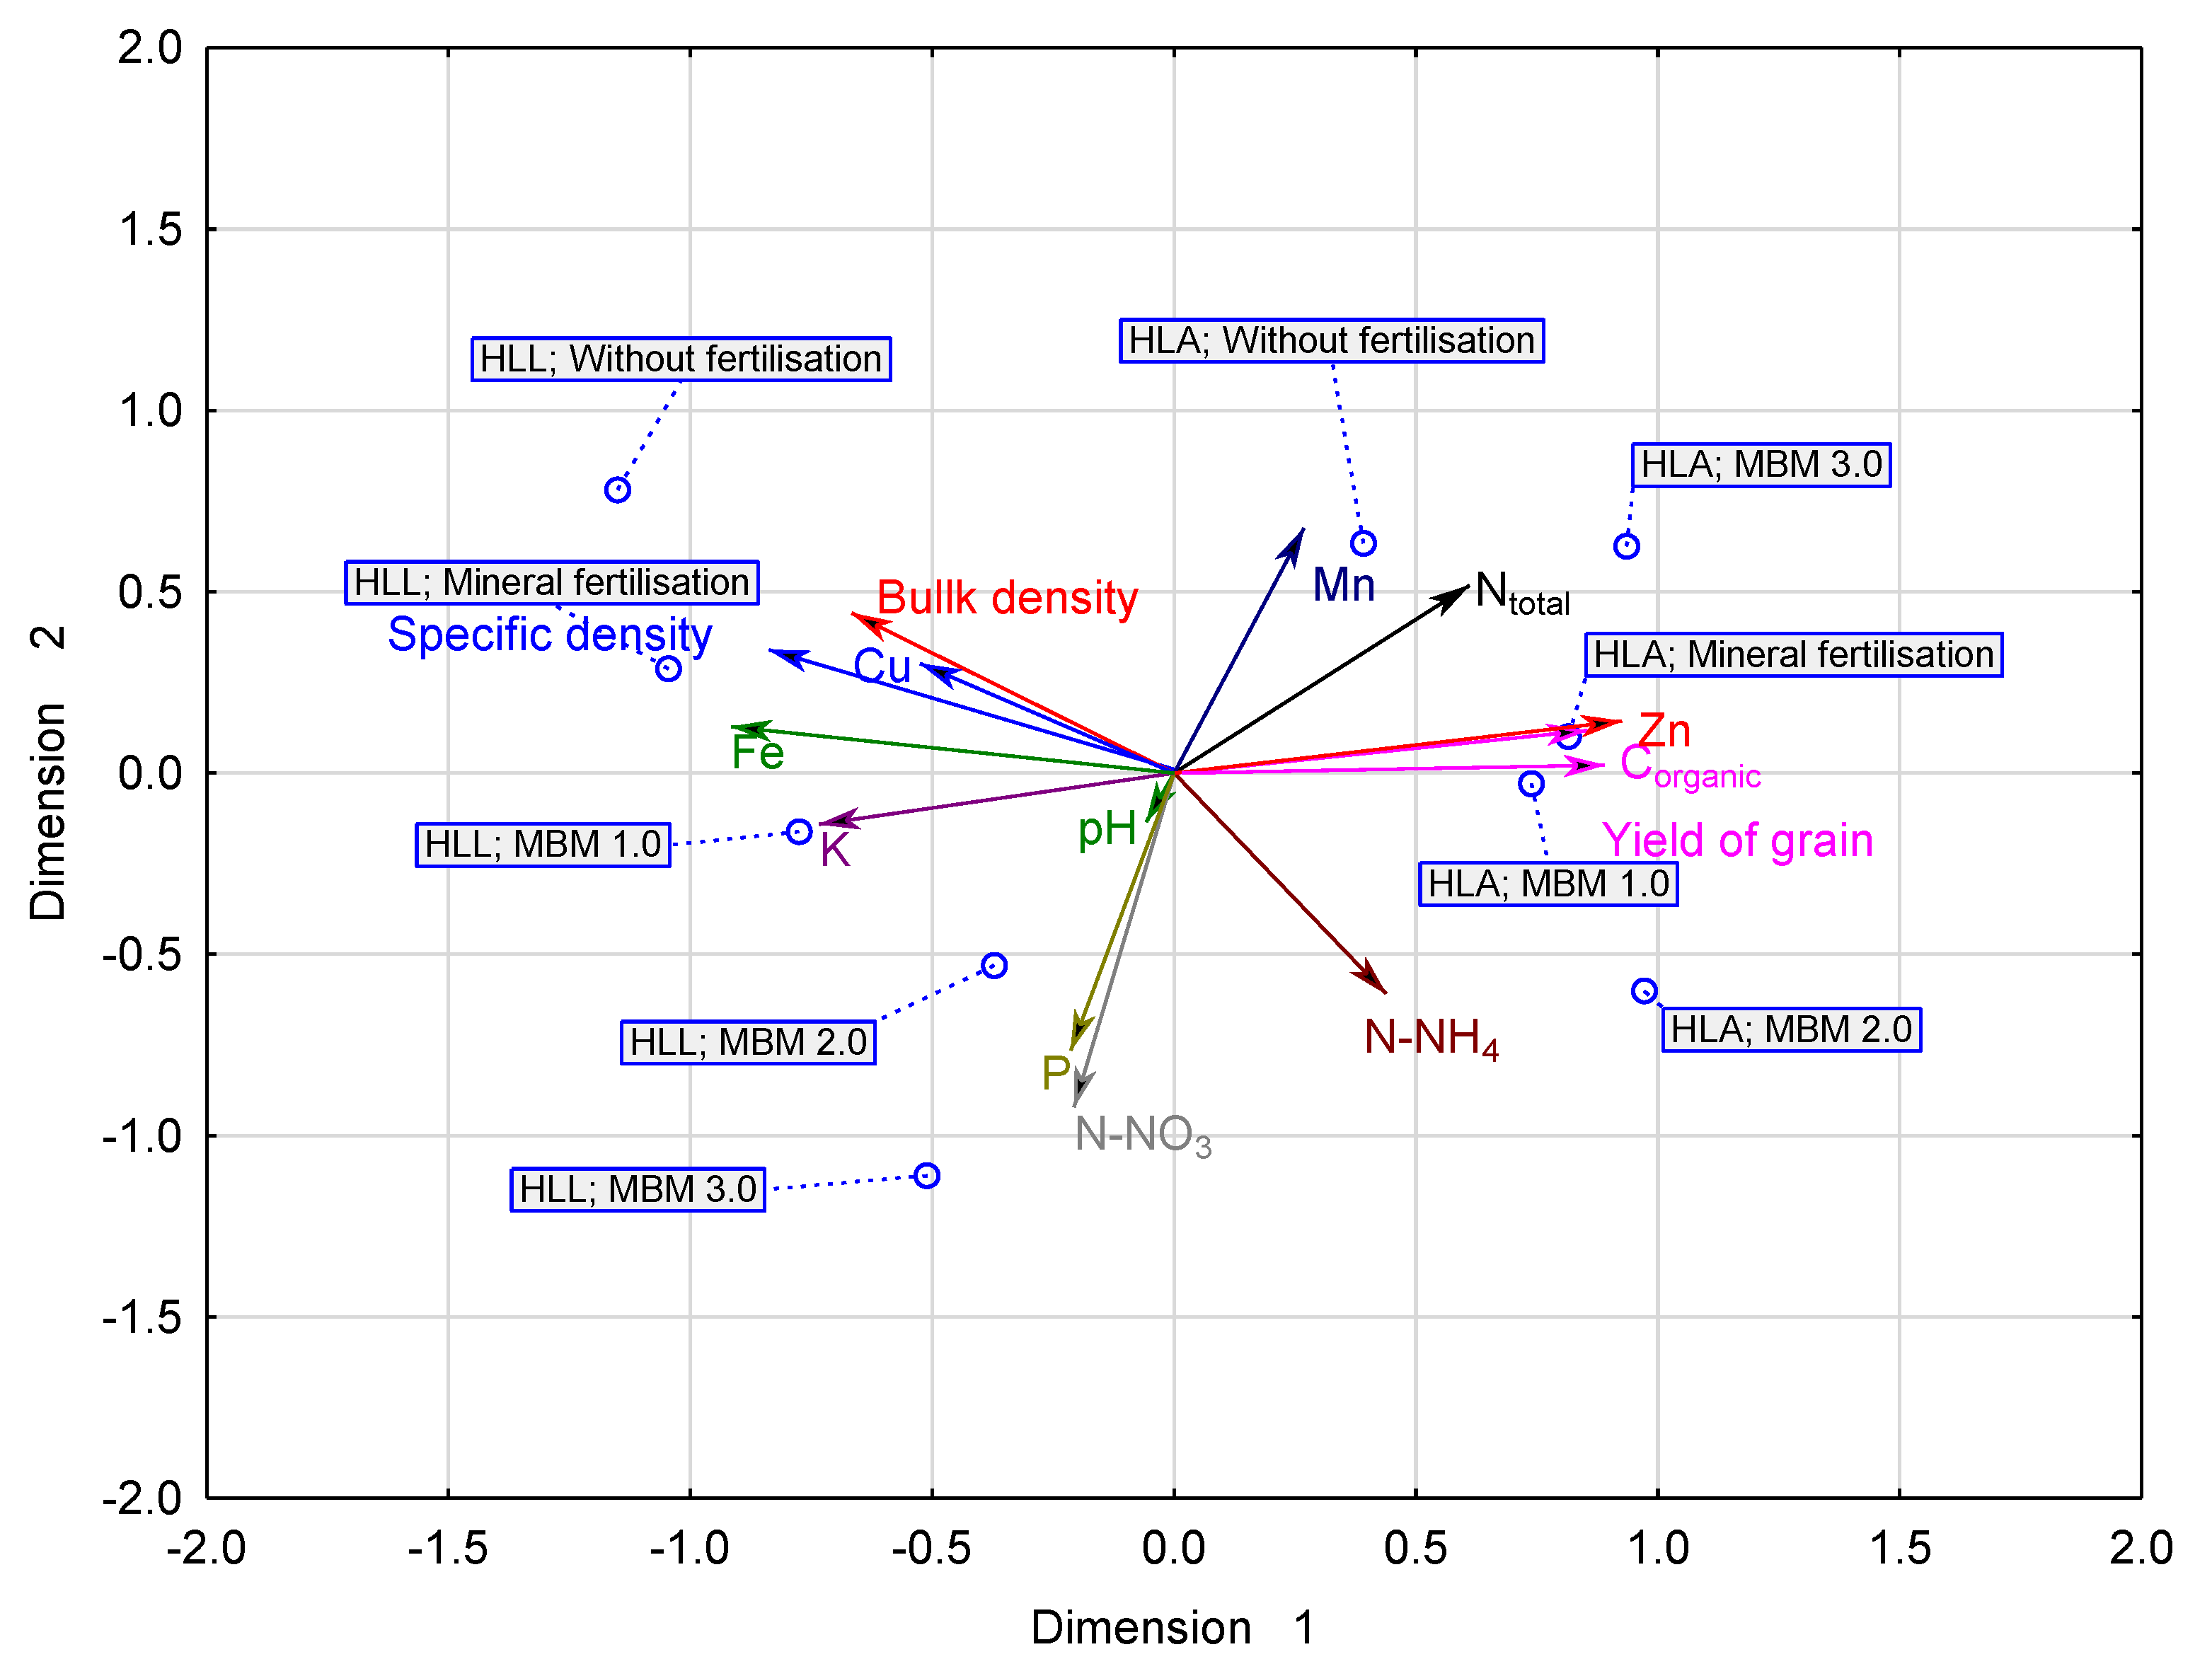
Figure 15.
Projection of the results of two-dimensional (PROFIT) analysis—2nd year of meat and bone meal application (2015). MBM—meat and bone meal; HLA—Haplic Luvisol Arenic soil; HLL—Haplic Luvisol Loamic soil.
Figure 15.
Projection of the results of two-dimensional (PROFIT) analysis—2nd year of meat and bone meal application (2015). MBM—meat and bone meal; HLA—Haplic Luvisol Arenic soil; HLL—Haplic Luvisol Loamic soil.
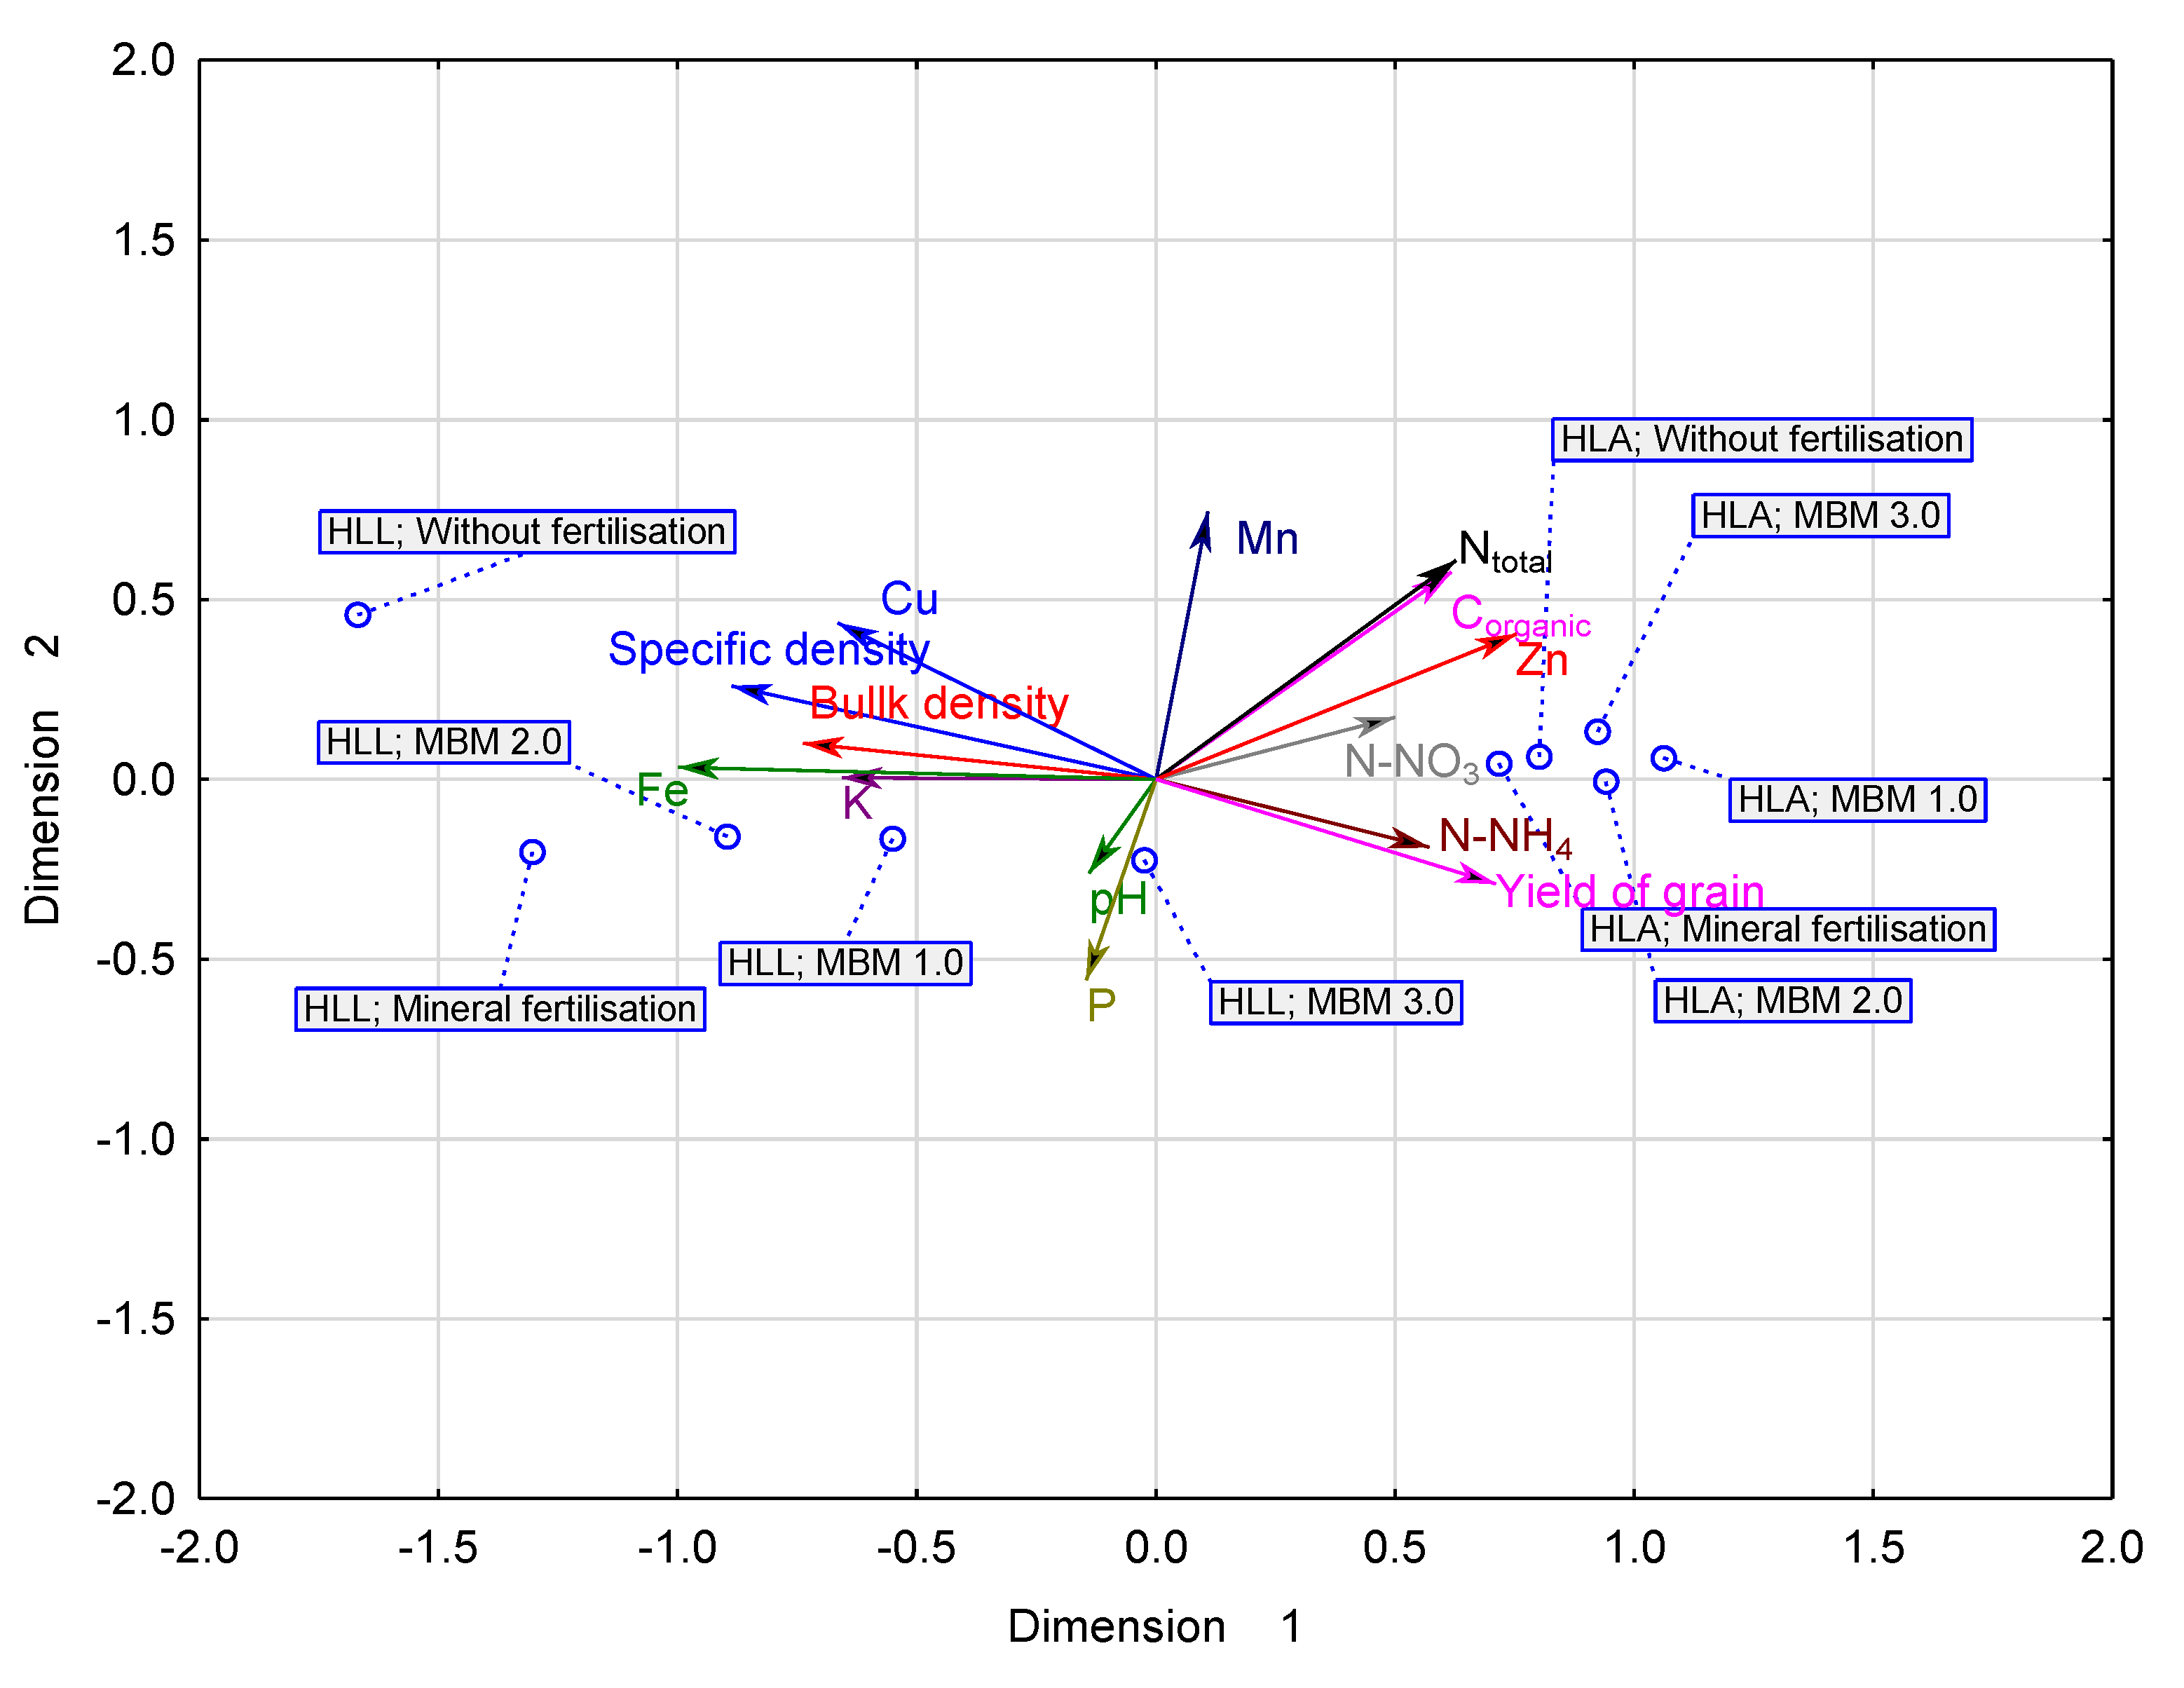
Figure 16.
Projection of the results of two-dimensional (PROFIT) analysis—4th year of meat and bone meal application (2017). MBM—meat and bone meal; HLA—Haplic Luvisol Arenic soil; HLL—Haplic Luvisol Loamic soil.
Figure 16.
Projection of the results of two-dimensional (PROFIT) analysis—4th year of meat and bone meal application (2017). MBM—meat and bone meal; HLA—Haplic Luvisol Arenic soil; HLL—Haplic Luvisol Loamic soil.
Table 1.
Design of the field experiment. The amount of micronutrients and macronutrients introduced to soil with fertilizers (mean of 2014–2017, kg ha−1). * MBM =meat and bone meal ** Kmin = mineral K.
Table 1.
Design of the field experiment. The amount of micronutrients and macronutrients introduced to soil with fertilizers (mean of 2014–2017, kg ha−1). * MBM =meat and bone meal ** Kmin = mineral K.
| Treatments | N | P | K | Mg | Ca | Cu | Fe | Zn | Mn |
|---|
| MBM * | Kmin. ** |
|---|
| Without fertilization | – | – | – | – | – | – | – | – | – | – |
| Mineral fertilization | 133.0 | 79.6 | – | 83.1 | – | – | – | – | – | – |
| Dose of Meat and Bone Meal | | | | | | | | | | |
| 1.0 t ha−1 (MBM 1.0) | 61.0 | 31.1 | 4.0 | 79.1 | 5.0 | 88.5 | 0.008 | 1.189 | 0.087 | 0.029 |
| 2.0 t ha−1 (MBM 2.0) | 122.0 | 62.2 | 8.0 | 75.1 | 10.0 | 177.0 | 0.016 | 2.378 | 0.174 | 0.058 |
| 3.0 t ha−1 (MBM 3.0) | 183.0 | 93.3 | 12.0 | 71.1 | 15.0 | 265.5 | 0.024 | 3.567 | 0.261 | 0.087 |
Table 2.
Granulometric composition of the soil.
Table 2.
Granulometric composition of the soil.
| Fraction Content (%) | Haplic Luvisol Arenic (HLA) | Haplic Luvisol Loamic (HLL) |
|---|
| Sand fraction Ø 1.0–0.1 | 70 | 60 |
| Coarse silt Ø 0.10–0.05 | 12 | 4 |
| Fine silt Ø 0.05–0.02 | 7 | 15 |
| Coarse clay Ø 0.02–0.006 | 3 | 6 |
| Fine clay Ø 0.06–0.002 | 5 | 9 |
| Colloidal clay Ø < 0.002 | 3 | 6 |
| Granulometric composition (PN-R-04033:1998 *) | loamy sand | sandy loam |
| Skeletal fraction Ø >20 (%) | 1.5 | 4.0 |
Table 3.
Physical and chemical properties of soil.
Table 3.
Physical and chemical properties of soil.
| Specification | Haplic Luvisol Arenic (HLA) | Haplic Luvisol Loamic (HLL) |
|---|
| Ash content (% DM) | 79.0 | 85.7 |
| Specific density (g cm−3) | 2.48 | 2.49 |
| Bulk density (g cm−3) | 1.69 | 1.72 |
| Total porosity (%) | 31.8 | 30.9 |
| Actual moisture % (%) | 27.3 | 27.2 |
| Air content )%) | 4.5 | 3.7 |
| pH in KCl | 4.71 | 4.89 |
| Ntotal (g kg−1) | 0.60 | 0.55 |
| Corganic (g kg−1) | 11.4 | 10.1 |
| P (g kg−1) | 0.30 | 0.33 |
| K (g kg−1) | 1.28 | 1.33 |
| Mn([mg kg−1) | 133 | 129 |
| Cu (mg kg−1) | 2.37 | 2.68 |
| Zn (mg kg−1) | 6.98 | 6.58 |
| Fe (mg kg−1) | 1263 | 1610 |
Table 4.
Descriptive statistics for the analyzed variables.
Table 4.
Descriptive statistics for the analyzed variables.
| Variable | Mean | Median | Modal | Variance |
|---|
| Specific density (g cm−3) | 2.54 | 2.50 | 2.49 | 0.01 |
| Bulk density (g cm−3) | 1.57 | 1.60 | multimodal | 0.02 |
| pH | 4.71 | 4.70 | 4.70 | 0.05 |
| Corganic (g kg−1) | 11.6 | 11.5 | 10.5 | 1.95 |
| Ntotal (g kg−1) | 0.767 | 0.780 | multimodal | 0.02 |
| N-NO3 (mg kg−1) | 2.63 | 2.19 | multimodal | 1.28 |
| N-NH4 (mg kg−1) | 1.96 | 1.90 | multimodal | 0.83 |
| P (mg kg−1) | 78.3 | 75.4 | 75.4 | 258 |
| K (mg kg−1) | 101 | 104 | multimodal | 336 |
| Cu (mg kg−1) | 2.58 | 2.50 | 2.50 | 0.14 |
| Fe (mg kg−1) | 1405 | 1325 | 1278 | 25,367 |
| Zn (mg kg−1) | 7.28 | 7.30 | 7.80 | 0.27 |
| Mn (mg kg−1) | 134 | 134 | 133 | 73.4 |
| Maize grain yield (t ha−1) | 3.94 | 3.91 | multimodal | 1.87 |
| Agronomic efficiency (AE)(-) | 15.3 | 15.2 | multimodal | 89.1 |
Table 5.
Results of one-way analysis of variance; relationships among the physicochemical properties of two types of soil, maize grain yield, agronomic efficiency, and meat and bone meal application.
Table 5.
Results of one-way analysis of variance; relationships among the physicochemical properties of two types of soil, maize grain yield, agronomic efficiency, and meat and bone meal application.
| Source of Variation | BD 1 | SD 2 | pH | Corganic | Ntotal | N–NO3 | N–NH4 | P | K | Cu | Fe | Zn | Mn | YG 3 | AE 4 |
|---|
| Year of MBM 5 application | n.s. | n.s. | n.s. | ** | ** | ** | ** | ** | ** | n.s. | ** | ** | ** | ** | ** |
| Soil type | ** | ** | * | ** | ** | n.s. | ** | ** | ** | ** | ** | ** | ** | ** | ** |
| MBM application | ** | ** | ** | ** | * | ** | ** | ** | ** | ** | ** | n.s. | ** | ** | ** |
| Year of MBM application/soil type | n.s. | n.s. | n.s. | n.s. | n.s. | ** | ** | n.s. | n.s. | n.s. | n.s. | n.s. | n.s. | * | n.s. |
| Year of MBM application/MBM application | n.s. | n.s. | n.s. | * | n.s. | ** | ** | n.s. | n.s. | n.s. | n.s. | n.s. | n.s. | ** | * |
| Soil type/MBM application | ** | ** | ** | ** | ** | ** | ** | ** | ** | ** | ** | ** | ** | n.s. | n.s. |
| Year of MBM application/soil type/MBM application | n.s. | n.s. | n.s. | * | n.s. | ** | ** | n.s. | n.s. | n.s. | n.s. | n.s. | n.s. | n.s. | n.s. |
Table 6.
Concentration of organic carbon in the soil, depending on the year of meat and bone meal application and soil type/meat and bone meal application, g kg−1.
Table 6.
Concentration of organic carbon in the soil, depending on the year of meat and bone meal application and soil type/meat and bone meal application, g kg−1.
| Year/Meat and Bone Meal Application | Haplic Luvisol Arenic Soil | Haplic Luvisol Loamic Soil |
|---|
| 2015/Without fertilization | 1.11 d–h | 1.18 c–h |
| 2015/Mineral fertilization | 0.93 i | 1.23 a–e |
| 2015/MBM 1.0 t ha−1 | 0.96 hi | 1.29 abc |
| 2015/MBM 2.0 t ha−1 | 1.15 b–g | 1.24 a–d |
| 2015/MBM 3.0 t ha−1 | 1.05 ghi | 1.33 a |
| 2017/Without fertilization | 1.23 a–f | 1.12 c–h |
| 2017/Mineral fertilization | 1.09 f–i | 1.30 ab |
| 2017/MBM 1.0 t ha−1 | 0.98 ghi | 1.33 a |
| 2017/MBM 2.0 t ha−1 | 1.06 e–i | 1.27 abc |
| 2017/MBM 3.0 t ha−1 | 1.14 b–g | 1.37 a |
Table 7.
Concentration of mineral nitrogen (N–NO3, N–NH4) in soil depending on the year of meat and bone meal application/soil type/meat and bone meal application, mg kg−1.
Table 7.
Concentration of mineral nitrogen (N–NO3, N–NH4) in soil depending on the year of meat and bone meal application/soil type/meat and bone meal application, mg kg−1.
| Year/Meat and Bone Meal Application | N–NO3 | N–NH4 |
|---|
| Haplic Luvisol Arenic Soil | Haplic Luvisol Loamic Soil | Haplic Luvisol Arenic Soil | Haplic Luvisol Loamic Soil |
|---|
| 2015/Without fertilization | 2.09 fgh | 1.28 h | 1.19 gh | 1.15 gh |
| 2015/Mineral fertilization | 2.10 fgh | 2.24 e–h | 1.26 gh | 1.96 de |
| 2015/MBM 1.0 t ha−1 | 3.43 cd | 3.08 c–f | 1.66 ef | 2.09 d |
| 2015/MBM 2.0 t ha−1 | 4.05 bc | 3.17 cde | 1.38 fg | 3.30 a |
| 2015/MBM 3.0 t ha−1 | 5.40 a | 2.05 gh | 1.88 de | 1.07 h |
| 2017/Without fertilization | 2.16 e–h | 1.64 gh | 1.23 gh | 2.68 b |
| 2017/Mineral fertilization | 1.50 gh | 2.23 e–h | 0.46 i | 3.60 a |
| 2017/MBM 1.0 t ha−1 | 1.99 gh | 3.18 cde | 2.14 cd | 2.48 bc |
| 2017/MBM 2.0 t ha−1 | 2.00 gh | 4.83 b | 1.88 de | 3.28 a |
| 2017/MBM 3.0 t ha−1 | 1.80 gh | 2.42 d–g | 3.49 a | 1.00 h |


