Article

Impact of Biochar Application on Ammonia Volatilization from Paddy Fields under Controlled Irrigation

1
College of Agricultural Science and Engineering, Hohai University, Nanjing 210098, China
2
State Key Laboratory of Hydrology-Water Resources and Hydraulic Engineering, Hohai University, Nanjing 210098, China
3
People’s Government of Zhaoguan Town, Hanshan County, Maanshan 238184, China
4
Cooperative Innovation Center for Water Safety & Hydro Science, Hohai University, Nanjing 210098, China
*
Author to whom correspondence should be addressed.
Sustainability 2022, 14(3), 1337; https://doi.org/10.3390/su14031337
Submission received: 31 December 2021 / Revised: 20 January 2022 / Accepted: 21 January 2022 / Published: 25 January 2022

Abstract

:
Ammonia volatilization is an important nitrogen loss pathway in the paddy field ecosystem which leads to low nitrogen-utilization efficiency and severe atmospheric pollution. To reveal the influence and the mechanism of biochar application on ammonia volatilization from paddy fields under controlled irrigation, field experiments were conducted in the Taihu Lake Basin in China. The experiment consisted of three levels of biochar application (0, 20, and 40 t·ha−1) and two types of irrigation management (controlled irrigation and flood irrigation). Increasing ammonia volatilization occurred after fertilization. Biochar application reduced the cumulative ammonia volatilization from controlled-irrigation paddy fields, compared with non-biochar treatment. The cumulative ammonia volatilization in controlled-irrigation paddy fields with 40 t·ha−1 biochar application was reduced by 12.27%. The decrease in ammonia volatilization was related to the change in soil physical and soil physical–chemical properties and soil microbial activities. The high biochar application (40 t·ha−1) increased the NH4+-N content in soil (p < 0.01) and soil solution (p <0.05), increased by 64.98% and 19.72%, respectively. The application also increased the soil urease activity (p < 0.01), and high biochar application (40 t·ha−1) increased soil urease activity by 33.70%. Ammonia volatilization from paddy fields was significantly correlated with the nitrogen concentration (p < 0.01) in the soil solution and soil urease activity (p < 0.05). Meanwhile, the abundance of ammonia monooxygenase subunit A (AOA) and ammonia-oxidizing bacteria (AOB) with biochar application under controlled irrigation showed an increasing trend with rice growth. The long-term application of biochar may have a relatively strong potential to inhibit ammonia volatilization. In general, the combined application of controlled irrigation and biochar provides an eco-friendly strategy for reducing farmland N loss and improving paddy field productivity.

1. Introduction

A large amount of nitrogen fertilizer is often used in crop production to ensure the quantity and quality of food production to satisfy the growing population’s demand. Over the past 49 years, the production of agricultural food in China has increased by 3.4 times, which is partly attributed to a 37-fold increase in nitrogen fertilization [1]. However, the excessive application of nitrogen fertilizer is contrary to their low utilizing efficiency in China. A considerable amount of nitrogen fertilizer is lost to the environment annually, accounting for 50–70% of the total applied fertilizers, which causes seriously adverse impacts on the global nitrogen cycle [2]. The nitrogen is lost gradually through ammonia volatilization, nitrification-denitrification, nitrate leaching, and runoff [3]. Ammonia volatilization is the main pathway of nitrogen loss in the paddy field ecosystem. The nitrogen loss from ammonia volatilization within 10 days after fertilization is 0.5–19.7% of the nitrogen application [4]. The accumulative ammonia volatilization during the rice growth period accounts for 17.95–28.64% of the nitrogen application [5]. Ammonia volatilized into the atmosphere is a substantial source of soil acidification and water eutrophication [6]. Furthermore, ammonia trapped in the atmosphere destroys the ozone layer [7]. Ammonia volatilization not only causes a large waste of resources but also produces serious environmental pollution.
Through the background of climate change, environmental pollution, energy shortage, and agricultural sustainable development in recent years, biochar has attracted wide attention for its carbon sequestration and emission reduction, soil improvement [8], and environmental remediation [9,10,11,12,13]. Biochar is a solid product derived from the pyrolysis of bio-organic materials (also known as biomass) in an anaerobic or hypoxic environment [14]. It has been noted that biochar has a large number of pores on its surface and has a strong adsorption capacity for water and gas, which is also conducive to the maintenance of nutrients such as N, P, and K [15,16]. Additionally, biochar addition can promote crop growth due to efficient utilization of nutrients in soil, the optimization of soil physical and chemical properties, and the reduction in heavy metal toxicity [17,18]. Moreover, research has shown that the ammonium concentration on the surface of the field is positively correlated with ammonia volatilization [19,20]. Nitrogen adsorption by biochar may affect the process of soil nitrogen transformation and ammonia-volatilization loss [21]. Reports indicated that, under fertilized treatments, applying cotton stalk-derived biochar could result in a 9.90% reduction in soil NH4+-N concentrations and a 40.59% reduction in ammonia volatilization in drip-irrigated cotton fields [22]. With the large-scale application of water-saving irrigation technology, the ecological environment of rice fields has changed [23], which would affect the variation of ammonia volatilization. Controlled irrigation is one of the water-saving irrigation technologies. Recent research has shown that the ammonia volatilization in paddy fields under water-saving irrigation has reduced by 20.37 kg·ha−1, 13.99% lower than that under flood irrigation [24]. Different from the traditional flood-irrigation fields, the soil of controlled-irrigation fields is in the unsaturated state during most of the growth period. Water and heat conditions of the two irrigation methods are different. The redox potential, microbial populations, and enzyme activities have been changed under controlled irrigation, thereby affecting the transformation of nitrogen. On this basis, the capacity of biochar in adsorbing ammonia and the subsequent ammonia volatilization is still unknown.
Published studies on the effect of biochar application in the rice field and its impact on the farmland environment have mainly focused on the paddy field under flooding irrigation [25], with few studies on controlled-irrigation conditions. The effects of biochar application in paddy fields under controlled irrigation, including their impacts on the ammonia volatilization and the physical and chemical conditions of the soil, are still unclear with the large-scale popularization of water-saving technology. The mechanism of biochar application on ammonia volatilization in paddy fields under controlled irrigation requires further study. Therefore, our study explored the application of biochar in paddy fields with controlled-irrigation technology, simultaneously monitoring the inorganic nitrogen concentration in the surface soil solution, soil inorganic nitrogen content, urease activity, bacteria quantity, and ammonia-volatilization flux during the rice planting season. The objectives of this experiment were to: (1) determine the variation of ammonia volatilization with biochar under controlled irrigation;(2) analyze the relationship between other influencing factors (environmental properties and ammonia-oxidizing microorganism) and ammonia volatilization in paddy fields; and (3) reveal the mechanism of the effect of biochar application on ammonia-volatilization loss in paddy fields under controlled irrigation.

2. Materials and Methods

2.1. Experimental Site

Experiments were conducted in lysimeters at the Kunshan Experiment Station in Suzhou, Jiangsu Province (34° 15′21″ N, 121° 05′22″ E). This station is located in the Taihu Lake Region of China, with dense rivers and flat terrain. This region has a subtropical monsoon climate with an average annual temperature of 15.5 °C, annual precipitation of 1097.1 mm, annual evaporation of 1365.9 mm, sunshine duration of 2085.9 h, and an average frost-free period of 234 d. The rice and wheat rotation cropping system is prevalent in the local area. The study was carried out during the rice growth period. The average wind speed was 1.467 mph and the relative humidity was 81.29% during the experiment in 2018. The soil type of the experiment site was dark-yellow hydromorphic paddy soil. The soil texture in the plowed layer in the top 20 cm was heavy loam with a bulk density of 1.30 g·cm−3, organic matter of 21.71 g·kg−1, total nitrogen of 1.79 g·kg−1, total phosphorus of 1.4 g·kg−1, total potassium of 20.86 g·kg−1, and pH of 7.4.

2.2. Experimental Design

The experiment consisted of three biochar application amounts (0, 20, and 40 t·ha−1) under controlled irrigation (namely, CA, CB, CC) and 40 t·ha−1 biochar application under flood irrigation (namely, FC). Each treatment was conducted in triplicate in twelve lysimeters (2.5 m × 2 m). Rice-straw biochar, which was well mixed in topsoil (0–20 cm) before the rice transplanting in 2016, contained 42.6% carbon and 0.75% nitrogen, with a pH of 10.1. The controlled-irrigation treatment only preserved a shallow water layer in the field in the regreening stage, but no water layer in other growth stages. The irrigation times and volumes were based on the combination of 60–80% of saturated soil moisture content in the root-growing soil layer [26]. Flood irrigation was managed according to local rice planting habits. The water layers of 3–5 cm were maintained on the surface of the field except the drainage process in the late tillering stage and natural drying in the ripening stage [24].
The experimental rice was Nanjing 46. It was transplanted at 250 mm × 130 mm spacing on June 26 and harvested on October 25 in 2018. The fertilization process was conducted under local rice cultivation practices with 312.69 kg N ha−1, 63.00 kg P2O5 ha−1, and 89.25 kg K2O ha−1 during the entire growing period. Other management measures, such as weeding and pest control, were consistent with the local habits.

2.3. Sampling and Measurement

Ammonia volatilization was collected by the venting method [27] at 1, 2, 3, 5, 7, 12, and 17 d after each fertilization until the next fertilization or until NH3 became undetectable. A rigid polyvinyl chloride plastic pipe and two pieces of sponge impregnated with glycerol phosphate made up the capture device to collect ammonia in the field. KCl solution was used to extract ammonia absorbed in the lower sponge. Thus, the ammonia-volatilization flux in paddy fields could be calculated by measuring the NH4+-N concentration in KCl extracting solution as follows:
N H 3 N ( k g h a 1 d 1 ) = M A × D × 10 2
where M is the average ammonium nitrogen content (mg) of a single device through the venting method, A is the cross-sectional area (m2) of the capture device, and D is the time (D) of each continuous capture.
Before rice transplanting, soil solution samplers were embedded in each plot and approximately 150 mL of soil solution was extracted from controlled-irrigation treatment. Equivalent surface water was extracted from flood-irrigation treatment by syringe. The water sampling frequency was synchronized with ammonia-volatilization sampling. After the soil solution was filtered, the concentrations of ammonium nitrogen (NH4+-N), nitrate nitrogen (NO3-N), and total nitrogen (TN) were determined according to the indophenol blue method, ultraviolet-spectrophotometer assay, and alkaline potassium persulfate digestion-UV spectrophotometric methods, respectively [28]. Soil samples were obtained by applying the multi-point mixing method six times (before rice transplanting, tillering stage, jointing–booting stage, milk-ripe stage, ripening stage, and postharvest). Part of the soil samples was extracted by 1 mol·L−1 KCl solution to determine the NH4+-N and NO3−-N contents. Another part of the samples was air-dried and used to determine soil urease content by phenol-sodium hypochlorite colorimetry. In addition, 0~20 cm topsoil samples were obtained by applying the multi-point mixing method in each field plot in July, August, and September, obtaining a total of 36 soil samples (three repetitions for each treatment). After sieving (<2 mm), the soil samples were stored at −80 °C for real-time fluorescence PCR and high-throughput sequencing. Microbial DNA was extracted from soil samples using the E.Z.N.A.® Soil DNA Kit (Omega Bio-Tek, Norcross, GA, USA) according to the manufacturer’s protocols. The ammonia monooxygenase subunit A (AOA) and ammonia-oxidizing bacteria (AOB) were amplified by PCR using Arch-amoAF/Arch-amoAR and amoA-1F/amoA-2R [29] primers. The amplicon library was paired-end sequenced on an Illumina HiSeq 2500 System sequencing platform (Illumina Inc., San Diego, CA, USA) according to the standard protocols [30].

2.4. Statistical Analysis

Experiment data of the inorganic nitrogen concentration in the surface soil solution, soil inorganic nitrogen content, urease activity, bacteria quantity, and ammonia-volatilization flux were analyzed by Excel 2007 and SPSS 22.0 software. Significance for the difference of results among treatments was calculated based on the least significant difference (LSD) test at the 1% and 5% levels. Correlation between ammonia-volatilization flux and other influencing factors was analyzed with the Pearson test (two-tailed) at p = 0.01 or 0.05.

3. Results

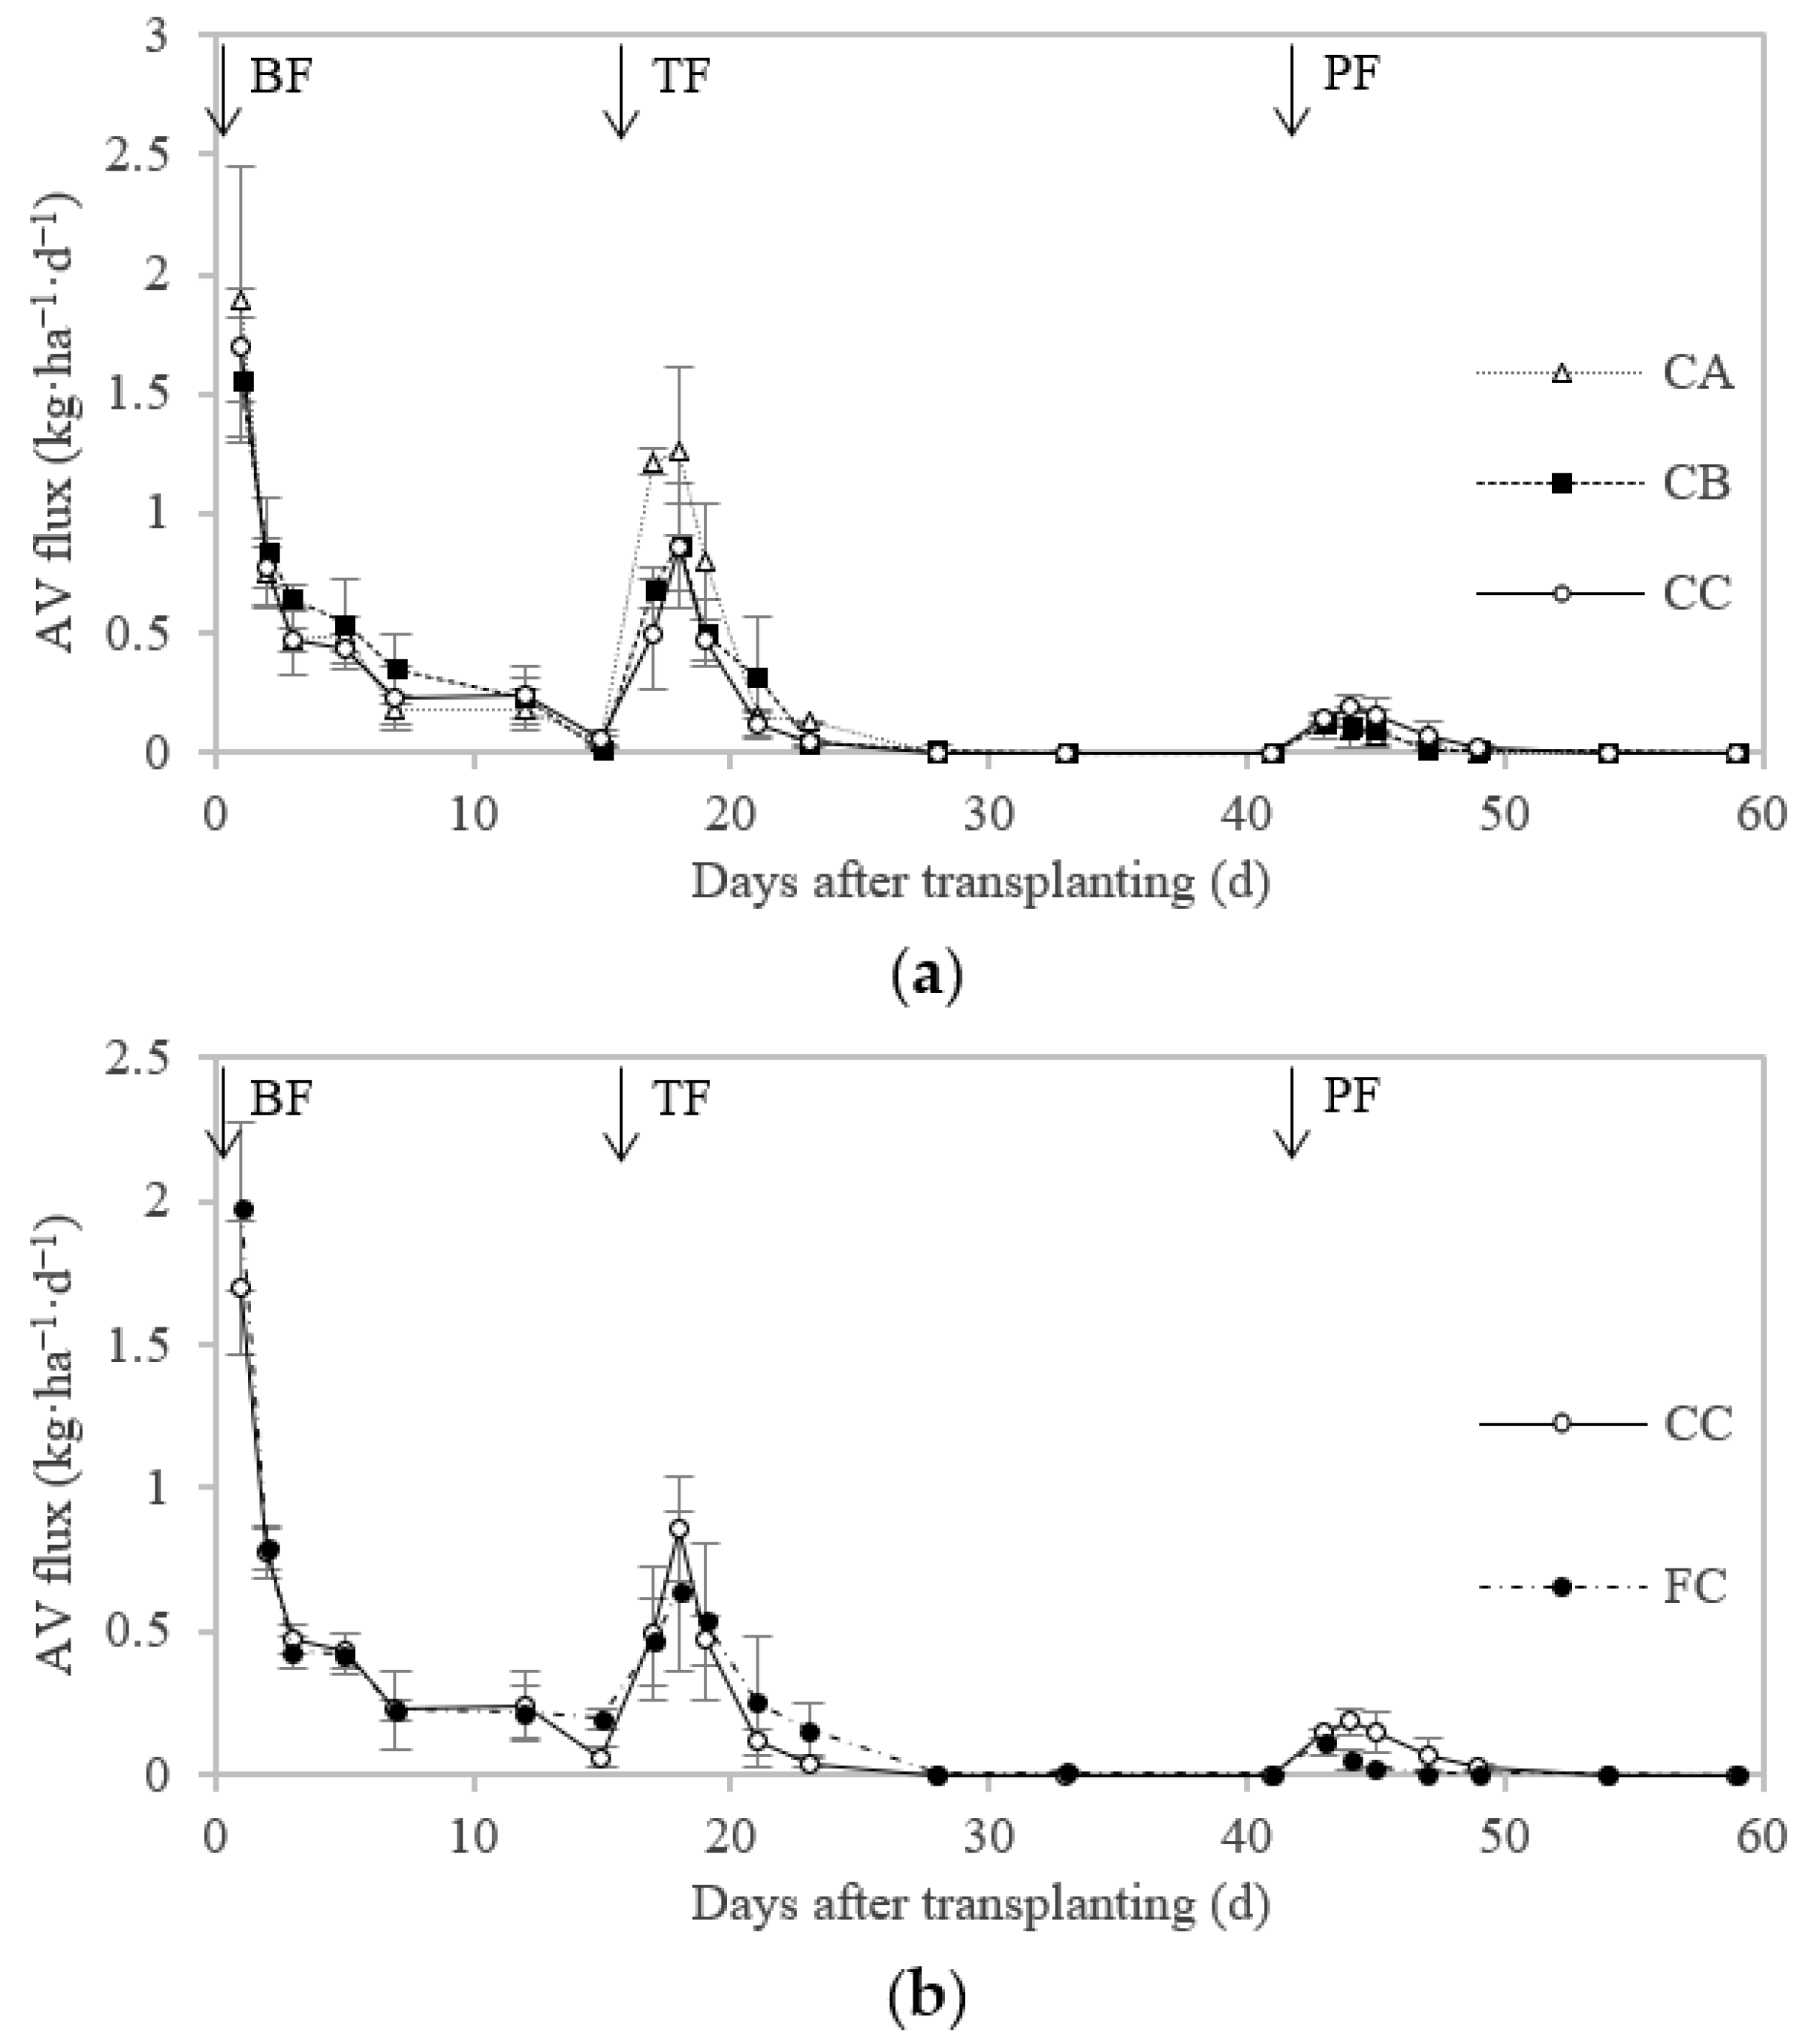
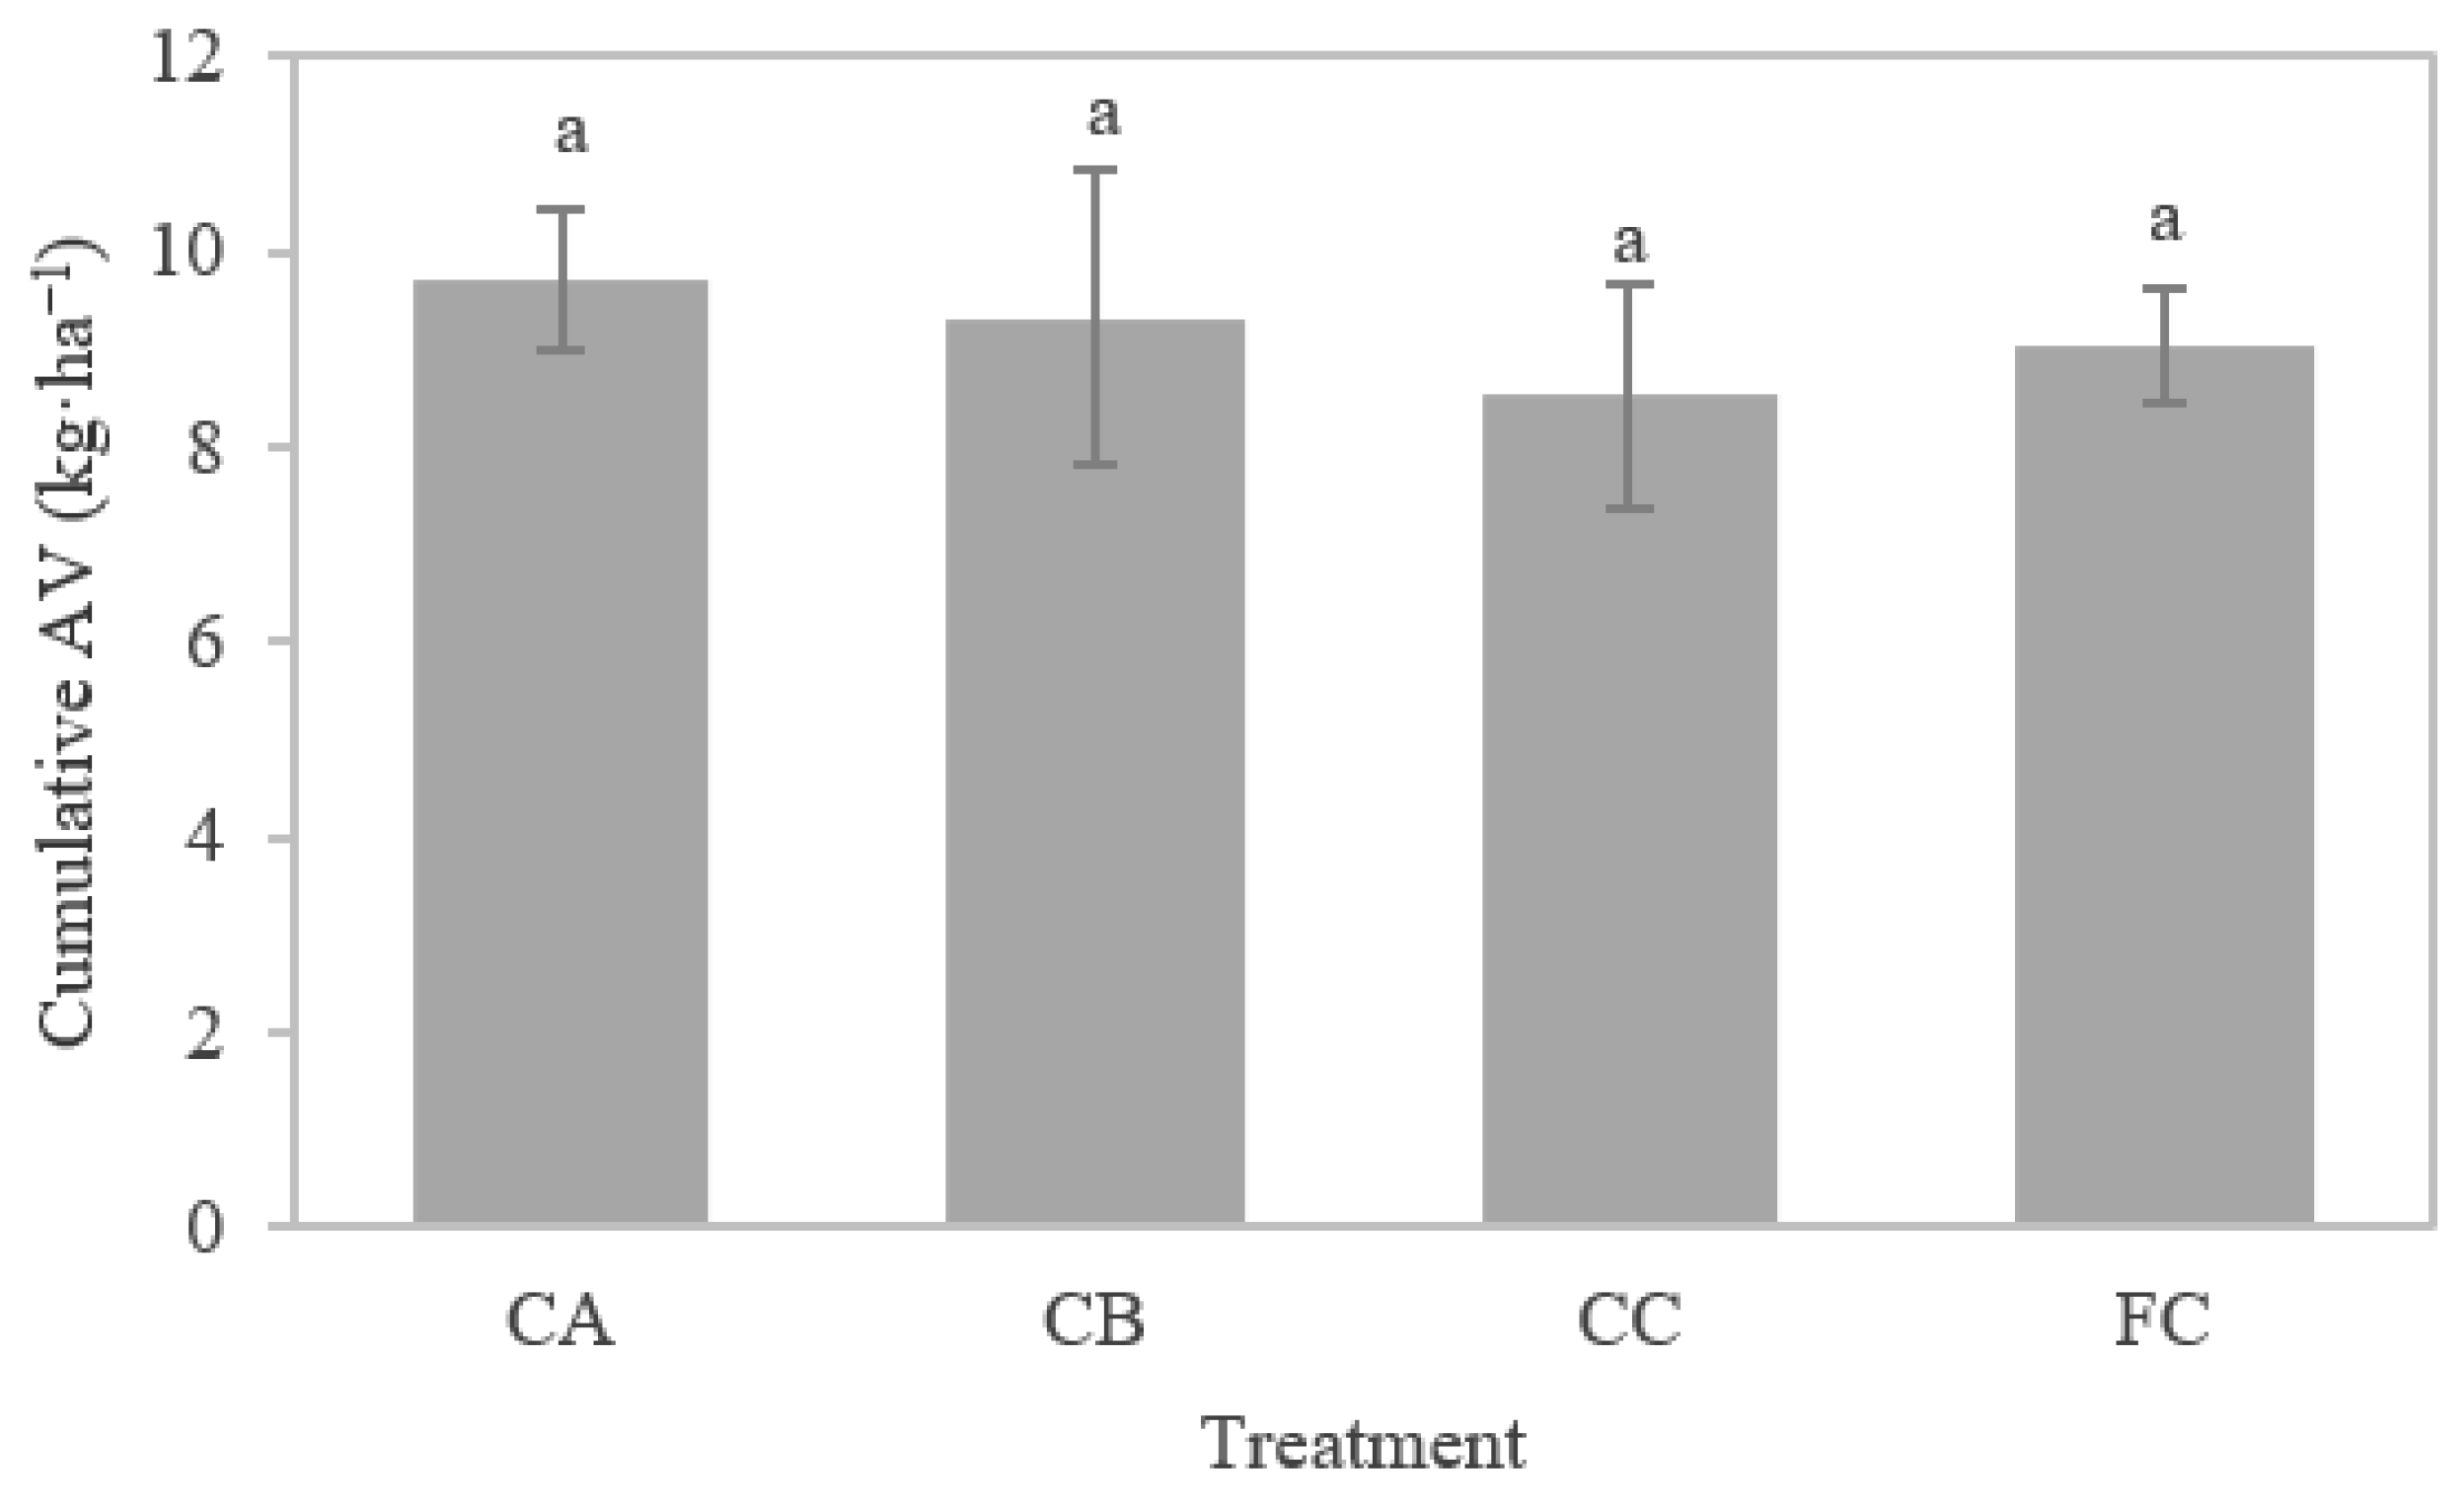
3.1. Ammonia Volatilization

The patterns of ammonia-volatilization flux of different treatments were quite similar (Figure 1). Three peaks of ammonia volatilization appeared in the growth period after three fertilizations. The volatilization increased significantly after fertilization, peaked within three days, and then gradually decreased to a stable level until the next fertilization. The applied nitrogen in the three times of fertilization decreased gradually, along with the peak of ammonia-volatilization flux.
Under controlled irrigation, ammonia-volatilization flux from paddy fields showed significant difference among various biochar amounts, which was generally following the order of CA > CB > CC. In terms of ammonia-volatilization peak, decreased to 1.557 and 1.700 kg·ha−1·d−1 in the CB and CC treatments, respectively, compared with the CA treatment of 1.887 kg·ha−1·d−1. The cumulative ammonia volatilization in the entire growth period is shown in Figure 2. The greatest ammonia-volatilization loss was found in the CA treatment (9.722 kg·ha−1), followed by the CB (9.323 kg·ha−1) and the CC treatment (8.529 kg·ha−1). Compared with the CA treatment, the cumulative ammonia-volatilization loss under the CC treatment was reduced by 12.27%.
Ammonia volatilization from paddy fields with biochar addition under different water management showed no much difference. Especially in the regreening period, the controlled-irrigation paddy field also maintained a shallow water layer, which was the same as the flooding paddy fields. Therefore, Figure 1b shows that the ammonia-volatilization flux of flood irrigation and controlled irrigation was almost coincident within 10 days after transplanting. Controlled-irrigation treatment preserved no water layer on the field surface after tillering stage. As a result, the ammonia volatilization of CC and FC treatments showed little difference after the application of tillering fertilizer and panicle fertilizer. However, the cumulative ammonia volatilization of the CC treatment (8.529 kg·ha−1) was 3.85% lower than that of the FC treatment (9.033 kg·ha−1) in the entire growth period. Overall, the ammonia volatilization from paddy fields was more concentrated under controlled irrigation and more dispersed under flood irrigation.

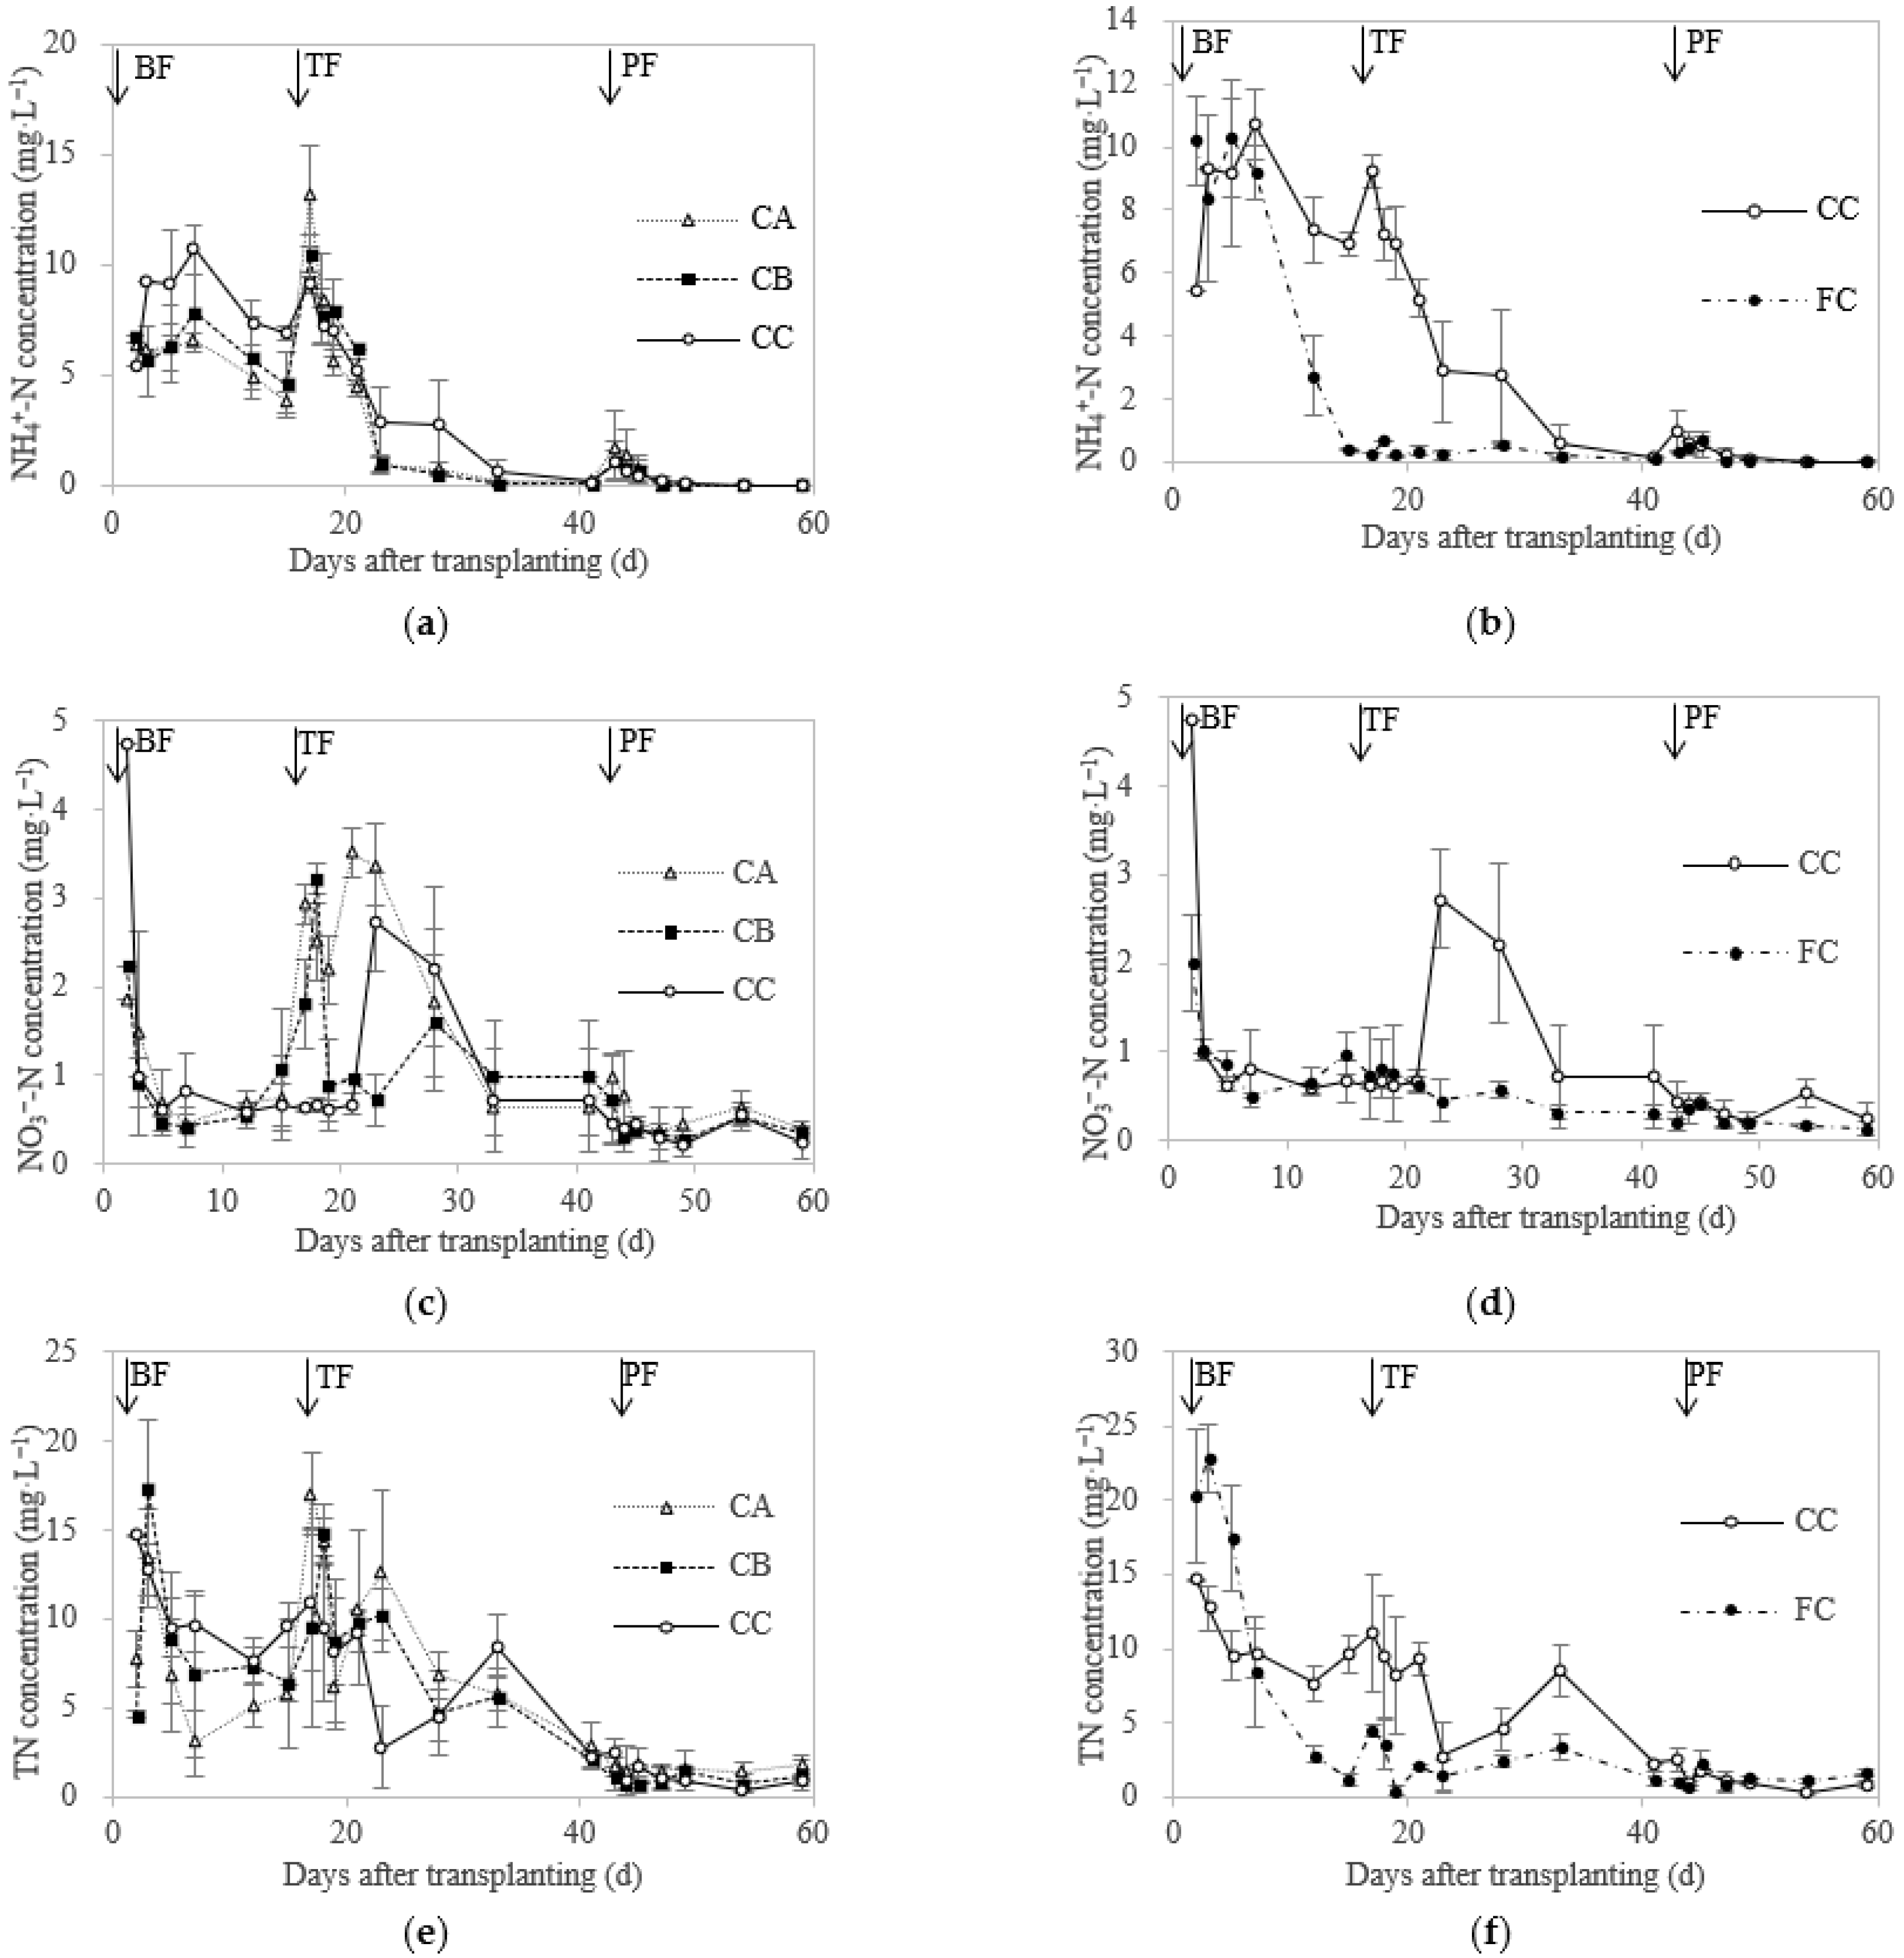
3.2. Surface Soil Solution (Surface Water) Chemical Characteristics

The water layers were almost maintained on the surface of the flood-irrigation field and ammonia volatilization is related to NH4+-N in the surface water. The field under controlled irrigation preserved no water layer on the field surface during most of the growth period. The water condition in the paddy field was more similar to that of dry land, but the soil moisture was higher than that of dry land. In this case, ammonia volatilization was closely related to inorganic nitrogen in soil and soil solution. The inorganic nitrogen concentration in the surface soil solution (surface water) exhibited a close relationship with ammonia-volatilization flux (Figure 3). The concentration experienced various degrees of increase and decrease processes after each fertilization. The peak value of inorganic nitrogen concentration is proportional to the nitrogen application rate each time.
The NH4+-N concentrations in the surface soil solution of each treatment under controlled irrigation are shown in Figure 3a. It remained over 3 mg·L−1 after the application of basal fertilizer. After the application of tillering fertilizer, the concentration immediately displayed processes of increase and decrease and gradually stabilized after five days of fertilization. From the perspective of the entire growth period, the biochar application increased the NH4+-N concentration in the surface soil solution. The average NH4+-N concentrations of CA, CB, and CC treatments were 3.436, 3.503, and 4.114 mg·L−1, respectively. The NH4+-N concentration of the CC treatment was 19.72% higher than that of the CA treatment (p < 0.05). Compared between different water managements (Figure 3b), the NH4+-N concentrations in the surface soil solution of the CC treatment and that of the FC treatment reached their maximum amount of 10.698 and 10.259 mg·L−1, respectively, at the regreening stage. During the application of the basal fertilizer stage, the NH4+-N concentration of the CC treatment maintained a high level. However, that of the FC treatment only showed a significant increase within seven days after fertilization and then decreased rapidly. After the application of tillering fertilizer, a peak concentration of NH4+-N in the CC treatment up to 9.203 mg·L−1 was obtained, but only a small peak of less than 1 mg·L−1 in the FC treatment was collected, and then immediately stabilized. Therefore, the NH4+-N concentration of the CC treatment was 90.14% higher than that of the FC treatment in the entire growth period (p < 0.01).
The NO3-N concentrations in the surface soil solution of controlled-irrigation fields with biochar showed not much difference (Figure 3c). After the application of basal fertilizer, the NO3-N concentration of each treatment significantly increased but decreased sharply in the following two days. On the contrary, it remained at a high level for approximately ten days after the application of tillering fertilizer. This pattern was exactly opposite to the NH4+-N concentration, which might be related to their transformation. In summary, the average NO3-N concentrations treated by the CA, CB, and CC were 1.319, 0.938, and 0.951 mg·L−1, respectively. Significant differences existed between the CB and CA and the CC and CA (p < 0.01). The biochar application reduced the NO3-N concentration in the surface soil solution, which was contrary to the NH4+-N concentration. The comparison of the NO3-N concentration in the surface soil solution (surface water) under different water management (Figure 3d) indicated that the NO3-N concentration of the FC treatment only showed a peak value of 2 mg·L−1 after the application of basal fertilizer. Thus, no visible changes were observed subsequently. However, the NO3-N concentration of the CC treatment changed with fertilization and showed greater changes and higher peaks than those of the FC treatment. Therefore, a significant difference (p < 0.01) existed between the average NO3-N concentrations of the CC treatment (0.938 mg·L−1) and the FC treatment (0.590 mg·L−1).
The TN concentration in the surface soil solution (surface water) with biochar under controlled irrigation changed significantly after the first two fertilizations (Figure 3e), but no significant difference was found among the treatments. The TN concentrations of the CA, CB, and CC treatments were 6.190, 5.893, and 6.106 mg·L−1, respectively. The patterns of the TN concentration in the surface soil solution (surface water) under different types of water management were also relatively consistent (Figure 3f). The TN concentration of the CC treatment was generally higher than that in the FC treatment. Therefore, the average TN concentration of the CC treatment was 46.04% higher than that of the FC treatment during the entire growth period (p < 0.01).

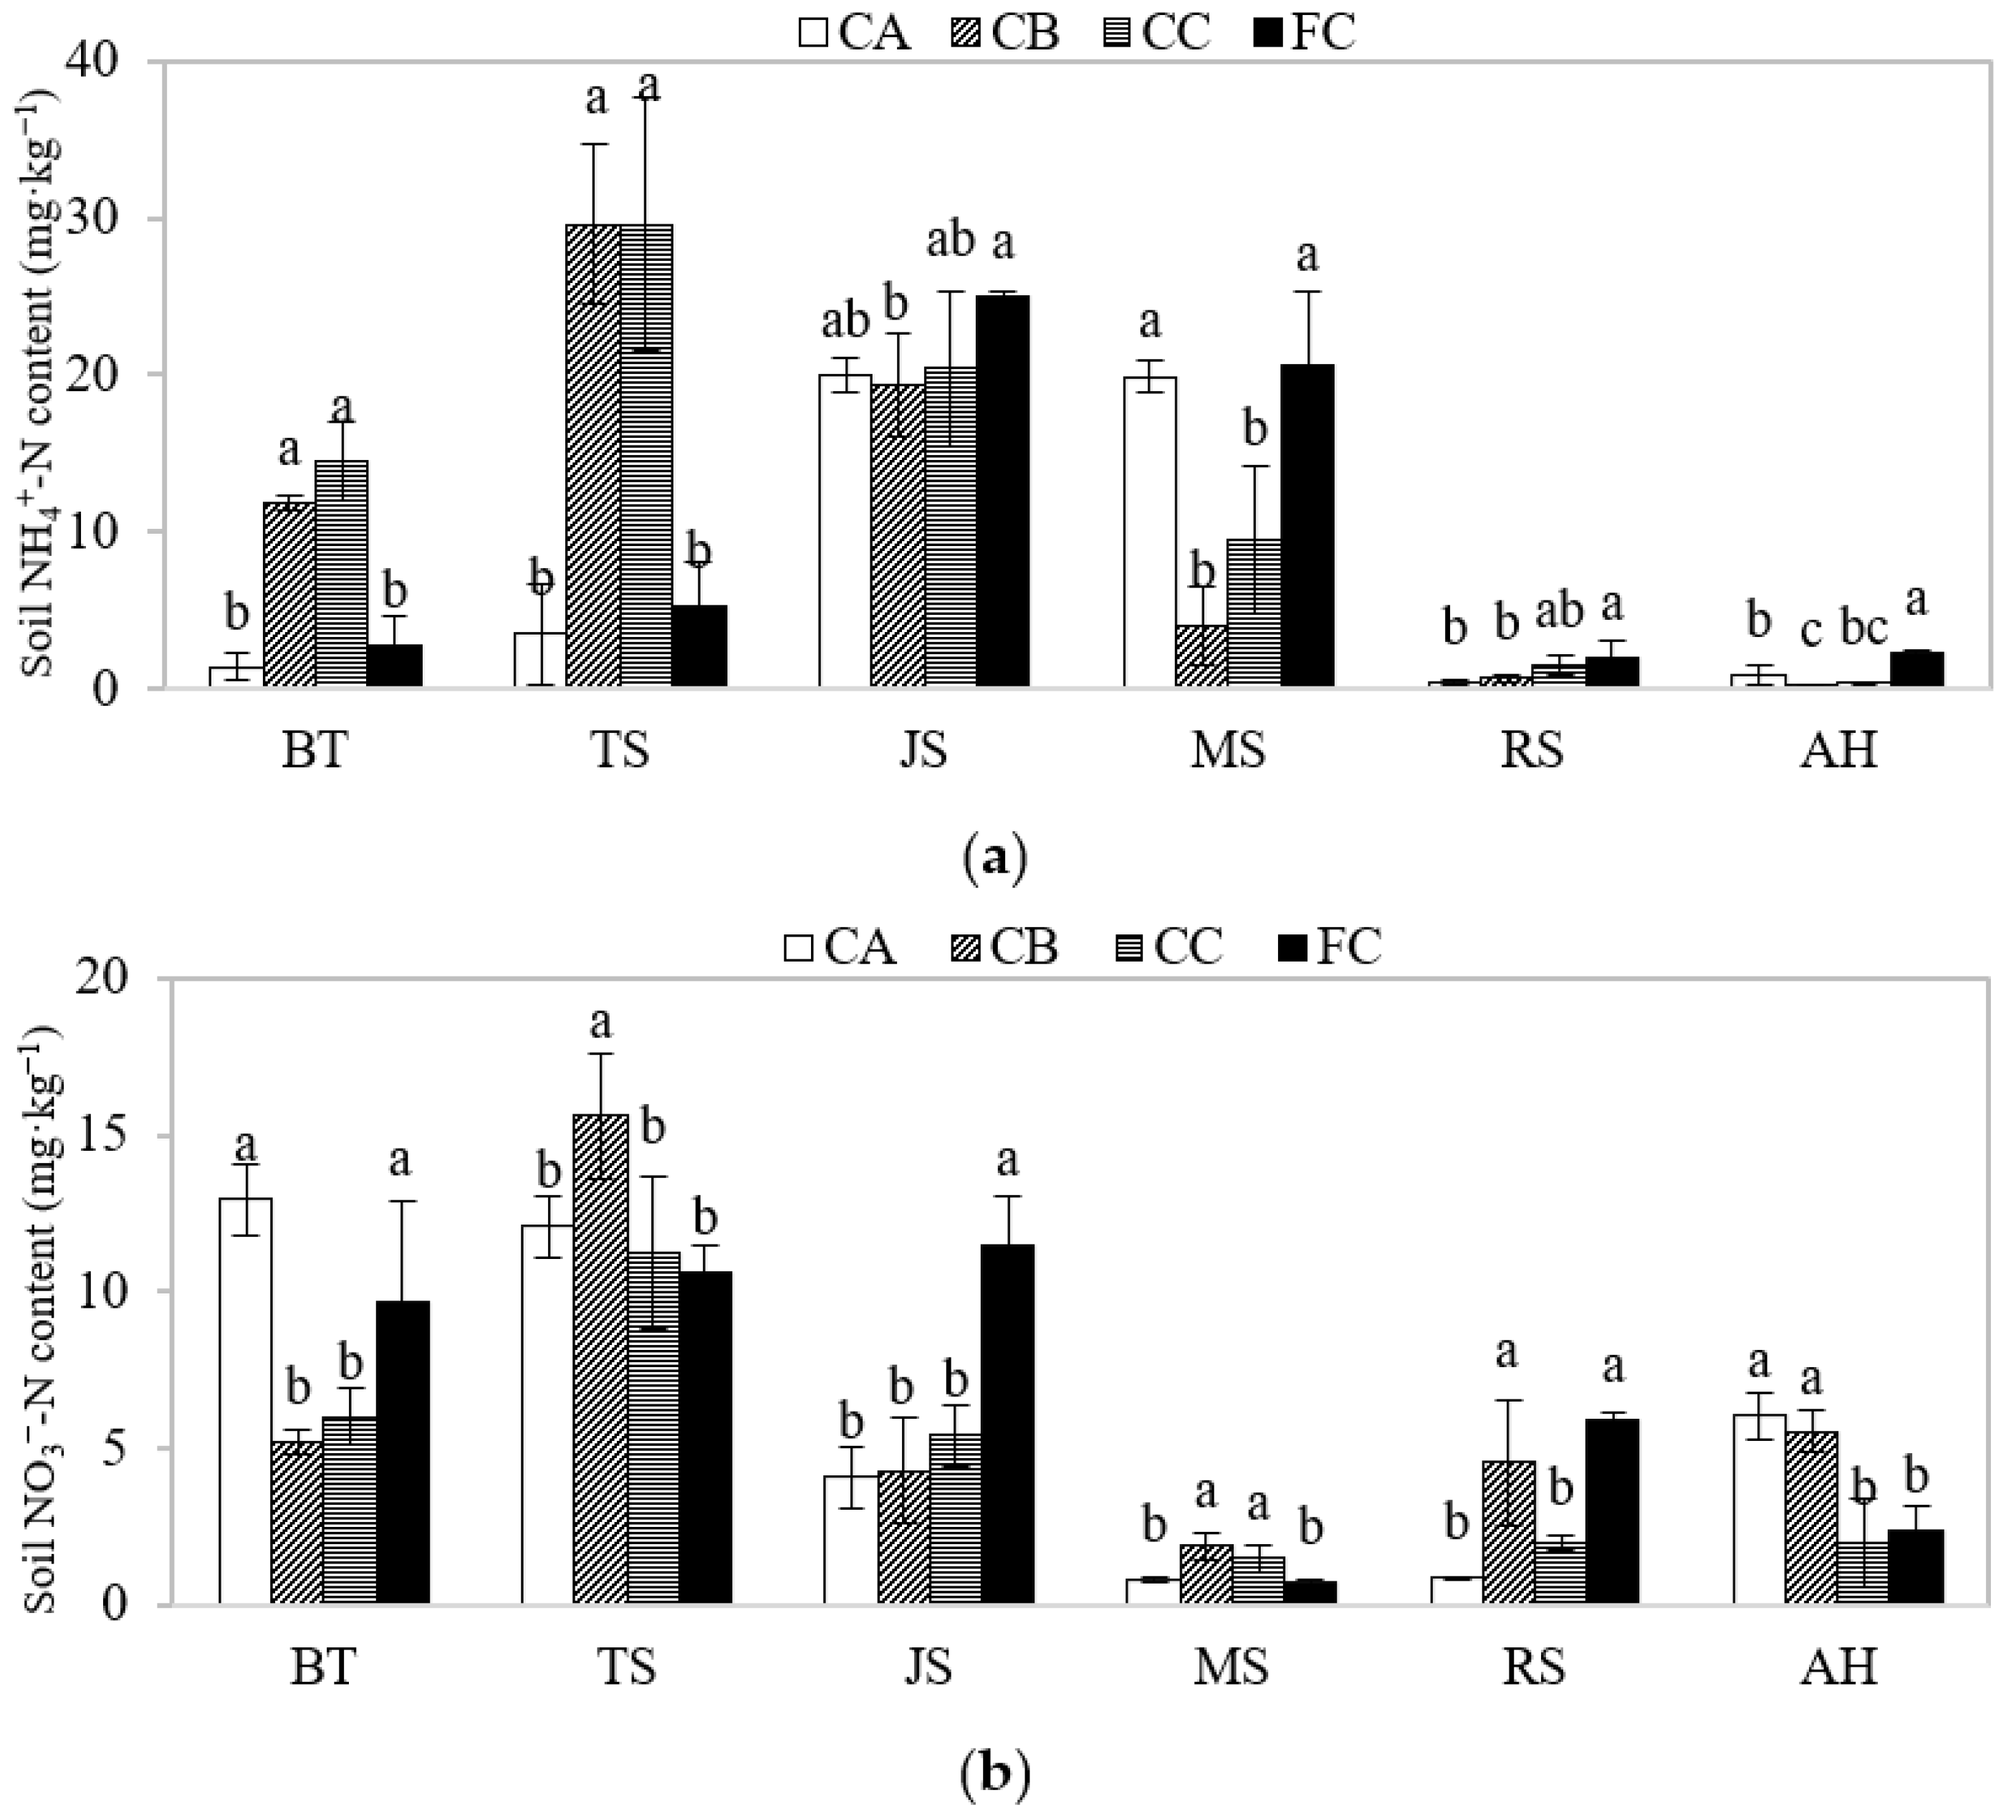
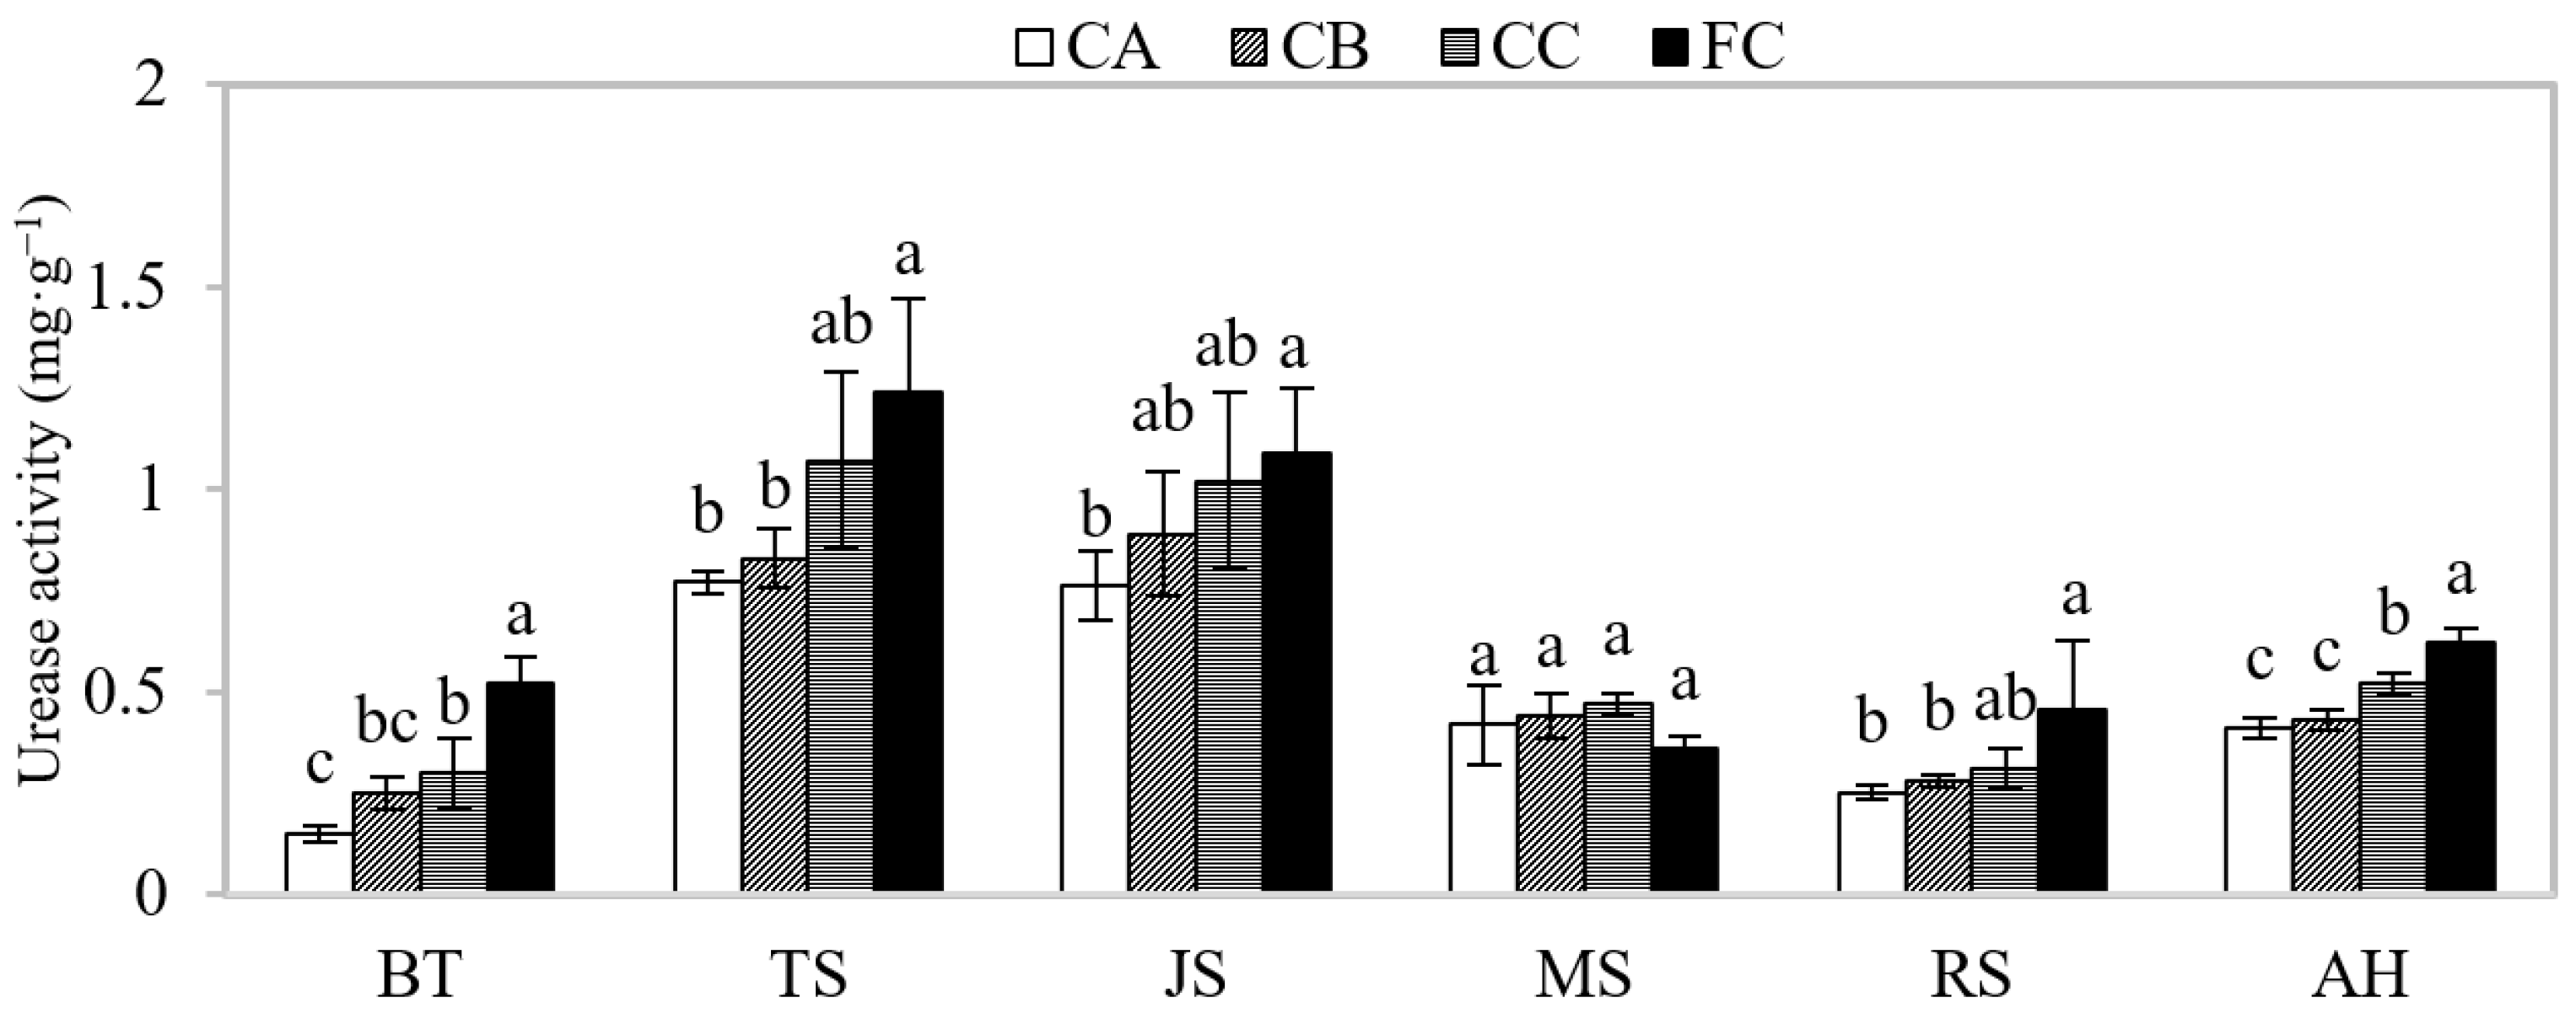
3.3. Soil Chemical Characteristics

The soil NH4+-N content underwent a process of increase and decrease (Figure 4a). The amount was high in the main stage of rice growth but almost none in the ripening stage and harvest period. Before rice transplanting, the soil NH4+-N contents of CB and CC treatments were significantly higher than those of the other two treatments (p< 0.01). They even reached 29 mg·kg−1 at tillering stage. However, after the jointing stage, the soil NH4+-N contents of CB and CC treatments gradually reached those of the other two treatments and were significantly lower at the milk-ripe stage (p < 0.01). In general, the average soil NH4+-N contents of CB and CC treatments were 64.98% and 42.72% higher than CA treatment (p < 0.05), respectively, which was greatly affected by the initial soil NH4+-N content. Compared with the FC treatment, the soil NH4+-N content of the CC treatment was higher, without significant difference.
The changes in soil NO3-N content in each stage are shown in Figure 4b. Before rice transplanting, the soil NO3-N contents of the CA and FC treatments were high, but those of the CB and CC were low, which was opposite to the initial soil NH4+-N content. During the regreening and tillering stages, the soil NO3-N content of each treatment was above 10 mg·kg−1. The milk-ripe stage is the key period for rice yield, in which the soil NO3-N content of each treatment was the lowest. The average soil NO3-N content during the entire growth period was ordered as FC > CA > CB > CC. The biochar application and controlled-irrigation management reduced the soil NO3-N content, contrary to the pattern of the soil NH4+-N content.
Urease is an obligate enzyme, functioning in the hydrolyzation of urea. Urease activity is in connection with soil NH4+-N content. The highest urease activity was observed at the tillering and jointing stages (Figure 5). The urease activity of each treatment decreased to the lowest at the ripening stage, which was probably related to the natural drying and the decrease in soil moisture. The urease activity before transplanting and after harvest showed an increase in each treatment. The urease activity of the CB and CC treatments increased by 72.0% and 73.3%, and that of the FC treatment increased by only 19.23%. The increase in paddy fields under controlled irrigation with biochar application was more evident than those under flood irrigation. The average urease activity during the entire growth period was shown as CC > CA > FC > CB. The average urease activity of the CC treatment was 33.70% higher than that of the CA treatment (p < 0.05).

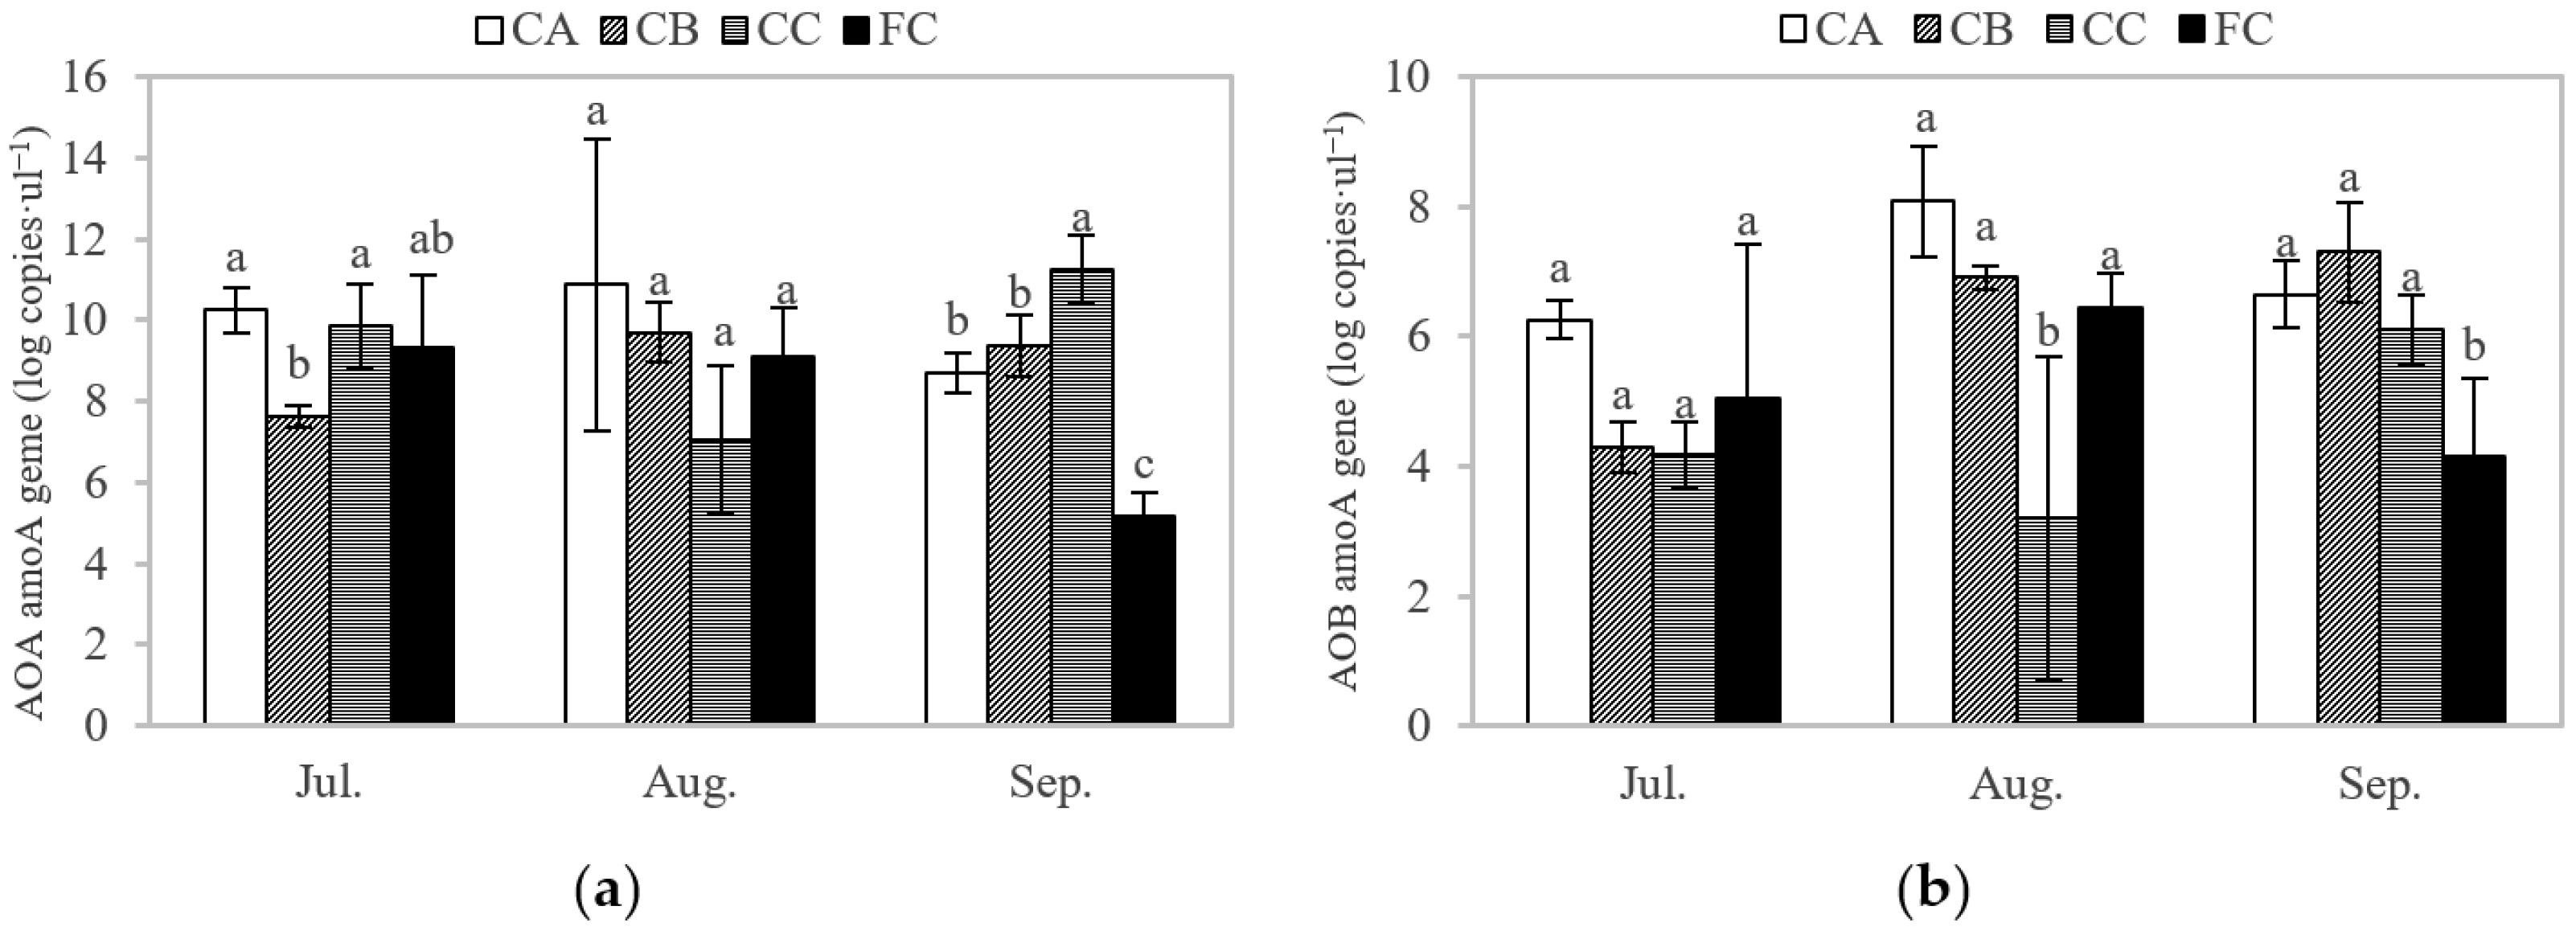
3.4. Diversity Analysis of Ammonia-Oxidizing Microorganisms

The copy numbers of AOA and AOB amoA genes could reflect their abundance (Figure 6). When rice was rapidly growing in July and August, the AOA and AOB amoA gene copies of the CC-and CB treated soils were lower than those of the CA treatments, contrary to the results obtained in September. The AOA and AOB amoA gene copy numbers of the CC treatment increased significantly compared with that of FC treatment (p < 0.05). This finding coincided with the changes in NH4+-N and NO3−-N in soil and soil solution. Therefore, controlled irrigation and biochar application could change the AOA and AOB abundance, thereby affecting the nitrification process and changing the composition of soil inorganic nitrogen. During the entire growth period, the biochar application of 20 and 40 t·ha−1 reduced the AOA and AOB abundance of the paddy field under controlled irrigation.
By analyzing the alpha diversity of AOA and AOB communities, the goods_coverage of 36 samples ranged from 0.995 to 1.000, indicating that more than 99.5% species diversity existed in all libraries. Table 1 shows the difference in alpha-diversity index among different treatments. The chao1 and observed_species of AOA and AOB under the CB and CC treatments were lower than those of CA treatment in September. Compared with FC treatment, chao1 and observed_species of AOA and AOB under CC treatment were lower. Therefore, controlled irrigation and biochar application could decrease the abundance of the ammonia-oxidizing bacteria community. This was consistent with AOA and AOB amoA gene copy numbers. The shannon and simpson of AOA and AOB under CB treatment were higher than those of CA treatment in August and September, which indicates that the biochar application of 20 t·ha−1 could increase the individual distribution uniformity of the ammonia-oxidizing bacteria community in irrigated paddy soil.

3.5. Correlation Coefficients between Ammonia Volatilization, Environmental Properties, and Gene Abundance

Pearson correlation coefficients were calculated to analyze the relationship between ammonia-volatilization flux and biochemical data (Table 2, Table 3 and Table 4). The correlation coefficients indicated that the NH4+-N concentration (r = 0.719, p < 0.01), the NO3−-N concentration (r = 0.525, p < 0.01), the TN concentration (r = 0.658, p < 0.01), and soil NO3−-N content (r = 0.809, p < 0.01) were the most significant contributors. Urease activity (r = 0.562, p < 0.05) was also the main factor affecting ammonia volatilization. In addition, extremely significant positive correlations were found among various forms of inorganic nitrogen concentration in the soil solution. Urease activity was highly correlated with the soil NO3-N and NH4+-N contents. A strong positive correlation was also found between AOA and AOB.

4. Discussion

Ammonia volatilization in paddy fields is mainly caused by ammonium ions on the soil surface. The application of nitrogen fertilizer is the main reason for ammonia volatilization in fields [31,32]. When nitrogen fertilizer, such as urea, is applied to the paddy field, NH4+ and OH are rapidly generated through hydrolysis, leading to an increase in the NH4+ concentration in the surface water within a short period [33,34]. Numerous studies have shown that a significant positive correlation exists between ammonia volatilization from fields and soil NH4+ concentration [35,36]. Furthermore, the alkaline environment formed by urea hydrolysis accelerates the loss of ammonia [34]. Therefore, ammonia volatilization from fields generally occurs between one and three days after nitrogen application and then decreases gradually [4,36]. In the experiment, three fertilizations were applied during rice growth period. Thus, ammonia volatilization peaked three times, which decreased successively with the decrease in nitrogen application.
Biochar has a unique structural nature and physicochemical properties, which can improve soil aeration. The increase in soil porosity caused by biochar addition has a positive effect on heat, water, and gas exchanges in the soil [18]. The channel formed in the soil is conducive to transferring the NH3 from the soil mass to the soil surface, thereby providing a prerequisite for ammonia volatilization [37,38]. However, the current research results on the response of ammonia volatilization to biochar are different. Sun, et al. [37] have shown that biochar amendment increases ammonia volatilization evidently by 21.0% in agricultural soil, because porous biochar addition can promote soil aeration. Another point of view is that most biochar (especially straw biochar) itself is rich in Ca2+, K+, and Mg2+ ions. With the entrance of biochar into the soil, exchange of these ions with H+ and Al3+ in the soil improved soil PH value [39] and thus promoted ammonia volatilization [17,40,41]. On the contrary, Mandal et al. [42] have shown that biochar application at 0.5% and 2% decreases the ammonia volatilization by 36% and 48%, respectively. The reduction in ammonia volatilization is due to the synergetic effect of changed soil pH and adsorbed NH3 by biochar. Esfandbod et al. [43] also confirmed that biochar can reduce the emission of ammonia via adsorption of NH3 into the particles of biochar. Other studies have shown that biochar has good water-retention ability, and can reduce water loss and increase the solubility of soil solution to NH3 after being applied to soil, thus effectively reducing ammonia volatilization [38]. In addition, one experiment shows that biochar has no significant impact on NH3 loss [44]. The reason for these contradictory results is the dual character of biochar. On the one hand, the equilibrium between ammonia and ammonium is skewed toward the former at high pH levels, with the consequent release of NH3 in the atmosphere, which is driven by alkaline biochar [41,45]. Specifically, biochar with high ash and alkaline properties has a more evident effect on soil pH [46]. On the other hand, biochar has a porous structure and a large surface area [37,41]. In addition, biochar has a strong ion-exchange capacity due to negatively charged surfaces and acidic functional groups [22,33], thereby reducing ammonia volatilization. The different responses of field ammonia volatilization to biochar mainly depend on whether the adsorption capacity of biochar and the effect of increasing soil pH are a two-phase offset or are more prominent in one aspect. In our experiment, the reduction of ammonia volatilization by biochar was not significant, and a large amount of biochar could reduce ammonia volatilization by 12.27%. The greatest ammonia-volatilization loss was found in the CA treatment (9.722 kg·ha−1), followed by the CB (9.323 kg·ha−1) and the CC treatment (8.529 kg·ha−1). Compared with the CA treatment, the cumulative ammonia-volatilization loss under the CC and CB treatment was reduced by 12.27% and 4.10%, respectively. Bi et al. [47] have presented that the initial soil pH could affect the response of ammonia volatilization to biochar. Results from their study demonstrate increased pH of soil by biochar rather than the adsorption capacity of biochar with low pH, resulting in greater NH3 volatilization. Furthermore, in soil with medium pH, biochar increases its adsorption capacity and lowers NH3 volatilization. The soil pH of our experiment site was 7.4, which belonged to medium pH according to their study. Ammonia volatilization in our experiment decreased with the addition of biochar, and the adsorption capacity of biochar played the more dominant role, thus accurately confirming previous results [47] that initial soil pH could affect the response of ammonia volatilization to biochar. Moreover, biochar application can alter urease activity and soil microbial community, and influence urea hydrolysis and nitrification and denitrification, which directly affect the soil ammonium nitrogen and ammonia volatilization. In our experiment, urease activity was positively correlated with ammonia volatilization and soil NH4+-N content. In our study, the average urease activities of CC treatment and CA treatment were 0.61 mg/g and 0.46 mg/g, respectively. The average urease activity of the high amount of biochar treatment was 10.67% higher than that of the control, consistent with previous research results [16,40]. Our outcomes are in line with other studies which found that biochar application increases urease activity. Biochar presents negatively charged functional groups on its surface, leading to adsorption of positively charged NH4+ [48,49].
Under controlled irrigation, rice fields remain in the shallow water layer or no-water layer during most of the growth period. Most studies have shown that controlled irrigation can reduce ammonia-volatilization losses. Xu et al. [32] have reported that ammonia-volatilization loss in non-flood-irrigation paddies decreases by 18.5–20.5% compared with flood-irrigation paddies. Xiao et al. [5] have reported that the total ammonia volatilization and the ammonia-volatilization loss rate under controlled irrigation are lower than those under flood irrigation. In our study, the ammonia-volatilization peak of CC treatment (0.859 kg·ha−1·d−1) was higher than that of FC treatment (0.586 kg·ha−1·d−1). However, the cumulative ammonia volatilization of the CC treatment (8.529 kg·ha−1) was 3.85% lower than that of the FC treatment (9.033 kg·ha−1) in the entire growth period. Controlled irrigation increased the peak ammonia volatilization after fertilization but reduced the total ammonia volatilization at the same time during the growth period. One possible reason is that the unsaturated soil condition results in an increase in nitrogen concentration compared with flood irrigation, which is conducive to ammonia volatilization [50]. Under high temperatures during the rice-growing period, the field surface without the water layer heats up faster, thereby intensifying ammonia-volatilization loss [24]. However, a few days later after fertilization, the paddy fields under controlled irrigation are gradually changed from a thin water layer to a no-water layer. NH4+-N migrates downward following the flow of water. The NH4+ concentration in the surface layer decreases, thereby reducing the partial pressure of ammonia and ammonia-volatilization loss [24]. A reasonable irrigation schedule is an effective measure to reduce ammonia-volatilization loss and improve the nitrogen utilization efficiency in paddy fields. The appropriate depth and duration of deep water could be maintained after fertilization so that the NH4+ concentration in the surface water could be diluted. NH4+ could be brought into the deep soil through irrigation to reduce ammonia volatilization.
The water-saving irrigation and biochar application can improve soil aeration and change the soil microbial community, thereby affecting the nitrification process and indirectly affecting ammonia volatilization [45,51]. AOA and AOB are the primary drivers of ammonia oxidation. Previous researchers have suggested that biochar can provide a protected habitat and abundant nutrients for microorganism growth, which increases AOA and AOB abundance [47,52]. Conversely, biochar application reduces the abundance of AOA and AOB and the abundance of ammonia-oxidizing microbial communities in our experiment. The average copy number of AOA gene in CC treatment (9.38 log copies·μL−1) and CB treatment (8.90 log copies·μL−1) decreased by 5.69% and 10.58%, respectively, compared with CA treatment (9.95 log copies·μL−1); the average gene copy number of AOB in CC treatment (4.49 log copies·μL−1) and CB treatment (6.16 log copies·μL−1) decreased by 35.73% and 11.84%, respectively, compared with CA treatment (6.99 log copies·μL−1). The AOA and AOB chao1 and observed_species of the CB and CC treatments were also lower than those of CA treatment in September. Clough et al. [53] propose an explanation that the microbially toxic compounds (e.g., polyaromatic hydrocarbons) following the pyrolysis of biomass and the formation of biochar may reside on or in the char and such compounds can have bactericidal properties. Another possible explanation is that AOA is suitable for growing in low NH4+ concentrations. The high adsorption of NH4+ by biochar and the high ammonia concentration in a controlled-irrigation paddy field may inhibit the growth of AOA. Recent research reached the same conclusion. Yao et al. [54] found that continuous application of urea and ammonium fertilizer increases the local concentration of NH4+-N, which is toxic to soil microorganisms and kills fungi and bacteria. With the growth of rice in our experiment, the soil NH4+-N content with biochar application was gradually lower than that with non-biochar. However, the change in the soil NO3-N content was the opposite. At the same time, the abundance of AOA and AOB increased gradually. Therefore, the nitrification of paddy fields with biochar gradually increased in the subsequent growth stages, and the NH4+-N in the topsoil was constantly consumed.
Compared with other treatments, the high amount of biochar application in our experiment decreased ammonia-volatilization loss from paddy fields under controlled irrigation. Cumulative ammonia volatilization with a high amount of biochar was reduced by 12.27% compared with the non-biochar treatment. Moreover, the abundance of AOA and AOB with biochar application under controlled irrigation showed an upward trend with rice growth. Thus, the results of the experiment suggest that long-term biochar application may have a relatively strong potential to inhibit ammonia volatilization.

5. Conclusions

Since the effect of biochar in controlled-irrigation paddy fields is not fully explored, this experiment innovatively combined biochar addition with controlled-irrigation technology. The results provided evidence that biochar application reduced ammonia volatilization under controlled irrigation. High biochar application reduced the cumulative ammonia volatilization by 12.27% compared with the non-biochar treatment. Controlled irrigation increased the ammonia-volatilization peak but reduced the cumulative ammonia volatilization, making the ammonia-volatilization process more concentrated in the paddy field. The decrease in ammonia volatilization was related to the change in soil physical and chemical properties and soil microbial activity. Under controlled irrigation, the ammonia volatilization from paddy fields with biochar application displayed high correlations (p < 0.01) with NH4+-N, NO3-N, and TN concentration in the soil solution and soil NO3-N content. Furthermore, this volatilization had a significant correlation (p < 0.05) with urease activity. Biochar application not only increased the soil NH4+-N content and NH4+-N concentration in the soil solution, but also the urease activity by more than 70% compared with the activity prior to rice transplanting. Meanwhile, biochar application reduced the soil NO3-N content and NO3-N concentration in the soil solution. Controlled irrigation significantly increased NH4+-N, NO3-N, and TN concentration in the soil solution and the urease activity by 13.93% compared with flood irrigation. Meanwhile, biochar application decreased the abundance of AOA and AOB amoA genes under controlled irrigation, and decreased the abundance of the ammoxidation microbial community. Nevertheless, biochar application of 20 t·ha−1 could increase the individual distribution uniformity of the ammonia-oxidizing bacteria community. The activity of AOA and AOB also showed an upward trend with rice growth. In general, through the combined application of controlled irrigation and biochar, this study provides an eco-friendly strategy for reducing farmland N loss and improving paddy field productivity.
This method can be used to improve the sustainable utilization of farmland water and soil resources. The follow-up research can set up different water and carbon application scenarios, or use the method of model simulation to refine the impact of biochar application on ammonia volatilization in water-saving irrigated rice fields, so as to obtain the optimal biochar application amount by integrating environmental and economic benefits, which can be used to guide production practice.

Author Contributions

Original draft and review and editing, S.Q.; review and editing and data curation, J.D.; funding acquisition and project administration, S.Y.; software and validation, Z.J.; methodology and investigation, Y.X. All authors have read and agreed to the published version of the manuscript.

Funding

This research was funded by the National Natural Science Foundation of China (51879076, 51579070), National Key R&D Program of China (2018YFC1508303), and Water Conservancy Science and Technology Project of Jiangxi Province (201921ZDKT06, 202124ZDKT09).

Institutional Review Board Statement

Not applicable.

Informed Consent Statement

Not applicable.

Data Availability Statement

The data that support the findings of this study are available on request.

Acknowledgments

We would like to thank the Kunshan Irrigation and Drainage Experiment Station for providing the experimental fields.

Conflicts of Interest

The authors declare no conflict of interest.

References

  1. Zhang, F.S.; Cui, Z.L.; Chen, X.P.; Ju, X.T.; Shen, J.B.; Chen, Q.; Liu, X.J.; Zhang, W.F.; Mi, G.H.; Fan, M.S.; et al. Integrated Nutrient Management for Food Security and Environmental Quality in China. In Advances in Agronomy; Academic Press Inc. Elsevier Science: San Diego, CA, USA, 2012; Volume 116, pp. 1–40. [Google Scholar]
  2. Zhang, L.; Tang, S.; Guan, Y. Excellent Adsorption-Desorption of Ammonium by a Poly(acrylic acid)-Grafted Chitosan and Biochar Composite for Sustainable Agricultural Development. ACS Sustain. Chem. Eng. 2020, 8, 16451–16462. [Google Scholar] [CrossRef]
  3. Singh, M.; Bhattacharya, A.K.; Nair, T.V.R.; Singh, A.K. Nitrogen loss through subsurface drainage effluent in coastal rice field from India. Agric. Water Manag. 2002, 52, 249–260. [Google Scholar] [CrossRef]
  4. Watanabe, T.; Son, T.T.; Hung, N.N.; Van Truong, N.; Giau, T.Q.; Hayashi, K.; Ito, O. Measurement of ammonia volatilization from flooded paddy fields in Vietnam. Soil Sci. Plant Nutr. 2009, 55, 793–799. [Google Scholar] [CrossRef]
  5. Xiao, X.; Yang, L.; Deng, Y.; Wang, J. The coupling effects of water and nitrogen on ammonia volatilization from paddy field. J. Agro-Environ. Sci. 2012, 31, 2066–2071. [Google Scholar]
  6. Ferm, M. Atmospheric ammonia and ammonium transport in Europe and critical loads: A review. Nutr. Cycl. Agroecosyst. 1998, 51, 5–17. [Google Scholar] [CrossRef]
  7. Cao, Y.S.; Tian, Y.H.; Yin, B.; Zhu, Z.L. Assessment of ammonia volatilization from paddy fields under crop management practices aimed to increase grain yield and N efficiency. Field Crops Res. 2013, 147, 23–31. [Google Scholar] [CrossRef]
  8. Raza, S.T.; Tang, J.L.; Ali, Z.; Yao, Z.; Bah, H.; Iqbal, H.; Ren, X. Ammonia Volatilization and Greenhouse Gases Emissions during Vermicomposting with Animal Manures and Biochar to Enhance Sustainability. Int. J. Environ. Res. Public Health 2020, 18, 178. [Google Scholar] [CrossRef]
  9. Uchimiya, M.; Lima, I.M.; Klasson, K.T.; Wartelle, L.H. Contaminant immobilization and nutrient release by biochar soil amendment: Roles of natural organic matter. Chemosphere 2010, 80, 935–940. [Google Scholar] [CrossRef]
  10. Zhang, A.F.; Bian, R.J.; Pan, G.X.; Cui, L.Q.; Hussain, Q.; Li, L.Q.; Zheng, J.W.; Zheng, J.F.; Zhang, X.H.; Han, X.J.; et al. Effects of biochar amendment on soil quality, crop yield and greenhouse gas emission in a Chinese rice paddy: A field study of 2 consecutive rice growing cycles. Field Crops Res. 2012, 127, 153–160. [Google Scholar] [CrossRef]
  11. Tu, C.; Wei, J.; Guan, F.; Liu, Y.; Sun, Y.H.; Luo, Y.M. Biochar and bacteria inoculated biochar enhanced Cd and Cu immobilization and enzymatic activity in a polluted soil. Environ. Int. 2020, 137, 105576. [Google Scholar] [CrossRef]
  12. Awad, M.; El-Sayed, M.M.; Li, X.; Liu, Z.; Mustafa, S.K.; Ditta, A.; Hessini, K. Diminishing Heavy Metal Hazards of Contaminated Soil via Biochar Supplementation. Sustainability 2021, 13, 2742. [Google Scholar] [CrossRef]
  13. Naveed, M.; Tanvir, B.; Xiukang, W.; Brtnicky, M.; Ditta, A.; Kucerik, J.; Subhani, Z.; Nazir, M.Z.; Radziemska, M.; Saeed, Q.; et al. Co-composted Biochar Enhances Growth, Physiological, and Phytostabilization Efficiency of Brassica napus and Reduces Associated Health Risks under Chromium Stress. Front. Plant Sci. 2021, 12, 775785. [Google Scholar] [CrossRef] [PubMed]
  14. He, X.; Zhang, S.; She, D.; Geng, Z.; Gao, H. Effects of Biochar on Soil and Fertilizer and Future Research. Chin. Agric. Sci. Bull. 2011, 27, 16–25. [Google Scholar]
  15. Sohi, S.P.; Krull, E.; Lopez-Capel, E.; Bol, R. A Review of Biochar and Its Use and Function in Soil. In Advances in Agronomy; Academic Press Inc. Elsevier Science: San Diego, CA, USA, 2010; Volume 105, pp. 47–82. [Google Scholar]
  16. Javeed, H.M.R.; Ali, M.; Ahmed, I.; Wang, X.; Al-Ashkar, I.; Qamar, R.; Ibrahim, A.; Habib-Ur-Rahman, M.; Ditta, A.; El Sabagh, A. Biochar Enriched with Buffalo Slurry Improved Soil Nitrogen and Carbon Dynamics, Nutrient Uptake and Growth Attributes of Wheat by Reducing Leaching Losses of Nutrients. Land 2021, 10, 1392. [Google Scholar] [CrossRef]
  17. Zhang, F.; Liu, C.; Wang, Z.; Meng, J.; Chi, D.; Chen, T. Effects of rice straw biochar with different adsorption characteristics on ammonia volatilization from paddy field and rice yield. Trans. Chin. Soc. Agric. Eng. 2021, 37, 100–109. [Google Scholar]
  18. Murtaza, G.; Ahmed, Z.; Usman, M.; Tariq, W.; Ullah, Z.; Shareef, M.; Iqbal, H.; Waqas, M.; Tariq, A.; Wu, Y.; et al. Biochar induced modifications in soil properties and its impacts on crop growth and production. J. Plant Nutr. 2021, 44, 1677–1691. [Google Scholar] [CrossRef]
  19. Hui, Z.; Zheng-li, Y.; Liang-guo, L.U.O.; Qing-wen, Z.; Jun, Y.I.; Yong-sheng, W.; Yuan-yuan, C.; Ming, W. Study on the ammonia volatilization from paddy field in irrigation area of the Yellow River. Plant Nutr. Fertitizer Sci. 2011, 17, 1131–1139. [Google Scholar]
  20. Zhou, L.; Rong, X.; Xie, G.; Wang, X.; Xie, Y.; Ning, Q. Effects of Different Nitrogen Fertilizers on Ammonia Volatilization and Its Dynamic Characteristics of Double Cropping Rice. J. Soil Water Conserv. 2014, 28, 143–147. [Google Scholar]
  21. Zhou, M.; Ying, S.; Chen, J.; Jiang, P.; Teng, Y. Effects of biochar-based fertilizer on nitrogen use efficiency and nitrogen losses via leaching and ammonia volatilization from an open vegetable field. Environ. Sci. Pollut. Res. Int. 2021, 28, 65188–65199. [Google Scholar] [CrossRef]
  22. Li, Q.; Liao, N.; Zhang, N.; Ru, S.; Hou, Z. Effects of Cotton Stalk and Its Biochar on Ammonia Volatilization from a Drip Irrigated Cotton Field. J. Agro-Environ. Sci. 2014, 33, 1987–1994. [Google Scholar]
  23. Song, C.N.; Jiao, Y.; Yang, W.Z.; Yu, Y.Z.; Zhang, J.; Liu, Y.B. Research progress on the influence of irrigation methods on ammonia volatilization in farmland. In Proceedings of the 6th International Conference on Advances in Energy Resources and Environment Engineering, Chongqing, China, 20–22 November 2020. [Google Scholar]
  24. Peng, S.; Yang, S.; Xu, J. Ammonia volatilization and its influence factors of paddy field under water-saving irrigation. Trans. Chin. Soc. Agric. Eng. 2009, 25, 35–39. [Google Scholar]
  25. Dong, D.; Feng, Q.B.; McGrouther, K.; Yang, M.; Wang, H.L.; Wu, W.X. Effects of biochar amendment on rice growth and nitrogen retention in a waterlogged paddy field. J. Soils Sediments 2015, 15, 153–162. [Google Scholar] [CrossRef]
  26. Yang, S.H.; Peng, S.Z.; Xu, J.Z.; Yao, J.Q.; Jin, X.P.; Song, J. Characteristics and simulation of ammonia volatilization from paddy fields under different water and nitrogen management. Trans. Chin. Soc. Agric. Eng. 2012, 28, 99–104. [Google Scholar]
  27. Wang, Z.; Liu, X.; Ju, X.; Zhang, F. Field in situ determination of ammonia volatilization from soil: Venting method. Plant Nutr. Fertitizer Sci. 2002, 8, 205–209. [Google Scholar]
  28. Zhang, M.; Yao, Y.L.; Zhao, M.; Zhang, B.W.; Tian, Y.H.; Yin, B.; Zhu, Z.L. Integration of urea deep placement and organic addition for improving yield and soil properties and decreasing N loss in paddy field. Agric. Ecosyst. Environ. 2017, 247, 236–245. [Google Scholar] [CrossRef]
  29. Wang, X.; Guo, G.; Zheng, R.; Zhong, M.; Zhu, Y. Effect of Biochar on Abundance of N-Related Functional Microbial Communities in Degraded Greenhouse Soil. Acta Pedol. Sin. 2013, 50, 624–631. [Google Scholar]
  30. Jiang, Z.; Yang, S.; Pang, Q.; Xu, Y.; Chen, X.; Sun, X.; Qi, S.; Yu, W. Biochar improved soil health and mitigated greenhouse gas emission from controlled irrigation paddy field: Insights into microbial diversity. J. Clean. Prod. 2021, 318. [Google Scholar] [CrossRef]
  31. Liao, L.X.; Shao, X.H.; Ji, R.J.; Wen, T.; Xu, J.Z. Ammonia Volatilization from Direct Seeded Later-rice Fields as Affected by Irrigation and Nitrogen Managements. Int. J. Agric. Biol. 2015, 17, 582–588. [Google Scholar] [CrossRef]
  32. Xu, J.Z.; Peng, S.Z.; Hou, H.J.; Yang, S.H.; Luo, Y.F.; Wang, W.G. Gaseous losses of nitrogen by ammonia volatilization and nitrous oxide emissions from rice paddies with different irrigation management. Irrig. Sci. 2013, 31, 983–994. [Google Scholar] [CrossRef]
  33. Feng, Y.F.; Sun, H.J.; Xue, L.H.; Wang, Y.M.; Yang, L.Z.; Shi, W.M.; Xing, B.S. Sawdust biochar application to rice paddy field: Reduced nitrogen loss in floodwater accompanied with increased NH3 volatilization. Environ. Sci. Pollut. Res. 2018, 25, 8388–8395. [Google Scholar] [CrossRef]
  34. He, T.H.; Liu, D.Y.; Yuan, J.J.; Ni, K.; Zaman, M.; Luo, J.F.; Lindsey, S.; Ding, W.X. A two years study on the combined effects of biochar and inhibitors on ammonia volatilization in an intensively managed rice field. Agric. Ecosyst. Environ. 2018, 264, 44–53. [Google Scholar] [CrossRef]
  35. Dong, Y.; Wu, Z.; Li, B.; Xu, X.; Xiong, Z. Effects of biochar reapplication on ammonia volatilization and nitrogen use efficiency during wheat season in a rice-wheat annual rotation system. J. Plant Nutr. Fertitizer 2017, 23, 1258–1267. [Google Scholar]
  36. Zhou, G.W.; Zhang, W.; Ma, L.J.; Guo, H.J.; Min, W.; Li, Q.; Liao, N.; Hou, Z.N. Effects of Saline Water Irrigation and N Application Rate on NH3 Volatilization and N use Efficiency in a Drip-Irrigated Cotton Field. Water Air Soil Pollut. 2016, 227, 103. [Google Scholar] [CrossRef]
  37. Sun, L.Y.; Li, L.; Chen, Z.Z.; Wang, J.Y.; Xiong, Z.Q. Combined effects of nitrogen deposition and biochar application on emissions of N2O, CO2 and NH3 from agricultural and forest soils. Soil Sci. Plant Nutr. 2014, 60, 254–265. [Google Scholar] [CrossRef]
  38. Xu, Y.-X.; He, L.-L.; Chen, J.-Y.; Liu, Y.-X.; Lyu, H.-H.; Wang, Y.-Y.; Yang, S.-M. Effects of biochar on ammonia volatilization from farmland soil: A review. J. Appl. Ecol. 2020, 31, 4312–4320. [Google Scholar] [CrossRef]
  39. Jia, Y.; Hu, Z.; Ba, Y.; Qi, W. Application of biochar-coated urea controlled loss of fertilizer nitrogen and increased nitrogen use efficiency. Chem. Biol. Technol. Agric. 2021, 8, 3. [Google Scholar] [CrossRef]
  40. He, F.; Liang, Y.; Rong, X.; Liu, Q. Effects of biochar on ammonia volatilisation and soil properties of vegetable—Planting red soil in a laboratory. J. Yunnan Univ. Nat. Sci. 2014, 36, 299–304. [Google Scholar]
  41. Duan, J.; Xue, L.; Yin, A.; Feng, Y.; Yang, L. Rural low-pollution wastewater purification in Oenanthe Javanica wetland with biochar addition. J. Agro-Environ. Sci. 2017, 36, 353–361. [Google Scholar]
  42. Mandal, S.; Donner, E.; Smith, E.; Sarkar, B.; Lombi, E. Biochar with near-neutral pH reduces ammonia volatilization and improves plant growth in a soil-plant system: A closed chamber experiment. Sci. Total Environ. 2019, 697, 134114. [Google Scholar] [CrossRef]
  43. Esfandbod, M.; Phillips, I.R.; Miller, B.; Rashti, M.R.; Lan, Z.M.; Srivastava, P.; Singh, B.; Chen, C.R. Aged acidic biochar increases nitrogen retention and decreases ammonia volatilization in alkaline bauxite residue sand. Ecol. Eng. 2017, 98, 157–165. [Google Scholar] [CrossRef]
  44. Sun, H.J.; Zhang, H.L.; Min, J.; Feng, Y.F.; Shi, W.M. Controlled-release fertilizer, floating duckweed, and biochar affect ammonia volatilization and nitrous oxide emission from rice paddy fields irrigated with nitrogen-rich wastewater. Paddy Water Environ. 2016, 14, 105–111. [Google Scholar] [CrossRef]
  45. Mandal, S.; Donner, E.; Vasileiadis, S.; Skinner, W.; Smith, E.; Lombi, E. The effect of biochar feedstock, pyrolysis temperature, and application rate on the reduction of ammonia volatilisation from biochar-amended soil. Sci. Total Environ. 2018, 627, 942–950. [Google Scholar] [CrossRef] [PubMed]
  46. Schomberg, H.H.; Gaskin, J.W.; Harris, K.; Das, K.C.; Novak, J.M.; Busscher, W.J.; Watts, D.W.; Woodroof, R.H.; Lima, I.M.; Ahmedna, M.; et al. Influence of Biochar on Nitrogen Fractions in a Coastal Plain Soil. J. Environ. Qual. 2012, 41, 1087–1095. [Google Scholar] [CrossRef] [PubMed] [Green Version]
  47. Bi, Q.F.; Chen, Q.H.; Yang, X.R.; Li, H.; Zheng, B.X.; Zhou, W.W.; Liu, X.X.; Dai, P.B.; Li, K.J.; Lin, X.Y. Effects of combined application of nitrogen fertilizer and biochar on the nitrification and ammonia oxidizers in an intensive vegetable soil. AMB Express 2017, 7, 198. [Google Scholar] [CrossRef] [Green Version]
  48. Novak, J.M.; Busscher, W.J.; Watts, D.W.; Laird, D.A.; Ahmedna, M.A.; Niandou, M.A.S. Short-term CO2 mineralization after additions of biochar and switchgrass to a Typic Kandiudult. Geoderma 2010, 154, 281–288. [Google Scholar] [CrossRef]
  49. Singh, B.P.; Hatton, B.J.; Singh, B.; Cowie, A.L.; Kathuria, A. Influence of Biochars on Nitrous Oxide Emission and Nitrogen Leaching from Two Contrasting Soils. J. Environ. Qual. 2010, 39, 1224–1235. [Google Scholar] [CrossRef]
  50. Li, H.; Liang, X.Q.; Chen, Y.X.; Tian, G.M.; Zhang, Z.J. Ammonia volatilization from urea in rice fields with zero-drainage water management. Agric. Water Manag. 2008, 95, 887–894. [Google Scholar] [CrossRef]
  51. Clough, T.J.; Condron, L.M. Biochar and the Nitrogen Cycle: Introduction. J. Environ. Qual. 2010, 39, 1218–1223. [Google Scholar] [CrossRef]
  52. Prommer, J.; Wanek, W.; Hofhansl, F.; Trojan, D.; Offre, P.; Urich, T.; Schleper, C.; Sassmann, S.; Kitzler, B.; Soja, G.; et al. Biochar Decelerates Soil Organic Nitrogen Cycling but Stimulates Soil Nitrification in a Temperate Arable Field Trial. PLoS ONE 2014, 9, e86388. [Google Scholar] [CrossRef]
  53. Clough, T.J.; Bertram, J.E.; Ray, J.L.; Condron, L.M.; O’Callaghan, M.; Sherlock, R.R.; Wells, N.S. Unweathered Wood Biochar Impact on Nitrous Oxide Emissions from a Bovine-Urine-Amended Pasture Soil. Soil Sci. Soc. Am. J. 2010, 74, 852–860. [Google Scholar] [CrossRef] [Green Version]
  54. Yao, R.; Li, H.; Yang, J.; Zhu, W.; Yin, C.; Wang, X.; Xie, W.; Zhang, X. Combined application of biochar and N fertilizer shifted nitrification rate and amoA gene abundance of ammonia-oxidizing microorganisms in salt-affected anthropogenic-alluvial soil. Appl. Soil Ecol. 2022, 171, 104348. [Google Scholar] [CrossRef]
Figure 1. Temporal changes in ammonia-volatilization flux under (a) different biochar amounts and (b) different types of water management. Error bars represent the standard error (SE; n = 3). Arrows indicate the date of the nitrogen application. BF, TF, and PF are basal fertilizer, tillering fertilizer, and panicle fertilizer. CA: controlled irrigation without biochar addition as the control, CB: controlled irrigation with biochar addition at a rate of 20 t·ha−1, CC: controlled irrigation with biochar addition at a rate of 40 t·ha−1, FC: flooding irrigation with biochar addition at a rate of 40 t·ha−1.
Sustainability 14 01337 g001
Figure 2. Cumulative ammonia volatilization from paddy fields during the entire growth period. Error bars represent the standard error (SE; n = 3). The different letters among different treatments indicate significant difference, which was analyzed by the least significant difference (LSD) test (p = 0.05). CA: controlled irrigation without biochar addition as the control, CB: controlled irrigation with biochar addition at a rate of 20 t·ha−1, CC: controlled irrigation with biochar addition at a rate of 40 t·ha−1, FC: flooding irrigation with biochar addition at a rate of 40 t·ha−1.
Sustainability 14 01337 g002
Figure 3. Temporal changes in the inorganic nitrogen concentration in the surface soil solution (surface water) under (a,c,e) different biochar amounts and (b,d,f) different types of water management. Error bars represent the standard error (SE; n = 3). Arrows indicate the date of the nitrogen application. BF, TF, and PF are the basal fertilizer, tillering fertilizer, and panicle fertilizer, respectively. CA: controlled irrigation without biochar addition as the control, CB: controlled irrigation with biochar addition at a rate of 20 t·ha−1, CC: controlled irrigation with biochar addition at a rate of 40 t·ha−1, FC: flooding irrigation with biochar addition at a rate of 40 t·ha−1.
Sustainability 14 01337 g003
Figure 4. Soil NH4+-N (a), Soil NO3-N (b) content in the main stage of rice growth. Error bars represent the standard error (SE; n = 3). The different letters among different treatments indicate significant difference, which was analyzed by the least significant difference (LSD) test (p = 0.05). BT, TS, JS, MS, RS, and AH indicate before transplanting, tillering stage, jointing stage, milk-ripe stage, ripening stage, and after harvest, respectively. CA: controlled irrigation without biochar addition as the control, CB: controlled irrigation with biochar addition at a rate of 20 t·ha−1, CC: controlled irrigation with biochar addition at a rate of 40 t·ha−1, FC: flooding irrigation with biochar addition at a rate of 40 t·ha−1.
Sustainability 14 01337 g004
Figure 5. Urease activity in the main stage of rice growth. Error bars represent the standard error (SE; n = 3). The different letters among different treatments indicate significant difference, which was analyzed by the least significant difference (LSD) test (p = 0.05). BT, TS, JS, MS, RS, and AH indicate before transplanting, tillering stage, jointing stage, milk-ripe stage, ripening stage, and after harvest, respectively. CA: controlled irrigation without biochar addition as the control, CB: controlled irrigation with biochar addition at a rate of 20 t·ha−1, CC: controlled irrigation with biochar addition at a rate of 40 t·ha−1, FC: flooding irrigation with biochar addition at a rate of 40 t·ha−1.
Sustainability 14 01337 g005
Figure 6. AOA (a) and AOB (b) amoA gene copy numbers in the main period of rice growth. Error bars represent the standard error (SE; n = 3). The different letters among different treatments indicate significant difference. CA: controlled irrigation without biochar addition as the control, CB: controlled irrigation with biochar addition at a rate of 20 t·ha−1, CC: controlled irrigation with biochar addition at a rate of 40 t·ha−1, FC: flooding irrigation with biochar addition at a rate of 40 t·ha−1.
Sustainability 14 01337 g006
Table 1. Alpha-diversity analysis of AOA and AOB communities in the main period of rice growth.
MonthTreatmentAOAAOB
Chao1Observed_
Species
ShannonSimpsonGoods_ CoverageChao1Observed_
Species
ShannonSimpsonGoods_ Coverage
JulyCA4543733.8190.8160.9954503914.5800.9151.000
CB4363623.7670.8160.9964293704.7480.9231.000
CC3803093.3920.7270.9963933534.4520.9051.000
FC4693893.9350.8240.9955625164.2870.8840.999
AugustCA4403683.7120.8080.9963553273.4380.8031.000
CB4483693.7590.8160.9953763373.5150.8121.000
CC4213523.7330.8130.9963613253.4830.8081.000
FC4433184.0150.8510.9953182933.8210.8471.000
SeptemberCA2301774.5880.9180.9984173704.4630.9091.000
CB2441944.8010.9220.9974323714.8090.9281.000
CC2041594.0060.8670.9984143504.5030.9061.000
FC2121643.7230.8220.9984023534.2140.8911.000
Table 2. Correlation between nitrogen concentration in surface soil solution (surface water) and ammonia-volatilization flux of four treatments throughout the study periods. n = 84.
AV FluxNH4+-N ConcentrationNO3-N ConcentrationTN Concentration
AV flux1
NH4+-N concentration0.719 **1
NO3-N concentration0.525 **0.378 **1
TN concentration0.658 **0.783 **0.563 **1
** means highly significant (p < 0.01).
Table 3. Correlation between soil nitrogen content and ammonia-volatilization flux of four treatments at tillering stage, jointing stage, milk-ripe stage, and ripening stage. n = 16.
AV FluxSoil NH4+-N ContentSoil NO3-N ContentUrease Activity
AV flux1
Soil NH4+-N content0.1601
Soil NO3-N content0.809 **0.3811
Urease activity0.562 *0.541 *0.726 **1
* means significant (p < 0.05), ** means highly significant (p < 0.01).
Table 4. Correlation between log amoA gene copy numbers and ammonia-volatilization flux of four treatments in July, August, and September. n = 12.
AV FluxLog AOA amoA Gene Copy NumbersLog AOB amoA Gene Copy Numbers
AV flux1
log AOA amoA gene copy numbers0.0851
log AOB amoA gene copy numbers−0.390.654 *1
* means significant (p < 0.05).
Publisher’s Note: MDPI stays neutral with regard to jurisdictional claims in published maps and institutional affiliations.

