Article

Optimal Strategies for Elderly Public Transport Service Based on Impact-Asymmetry Analysis: A Case Study of Harbin

1
College of Landscape Architecture, Northeast Forestry University, Harbin 150040, China
2
School of Architecture, Harbin Institute of Technology, Harbin 150040, China
3
CAUPD Beijing Planning and Design Consultants Co., Ltd., Hainan Branch, Haikou 570100, China
*
Author to whom correspondence should be addressed.
Sustainability 2022, 14(3), 1320; https://doi.org/10.3390/su14031320
Submission received: 2 January 2022 / Revised: 16 January 2022 / Accepted: 21 January 2022 / Published: 25 January 2022

Abstract

:
The difficulty of travel for the elderly is a challenge for urban management. Quantifying the satisfaction of public transport services from the perspective of the elderly is a people-oriented scientific research method. Based on the survey data of 2019 and 2020 and by selecting the interview data of people over retirement age before analyzing the non-linear relationship between bus service elements and elderly satisfaction by the impact-asymmetry analysis and gradient boosting decision trees, the optimization strategy of ground public transportation for the elderly in Harbin was obtained. The results show that the following five factors have the greatest impact on overall satisfaction, namely, site broadcasting, complaint handling, awning facilities, driver driving habits, and the punctuality of bus operation. Among them, “awning,” the “punctuality of bus operation,” and “drivers’ driving habits” should be given priority to improve. The conclusion of this study provides a theoretical basis for the accurate optimization of public transport services.

1. Introduction

At the end of 2020, the proportion of the 60-year-old population in Harbin reached 24.1% [1], and the trend of aging is increasing. Under the premise of considering safety, the declining physical function of the elderly has prompted them to move from private cars to public transport instead of taking private cars as the primary mode of travel [2]. At the same time, with the increase in the elderly population, the elderly also bring about a sharp increase in traffic problems such as unnecessary travel and traveling alone [3], which leads to their being gradually excluded by the society (Figure 1).
The life of this generation of elderly people is richer and healthier than that of the previous generation, so it will also generate more travel demand. Compared with the young group, the elderly have differences in travel characteristics such as travel purpose, travel mode, and travel distance [4]. Public transport institutions should understand the travel needs of the elderly and their satisfaction with the current public transport services, so as to provide better services for the elderly, but the current construction of the public transport system is mainly based on surviving travel groups such as young and middle-aged people. The safety and comfort of the elderly when traveling by bus are often not guaranteed [5,6]: the elderly may fall and get injured due to improper driving; the discomfort of the elderly will increase in crowded carriages; it is difficult for the elderly to get on and off the bus because of the inconvenience of their legs and feet. These problems will make the elderly question the service provided by the bus when they travel, thus reducing the travel and then affecting the mental health of the elderly. Therefore, in-depth research on the bus travel service quality of the elderly will help to provide better public transport services, improve the travel well-being of the elderly, and contribute to the improvement in the social security system [7].
This study used the impact-asymmetry analysis (IAA), took the elderly passengers as the research object, analyzed the degree of satisfaction of various service elements on the overall satisfaction to explore the satisfaction of the elderly to the public transport service, and verified whether there is a non-linear and asymmetric relationship between the satisfaction of the service elements and the overall satisfaction; the research results provide optimization suggestions for the existing public transport services.
The structure of this article is as follows: the first section introduces the background of the research; the second section reviews the research on the travel of the elderly and bus satisfaction; the third section introduces the data-acquisition and analysis methods; and the fourth section discusses the analysis results. The fifth section highlights the research findings and puts forward policy recommendations.

2. Literature Review

In the research of bus travel of the elderly, most scholars explore the influencing factors of bus travel of the elderly from different angles. Bueher compared the current situation of aging in Germany and the United States and found that transportation policy will have a positive impact on the bus travel behavior of the elderly [8]. Anu and other studies found that family conditions, physical condition, income, and many other factors will affect the bus travel habits of the elderly [9]. Yao Enjian and others based on the data of the fifth comprehensive traffic survey in Beijing, through the construction of an MNL model, obtained results that showed that an off-peak discount and a ladder allowance will effectively regulate the travel behavior of the elderly [10]. Liu Jianrong and Hao Xiaoni used the random coefficient Logit model to analyze the survey data of declarative sexual preference and found that the subjective perception and psychological factors of the elderly will affect the walking time of the elderly to the bus stop [11]. Yalong Yuan and others developed a customer-satisfaction index for the elderly and calculated 10 important indicators that affect the elderly’s perception of service quality through the structural equation model; they found that service and safety, the convenience of taking the bus, and the driving habits of drivers are very important for the elderly [12].
Regarding public transport as a sustainable mode of transport, many scholars are committed to improving infrastructure or improving the quality of transport services to increase the passenger flow and the sustainability of public transport, such as building a “Purge” system in the city, allowing drivers to leave their vehicles in the park, and taking the parking lot on the outskirts of the city and then taking public transport to the city center [13,14,15]. In the research of traffic service quality and optimization, passenger satisfaction is the focus of many scholars at home and abroad [16,17]. In 2008, Jinning and Junzhi established a bus-passenger service-satisfaction index model, which reflected that the overall public-transport service level in Changchun was relatively high through quantitative analysis [18]. In 2015, Muwen used the Dutch bus passenger-satisfaction data and linear regression to study the impact of service attributes on overall satisfaction [19]. In 2018, based on the improved AHP method and fuzzy comprehensive evaluation, Wen Huiying et al. found that comfort and accessibility had the greatest impact on Guangfo intercity bus travel satisfaction [20]. In 2020, using the passenger-satisfaction data of Harbin, Fang Dewei and others determined that the ground public transport service should be optimized firstly through IPA-Kano [21].
To sum up, existing studies pay less attention to the actual feelings of the elderly on public transport travel, and the satisfaction of the elderly with the service quality provided by the existing public transport system will directly affect their travel experience. Meanwhile, scholars study passenger satisfaction through different methods and put forward corresponding suggestions and strategies for optimizing public transport services. These studies tend to cover all age groups and do not carefully distinguish between populations. However, due to the differences in physical condition and behavior habits, the existing research results are not applicable to elderly passengers [22,23].

3. Data and Methods

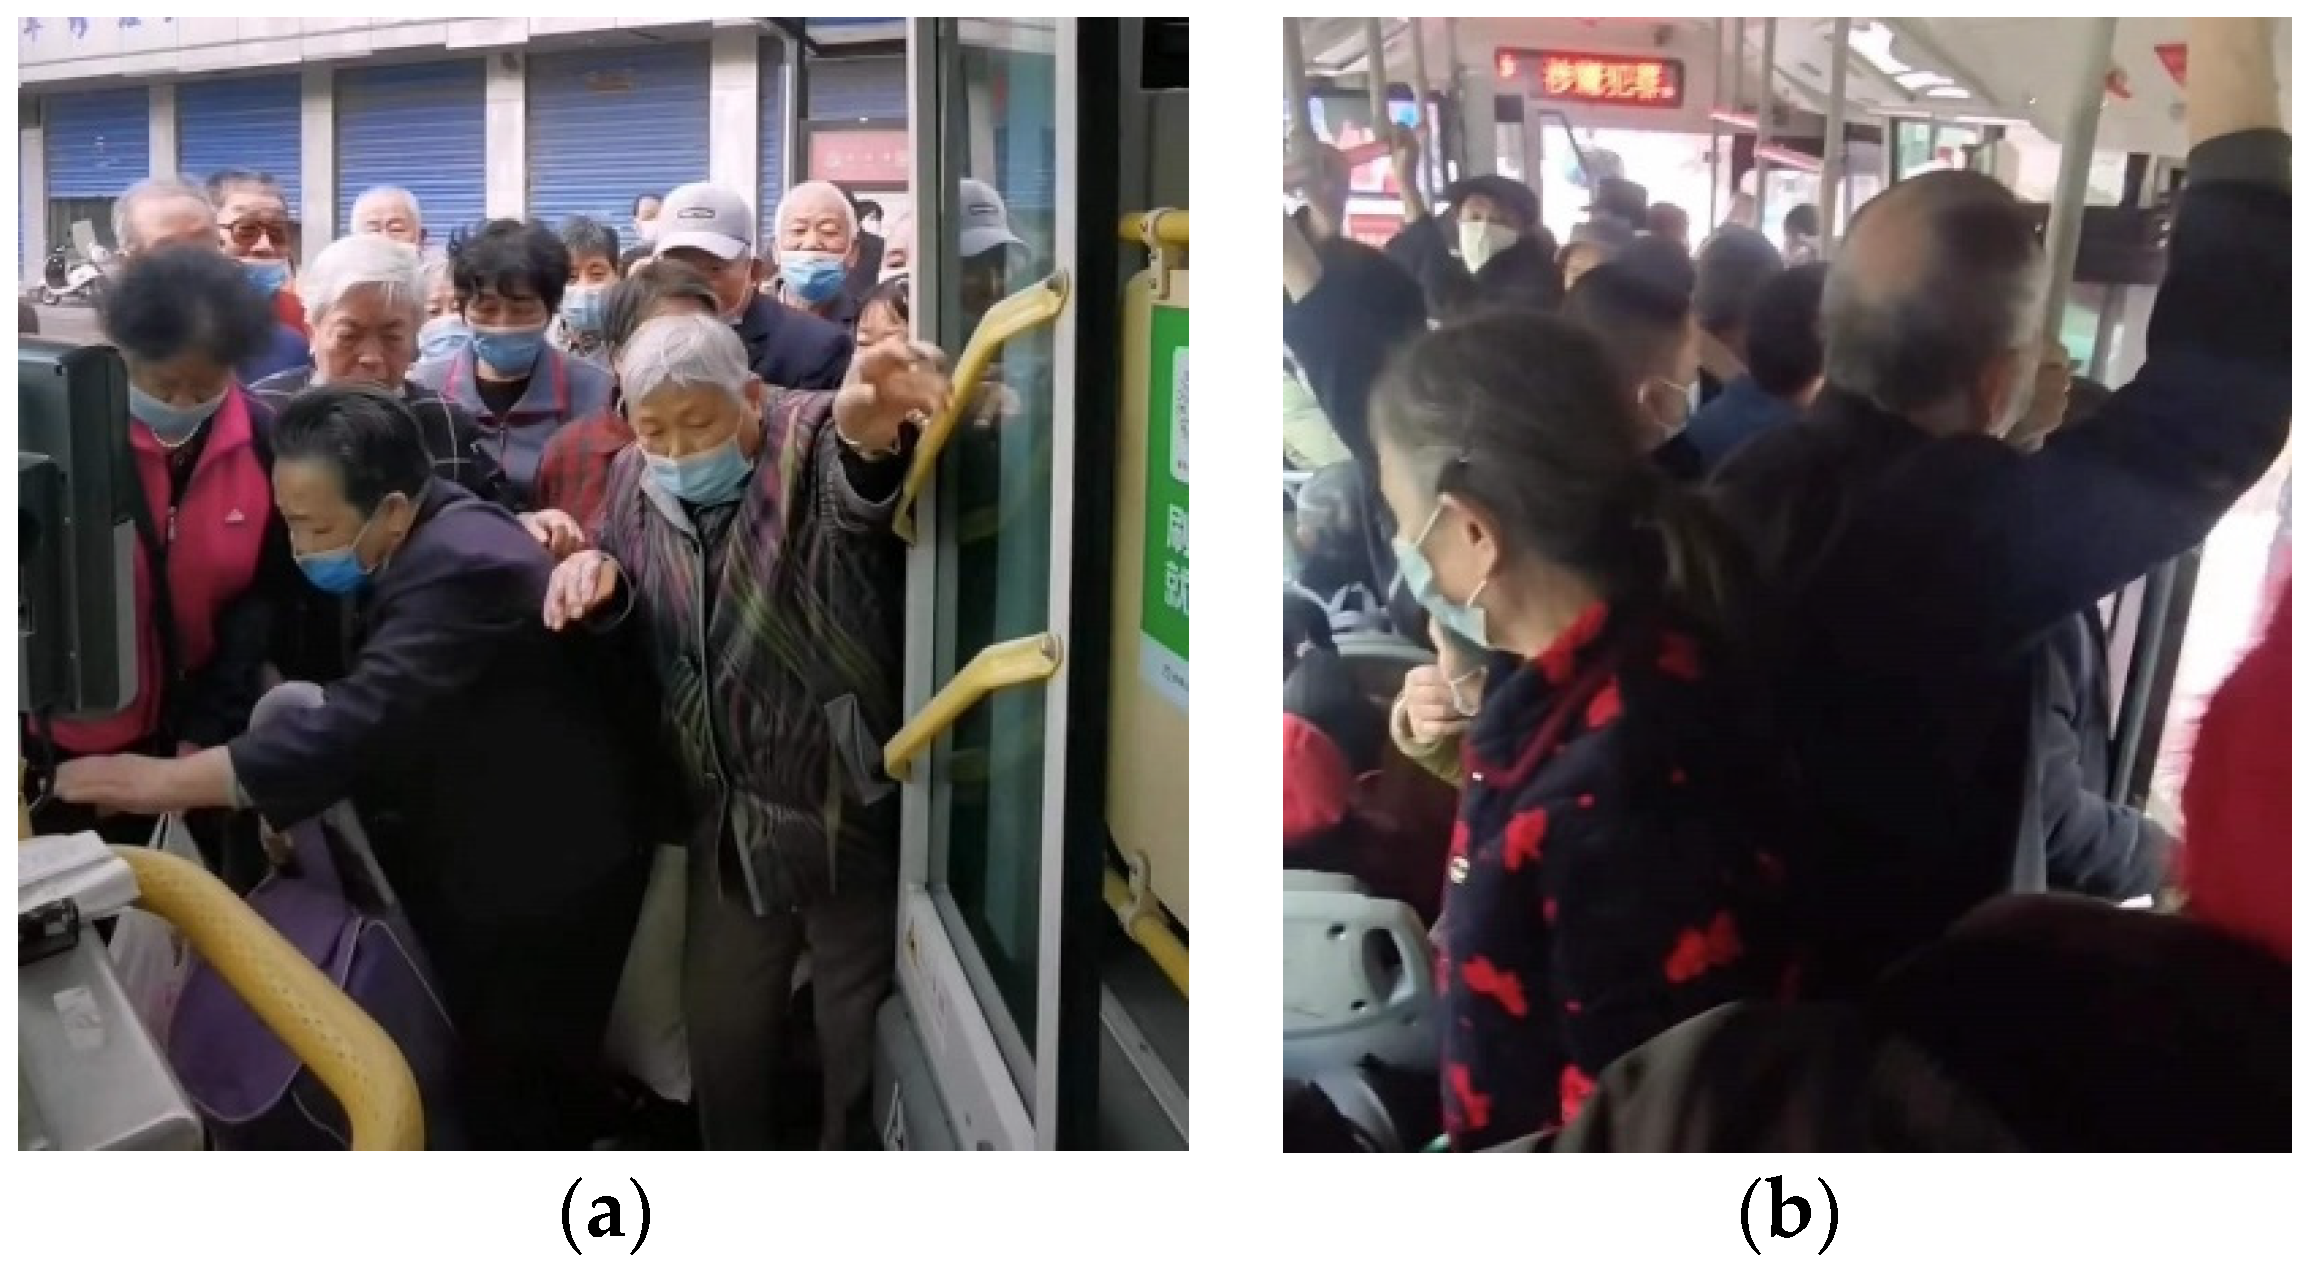
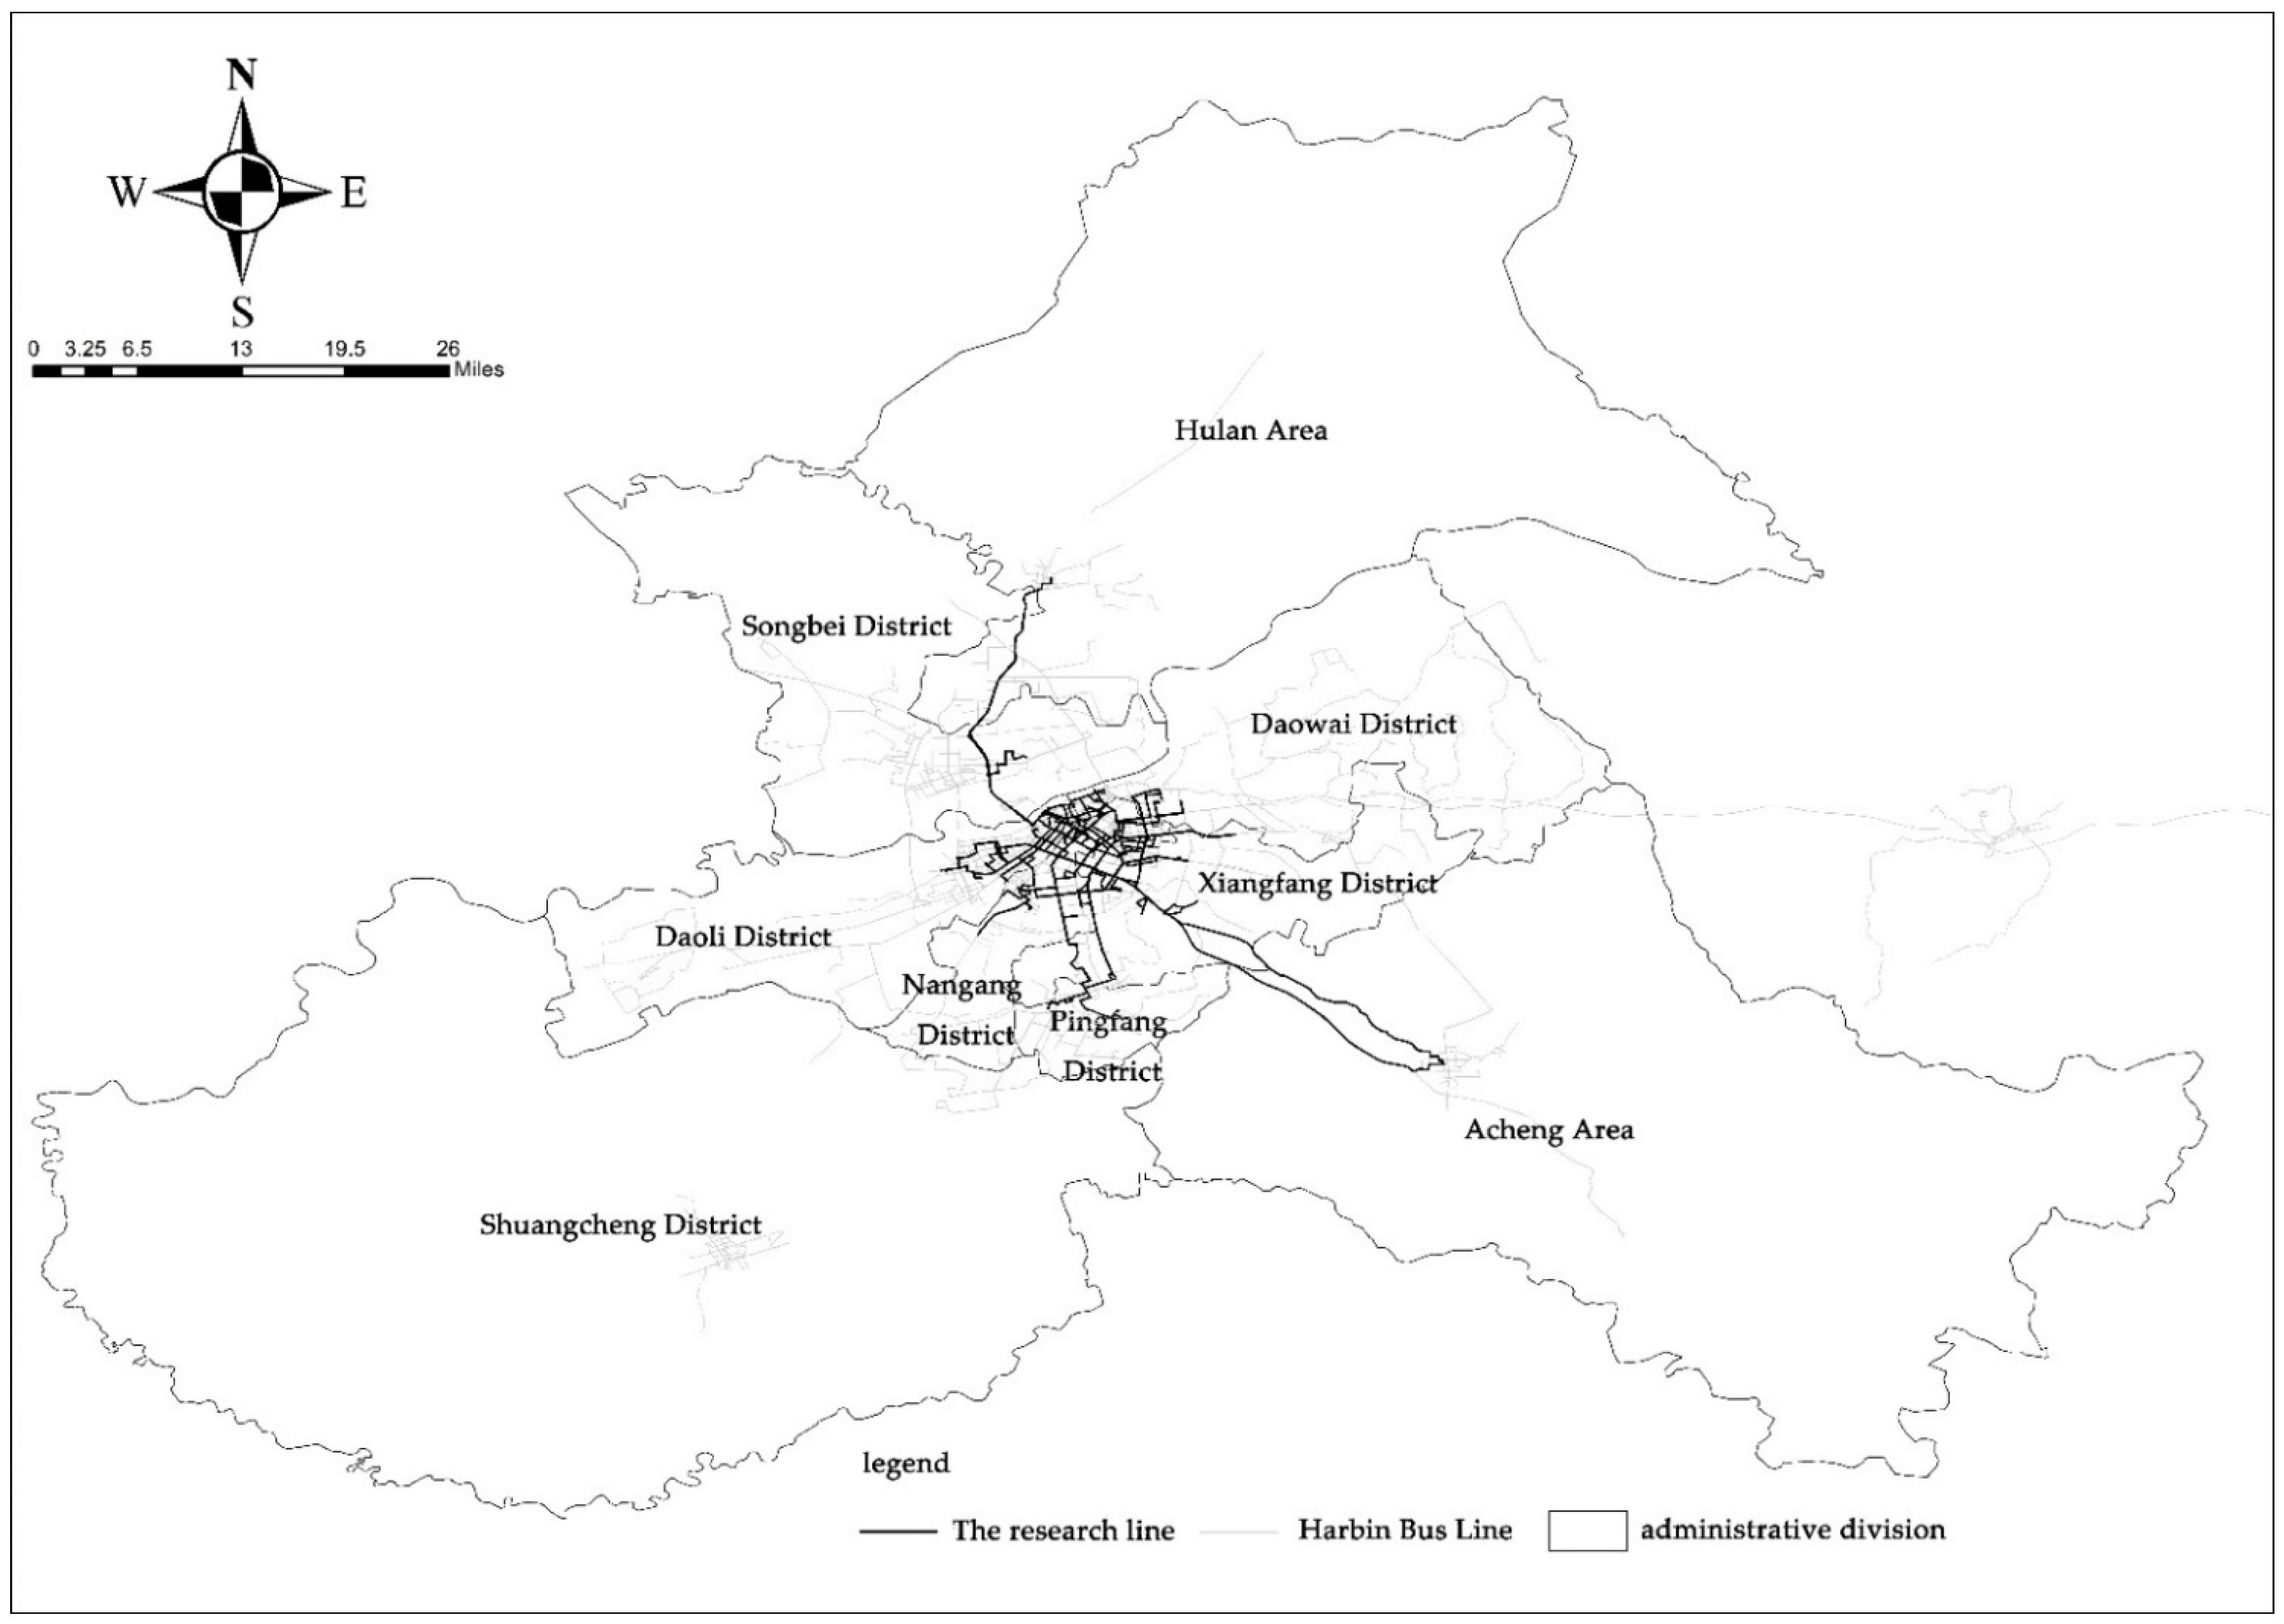
3.1. Data and Variables

The construction of the evaluation system of bus passenger satisfaction in Harbin is mainly based on national standards “Evaluation method of urban public transportation satisfaction” (GB/T36953.2-2018) [24], with safety, reliability, convenience, comfort, and economy as the criteria of the index system.
In the design of elements indicators, the evaluation system of bus travel for the elderly in Harbin is established by means of interviews and pre-investigation, as shown in Table 1.
The survey was conducted in Harbin, which is located in the northeast of China and is the capital of Heilongjiang Province. By the end of 2020, there were 322 coded bus lines in Harbin, with a total length of 7505 km.
The distribution of the questionnaire was carried out on weekdays and weekends on buses. The researchers involved in the questionnaire included undergraduates and graduate students from Northeast Forestry University, and they received two hours of training. They randomly handed out questionnaires at bus stops in cities, suburbs, and outer suburbs. The researchers followed the subjects to complete a complete questionnaire. The distribution of the questionnaire is divided into two periods: the first period is from May to June 2019, and a supplementary survey on the elderly was conducted from October to November 2020; a total of 908 valid questionnaires were obtained. The location distribution of the survey is shown in Figure 2. The survey covers three seasons: summer, autumn, and winter. According to the rough statistics of the investigators, more than 70% of the bus passengers interviewed answered the questionnaire. After excluding the questionnaires with missing data, we obtained a total of 264 samples of people over the age of 60.
Elderly passengers need to evaluate the satisfaction of 28 services in the questionnaire, as well as their overall satisfaction with public transport services, according to the Likert seven scale [25]. Among them, 7 points means “very satisfied”; 6 points means “satisfied”; 5 points means “relatively satisfied”; 4 points means “general”; 3 points means “dissatisfied”; 2 points means “dissatisfied”; and 1 point means “very dissatisfied.”
Among the respondents, elderly men accounted for 50.8%, and elderly women accounted for 49.2%; the proportion of men and women was basically the same. In terms of educational level, most of the elderly interviewed were in junior middle school, technical secondary school, or junior college, accounting for 40.5% and 29.2% of the total sample, respectively, consistent with the study on the education level of the elderly in China. In terms of family income, elderly passengers with a monthly total income of less than CNY 9000 accounted for 72.2%, indicating that most of the elderly passengers are low-and middle-income people, and bus travel is their daily travel habit, as shown in Table 2.
With the popularity of free bus cards in Harbin, most elderly passengers use free bus cards to pay fees. Most elderly passengers travel two to three times a week, of which 51.7% are elderly passengers who shop and hang out, and 24.5% are elderly passengers who have something to do. It can be seen that compared with the young and middle-aged people who need to work and go to school, most of the elderly residents in Harbin have plenty of time, where shopping, leisure, and entertainment are the main purposes of bus travel. In addition, the survey also found that about 37.9% of the elderly need to change to another bus when they travel, and they are relatively satisfied with the convenience of it.
As shown in Table 3, the overall satisfaction of the elderly with bus services is relatively high. In terms of satisfaction with the waiting station, the elderly are dissatisfied with infrastructure such as billboard facilities, station seats, awning facilities, and station trash bins. In the research stage, researchers also found that part of the sunshade construction length is not enough, and some station awnings have been damaged but cannot be maintained for a long time; the applicability of the waiting seat is low in winter due to material reasons; at the same time, the billboard at the station is too large, resulting in the elderly being unable to distinguish the difference between the stop sign and the billboard, which will affect the comfort of the elderly waiting for the bus and reduce the bus travel satisfaction of the elderly. When taking a bus, the elderly are dissatisfied with the speed of the car, the smoothness of the vehicle, the punctuality of the bus, and the safety in the car. The incompleteness of these service elements will make the comfort and safety of the elderly not guaranteed and reduce the travel experience of the elderly.

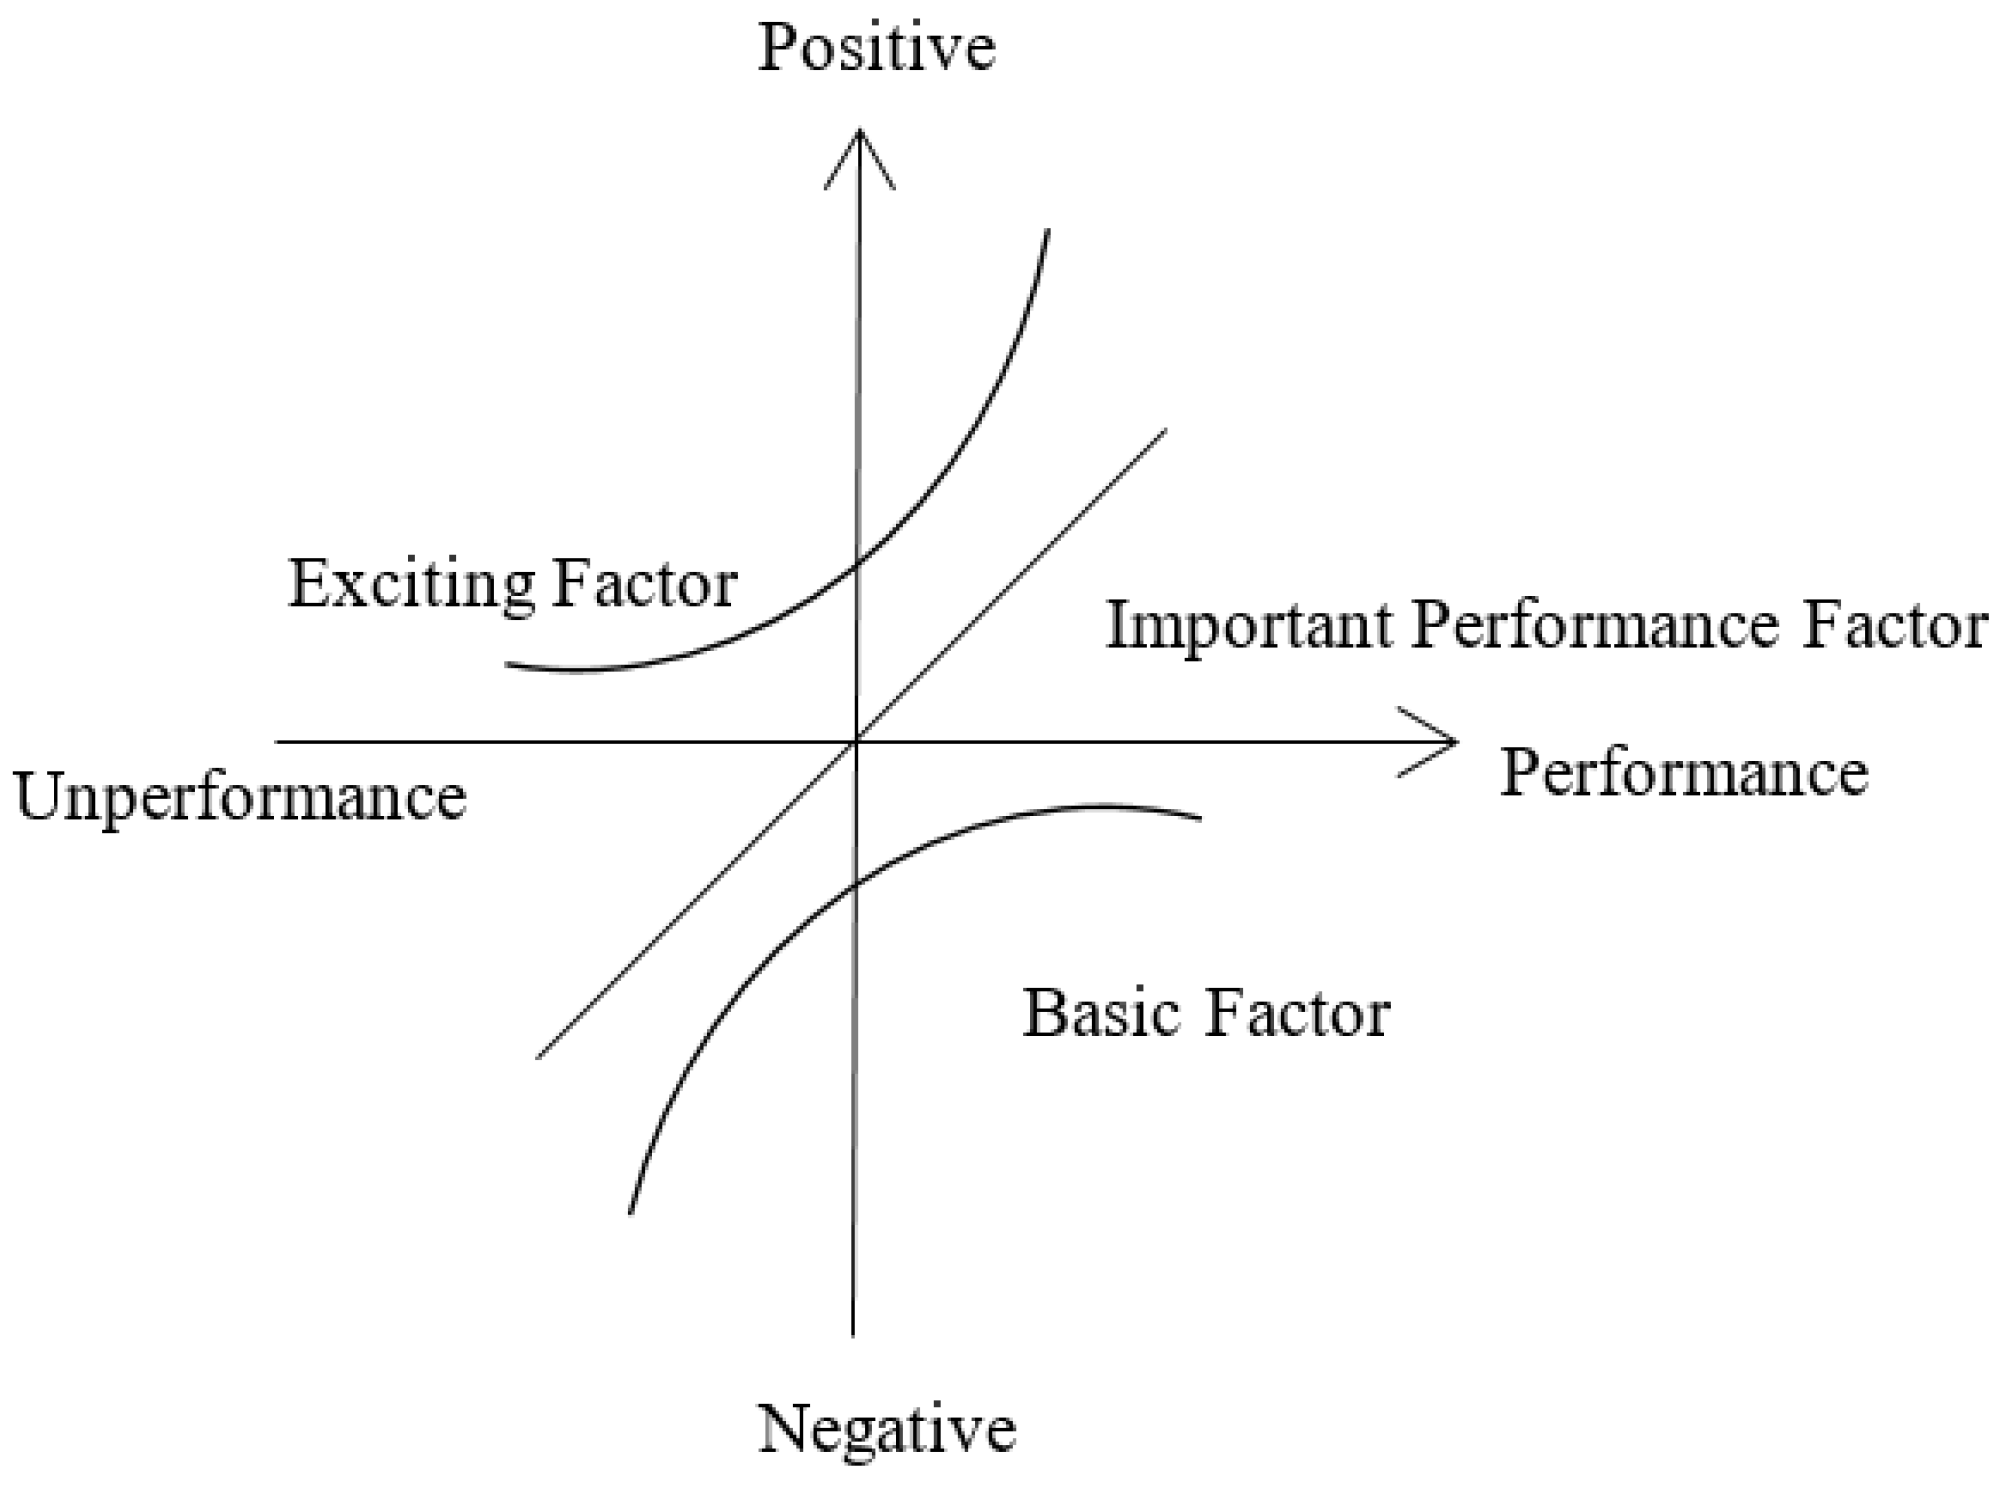
3.2. Impact-Asymmetry Analysis

The IAA classifies the different element types of the three-factor theory more finely and can give priority to the evaluation elements more accurately [26]. In 2020, Wu [27] used IAA to verify the non-linear and asymmetric relationship between Shuangcheng bus rapid transit service factor satisfaction and overall satisfaction.
According to the three-factor theory, a bus service attribute can be divided into three categories (Figure 3): basic factors, exciting factors, and performance factors [28]. The influence of basic factors and exciting factors on overall satisfaction is non-linear, while performance factors often have a linear influence. However, a performance factor may also have an asymmetric effect on overall satisfaction, but this asymmetry was ignored. In 2017, Cao et al. took service convenience as a performance factor of buses based on the three-factor theory. However, the impact of this factor on overall satisfaction is obviously asymmetric, because its ability to improve overall satisfaction was only 62% lower than that of overall satisfaction [29].
In the three-factor theory, the basic factor of poor performance is the first to be improved, followed by the one performance factor, and finally the exciting factors, because when its performance is poor, it has little impact on the overall satisfaction. However, this order of improvement ignores the actual impact of service attributes on overall satisfaction. If the impact of a basic factor of poor performance on overall satisfaction is not as large as that of a performance factor of poor performance, then this performance factor should give priority to improvement before this basic factor. Therefore, the priority of improvement should take into account the effect of service attributes: factors that have a greater impact on overall satisfaction should have a higher priority.
Therefore, Mikulic and Prebezac [30] put forward the IAA in 2008, which is different from the three-factor theory, to classify service attributes by significance (p < 0.05). They classified service attributes according to the impact of service attributes on overall satisfaction.
Satisfiers: if this element performs well, it will increase customer satisfaction. However, if this element performs poorly, it will not reduce satisfaction. These elements are usually seen as the icing on the cake; with advanced additional attributes, they are not necessary, but if you add these elements, it will significantly improve customer satisfaction.
Delighters: these elements are extreme situations that satisfy the elements, and if these elements are provided, it will greatly improve customer satisfaction.
Hybrids: these elements have a relatively linear and symmetrical relationship with overall satisfaction. If the performance is good, it will improve the customer satisfaction; if the performance is poor, it will reduce the customer satisfaction accordingly.
Dissatisfiers: if this factor performs poorly, it will significantly reduce customer satisfaction. However, when this element performs well, their ability to improve satisfaction is limited. These elements are generally considered to be the most basic requirement, but pouring resources into these elements is not enough to increase satisfaction.
Frustrators: these elements do not meet the extreme conditions of the elements; if these elements perform poorly, it will greatly reduce customer satisfaction.
In short, the delighters and satisfiers are equivalent to the exciting factor of the three factors; the dissatisfiers and frustrators are the basic factors, while the hybrids correspond to the performance factor of the three factors.
The research methods of bus passenger satisfaction are generally linear regression, structural equation modelling, and correlation analysis [31,32,33]. These methods all assume that there is only a linear and symmetrical relationship between the satisfaction of various service elements and the overall satisfaction. In this study, gradient boosting decision trees (GBDT) were used to evaluate the relative importance of various service attributes. The GBDT method is a tree-based integration approach: it builds many individual decision trees and then combines the results of those decision trees. Its goal is to iteratively explain the prediction error to approach the true value of the loss function and minimize the loss function until the loss function remains stable or reaches the minimum value [34]. The decision tree is the basic algorithm of the GBDT model. Compared with the traditional regression model, GBDT can show the relative importance of service attributes to overall satisfaction, which helps optimize ranking, meanwhile GBDT does not have to follow a specific data distribution; GBDT solves the problem of multicollinearity, making the results more accurate [35,36].
Through the gradient enhancement of the decision tree, a strong prediction model can be obtained. Given a sample of (y, x), the goal of GBDT is to fit a function F(x) so that the loss function [y, F(x)] is minimized. The final output of the gradient lifting model is:
F m ( x ) = F m - 1 ( x ) + ξ j = 1 j γ jm I ( x R jm ) , 0 < ξ 1
Among this, γ j m is the best R j m for each area, when x R j m , I = 1, otherwise, I = 0. ξ represents the contraction parameter, also known as the learning rate.
For a single decision tree, the following methods are proposed to approximate the relative importance of predictors x κ .
I κ 2 ( T ) = t = 1 J 1 τ ^ t 2 I ( v ( t ) = κ )
For summation of non-terminal nodes in the terminal node tree J , x κ is a split variable associated with node t , and τ ^ t 2 is the corresponding square error empirical improvement, as a result of x κ ’s predictor. For a group of decision trees { T m } 1 M , it can be obtained by using the method of gradient lifting, which can be obtained by the average of all trees in Formula (2):
I κ 2 = 1 M m = 1 M I κ 2 ( T m )

4. Discussion

4.1. Factor Classification

First of all, we re-encoded the satisfaction variable and re-encoded passengers’ satisfaction with bus service (1–7) into three values: −1 (very dissatisfied and dissatisfied), 0 (OK and relatively satisfied), and 1 (satisfied and very satisfied). It means lower than expectations, in line with expectations, and higher than expectations, respectively. Take the re-coded virtual variable as the independent variable and the overall satisfaction as the dependent variable for regression.
Then, we carried on with the comparative analysis of reward and punishment and used the GBDT model to calculate the influence of each service element on the overall satisfaction (POSS) when it is dissatisfied, neutral, and satisfied, which is expressed as possd, possn and posss, respectively. The range of influence of each service element on overall satisfaction (RIOS) is the difference between posss and possd. Its satisfaction-generating potential (SGP), that is, the ability to improve overall satisfaction, was calculated as (poss-possn)/RIOS; its dissatisfaction-generating potential (DGP), that is, the ability to reduce overall satisfaction, was calculated as (poss-possd)/RIOS), and its impact asymmetry (IA) index was calculated as SGP-DGP.
Finally, the categories were defined according to the thresholds used in Lee and Min [37]: delighters (IA ≥ 0.70), satisfiers (0.2 ≤ IA < 0.7), hybrids (−0.2 < IA < 0.2), dissatisfiers (−0.7 < IA ≤ −0.2), and frustrators (IA ≤ −0.7).
Using the gradient-boosting decision-tree method, a prediction model with 28 public transport service attribute was established, which took gender, income, education level, car ownership, travel purpose, travel frequency, and family size as control variables. As shown in Table 3, the learning rate was set to 0.01; the optimal number of iterations of the model was 3910; and the cross-test error was 0.5. To improve the accuracy of the results, we used a five-fold cross validation. The model provides the relative impact of 28 independent variables on overall satisfaction. Considering that the remaining 14 services had little impact on passenger satisfaction, we selected 14 services with a relative impact of at least 2% for further analysis.
The relative impact of 14 services on overall satisfaction was almost the same as the order of importance of their scope of influence (Table 4), which indicates the accuracy of the IAA method. The results show that the following five factors had the greatest impact on overall satisfaction, namely, site broadcasting, complaint handling, awning facilities, driver driving habits, and the punctuality of bus operation. Among them, the service element that had the greatest impact on the overall satisfaction was the station broadcast, whose RIS was 0.45, which also highlights the importance of voice broadcast arrival information to the bus satisfaction of the elderly. The main reason is that due to the current rapid development of Harbin, urban construction continues to accelerate. In 2019 alone, there were 45 new lines that opened, adjusted, and extended in Harbin, with an additional operating mileage of 704 km. Many elderly people are not familiar with the road conditions in the newly built areas, resulting in frequent misplaced or missed stops; secondly, as the elderly grow older, their hearing gradually weakens, and the noisy bus environment prevents them from getting station information in time. It can be seen that it is not difficult to understand that site broadcasting has become the service that can most affect the satisfaction of the elderly.
We used IAA to classify bus services. Among them, four bus services belong to pleasure factors, namely, in-car safety, in-car seating facilities, the convenience of walking to the bus stop, and the station sign, and three bus services are satisfaction factors for the elderly. They are station broadcasting, complaint handling, and other passenger behavior. There are six bus service elements that make elderly passengers unsatisfied, among which waiting comfort and station seats are frustrating services for the elderly. Awning facilities, the punctuality of bus operation, electronic stop signs, and station billboards are unsatisfactory services; in addition, drivers’ driving habits belong to performance attributes, which can increase with the increase in satisfaction and decrease with the decrease in satisfaction.

4.2. Improvement Priorities

In order to determine the priority of the improvement, we used RIOS and the IA index to draw the asymmetric matrix diagram of the impact of 14 attributes. As for the order of improvement, we should give priority to the service elements with high RIOS and low average satisfaction.
As shown in Figure 4, part I is the five services that have the greatest impact on overall satisfaction. Among them, station broadcast had the greatest impact on overall satisfaction, and it is a satisfaction factor. A satisfaction factor that does not meet the needs of passengers does not affect the overall satisfaction. Once they are raised above the level of satisfaction, passenger satisfaction increases significantly. The elderly are more satisfied with the station broadcasting service provided by buses at present. If the bus agencies continue to improve this service, they will get higher satisfaction. However, for the transit agency at present, the satisfaction level of the station broadcast is high, so there is no need to give priority to its improvement. While the driver’s driving habit is a performance factor, the relevant institutions to improve it will also improve passenger satisfaction. The elderly are less satisfied with the other three elements. Among them, the punctuality of buses and awnings are frustrators, and when they do not meet the needs of elderly passengers, they will significantly reduce overall satisfaction; so, priority should be given to optimizing these two elements to the satisfaction of the elderly. This will significantly improve the satisfaction of the elderly. Complaint handling is a satisfaction factor; its average satisfaction is low at present; and improving it is not enough to improve the satisfaction of elderly passengers.
Improving the remaining nine attributes may increase passenger satisfaction, but the impact is not so obvious. Among them, part II includes dissatisfaction factors and frustration factors, which are the most-basic factors in the composition of elderly passenger satisfaction. Among them, station seats and station billboards are significantly lower than the average satisfaction, so these two elements should be improved, but their impact on overall satisfaction is very low, and improving them cannot significantly improve the satisfaction of elderly passengers. So, bus agencies should improve these two aspects after the more-important attributes are optimized.
The third part is the satisfaction factors and pleasure factors; the satisfaction of the elderly to these factors is relatively high. It shows that the current public transport system in Harbin is not only complete in infrastructure construction but also in the construction of facilities to meet the basic needs of passengers and the completion of care measures.

5. Conclusions

This study integrated IAA and a gradient-enhancement decision tree to evaluate the bus travel satisfaction of elderly passengers. This innovative method can classify transport services more accurately and can use the scope of influence to establish the priority of improvement.
From the perspective of the elderly, this study discussed the factors that affect the bus travel satisfaction of the elderly. The specific conclusions are as follows:
First, according to the results of the data analysis, it is recommended that priority be given to improving the following services: “awning,” the “punctuality of bus operation,” “driver‘s driving habits,” and “site broadcast.” The following two factors should be considered for improvement after the main problem is solved: “station seats” and “station billboard.”
Second, the public-transport management agency in Harbin should promote the strategy of bus priority and improve the punctuality of the buses by opening up more bus lines, increasing the construction of special trunk roads for buses, and shortening the departure time during rush hours. Additionally, it should increase and improve the broadcast device on the bus for the elderly passengers, so as to make the voice broadcast clear. At the same time, it should optimize the platform infrastructure, carry out regular inspection, and strengthen the quality training of bus drivers. This helps to improve the travel experience and comfort of elderly passengers.
Third, this study provided implications for the future bus-system planning for the elderly in Harbin and other cities. Future decision makers can better understand the service elements that have the greatest impact on overall satisfaction from the perspective of aging. The bus company can carry on the initial construction of the public transportation system according to the importance of the service attribute.
The results show that 50% of these attributes affect overall satisfaction only when they are well built. When the bus service is not well built, there are six attributes that will affect the overall satisfaction. This shows the asymmetry of the service attribute, but the previous satisfaction research generally uses the linear hypothesis, and the future research should fully take into account the asymmetry of the attribute in order to reduce the deviation.
In addition, although the sample size of this study was small, this is not a problem. GBDT can rely on decision trees and promotion to deal with small sample data. In the field of transportation, Wu and others [27] have verified that 229 sample sizes can still provide accurate predictions. Because the application of IAA has its limitations, there is no relevant theoretical guidance for the selection of the threshold of asymmetric indicators, and most of the related studies take 0.2 and −0.2 as the threshold to distinguish between linear and nonlinear effects [37].

Author Contributions

Conceptualization, D.F. and J.L.; methodology, D.F. and J.L.; validation, J.L. and Y.X.; formal analysis, Y.X.; investigation, D.F., J.L., Q.Z. and Y.X.; resources, D.F.; writing—original draft preparation, J.L.; writing—review and editing, J.L.; visualization, D.F.; supervision, D.F.; project administration, D.F.; funding acquisition, D.F. All authors have read and agreed to the published version of the manuscript.

Funding

This research was funded by National Natural Science Foundation of China, grant number 71901057.

Institutional Review Board Statement

Not applicable.

Informed Consent Statement

Not applicable.

Data Availability Statement

The basic data are available from the first author upon request.

Acknowledgments

Support for this research from the National Natural Science Foundation of China is gratefully acknowledged. The authors are also grateful to the seniors who completed the questionnaire and the students who distributed the questionnaire.

Conflicts of Interest

The authors declare no conflict of interest.

References

  1. 2020 Harbin National Economic and Social Development Statistical Bulletin. Available online: http://www.harbin.gov.cn/art/2021/4/30/art_25924_1099261.html (accessed on 29 April 2021).
  2. Hu, X.; Wang, J.; Wang, L. Understanding the Travel Behavior of Elderly People in the Developing Country: A Case Study of Changchun, China. Procedia-Soc. Behav. Sci. 2013, 96, 873–880. [Google Scholar] [CrossRef] [Green Version]
  3. Feng, J.; Yang, Z. Factors influencing travel behavior of urban elderly people in Nanjing. Prog. Geogr. 2015, 34, 1598–1608. [Google Scholar]
  4. Lee, K.S.; Eom, J.K.; Lee, J.; Ko, S. Analysis of the Activity and Travel Patterns of the Elderly Using Mobile Phone-Based Hourly Locational Trajectory Data: Case Study of Gangnam, Korea. Sustainability 2021, 13, 3025. [Google Scholar] [CrossRef]
  5. Chang, H.-L.; Wu, S.-C. Applying the Rasch measurement to explore elderly passengers’ abilities and difficulties when using buses in Taipei. J. Adv. Transp. 2010, 44, 134–149. [Google Scholar] [CrossRef]
  6. Broome, K.; Worrall, L.; Fleming, J.; Bolody, D. Evaluation of age-friendly guidelines for public buses. Transp. Res. Part A Policy Pract. 2013, 53, 68–80. [Google Scholar] [CrossRef]
  7. Li, Z.; Zhen, F.; Zhang, S.; Yang, Y. Seasonal and spatiotemporal differences in the public transport-based mobility of elderly population: A case study of Wuhu City in Anhui Province. Prog. Geogr. 2021, 40, 293–303. [Google Scholar] [CrossRef]
  8. Bühler, R.; Nobis, C. Travel Behavior in Ageing Societies: A Comparison of Germany and the United States. In Proceedings of the Transportation Research Board, 89th Annual Meeting (TRB), Washington, DC, USA, 10–14 January 2010. [Google Scholar]
  9. Siren, A.; Hakamies-Blomqvist, L. Private car as the grand equaliser? Demographic factors and mobility in Finnish men and women aged 65+. Transp. Res. Part F Traffic Psychol. Behav. 2004, 7, 107–118. [Google Scholar] [CrossRef]
  10. Yao, E.; Yan, Z.; Huan, N. Evaluation on subsidy policy of public transport ticket considering elderly travel behavior. J. Transp. Syst. Eng. Inf. Technol. 2019, 19, 13–19. [Google Scholar] [CrossRef]
  11. Liu, J.; Hao, X. Effect of bus stop walking time on elderly’s bus choice. J. Transp. Syst. Eng. Inf. Technol. 2020, 20, 124–129. [Google Scholar] [CrossRef]
  12. Yuan, Y.; Yang, M.; Wu, J.; Rasouli, S.; Lei, D. Assessing bus transit service from the perspective of elderly passengers in Harbin, China. Int. J. Sustain. Transp. 2019, 13, 761–776. [Google Scholar] [CrossRef]
  13. Macioszek, E.; Kurek, A. The Use of a Park and Ride System—A Case Study Based on the City of Cracow (Poland). Energies 2020, 13, 3473. [Google Scholar] [CrossRef]
  14. Kitthamkesorn, S.; Chen, A.; Opasanon, S.; Jaita, S. A P-Hub Location Problem for Determining Park-and-Ride Facility Locations with the Weibit-Based Choice Model. Sustainability 2021, 13, 7928. [Google Scholar] [CrossRef]
  15. Macioszek, E.; Kurek, A. The Analysis of the Factors Determining the Choice of Park and Ride Facility Using a Multinomial Logit Model. Energies 2021, 14, 203. [Google Scholar] [CrossRef]
  16. Ji, J.; Hu, W. Research on the Influential Factors of Urban Public Transportation on Public Satisfaction in China: An Empirical Study Based on “2012 Lien Public Service Quality Survey for Chinese Cities”. Soft Sci. 2015, 29, 10–14. [Google Scholar]
  17. Van Lierop, D.; Badami, M.G.; El-Geneidy, A.M. What influences satisfaction and loyalty in public transport? A review of the literature. Transp. Rev. 2018, 38, 52–72. [Google Scholar] [CrossRef]
  18. Jin, N.; Juan, Z. Public transport service level based on customer satisfaction. J. Jilin Univ. 2008, 38, 63–66. [Google Scholar]
  19. Mouwen, A. Drivers of customer satisfaction with public transport services. Transp. Res. Part A 2015, 78, 1–20. [Google Scholar] [CrossRef]
  20. Wen, H.; Wu, L.; Mei, J. Fuzzy comprehensive evaluation of Guangzhou-Foshan public transit satisfaction of inter-city based on improved AHP method. ACTA Sci. Nat. Univ. Sunyatseni 2018, 57, 64–71. [Google Scholar]
  21. Fang, D.; Wang, X.; Sun, S. Optimization Strategies of Bus Transit Service Quality Based on IPA-Kano Model—A Case Study of Public Transport in Harbin City. Sci. Technol. Eng. 2020, 20, 13454–13459. [Google Scholar]
  22. Liu, J.; Hao, X.; Shi, W. Impact of COVID-19 on the Elderly’s Bus Travel Behavior. J. Transp. Syst. Eng. Inf. Technol. 2020, 20, 71–76. [Google Scholar]
  23. Liu, W.; Li, W.; Die, Q.; Zhou, Q.; Pan, Z. Research on bus travel behavior of the elderly based on IC card data. Syst. Eng. 2021, 39, 90–100. [Google Scholar]
  24. GB/T 36953.2-2018, Evaluation Method of Urban Public Transportation Passenger Satisfaction—Part 2: Bus and Trolleybus Transit. Available online: http://www.gbstandards.org/GB_standard_english.asp?code=GB/T%2036953.2-2018 (accessed on 28 December 2018).
  25. Jou, R.C.; Day, Y.J. Application of Revised Importance–Performance Analysis to Investigate Critical Service Quality of Hotel Online Booking. Sustainability 2021, 13, 2043. [Google Scholar] [CrossRef]
  26. Fang, D.; Xue, Y.; Cao, J.; Sun, S. Exploring satisfaction of choice and captive bus riders: An impact asymmetry analysis. Transp. Res. Part D Transp. Environ. 2021, 93, 102798. [Google Scholar] [CrossRef]
  27. Wu, X.; Cao, X.J.; Ding, C. Exploring rider satisfaction with arterial BRT: An application of impact asymmetry analysis. Travel Behav. Soc. 2020, 19, 82–89. [Google Scholar] [CrossRef]
  28. Matzler, K.; Sauerwein, E.; Heischmidt, K. Importance-performance analysis revisited: The role of the factor structure of cus-tomer satisfaction. Serv. Ind. J. 2003, 23, 112–129. [Google Scholar] [CrossRef]
  29. Cao, J.; Cao, X. Comparing importance-performance analysis and three-factor theory in assessing rider satisfaction with transit. J. Transp. Land Use 2017, 10, 837–854. [Google Scholar] [CrossRef] [Green Version]
  30. Mikulić, J.; Prebežac, D. Prioritizing improvement of service attributes using impact range-performance analysis and impact-asymmetry analysis. Manag. Serv. Qual. 2008, 18, 4529. [Google Scholar] [CrossRef]
  31. Sun, S.-C. An Evaluation Approach for Public Transit Loyalty Considering Passengers’ Emotional Value. J. Transp. Syst. Eng. Inf. Technol. 2020, 20, 158–165. [Google Scholar]
  32. Sun, S.; Fang, D.; Cao, J. Exploring the asymmetric influences of stop attributes on rider satisfaction with bus stops. Travel Behav. Soc. 2020, 19, 162–169. [Google Scholar] [CrossRef]
  33. Li, R.; Chen, J.; Fu, Z.; Peng, Y. Passenger Satisfaction Analysis of Customized Bus Based on Structural Equation Model. Sci. Technol. Eng. 2020, 20, 10499–10503. [Google Scholar]
  34. Dong, W.; Cao, X.; Wu, X.; Dong, Y. Examining pedestrian satisfaction in gated and open communities: An integration of gradient boosting decision trees and impact-asymmetry analysis. Landsc. Urban Plan. 2019, 185, 246–257. [Google Scholar] [CrossRef]
  35. Shao, Q.; Zhang, W.; Cao, X.; Yang, J.; Yin, J. Threshold and moderating effects of land use on metro ridership in Shenzhen: Implications for TOD planning. J. Transp. Geogr. 2020, 89, 102878. [Google Scholar] [CrossRef]
  36. Zhang, W.; Zhao, Y.; Cao, X.; Lu, D.; Chai, Y. Nonlinear effect of accessibility on car ownership in Beijing: Pedestrian-scale neighborhood planning-ScienceDirect. Transp. Res. Part D Transp. Environ. 2020, 86, 102445. [Google Scholar] [CrossRef]
  37. Lee, J.-S.; Min, C.-k. Prioritizing convention quality attributes from the perspective of three-factor theory: The case of academic association convention. Int. J. Hosp. Manag. 2013, 35, 282–293. [Google Scholar] [CrossRef]
Figure 1. Current situation of bus travel for the elderly. (a) Unnecessary travel. (b) The peak travel.
Sustainability 14 01320 g001
Figure 2. Distribution map of survey locations.
Sustainability 14 01320 g002
Figure 3. Three-factor theoretical-model diagram.
Sustainability 14 01320 g003
Figure 4. Impact-Asymmetry Analysis Chart. Note: The numbers in parentheses are the average performance of each attribute.
Sustainability 14 01320 g004
Table 1. Evaluation index of bus-service elements.
Criterion IndexFirst Level IndicatorSecondary Indicators
SafetyOperation safetyTravel speed
Driving smoothness
In-car safety
Station orderWaiting safety
ReliabilityFacilities and equipmentStation sign design
Station camera
Station street lamp
Station seats
Awnings
Station trash can
Station billboards
ConvenienceService informationStation sign
Electronic stop signs
Station broadcast
Complaint handling
Operation organizationBus coverage in urban areas
Departure time of the first and last bus
Punctuality of buses
Line station settingBus stop searchability
Travel processConvenience of walking to the bus stop
ComfortStation environmentWaiting comfort
Interior sanitation
Degree of congestion in the bus
In-car seating
Other passenger behavior
Driving serviceDriver’s driving habit
Driver service attitude
EconomyFare levelBus fare
Table 2. Basic information collection.
DemographicsCategoryPercentage
GenderMen50.8%
Women49.2%
Education levelElementary level or lower;6.5%
Junior middle-school level40.5%
High school11.3%
Vocational high school29.2%
Bachelor’s degree10.1%
Postgraduate degree2.4%
Monthly household income<300014.1%
(CNY)3001–500023.1%
5001–700017.1%
7001–900017.9%
9001–15,00012.0%
15,001–20,0009.0%
20,001–30,0004.7%
>30,0002.1%
Travel purposeShopping23.8%
Private affairs24.5%
Work1.9%
Play27.9%
See the doctor14.7%
Get home4.5%
Other2.7%
Travel frequencyUp to 4 days per month23.4%
2–3 times a week41.1%
4–5 times a week21.5%
6–7 times a week14.0%
Table 3. Descriptive statistics of elderly satisfaction.
Service Attributes1234567Mean Satisfaction
Waiting safety19141315939104.5
Waiting comfort2830878640104.5
Station sign design071993924944.6
Station sign042381945574.7
Electronic stop signs38241015949194.6
Station billboards31728136551824.1
Station camera443597843814.4
Station street lamp11016105923444.5
Station seats7324577613644.0
Awnings42133104613454.2
Station trash can1245096682134.0
Overall waiting environment0321100993464.6
Bus coverage in urban areas02191001023184.6
Bus stop searchability082083836374.7
Convenience of walking to the bus stop0818778561154.8
Departure time of the first and last bus0815938847134.7
Punctuality of buses11235110643484.3
Travel speed120411056225104.2
Driving smoothness3186095483644.1
Bus fare3516586490285.1
Station broadcast1424579763164.9
Degree of congestion in the bus3194397692584.2
Interior sanitation0820101913594.6
In-car safety0513100845844.7
In-car seating4344475584084.1
Other passenger behavior0162492963234.4
Driver service attitude210167410347104.7
Driver’s driving habit11032718354114.6
Complaint handling3143195773854.4
Overall satisfaction011886985384.8
Table 4. Service attribute classification.
Service AttributesRelative Importance (%)RIOSSGPDGPIAClassificationSatisfaction Average
Station broadcast9.760.450.620.380.24Satisfiers4.90
Driver’s driving habit7.590.340.500.500.00Hybrids4.65
Awnings7.470.350.370.63−0.26Dissatisfiers4.22
Punctuality of buses5.730.330.270.73−0.45Dissatisfiers4.36
Complaint handling5.250.360.610.390.22Satisfiers4.38
Waiting comfort4.650.190.110.89−0.79Frustrators4.55
In-car seating3.610.160.880.120.75Delighters4.14
In-car safety3.520.211.000.001.00Delighters4.72
Electronic stop signs2.860.180.280.72−0.44Dissatisfiers4.63
Other passenger behavior2.620.210.670.330.33Satisfiers4.43
Convenience of walking to the bus stop2.390.140.860.140.71Delighters4.83
Station sign2.190.130.920.080.85Delighters4.64
Station billboards2.120.100.200.80−0.60Dissatisfiers4.10
Station seats2.080.090.001.00−1.00Dissatisfiers4.06
Publisher’s Note: MDPI stays neutral with regard to jurisdictional claims in published maps and institutional affiliations.

