Article

E-commerce Adoption and Technical Efficiency of Wheat Production in China

1
China Academy of Rural Development (CARD), Zhejiang University, Hangzhou 310058, China
2
Department of Agricultural, Food and Resource Economics, Michigan State University, East Lansing, MI 48824-1039, USA
*
Author to whom correspondence should be addressed.
Sustainability 2022, 14(3), 1197; https://doi.org/10.3390/su14031197
Submission received: 15 December 2021 / Revised: 12 January 2022 / Accepted: 17 January 2022 / Published: 21 January 2022

Abstract

:
Improving technical efficiency (TE) is crucial for the sustainable growth of smallholder agriculture in developing countries. While there has been a large literature investigating the determinants of smallholders’ agricultural technical efficiency, little is known about the effect of e-commerce on agriculture and crop production efficiency despite the growing importance of rural e-commerce in developing countries. This study, therefore, bridges the research gap by examining the impact of e-commerce adoption on TE using household survey data of wheat farmers in China. We employ the combination of propensity score matching (PSM) and a selectivity-corrected stochastic production frontier model to address the possible selection biases stemming from both observable and unobservable factors. We found that e-commerce adoption would lead to a 2.75 per cent increase in the technical efficiency of wheat production. Our study also complements the existing research of rural e-commerce, which mainly focuses on the benefits of e-commerce from the perspective of market opportunity and farmers’ welfare.

1. Introduction

Enhancing agricultural productivity and technical efficiency is widely perceived as a key strategy for sustainable rural advancement in developing countries, especially in China, where smallholder farmers make up 99% of the nation’s total agricultural producers [1]. Technical efficiency is the effectiveness with which a given set of inputs is used to produce an output, which is often measured by the ratio of farmers’ observed output to the maximum realizable output given the existing inputs [2,3,4,5]. However, smallholder farmers usually face multiple complex production and marketing challenges that hinder the technical efficiency of their agricultural production. For example, the high transaction costs of accessing inputs and output markets, the unavailability of modern technologies, and the limitations of farmers’ skillsets are among some of the key constraints [6,7,8,9,10,11,12]. These, in turn, constrain farmers’ optimal decision-making strategies, not only for their initial production decisions but also for harvesting, storage, and marketing decisions. As a result, the technical efficiency for smallholder farmers is relatively low in developing countries [11,13], posing challenges to their sustainable development in modern agriculture.
Improving technical efficiency has long been of interest by policymakers and scholars. While the scholarly interest in the technical efficiency of agricultural production can be dated back to the 1970s [14], it was not until the 1990s that the technical efficiency of agricultural production became a popular empirical research topic among agricultural economists [15]. In recent years, there has been a renewed interest in this topic, and a large number of empirical studies have emerged to understand the factors affecting agricultural production’s technical efficiency [16,17,18].
The related literature has identified a broad range of factors that potentially influence the technical efficiency and productivity of agricultural production. These factors include government R&D spending on agricultural research [7,9,19], agricultural extension services and technical training [20,21], institutional and market reform [22,23,24], land tenure security and the functioning of land rental [6,25,26], agricultural cooperatives [16,20,21,27], the reduction of input costs due to the improvement of markets and/or bargaining power [28,29], and off-farm employment and migration [28,29,30]. A growing number of recent studies focus on the role of Information and Communication Technologies (ICTs) in agricultural production and technical efficiency. Overall, the adoption of ICTs (e.g., mobile phones and Internet) is found to be positively correlated with the improvement of technical efficiency [12,31,32].
Despite the large and active literature exploring factors affecting the technical efficiency of agricultural and crop production, there exists a considerable gap in the literature. More specifically, we are not aware of any study that investigates the possible effect of e-commerce on the technical efficiency on agricultural and crop production. We define e-commerce adoption as the enablement of farmers to participate in online trade, including both selling and buying, as is consistent with previous studies [33,34,35]. Recent years have witnessed that (1) e-commerce has rapidly emerged in the developing world, and (2) e-commerce is an important type of ICT focusing on digital transactions and mechanization. We posit that the adoption of e-commerce can potentially affect smallholder farmers’ production efficiency. By directly matching and connecting buyers and sellers (especially those living in rural regions), via the Internet, e-commerce reduces transaction costs and facilitates the exchange of goods, services, information, and knowledge. The process improves their ability to access markets while greatly reducing the transaction costs [36,37], and thus may lead to potential changes in agricultural production and technical efficiency. Nevertheless, to the best of our knowledge, such potential is yet to be explored.
Therefore, we aim to fill the research gap by empirically exploring the impact of e-commerce adoption on the technical efficiency of crop production. Our research contributes to the existing literature in three ways: Firstly, we are the very first study to provide quantitative evidence of the impact of e-commerce on the technical efficiency of agricultural production. This is important, given that e-commerce is quicker than ever in changing rural societies and agriculture [38,39,40]. Secondly, our study further extends the existing literature exploring the roles of e-commerce in rural economic development. The existing research on rural e-commerce is typically based on cases or limited data from small sample surveys [36,39,41,42,43]. Of the few quantitative studies, most have delved into the impact of e-commerce adoption on farmers’ welfare and household income growth, and few have investigated its effect on agricultural production [33,44,45]. Thirdly, we employ an empirical method that corrects for self-selectivity biases arising from both observable and unobservable factors. Specifically, we use the propensity score matching method to address the selection bias arising from the observed factors and the selectivity-corrected stochastic frontier approach developed by Green to address the selection bias arising from unobservable factors [19,20,46].
Our study focuses on the wheat crop because (1) China is the biggest wheat producer in the world, and (2) its productivity is relatively low. According to FAOSTAT, wheat yield in China was 5.48 tons/hectare in 2017, ranking only 20th globally. It is documented that there exists a considerable gap between the actual yield and the yield potential in China’s wheat production [47,48]. Enhancing wheat’s technical efficiency and productivity is, therefore, essential to ensure both food security and farmers’ welfare. Using a micro dataset from rural households in top-tier wheat-producing provinces in China, we found that the adoption of e-commerce would increase the technical efficiency by approximately 2.75 per cent, which is in line with previous studies on ICTs.
This paper is organized as follows: Section 2 briefly recounts the background of China’s rural e-commerce and introduces the background-based data collection procedure, followed by Section 3, the estimation strategy where we briefly introduce selectivity-corrected SPF model combined with propensity score matching. Section 4 reports the descriptive and empirical results with the discussion of relevant findings, and, finally, Section 5 concludes the article with policy implications and discusses the limitations and future research directions.

2. Background and Data Collection

2.1. Rapid Emergence of Rural E-commerce in China

Rural e-commerce in China has undergone a rapid development in the past decade. Overall, the value of rural online retail sales has increased from USD 27.99 billion in 2014 to USD 278.25 billion in 2020, accounting for 15.2% of the total national online retail sales, with a year-on-year growth exceeding 30% for six consecutive years since 2015. The total value of online agri-product retail sales topped USD 61.81 billion in 2019, with a year-on-year growth of 27%, which is 10.5% higher than the average growth rate of national online retail sales [49]. The rapid development of rural e-commerce in the past decades has been gaining increasing recognition internationally for its potential in promoting the rural economy in developing countries [40]. Over the years, the government has steadily funded the construction of Information and Communication Technologies (ICTs) infrastructures in the rural regions, which has provided a solid ground for e-commerce development. Consequently, the netizen population is booming, and the trade values of e-commerce in agri-sectors have multiplied in the past decade [50].
Major ICT companies in China, such as Alibaba, Tencent, and Jingdong, have provided abundant business opportunities and employment for rural residents. Through e-commerce, millions of farmers do business online regardless of their remote residency [39,51], which has innovated the agricultural supply chain [34,52] and improved rural societies in various facets [38,53,54]. Naturally, it has attracted increasing scholarly attention worldwide, as China is not alone when it comes to rural e-commerce development. Around the world, an inspiring phenomenon has occurred in developing countries such as India, Vietnam, and Kenya, where rural e-commerce is used to promote local rural societies and agriculture [55,56,57,58]. The experience China has to offer is needed more than ever, as it is potentially beneficial to other developing countries.
Taobao village is a typical phenomenon fostered by China’s rapid rural e-commerce growth [43,51,54]. It is an administrative village with a total annual e-commerce trade value exceeding USD 1.56 million (CNY 10.00 million). To be considered as a Taobao village, a village also needs to fulfil one of the two following requirements: (1) the village has at least 100 operational e-commerce adopters; or (2) 10% of the total households in a village are e-commerce adopters [59]. Regarding the above qualitative and quantitative requirements, it is clear that Taobao Village, which reaches some scale in the number of online sales and stores, is an aggregation of e-commercial sellers in rural areas. The number of Taobao villages has drastically increased from only 3 in 2009 to over 5425 in 2020, multiplied over a thousand-fold in a single decade. Together, these Taobao villages have achieved a combined annual online retail sales of over USD 157.12 billion (CNY one trillion), creating over 28 million jobs [59].

2.2. E-commerce and Technical Efficiency

The rapid emergence of rural e-commerce not only changed the way rural residents conduct business but is also likely to have impacts on smallholder farmers’ production decisions and efficiency. The adoption of e-commerce by rural farmers may improve the technical efficiency of crop production for several possible reasons. First, e-commerce may improve farmers’ productivity, as conducting business online incentivize farmers to learn and utilize ICTs. This process enables them to better infuse new and better technologies and is widely observed to be positively associated with productivity and efficiency growth [12,31,60]. Second, e-commerce may lower the costs of farmers in acquiring different inputs (e.g., fertilizers, and pesticides). Adopting e-commerce enables farmers to access online input markets (where prices are usually lower than those of traditional markets because of the lower costs associated with online transactions), with a corresponding direct impact on farm revenue and overall performance [61,62,63,64]. Third, e-commerce may facilitate the efficient use of labour. While e-commerce significantly reduces transaction costs, less labour is needed to conduct the transaction as sellers (farmers) and buyers (customers) are matched online. It helps reallocate labour within a rural household in a more efficient way [54,65,66]. Fourth, e-commerce may help farmers to better adjust their production strategy. As e-commerce can directly match buyers and sellers online, it enables farmers to quickly and timely capture the changes of markets and adjust their production strategy to suit the demand [37,38]. It is also widely observed that e-commerce adopters have a higher income than their non-adopter counterparts [33,35,64]. A higher income may alleviate the credit constraint, which is also a key barrier to efficiency improvement [67,68].
For these reasons, e-commerce adoption may ultimately affect farmers’ production behaviours on how to invest and utilize different inputs as well as their productivity, and thus the potential of enhancing the technical efficiency of crop production.

3. Materials and Methods

3.1. Data Collection

Based on the distribution of Taobao villages, we collected the data using a multistage sampling procedure. Between April and July 2018, we conducted a comprehensive survey of rural households in China. In the first stage, we selected three provinces that are famous for their rural e-commerce development, namely Jiangsu, Shandong, and Zhejiang. These three provinces have the most Taobao Villages in China. For example, Zhejiang province has 1573 Taobao villages in 2019, whereas Jiangsu has 615 and Shandong 450. When combined, these three provinces account for over 61.21% of Taobao villages nationwide [59]. In the second stage, we chose one county within each selected province, which included Cao county in Shandong, Shuyang county in Jiangsu, and Lin’an county in Zhejiang. These counties were among the very first adopters of rural e-commerce in China, and are widely perceived as the most representative with regard to rural e-commerce. In the third stage, we randomly selected 8 Taobao villages and 8 non-Taobao villages from each selected county. In each Taobao village, we randomly interviewed 10 households that operate e-commerce businesses and 10 households that do not as a control group. In each non-Taobao village, we randomly interviewed about 20 households, regardless of whether they operated an e-commerce business. Given that our aim was to study the effect of rural e-commerce on the technical efficiency of wheat production, we naturally limited our sample to wheat producers. As a result, we obtained a sample size of 371 wheat producers, among which 105 were e-commerce adopters and 266 non-adopters.
We followed the relevant literature to carefully select the variables used in the study [35,36,69]. Specifically, e-commerce adoption was defined as a dummy variable that equals 1 if a rural household participated in e-commerce business in 2017, and 0 otherwise [33,35]. The questionnaire was adjusted and modified multiple times during several pre-tests to better suit the academic needs and reflect reality. The final version of the questionnaire included various household characteristics (e.g., cultivated land size, household size), household head characteristics (e.g., age, gender, education level), agricultural production variables (e.g., seedling, fertilizers, pesticides, and labour), and other related variables (e.g., household’s access to the Internet).
We trained our numerators carefully to better carry out the structured surveys. The necessary ethical procedures were strictly followed during the entire survey to ensure our respondents’ confidentiality and data privity. All surveys were conducted on a face-to-face basis with either the household head or, on the rare occasions when he/she was absent, another household member who had a good knowledge of the production and market decisions of the household. Cross-sectional data of the year 2017 were employed in our study, as it was the year before the interview and farmers recalled the situation quite well.

3.2. Empirical Specification

There are two common practices when estimating the technical efficiency of crop production: non-parametric methodologies such as data envelope analysis (DEA) [70] and parametric methodologies such as the stochastic production frontier (SPF) [12,21,31]. In this study, we employ the SPF model for the following reasons: first, we are interested in capturing the production effect of various inputs on wheat output. This requires the model to be parametric, which is in stark contrast to the non-parametric DEA. Second, random errors are crucial in our calculation, as the efficiency of wheat production is sensible to not only inefficiency terms but also random errors (e.g., unpredictable conditions like weather). This can be addressed by the SPF that assumes a random error, while DEA does not. Therefore, our study is based on the SPF method.
The objective of this study is to investigate the impact of e-commerce adoption on technical efficiency, evidenced by smallholder wheat farmers in China. As analysed above, farmers self-identify as either e-commerce adopters or non-adopters, which has caused a potential selectivity bias. Learning from the previous literature, we took into account such bias and employed the selectivity-corrected stochastic production frontier (SPF) model, combined with propensity score matching (PSM), to address the issue [18,19,20,46].

3.2.1. Stochastic Production Frontier Model (SPF)

As the farmers in our sample are exclusively either e-commerce adopters or non-adopters, following the initial SPF proposed by Aigner, Lovell, and Schmidt [71], the SPF model is specified as follows:
Y i = f Z i , E i + e i ,   w i t h   e i = v i μ i
where Y i is the wheat output of the farmer i ; Z i is a vector of variables representing different inputs (e.g., fertilizers, pesticides); E i is the binary variable that depicts the e-commerce adoption status of farmers (1 = e-commerce adopters; 0 = non-adopters); e i is an error term, which is composed of v i ~ N 0 , σ v 2 , an asymmetric stochastic term capturing statistical noise, and μ i ~ N + 0 , σ v 2 , a half-normal stochastic term that accounts for inefficiency in wheat production.
We then proceeded to estimate the production function based on the likelihood ratio test. The Cobb–Douglas function is used, as it is in line with the test and fits the nature of wheat production. Following Anang [72], we estimated the production frontier as follows:
l n Y i = β 0 + j = 1 6 β j l n Z + φ i M i + w i
where ln represents a natural logarithm; Y i represents the wheat output of the i-th farmer; Z i denotes a vector of production input variables. In particular, the output variable is defined as the gross revenue from production per mu (1 mu = 1/15 ha). Inputs are aggregated into five major categories including expenditure on seedlings, fertilizers, pesticides, family labours, and hired labours; β j and φ i are parameters to be estimated; and w i is an uncorrelated random error that has a normal distribution.
We then calculate the technical efficiency score of wheat [19,72].
T E i E = Y i Y i = Y i e f z i , β + v i
where T E i E represents the TE score of farmer i growing wheat, Y i is the actual wheat output, Y i is the maximum output possible when all inputs Z i were used in the most efficient ways. As indicated in Equation (3), the efficiency of the i-th farmer is 1 when the error term is 0. That is, if e-commerce adopters can obtain a higher wheat output ( Y i ) given existing inputs ( Z i ), they may have a higher technical efficiency score than non-adopters.

3.2.2. Addressing Selection Bias

Based on the utility maximization framework, we depicted farmers’ choices to adopt e-commerce or not in a binary sample selection model as follows:
E i * = α X i + ε i ,   w h e r e   E i = 1 ,   i f   U i e U i e > 0 0 ,   o t h e r w i s e
where E i represents a binary variable that equals 1 for e-commerce adopters and 0 for non-adopters; X i refers to the set of explanatory variables which affect farmers’ decision to adopt e-commerce (e.g., internet accessibility, various household characteristics); α is the set of estimated parameters; ε i is the error term; U i e represents the expected utility farmer i adopting e-commerce, whereas U i e   i s the expected utility farmer i not adopting e-commerce. It is obvious that a farmer i only adopts e-commerce when the expected utility gain U i e U i e is positive.
As farmers identify themselves as being either e-commerce adopters or non-adopters, some of the factors determining adoption in e-commerce are likely to influence efficiency as well. Such is the presence of selection bias, which is caused by both observed (e.g., age, education of household head) and unobserved factors (e.g., farmer’s openness to new technologies) simultaneously.
Learning from similar literature [18,19,73], we introduced propensity score matching (PSM) to control bias stemming from observed factors. PSM enabled us to match farmers who adopted e-commerce and those who did not on observed characteristics. In the PSM estimation framework, Equation (4) can be estimated using a binary choice model (a Logit model in this study) to generate a propensity score for each farmer in the sample. Depending on the propensity scores, the PSM approach matches e-commerce adopters and non-adopters who are similar in observed characteristics X i to address the potential selectivity effects arising from observable factors. In the selection of matching techniques, we learned from the past literature and employed the nearest-neighbour matching technique, as it is a commonly used method to efficiently reduce bias from observed factors [74,75,76]. We matched every adopter with four neighbours with a calliper of 0.01. We also allowed for a replacement so as to reduce the omission of sample sizes. The technique generated 344 matched samples in total, with 90 e-commerce adopters and 254 non-adopters. Overall, each adopter had two to three non-adopters in comparison.
To control bias stemming from unobserved factors, we learned from Greene and implemented a selectivity-corrected SPF model [46]. This model assumes that the unobserved factors in the selection equation are correlated with the error term in the stochastic frontier model. It is, therefore, a significant improvement over Heckman’s self-selection specification for the linear regression model [77]. Specifically, this model has the following error structure:
μ i =   σ μ U i   = σ μ U i ,   w h e r e   U i ~ N 0 , 1 v i =   σ v V i   = σ v V i ,   w h e r e   V i ~ N 0 , 1 μ i , v i ~ N 2 0 , 1 , 1 , ρ μ , v σ v , σ v 2
As shown in Equation (5), the error term in Equation (1) is correlated with that in Equation (4), which lays out the basic assumption of the selectivity-corrected SPF model. It is to be noted that the correlation coefficient between the two error terms of Equation (1) and Equation (4), namely ρ μ , v , represent the possible selection bias from unobserved factors [19,46]. That is, an insignificant ρ μ , v would suggest that there exists no selection bias stemming from unobserved factors. We then proceeded to estimate the parameters of the selectivity-corrected SPF model following Greene by using a conventional gradient-based Broyden–Fletcher–Goldfarb-Shanno (BFGs) method and used the BHHH estimator to obtain the asymptotic standard errors [46].

3.2.3. Different Production Frontiers for E-commerce Adopters and Non-Adopters

The calculation of Equation (3) relies on the underlying assumption that all farmers have access to the same technology and share the same production frontier. However, with access to the internet and various online services, including training programmes for new technologies, e-commerce adopters may grow wheat with a different production frontier than that of non-adopters. In light of this, we need to identify whether the SPF estimation should be run for the whole sample or if separate frontiers are necessary for e-commerce adopters and non-adopters [19]. This can be achieved by a likelihood ratio test between the two groups of farmers [75]. Specifically, the estimated likelihood ratio (LR) can be estimated as follows:
L R = 2 l n L p l n L m + l n L n m
where l n L p , l n L m , and l n L n m represent the log-likelihood function values obtained from the SPF model for the pooled sample, two separate SPFs models for e-commerce adopters and non-adopters, respectively. The null hypothesis is that the two groups have the same technology in wheat production. If such hypothesis is rejected, we need to respectively estimate the parameters for two groups of wheat farmers as they have different production frontiers [46], expressed as follows:
E-commerce adopters:
l n Y i   = η 0 + j = 1 6 η j l n X + 1 ϕ φ i ρ i + τ i
Non-adopters:
l n Y i   = ξ 0 + j = 1 6 ξ j l n X + 1 ϕ ς i ρ i + ω i
where Y i and X i are defined as previously; ρ i refers to the selectivity-correction term, which is calculated based on the propensity scores matching as mentioned above; η 0 and ξ 0 are constant terms; φ i , ς i , η j , and ξ j are parameters to be estimated; τ i and ω i are random errors.
We can, therefore, calculate the technical efficiency scores following these steps. First, we estimated a pooled SPF estimation that includes a dummy variable representing e-commerce adoption. Second, we estimated two separate SPF models, one for e-commerce adopters and another for non-adopters. Third, we performed a likelihood ratio test to examine if there were technical differences. Forth, where such differences were present, we respectively estimated the two production frontiers for both adopters and non-adopters. And fifth, we calculated the technical efficiency scores for both adopters and non-adopters, using matched and unmatched samples, respectively, and drew conclusions therefrom.

4. Results

4.1. Descriptive Results

We present descriptive statistics for the variables in Table 1. Following the previous literature exploring the causes and impacts of e-commerce, we modelled the sample selection equation (i.e., determinants of rural e-commerce adoption) as a function of both household heads’ characteristics (e.g., age, gender, education level, health status) and household characteristics (e.g., household size, cultivated land size, the availability of high-speed internet and mobile phones) [33,35,36]. For the stochastic production frontier function, we modelled the wheat output per unit of land as a function of the four main categories of inputs (e.g., labour, seedlings, fertilizers, and pesticides) [60,78]. Land was not necessary because the dependent variable was wheat production per unit of land (i.e., yield) instead of the total wheat production of the household. A detailed description of the selected variables is presented in Table 1.
We present the mean differences of inputs and output variables used to estimate the production frontier models in Table 2. We express both the inputs and output variables in natural logarithms, as this is the functional form in the estimation of the Cobb–Douglas stochastic production frontier model [19,79]. To correct issues of zero values for certain input variables (e.g., some farmers do not hire labour in their smallholder production), we followed the literature and employed a dummy variable technique [80]. As shown below, the wheat yield of e-commerce adopters was generally higher than that of non-adopters. Several input variables, including seedlings, fertilizers, and pesticides, also exhibited differences between these two groups. While the information on the level of output and input reported in the descriptive table is informative, the higher yield of adopters compared to non-adopters does not necessarily mean that the productivity or technical efficiency is higher for adopters than non-adopters because yield is affected by input use. We will need to rely on the econometrics analysis to separate the effects of e-commerce on technical efficiency from other confounding effects, including the input effects and selection effects caused by unobservables, which is the focus of the next section.

4.2. Empirical Results
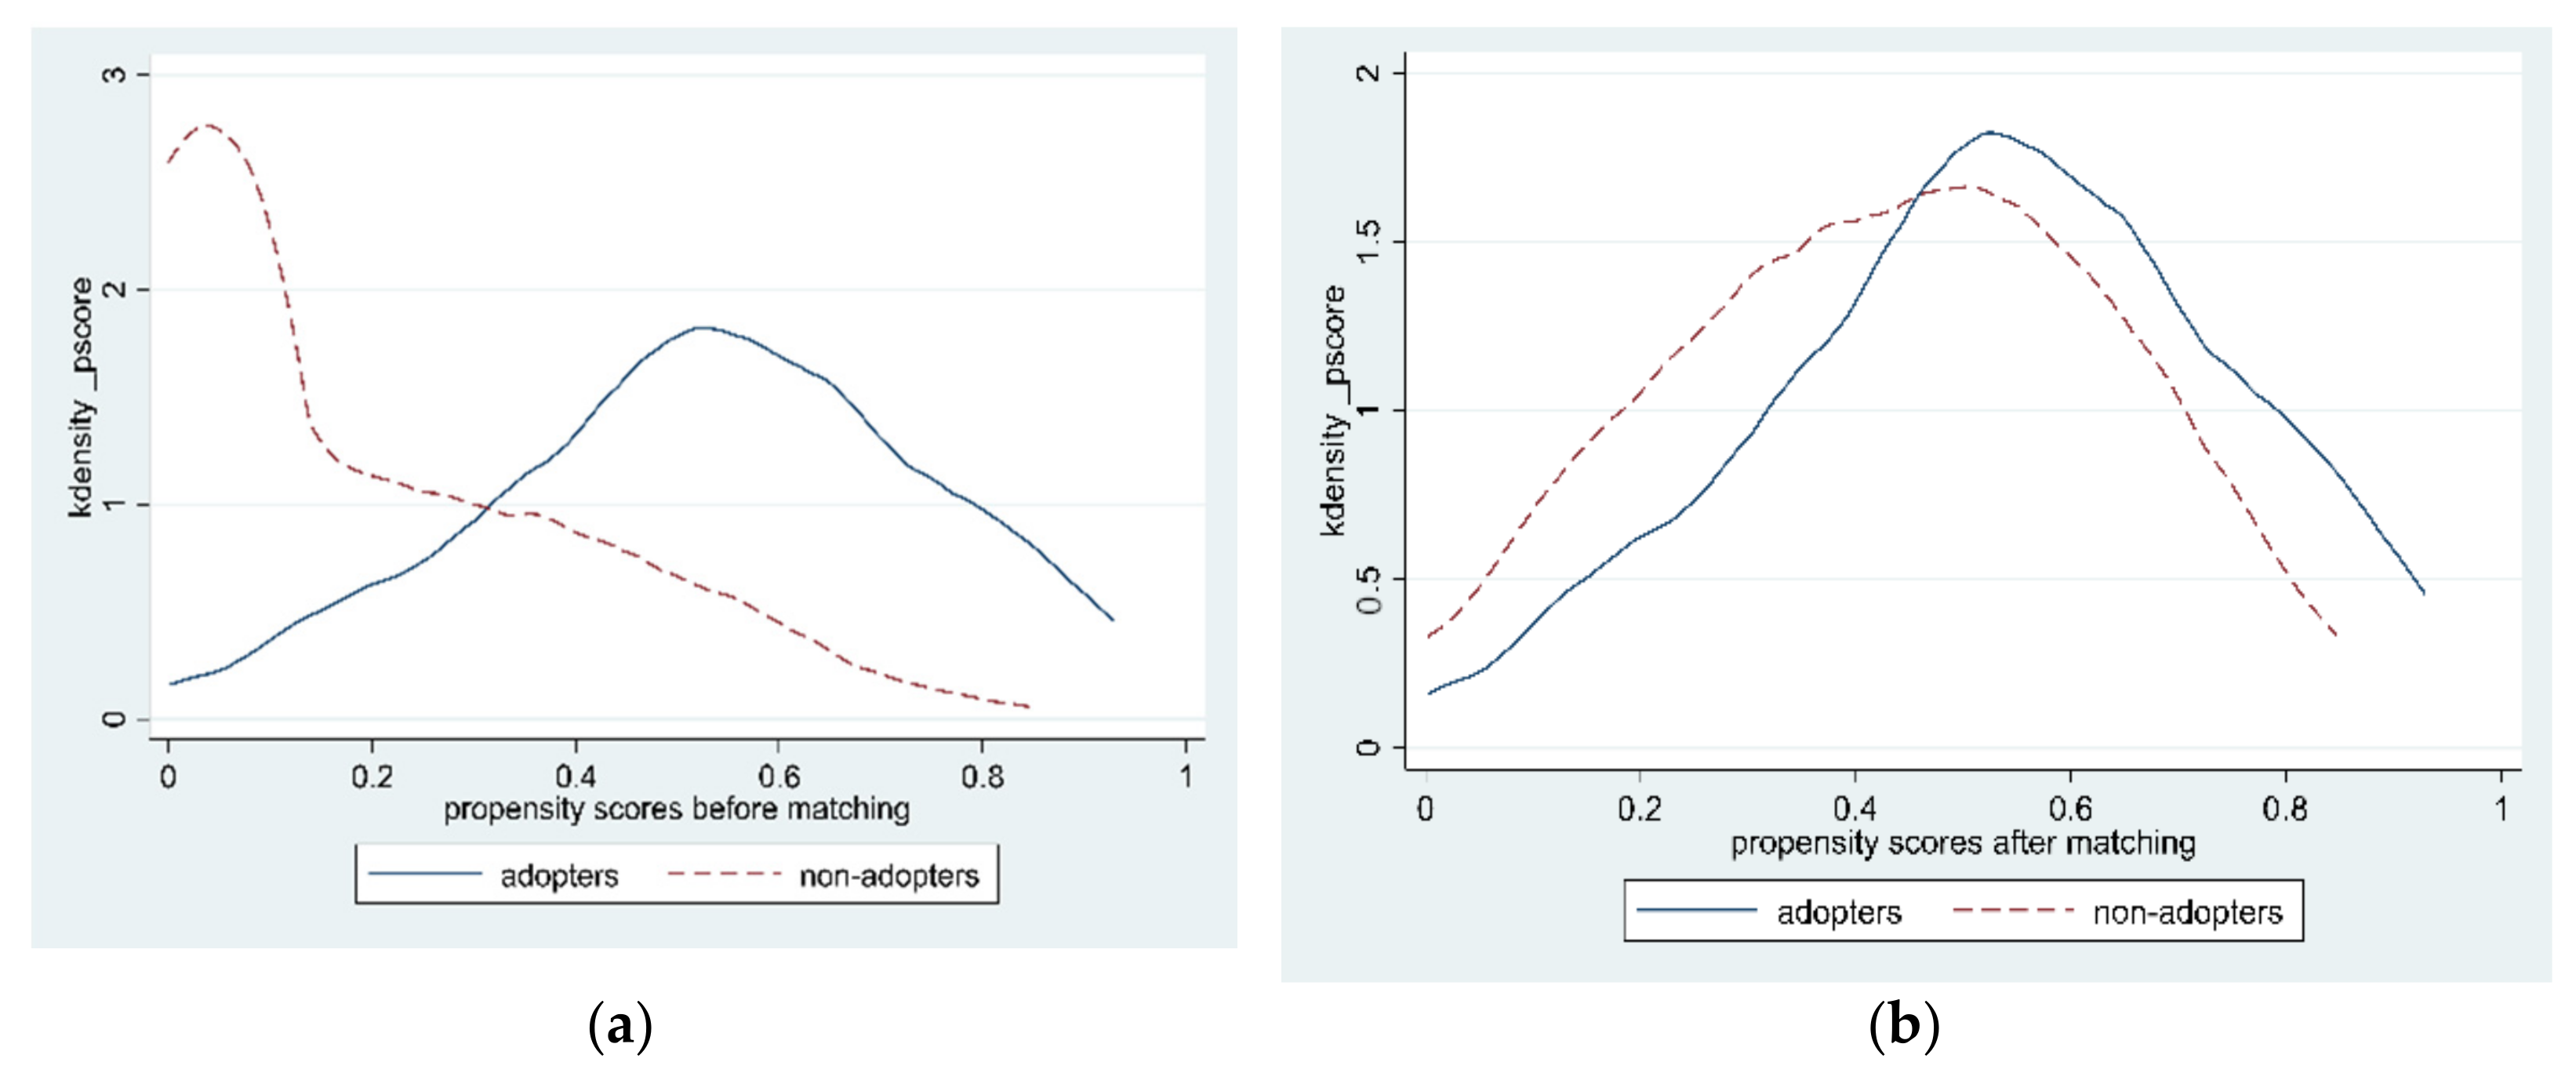
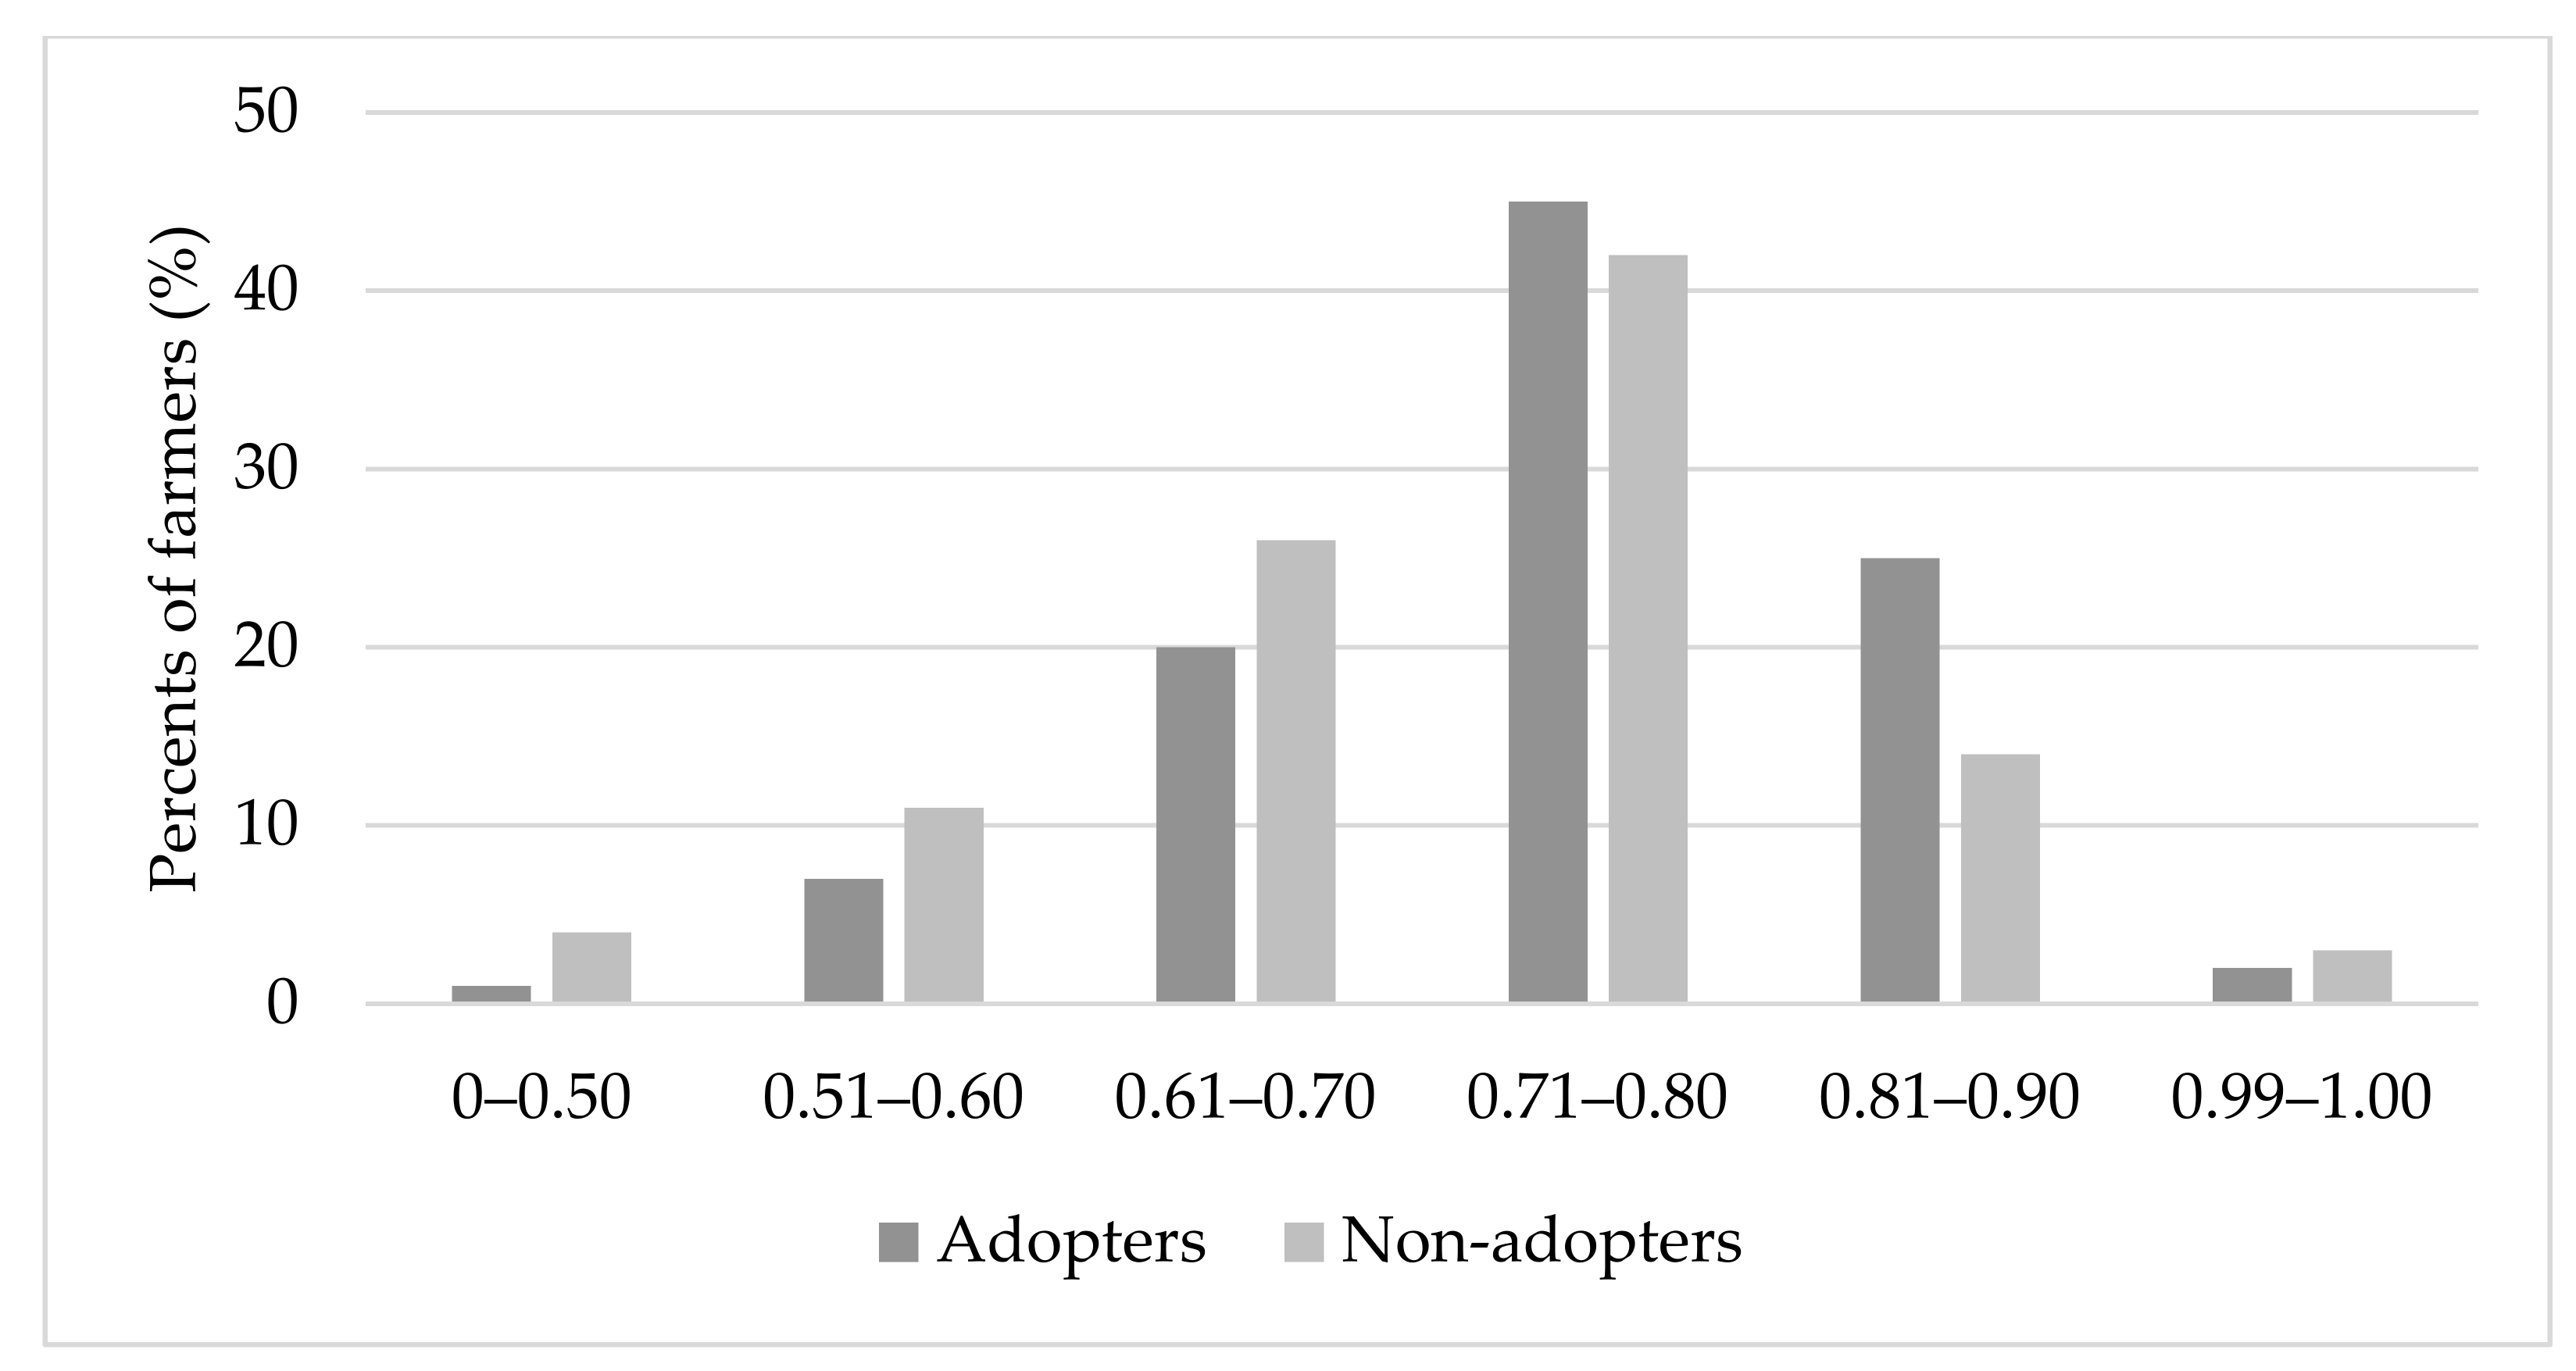
4.2.1. Matching

As discussed above, we used propensity score matching to control selection bias stemming from observed factors [74,75,76]. A four-nearest-neighbour replaceable matching with a calliper of 0.01 is employed in our study. In doing so, we first estimate a logit model to identify factors affecting farmers’ e-commerce adoption, and the results are reported in Table 3.
There are several interesting findings regarding what drives farmers’ willingness to e-commerce adoption (Table 3). For example, age, gender, and education level of the household head are important factors, as these are found to be significantly correlated with the farmer’s decision to adopt e-commerce. Generally, a younger, male household head with a longer education is more likely to participate in e-commerce. Moreover, the local ICT infrastructure is very important, as households’ access to the high-speed internet and mobile phones are also crucial factors. When combined, these results yield, as they reveal what factors affect the adoption of e-commerce, and this not only resonates with the existing literature [33,35] but also yields important insights for both scholars and policymakers.
A key assumption underlying the validity of PSM is the balance of matching variables between the treated and the control group after the matching [81,82]. We therefore employed a balancing test to check how the matching process fulfilled the balancing objective. The results of the balancing test are given in Table 4 and Figure 1.
As seen in Table 4, the matching has significantly improved the balance of variables between e-commerce adopters and non-adopters. The differences between major variables are mostly reduced to 10 per cent, indicating a fitting matching that accomplishes the balancing condition of the covariates [83]. Furthermore, while the mean difference between the treatment and control groups is statistically significant at 1% for seven variables before matching, all the variables are insignificant except for the head’s health, which is significant at 10% after matching, suggesting that the quality of matching is high. Figure 1 presents in a more direct way the density of the common support region between adopters and non-adopters before and after matching. Panel (a) shows a large common support of propensity scores between the adopters and non-adopters. Except at the end of the right tail (score > 0.9), there are overlapping scores between adopters and non-adopters. The large common support region is another criterion for matching quality. Panel (b) shows the propensity scores for the treatment and control groups based on the matched sample. It is not surprising that the common support covers the entire region of the propensity scores and that the score distributions are almost the same between the adopters and non-adopters. With a satisfactory matching quality, we estimate Greene’s selectivity-correction term using the calculated propensity scores and apply it in the stochastic frontier model [46].

4.2.2. Production Frontier Estimates

We employed the Cobb–Douglas stochastic frontiers using the inputs and output variables that are measured by the natural logarithm [46,72]. In doing so, we first performed a likelihood ratio test to examine if the technology differences between e-commerce adopters and non-adopters were significant [19]. This test was estimated based on Equation (6), which resulted in a likelihood ratio test statistic of 65.32 (p = 0.000). Therefore, we proceeded to separately estimate the frontiers for each group, as this would provide us with more accurate results. Based on Equations (7) and (8), we conducted the maximum likelihood estimates of the conventional and selectivity-corrected SPF using the matched samples and present the results in Table 5. We also present the results based on the unmatched samples in Table A1 for comparison.
The fact that the selectivity correction term ( ρ ) in both selectivity-corrected SPF models is significant indicates the presence of selection bias in the adoption of e-commerce. The conventional SPF model is, therefore, biased in the estimation. The selectivity-corrected SPF model with PSM in this study is justified [18,19,20,46]. However, for comparison reasons, we report the results from both the conventional and selectivity-corrected SPF models.
As seen in Table 5, the coefficient for the e-commerce adoption is positive and statistically significant in both the conventional and the selectivity-corrected SPF models based on all pooled samples. Our findings that the adoption of e-commerce has a positive and significant effect on wheat yield are in line with existing studies about the impact of ICTs on agricultural production and technical efficiency [12,31,60]. Regarding the traditional production inputs, we find that seedlings, fertilizers, and pesticides all contribute positively to wheat yield, as the coefficients of these three variables are positive and significant (albeit less consistent for pesticide) across both SPF models in all groups of samples. These three factors have the potential of contributing to higher agricultural production, since the adoption of e-commerce reduces the input costs for seedlings and fertilizers as indicated in Table 2. It is interesting to note that the labour inputs are not statistically significant in all the regressions, a result that is in line with other studies based on household survey data [27]. It suggests that labour is not a constraint for wheat farmers, which may be explained by the fact that rural labour in developing countries is usually surplus, whereas its marginal effect is low.

4.2.3. Technical Efficiency Scores

Based on the SPF models estimated above, we calculated the TE scores of wheat farmers from both the conventional and selectivity-corrected SPF models using matched samples, and present the results in Table 6. For a more comprehensive analysis, we also present the results using unmatched samples in Table A2.
When estimating using pooled samples, there are no significant differences between the TE scores of adopters and non-adopters. However, a previous analysis has demonstrated the existence of different technology and production frontiers for adopters and non-adopters, which suggests that we should estimate the SFP using separated samples. In doing so, we show that the TE scores of e-commerce adopters range from 0.79 to 0.82, and from 0.75 to 0.80 for non-adopters. Significant differences are observed regardless of the SPF specification and sample selection. To further address the selection bias, the estimates of the selectivity-corrected SPF models using matched samples were presented. This showed that the TE score of e-commerce adopters was about 0.82, and 0.80 for non-adopters. On average, e-commerce adopters and non-adopters could increase production by 18 per cent and 20 per cent using their current input quantities. The adoption of e-commerce increased the TE score by approximately 2.75 per cent.
Our results agree with previous studies on ICTs and TE improvement. For example, Zheng et al. discovered that internet adoption improves TE for banana farmers by 3.4 per cent [12], while Kelemu demonstrated that mobile phones improve TE for wheat farmers by 7 per cent [60]. In association with these studies, our findings reaffirm that the adoption of ICTs may improve TE for smallholder farmers. It is easily noted that in all separate models, e-commerce adopters have a higher level of TE score compared with that of non-adopters, and there exists a significant efficiency gap. The findings further confirm that e-commerce adopters and non-adopters perform differently in terms of technology adoption.
We also present the distribution of technical efficiency scores estimated by a selectivity-corrected SPF model for matched samples in Figure 2. A similar graph for unmatched samples is presented in Figure A1. Jointly, these two figures suggest a significant difference between the TE scores of e-commerce adopters and non-adopters. For example, about 70 per cent of adopters have a TE score between 0.71 and 0.90 when estimated using unmatched samples. This ratio increases to about 80 per cent when using matched samples, and similar increments occur with non-adopters. Altogether, they indicate that the technical efficiency level of adopters was higher than that of their counterparts in the median-high level, where their percentage of farmers was also larger. Hence, we provide a piece of evidence that the adoption of e-commerce does improve technical efficiency.

5. Conclusions

Improving the technical efficiency of smallholder farmers is crucial for food security and rural development all across the world. While there are certain constraints to achieving this goal, recent years of ICT development and e-commerce adoption are generating new potentials. Although the world has witnessed the rapid development of rural e-commerce, little attention has been paid to understanding how e-commerce affects the technical efficiency of crop production for smallholder farmers. To bridge the research gap, this paper uses data collected from wheat farmers in China to estimate the impact of e-commerce adoption on crop technical efficiency. A matched group of e-commerce adopters and non-adopters is determined using a propensity score matching technique to address biases stemming from observed variables, whereas the selectivity-corrected stochastic frontier model is used to control bias stemming from unobservable factors.
The results reaffirm the presence of selection bias and justify the technique employed in this paper. An estimation from separate stochastic production frontiers reveals that technical efficiency is consistently higher for e-commerce adopters than that of their counterparts. Specifically, technical efficiency ranges from 0.79 to 0.82 for e-commerce adopters and from 0.75 to 0.80 for non-adopters depending on how biases were controlled. The differences between the two groups are coherently significant. After controlling for the selection bias stemming from both observable and unobservable factors, the average technical efficiencies for e-commerce adopters and non-adopters are found to be 0.82 and 0.80, respectively. The adoption of e-commerce improves 2.75 per cent of technical efficiency in wheat production.
There are several policy implications deriving from our results. Firstly, the finding of a positive relationship between e-commerce adoption and the technical efficiency of smallholder wheat farmers suggests that policymakers and administrative entities should put forth policy incentives to encourage smallholder farmers to adopt e-commerce for an increment in agricultural productivity. For example, government and extension services could provide farmers with training programmes to enhance farmers’ understanding of the necessity and mechanism of e-commerce. Secondly, the finding that the farmers with higher education levels are more likely to adopt e-commerce indicates the importance of promoting education in rural societies, and hence the call for policy incentives for smallholder farmers to take longer, more intensive education. Thirdly, the finding that gender is crucial in the adoption of e-commerce, with a disproportionate favour for the male household head, has shown the importance to promote gender equality in rural development, as females should not be neglected in the process of technological inclusion and the benefits therein. Policymakers should use incentives to encourage more women to actively participate in the adoption of e-commerce as well as other ICTs. Finally, studies have shown that the ICT-related infrastructure, like communication networks, logistic systems, and high-speed internet construction play an important role in e-commerce development [33,35,69]. Our finding that e-commerce adoption improves wheat farmers’ production efficiency offers additional support to government investment in rural infrastructure to encourage the development of e-commerce.
Nevertheless, there are certain limits in our study that require further scholarly attention. While our findings have provided some evidence that farmers’ adoption of e-commerce is beneficial to the improvement of technical efficiency and crop production, we did not specify different models of rural e-commerce, which may be an important factor driving farmers’ willingness to adopt e-commerce. Moreover, the data we employ are cross-sectional due to various limitations in data collection, mainly because the development of Chinese rural e-commerce was so fast in the past years and no existing large dataset had considered relevant variables beforehand. The unavailability of panel data is the main drive for the implementation of different methodologies. With the increasing scholarly attention on rural e-commerce, the availability of panel data is expected in the near future, and a more robust analysis will be in order.

Author Contributions

All authors have contributed substantially to the entire work reported. Conceptualization, H.G. and D.C.; methodology, software, data curation, and formal analysis, S.J. and D.C.; writing—original draft preparation, D.C.; writing—review, and editing, Q.Z.; supervision, project administration, and funding acquisition, H.G. All authors have read and agreed to the published version of the manuscript.

Funding

This research was funded by The National Social Science Fund of China (Grant No. 21&ZD091), and by Doctoral Dissertation Scholarship for Poverty Alleviation Studies of China Anti-Poverty Research Institute, Renmin University of China.

Institutional Review Board Statement

Not applicable.

Informed Consent Statement

Informed consent was obtained from all subjects involved in the study.

Data Availability Statement

The data presented in this study are available on request from the corresponding author. The data are not publicly available due to interviewees’ privacy protection.

Acknowledgments

The authors would like to acknowledge the helpful comments received from the editor and anonymous reviewers. We are also grateful for the support of the local government of the surveyed counties in the process of field investigation and data curation.

Conflicts of Interest

The authors declare no conflict of interest. The funders had no role in the design of the study; in the collection, analyses, or interpretation of data; in the writing of the manuscript, or in the decision to publish the results.

Appendix A

Table A1. Parameter estimates for both the conventional and selectivity-corrected SPF models for unmatched samples.
VariablesConventional SPFSelectivity-Corrected SPF
PooledAdoptersNon-AdoptersPooledAdoptersNon-Adopters
E-commerce0.619 ***
(0.165)
0.821 ***
(0.154)
Seedlings (ln)0.067 *
(0.216)
0.045 **
(0.278)
0.082 *
(0.315)
0.057 **
(0.186)
0.047 **
(0.168)
0.068 **
(0.352)
Fertilizers (ln)0.058 *
(0.188)
0.049 **
(0.330)
0.065 *
(0.212)
0.049 **
(0.254)
0.038 *
(0.425)
0.057
(0.214)
Pesticides (ln)0.134 *
(0.091)
0.106 *
(0.122)
0.145
(0.275)
0.188 *
(0.107)
0.112
(0.180)
0.214 *
(0.142)
Hired Labour (ln)0.017
(0.064)
0.016
(0.029)
0.022 *
(0.033)
0.024
(0.086)
0.018
(0.008)
0.037
(0.023)
Family Labour (ln)0.058
(0.066)
0.088
(0.109)
0.048 *
(0.124)
0.078
(0.082)
0.056
(0.126)
0.104
(0.036)
Constant6.359 ***
(0.136)
6.983 ***
(0.207)
7.036 ***
(0.330)
6.832 ***
(0.210)
7.017 ***
(0.259)
7.264 ***
(0.325)
Log Likelihood232.406136.322125.625227.323124.438109.436
σ v 0.241 ***0.277 ***0.203 *0.234 ***0.265 ***0.267 **
σ μ 0.336 ***0.378 ***0.302 *0.302 ***0.307 **0.312 *
λ 8.109 ***9.159 ***7.287 *8.242 ***8.738 ***7.963 *
Selectivity correction term ( ρ ) −0.296 ***
(0.068)
−0.207 ***
(0.053)
−0.036 *
(0.071)
Sample size371105266371105266
Standard errors are presented in parentheses. *** p < 0.01; ** p < 0.05; * p < 0.1.
Table A2. Technical efficiency levels for unmatched samples.
PooledAdoptersNon-AdoptersDiff.
Unmatched samples
Conventional SPF (Pooled)0.80 (0.07)0.80 (0.00)0.79 (0.01)0.008
Conventional SPF (Separated) 0.78 (0.00)0.75 (0.00)0.038 ***
Selectivity-corrected SPF (Separated) 0.79 (0.00)0.76 (0.01)0.027 ***
Standard errors are presented in parentheses. *** p < 0.01.
Figure A1. Efficiency levels estimated by selectivity-corrected SPF for the unmatched samples.
Sustainability 14 01197 g0a1

References

  1. Zhang, Q.; Chu, Y.; Xue, Y.; Ying, H.; Chen, X.; Zhao, Y.; Ma, W.; Ma, L.; Zhang, J.; Yin, Y.; et al. Outlook of China’s Agriculture Transforming from Smallholder Operation to Sustainable Production. Glob. Food Secur. 2020, 26, 100444. [Google Scholar] [CrossRef]
  2. Aung, P.-P.-P.; Lee, J.-Y. Technical Efficiency of Mung Bean Producers: The Case of Myanmar. Agriculture 2021, 11, 1249. [Google Scholar] [CrossRef]
  3. Obianefo, C.A.; Ng’ombe, J.N.; Mzyece, A.; Masasi, B.; Obiekwe, N.J.; Anumudu, O.O. Technical Efficiency and Technological Gaps of Rice Production in Anambra State, Nigeria. Agriculture 2021, 11, 1240. [Google Scholar] [CrossRef]
  4. Wen, Y.; Kong, L.; Liu, G. Big Data Analysis of E-Commerce Efficiency and Its Influencing Factors of Agricultural Products in China. Mob. Inf. Syst. 2021, 2021, 5708829. [Google Scholar] [CrossRef]
  5. Dagar, V.; Khan, M.K.; Alvarado, R.; Usman, M.; Zakari, A.; Rehman, A.; Murshed, M.; Tillaguango, B. Variations in Technical Efficiency of Farmers with Distinct Land Size across Agro-Climatic Zones: Evidence from India. J. Clean. Prod. 2021, 315, 128109. [Google Scholar] [CrossRef]
  6. Adamopoulos, T.; Restuccia, D. Land Reform and Productivity: A Quantitative Analysis with Micro Data. Am. Econ. J. Macroecon. 2020, 12, 1–39. [Google Scholar] [CrossRef]
  7. Jin, S.; Huang, J.; Hu, R.; Rozelle, S. The Creation and Spread of Technology and Total Factor Productivity in China’s Agriculture. Am. J. Agric. Econ. 2002, 84, 916–930. [Google Scholar] [CrossRef]
  8. Katengeza, S.P.; Holden, S.T.; Lunduka, R.W. Adoption of Drought Tolerant Maize Varieties under Rainfall Stress in Malawi. J. Agric. Econ. 2019, 70, 198–214. [Google Scholar] [CrossRef]
  9. Mayen, C.D.; Balagtas, J.V.; Alexander, C.E. Technology Adoption and Technical Efficiency: Organic and Conventional Dairy Farms in the United States. Am. J. Agric. Econ. 2010, 92, 181–195. [Google Scholar] [CrossRef] [Green Version]
  10. Shiferaw, B.; Kebede, T.; Kassie, M.; Fisher, M. Market Imperfections, Access to Information and Technology Adoption in Uganda: Challenges of Overcoming Multiple Constraints. Agric. Econ. UK 2015, 46, 475–488. [Google Scholar] [CrossRef]
  11. Takahashi, K.; Muraoka, R.; Otsuka, K. Technology Adoption, Impact, and Extension in Developing Countries’ Agriculture: A Review of the Recent Literature. Agric. Econ. UK 2020, 51, 31–45. [Google Scholar] [CrossRef]
  12. Zheng, H.; Ma, W.; Wang, F.; Li, G. Does Internet Use Improve Technical Efficiency of Banana Production in China? Evidence from a Selectivity-Corrected Analysis. Food Policy 2021, 102, 102044. [Google Scholar] [CrossRef]
  13. Clark, B.; Jones, G.; Kendall, H.; Taylor, J.; Cao, Y.; Li, W.; Zhao, C.; Chen, J.; Yang, G.; Chen, L. A Proposed Framework for Accelerating Technology Trajectories in Agriculture: A Case Study in China. Front. Agric. Sci. Eng. 2018. [Google Scholar] [CrossRef]
  14. Lau, L.J.; Yotopoulos, P.A. A Test for Relative Efficiency and Application to Indian Agriculture. Am. Econ. Rev. 1971, 61, 94–109. [Google Scholar]
  15. Battese, G.E.; Coelli, T.J. A Model for Technical Inefficiency Effects in a Stochastic Frontier Production Function for Panel Data. Empir. Econ. 1995, 20, 325–332. [Google Scholar] [CrossRef] [Green Version]
  16. Chagwiza, C.; Muradian, R.; Ruben, R. Cooperative Membership and Dairy Performance among Smallholders in Ethiopia. Food Policy 2016, 59, 165–173. [Google Scholar] [CrossRef]
  17. Genius, M.; Koundouri, P.; Nauges, C.; Tzouvelekas, V. Information Transmission in Irrigation Technology Adoption and Diffusion: Social Learning, Extension Services, and Spatial Effects. Am. J. Agric. Econ. 2014, 96, 328–344. [Google Scholar] [CrossRef] [Green Version]
  18. Villano, R.; Bravo-Ureta, B.; Solís, D.; Fleming, E. Modern Rice Technologies and Productivity in the Philippines: Disentangling Technology from Managerial Gaps. J. Agric. Econ. 2015, 66, 129–154. [Google Scholar] [CrossRef]
  19. Bravo-Ureta, B.E.; González-Flores, M.; Greene, W.; Solís, D. Technology and Technical Efficiency Change: Evidence from a Difference in Differences Selectivity Corrected Stochastic Production Frontier Model. Am. J. Agric. Econ. 2021, 103, 362–385. [Google Scholar] [CrossRef]
  20. Ma, W.; Renwick, A.; Yuan, P.; Ratna, N. Agricultural Cooperative Membership and Technical Efficiency of Apple Farmers in China: An Analysis Accounting for Selectivity Bias. Food Policy 2018, 81, 122–132. [Google Scholar] [CrossRef]
  21. Qu, R.; Wu, Y.; Chen, J.; Jones, G.D.; Li, W.; Jin, S.; Chang, Q.; Cao, Y.; Yang, G.; Li, Z.; et al. Effects of Agricultural Cooperative Society on Farmers’ Technical Efficiency: Evidence from Stochastic Frontier Analysis. Sustainability 2020, 12, 8194. [Google Scholar] [CrossRef]
  22. Jin, S.; Ma, H.; Huang, J.; Hu, R.; Rozelle, S. Productivity, Efficiency and Technical Change: Measuring the Performance of China’s Transforming Agriculture. J. Product. Anal. 2010, 33, 191–207. [Google Scholar] [CrossRef]
  23. Kompas, T.; Che, T.N.; Nguyen, H.T.M.; Nguyen, H.Q. Productivity, Net Returns, and Efficiency: Land and Market Reform in Vietnamese Rice Production. Land Econ. 2012, 88, 478–495. [Google Scholar] [CrossRef]
  24. Qing, Y.; Chen, M.; Sheng, Y.; Huang, J. Mechanization Services, Farm Productivity and Institutional Innovation in China. China Agric. Econ. Rev. 2019, 11, 536–554. [Google Scholar] [CrossRef]
  25. Ferreira, M.D.P.; Féres, J.G. Farm Size and Land Use Efficiency in the Brazilian Amazon. Land Use Policy 2020, 99, 104901. [Google Scholar] [CrossRef]
  26. Qiu, T.; He, Q.; Choy, S.T.B.; Li, Y.; Luo, B. The Impact of Land Renting-in on Farm Productivity: Evidence from Maize Production in China. China Agric. Econ. Rev. 2020, 13, 78–95. [Google Scholar] [CrossRef]
  27. Lin, B.; Wang, X.; Jin, S.; Yang, W.; Li, H. Impacts of Cooperative Membership on Rice Productivity: Evidence from China. World Dev. 2022, 150, 105669. [Google Scholar] [CrossRef]
  28. Ahmed, M.H.; Melesse, K.A. Impact of Off-Farm Activities on Technical Efficiency: Evidence from Maize Producers of Eastern Ethiopia. Agric. Food Econ. 2018, 6, 3. [Google Scholar] [CrossRef] [Green Version]
  29. Chang, H.; Wen, F. Off-farm Work, Technical Efficiency, and Rice Production Risk in Taiwan. Agric. Econ. 2011, 42, 269–278. [Google Scholar] [CrossRef]
  30. Yang, J.; Wang, H.; Jin, S.; Chen, K.; Riedinger, J.; Peng, C. Migration, Local off-Farm Employment, and Agricultural Production Efficiency: Evidence from China. J. Product. Anal. 2016, 45, 247–259. [Google Scholar] [CrossRef] [Green Version]
  31. Zhu, X.; Hu, R.; Zhang, C.; Shi, G. Does Internet Use Improve Technical Efficiency? Evidence from Apple Production in China. Technol. Forecast. Soc. Chang. 2021, 166, 120662. [Google Scholar] [CrossRef]
  32. Mwalupaso, G.E.; Tian, X.; Matafwali, E.; Mwamba, M.C.; Alavo, E.J.-P.; Ethetie, A.M.; Korotoumou, M.; Waseem, F. Understanding the Purpose and Potential Popularity of Mobile Phone Use in Zambia’s Maize Production. J. Agric. Sci. 2019, 11, 32–42. [Google Scholar] [CrossRef] [Green Version]
  33. Li, X.; Guo, H.; Jin, S.; Ma, W.; Zeng, Y. Do Farmers Gain Internet Dividends from E-Commerce Adoption? Evidence from China. Food Policy 2021, 101, 102024. [Google Scholar] [CrossRef]
  34. Yang, X.; Chen, X.; Jiang, Y.; Jia, F. Adoption of E-Commerce by the Agri-Food Sector in China: The Case of Minyu e-Commerce Company. Int. Food Agribus. Manag. Rev. 2020, 23, 157–171. [Google Scholar] [CrossRef]
  35. Liu, M.; Min, S.; Ma, W.; Liu, T. The Adoption and Impact of E-Commerce in Rural China: Application of an Endogenous Switching Regression Model. J. Rural Stud. 2021, 83, 106–116. [Google Scholar] [CrossRef]
  36. Zeng, Y.; Jia, F.; Wan, L.; Guo, H. E-Commerce in Agri-Food Sector: A Systematic Literature Review. Int. Food Agribus. Manag. Rev. 2017, 20, 439–460. [Google Scholar] [CrossRef]
  37. Cui, M.; Pan, S.L.; Newell, S.; Cui, L. Strategy, Resource Orchestration and E-Commerce Enabled Social Innovation in Rural China. J. Strateg. Inf. Syst. 2017, 26, 3–21. [Google Scholar] [CrossRef] [Green Version]
  38. Wang, C.C.; Miao, J.T.; Phelps, N.A.; Zhang, J. E-Commerce and the Transformation of the Rural: The Taobao Village Phenomenon in Zhejiang Province, China. J. Rural Stud. 2021, 81, 159–169. [Google Scholar] [CrossRef]
  39. Wei, Y.D.; Lin, J.; Zhang, L. E-Commerce, Taobao Villages and Regional Development in China. Geogr. Rev. 2019, 110, 380–405. [Google Scholar] [CrossRef]
  40. World Bank Group E-Commerce Development: Experience from China. Available online: http://documents.worldbank.org/curated/en/344961574449770307/E-commerce-Development-Experience-from-China (accessed on 2 December 2019).
  41. World Bank Group. World Development Report 2016: Digital Dividends; World Bank Publications: Washington, DC, USA, 2016; ISBN 1464806713. [Google Scholar]
  42. Zhang, F.; Li, D. Regional ICT Access and Entrepreneurship: Evidence from China. Inf. Manag. 2018, 55, 188–198. [Google Scholar] [CrossRef]
  43. Li, A.H.F. E-Commerce and Taobao Villages. China Perspect. 2017, 2017, 57–62. [Google Scholar] [CrossRef] [Green Version]
  44. Luo, X.; Niu, C. E-Commerce Participation and Household Income Growth in Taobao Villages. World Bank Policy Res. Work. Pap. No. 8811 2019, 4, 10. Available online: https://ssrn.com/abstract=3369986 (accessed on 31 December 2019).
  45. Qin, Z.; Ni, Y.; Zhu, F.; Han, J. Empirical Analysis on the Impact of Poverty Alleviation by Rural E-Commerce on Farmers’ Income. Asian J. Agric. Ext. Econ. Sociol. 2019, 32, 1–12. [Google Scholar] [CrossRef]
  46. Greene, W. A Stochastic Frontier Model with Correction for Sample Selection. J. Product. Anal. 2010, 34, 15–24. [Google Scholar] [CrossRef] [Green Version]
  47. Guo, Y.; Chen, M.; Pan, J.; Shang, Y.; Wu, X.; Cui, Z. Increasing Soil Organic Carbon Sequestration While Closing the Yield Gap in Chinese Wheat Production. Land Degrad. Dev. 2021, 32, 1274–1286. [Google Scholar] [CrossRef]
  48. Liu, B.; Wu, L.; Chen, X.; Meng, Q. Quantifying the Potential Yield and Yield Gap of Chinese Wheat Production. Agron. J. 2016, 108, 1890–1896. [Google Scholar] [CrossRef]
  49. CIECC. E-Commerce in China 2020. Available online: http://www.199it.com/archives/1317397.html (accessed on 28 September 2021). (In Chinese).
  50. CIECC. E-Commerce in China 2019. Available online: https://www.ec.com.cn/upload/article/20200811/20200811104853210.pdf (accessed on 29 September 2021). (In Chinese).
  51. Lin, G.; Xie, X.; Lv, Z. Taobao Practices, Everyday Life and Emerging Hybrid Rurality in Contemporary China. J. Rural Stud. 2016, 47, 514–523. [Google Scholar] [CrossRef] [Green Version]
  52. Mor, R.; Singh, S.; Bhardwaj, A.; Singh, L. Technological Implications of Supply Chain Practices in Agri-Food Sector: A Review. Int. J. Supply Oper. Manag. 2015, 2, 720–747. [Google Scholar]
  53. Luo, Z.; Qiao, Y. New Countryside in the Internet Age: The Development and Planning of E-Commerce Taobao Villages in China. In Chinese Urban Planning and Construction: From Historical Wisdom to Modern Miracles; Strategies for Sustainability; Springer International Publishing: Cham, Switzerland, 2021; pp. 245–273. ISBN 978-3-030-65562-4. [Google Scholar]
  54. Qi, J.; Zheng, X.; Guo, H. The Formation of Taobao Villages in China. China Econ. Rev. 2019, 53, 106–127. [Google Scholar] [CrossRef]
  55. Kshetri, N. Rural E-Commerce in Developing Countries. IT Prof. 2018, 20, 91–95. [Google Scholar] [CrossRef] [Green Version]
  56. Anuj, K.; Fayaz, F.; Kapoor, N. Impact of E-Commerce in Indian Economy. J. Bus. Manag. 2018, 20, 59–71. [Google Scholar]
  57. Linh, D.H. Vietnam’s Booming E-Commerce Market. Available online: http://hdl.handle.net/11540/11515 (accessed on 31 January 2020).
  58. Mire, M.M. Effect of E-Commerce on Performance in Agricultural Sector in Kenya: A Case of Twiga Foods Limited. Available online: http://erepo.usiu.ac.ke/11732/5216 (accessed on 31 December 2019).
  59. AliResearch; Alibaba Rural Research Center; Nanjing Univeristy Spacial Planning Research Center; Zhejiang University China Rural Development Resaerch Center. Chinese Academy of Social Sciences Institute of Information System Report on China Taobao Villages: 2009–2019. Available online: https://i.aliresearch.com/img/20190830/20190830184640.pdf (accessed on 30 December 2020). (In Chinese).
  60. Kelemu, K. Impact of Mobile Telephone on Technical Efficiency of Wheat Growing Farmers in Ethiopia. Int. J. Res. Stud. Agric. Sci. 2016, 2, 1–9. [Google Scholar] [CrossRef]
  61. Mueller, R.A.E. E-Commerce and Entrepreneurship in Agricultural Markets. Am. J. Agric. Econ. 2001, 83, 1243–1249. [Google Scholar] [CrossRef]
  62. Henderson, J.; Dooley, F.; Akridge, J. Internet and E-Commerce Adoption by Agricultural Input Firms. Rev. Agric. Econ. 2004, 26, 505–520. [Google Scholar] [CrossRef]
  63. Carpio, C.E.; Isengildina-Massa, O.; Lamie, R.D.; Zapata, S.D. Does E-Commerce Help Agricultural Markets? The Case of MarketMaker. Choices 2013, 28, 1–7. [Google Scholar]
  64. Ashokkumar, K.; Bairi, G.R.; Are, S.B. Agriculture E-Commerce for Increasing Revenue of Farmers Using Cloud and Web Technologies. J. Comput. Theor. Nanosci. 2019, 16, 3187–3191. [Google Scholar] [CrossRef]
  65. Leong, C.M.L.; Pan, S.-L.; Newell, S.; Cui, L. The Emergence of Self-Organizing E-Commerce Ecosystems in Remote Villages of China: A Tale of Digital Empowerment for Rural Development. MIS Q. 2016, 40, 475–484. [Google Scholar] [CrossRef]
  66. Qi, J.; Zheng, X.; Cao, P.; Zhu, L. The Effect of E-Commerce Agribusiness Clusters on Farmers’ Migration Decisions in China. Agribusiness 2019, 35, 20–35. [Google Scholar] [CrossRef]
  67. Martey, E.; Wiredu, A.N.; Etwire, P.M.; Kuwornu, J.K. The Impact of Credit on the Technical Efficiency of Maize-Producing Households in Northern Ghana. Agric. Financ. Rev. 2019, 79, 304–322. [Google Scholar] [CrossRef] [Green Version]
  68. Zhao, J.; Barry, P.J. Effects of Credit Constraints on Rural Household Technical Efficiency: Evidence from a City in Northern China. China Agric. Econ. Rev. 2014, 6, 654–668. [Google Scholar] [CrossRef]
  69. Kuang, B.; Lu, X.; Zhou, M.; Chen, D. Provincial Cultivated Land Use Efficiency in China: Empirical Analysis Based on the SBM-DEA Model with Carbon Emissions Considered. Technol. Forecast. Soc. Chang. 2020, 151, 119874. [Google Scholar] [CrossRef]
  70. Aigner, D.; Lovell, C.K.; Schmidt, P. Formulation and Estimation of Stochastic Frontier Production Function Models. J. Econom. 1977, 6, 21–37. [Google Scholar] [CrossRef]
  71. Anang, B.T.; Bäckman, S.; Rezitis, A. Production Technology and Technical Efficiency: Irrigated and Rain-Fed Rice Farms in Northern Ghana. Eurasian Econ. Rev. 2017, 7, 95–113. [Google Scholar] [CrossRef]
  72. Mwalupaso, G.E.; Wang, S.; Rahman, S.; Alavo, E.J.-P.; Tian, X. Agricultural Informatization and Technical Efficiency in Maize Production in Zambia. Sustainability 2019, 11, 2451. [Google Scholar] [CrossRef] [Green Version]
  73. González-Flores, M.; Bravo-Ureta, B.E.; Solís, D.; Winters, P. The Impact of High Value Markets on Smallholder Productivity in the Ecuadorean Sierra: A Stochastic Production Frontier Approach Correcting for Selectivity Bias. Food Policy 2014, 44, 237–247. [Google Scholar] [CrossRef]
  74. Abdul-Rahaman, A.; Abdulai, A. Do Farmer Groups Impact on Farm Yield and Efficiency of Smallholder Farmers? Evidence from Rice Farmers in Northern Ghana. Food Policy 2018, 81, 95–105. [Google Scholar] [CrossRef]
  75. Bravo-Ureta, B.E.; Greene, W.; Solís, D. Technical Efficiency Analysis Correcting for Biases from Observed and Unobserved Variables: An Application to a Natural Resource Management Project. Empir. Econ. 2012, 43, 55–72. [Google Scholar] [CrossRef]
  76. Wang, P.; Zhang, W.; Li, M.; Han, Y. Does Fertilizer Education Program Increase the Technical Efficiency of Chemical Fertilizer Use? Evidence from Wheat Production in China. Sustainability 2019, 11, 543. [Google Scholar] [CrossRef] [Green Version]
  77. Subedi, S.; Ghimire, Y.N.; Kharel, M.; Adhikari, S.P.; Shrestha, J.; Sapkota, B.K. Technical Efficiency of Rice Production in Terai District of Nepal. J. Agric. Nat. Resour. 2020, 3, 32–44. [Google Scholar] [CrossRef]
  78. Battese, G.E. A Note on the Estimation of Cobb-Douglas Production Functions When Some Explanatory Variables Have Zero Values. J. Agric. Econ. 1997, 48, 250–252. [Google Scholar] [CrossRef]
  79. Heckman, J.J.; Ichimura, H.; Todd, P. Matching As An Econometric Evaluation Estimator. Rev. Econ. Stud. 1998, 65, 261–294. [Google Scholar] [CrossRef]
  80. Jin, H.; Li, L.; Qian, X.; Zeng, Y. Can Rural E-Commerce Service Centers Improve Farmers’ Subject Well-Being? A New Practice of ‘Internet plus Rural Public Services’ from China. Int. Food Agribus. Manag. Rev. 2020, 23, 681–695. [Google Scholar] [CrossRef]
  81. Leuven, E.; Sianesi, B. PSMATCH2: Stata Module to Perform Full Mahalanobis and Propensity Score Matching, Common Support Graphing, and Covariate Imbalance Testing. Available online: https://ideas.repec.org/c/boc/bocode/s432001.html (accessed on 12 December 2019).
  82. Wan, G.H.; Cheng, E. Effects of Land Fragmentation and Returns to Scale in the Chinese Farming Sector. Appl. Econ. 2001, 33, 183–194. [Google Scholar] [CrossRef]
  83. Salemink, K.; Strijker, D.; Bosworth, G. Rural Development in the Digital Age: A Systematic Literature Review on Unequal ICT Availability, Adoption, and Use in Rural Areas. J. Rural Stud. 2017, 54, 360–371. [Google Scholar] [CrossRef]
Figure 1. Propensity scores before (a) and after (b) matching.
Sustainability 14 01197 g001
Figure 2. Efficiency level estimated by a selectivity-corrected SPF model for the matched samples.
Sustainability 14 01197 g002
Table 1. Variable definition and summaries.
VariablesDescriptionsMean (S.D.)
Variables used in sample selection equations
E-commerce1 if household operates an online e-commerce business, 0 otherwise0.28
AgeAge of household head in years45.96 (12.37)
Gender1 if household head is male, 0 otherwise0.98 (0.15)
EducationTotal years of education received of the household head7.63 (3.51)
HealthSelf-reported health status of household head, ranging from 1 = very bad to 5 = very well4.52 (0.99)
Cadre1 if household head is a village cadre, 0 otherwise0.08 (0.28)
Household SizeNumber of residents in the household4.60 (1.61)
Access to Internet1 if household has access to high-speed internet, 0 otherwise0.73 (0.45)
Land SizeCultivated land size of household in hectares0.61 (2.48)
PhoneNumbers of mobile phones owned by household3.08 (1.39)
Variables used in production frontier models
OutputThe yield of wheat output (100 kg per hectare)67.05 (13.35)
SeedlingsExpenditure on seedlings (100 USD per hectare)0.40 (0.10)
FertilizersExpenditure on fertilizers (100 USD per hectare)0.88 (0.28)
PesticidesExpenditure on pesticides (100 USD per hectare)0.20 (0.11)
Family LabourNumbers of family labour input (days per hectare)302.40 (272.40)
Hired LabourExpenditure on hired labours (100 USD per hectare)0.60 (0.20)
Table 2. Mean differences of variables used in the SPF models.
VariablesAdoptersNon-AdoptersDiff.
Wheat Output (ln)5.39 (0.02)5.34 (0.02)0.05 *
Seedlings (ln)3.46 (0.03)3.55 (0.02)−0.09 **
Fertilizers (ln)4.22 (0.05)4.30 (0.02)−0.09 *
Pesticides (ln)2.73 (0.10)2.71 (0.05)0.18 *
Hired Labour (ln)3.84 (0.05)3.91 (0.03)−0.07
Family Labour (ln)1.78 (0.11)1.74 (0.07)0.04
Sample size266105371
Standard errors are presented in parentheses. ** p < 0.05; * p < 0.1.
Table 3. Factors concerning e-commerce adoption using Logit regression.
VariablesUnmatchedMatched
Age−0.084 ***
(0.016)
−0.046 ***
(0.009)
Gender−3.102 **
(1.297)
−1.636 **
(0.681)
Education0.124 **
(0.050)
0.077 **
(0.028)
Health0.221
(0.213)
0.116
(0.117)
Cadre−0.695
(0.655)
−0.487
(0.376)
Household Size0.050
(0.129)
0.046
(0.074)
Access to Internet3.374 ***
(1.049)
1.559 ***
(0.403)
Land Size−0.025
(0.028)
−0.017
(0.019)
Phone0.420 ***
(0.152)
0.231 *
(0.084)
Constant−0.428
(2.128)
−0.155
(1.153)
Sample size371344
Standard errors are presented in parentheses. *** p < 0.01; ** p < 0.05; * p < 0.1.
Table 4. Mean difference of variables used in the sample selection.
Variables MeanBias(%)Reduced Bias(%)t-Test
AdoptersNon-Adopters Statisticp-Value
AgeUnmatched
Matched
41.48
42.16
53.31
43.81
−106.2
−14.8
86.1−9.18
−1.05
0.000
0.294
GenderUnmatched
Matched
0.97
1.00
0.98
1.00
−3.8
0.0
100.0−0.34
-
0.735
-
EducationUnmatched
Matched
9.02
8.72
7.08
8.79
59.5
−2.0
96.74.95
−0.16
0.000
0.871
HealthUnmatched
Matched
4.85
4.84
4.38
4.84
54.3
0.6
98.84.22
0.06
0.000
0.955
CadreUnmatched
Matched
0.03
0.04
0.10
0.03
−25.0
5.5
78.1−1.99
0.49
0.047
0.626
Household SizeUnmatched
Matched
4.97
4.94
4.45
5.17
33.9
−14.4
57.62.85
−1.09
0.005
0.277
Access to InternetUnmatched
Matched
0.99
0.99
0.62
0.98
106.4
2.4
97.87.80
0.45
0.000
0.651
Land SizeUnmatched
Matched
0.33
0.33
0.72
0.35
−18.7
−1.1
94.2−1.36
−0.61
0.176
0.541
PhoneUnmatched
Matched
3.49
3.37
2.92
3.72
40.9
−25.9
36.73.57
−1.82
0.000
0.070
Table 5. Parameter estimates for both the conventional and selectivity-corrected SPF models for matched samples.
VariablesConventional SPFSelectivity-Corrected SPF
PooledAdoptersNon-AdoptersPooledAdoptersNon-Adopters
E-commerce0.630 ***
(0.183)
0.803 ***
(0.157)
Seedlings (ln)0.074 **
(0.242)
0.049 **
(0.256)
0.079 *
(0.315)
0.063 **
(0.158)
0.050 **
(0.174)
0.070 *
(0.374)
Fertilizers (ln)0.052 *
(0.189)
0.047 **
(0.134)
0.054 *
(0.168)
0.050 **
(0.243)
0.037 **
(0.452)
0.059 *
(0.217)
Pesticides (ln)0.127 *
(0.097)
0.112 **
(0.182)
0.135
(0.247)
0.176 *
(0.109)
0.134
(0.168)
0.225 *
(0.173)
Hired Labour (ln)0.020
(0.068)
0.019
(0.030)
0.023 *
(0.047)
0.023
(0.092)
0.020
(0.009)
0.028
(0.057)
Family Labour (ln)0.061
(0.069)
0.083
(0.136)
0.052 *
(0.162)
0.063
(0.031)
0.057
(0.124)
0.088
(0.063)
Constant5.988 ***
(0.156)
6.125 ***
(0.187)
6.367 **
(0.321)
6.268 **
(0.261)
6.326 ***
(0.339)
6.466 ***
(0.331)
Log Likelihood205.536128.424123.725207.557133.793124.462
σ v 0.278 ***0.265 ***0.213 *0.247 ***0.246 ***0.231 *
σ μ 0.312 ***0.332 ***0.298 **0.336 **0.305 **0.341 *
λ 8.874 ***9.171 ***7.253 *8.613 **8.972 **8.423 *
Selectivity correction term ( ρ ) −0.303 ***
(0.088)
−0.273 ***
(0.057)
−0.053 *
(0.057)
Sample size3449025434490254
Standard errors are presented in parentheses. *** p < 0.01; ** p < 0.05; * p < 0.1.
Table 6. Technical efficiency levels.
PooledAdoptersNon-AdoptersDiff.
Matched samples
Conventional SPF (Pooled)0.80 (0.07)0.80 (0.00)0.79 (0.01)0.009
Conventional SPF (Separated) 0.79 (0.00)0.77 (0.00)0.021 ***
Selectivity-corrected SPF (Separated) 0.82 (0.00)0.80 (0.00)0.022 ***
Standard errors are presented in parentheses. *** p < 0.01.
Publisher’s Note: MDPI stays neutral with regard to jurisdictional claims in published maps and institutional affiliations.

