1. Introduction
Essentially, an audit is a process of continuously collecting, identifying, and comprehensively applying audit evidence. Limited by cost-effectiveness and technical methods, current audit procedures are always based on audit sampling. This results in the neglect of many specific business samples and audit opinions based on the sample results, thus hiding huge audit risks [
1]. With the continuous innovation of technology, it has become possible to change the characteristics of audit work from “partial” and “accurate” to “complete” and “efficient” [
2,
3,
4,
5,
6]. Performing full population auditing allows auditors to obtain a much-increased level of audit evidence, which provides a higher level of assurance for the audit conclusion [
1].
With the electronization of financial and business data associated with the audited entity, auditors can obtain more comprehensive data, and audit tasks can be gradually structured and repeated. Auditors can analyze the data with the assistance of technical tools to form more scientific audit conclusions [
5,
7]. However, faced with a large amount of accumulated audit data from the auditees, the research progress of full-population auditing is still laborious. One reason is that the audit data are of a huge volume and have high complexity. Based on the current audit method, the computer only performs tasks according to the input instructions or rules but cannot understand and learn any audit knowledge during the audit process. The completion of the audit work is still dependent on the personal experience of the auditors, which makes the audit efficiency limited by manpower. Another reason is that current big data analysis is still limited to specific auditees or application scenarios. Though many current technical tools can, to a certain extent, improve the efficiency of data storage, data retrieval, and data research, it is necessary to establish different analysis rules for varying analysis requirements that cannot be extended and applied to all business scenarios. Therefore, it is imperative and challenging to implement full population testing.
Given the difficulties of full population auditing, this paper proposes to conduct full population auditing by using machine learning. Machine learning is a new artificial intelligence technology that can learn autonomously and summarize the hidden rules in data [
8]. Different from the way that people set rules for machines, the self-learning feature of machine learning can significantly reduce the dependence on personal experience and help overcome the workforce limitation in traditional audit work [
9]. Furthermore, machine learning is not limited by specific scenarios. In the face of different types of business data, machine learning can learn and summarize hidden business rules [
10]. Therefore, this paper proposes a full population auditing method based on machine learning. This method includes two functions. The first function is to help the machine to master the accounting rules used by the financial staff by constructing a machine-learning model. The second function is to enable the machine to identify anomalies in all accounting records. Specifically, based on the constructed machine-learning model, the machine should be able to simulate the role of a human in accounting processing. Then, by comparing the accounting results derived from the machine and those that were manually derived, abnormal accounting records can be identified.
2. Research Background and Literature Review
In the modern risk-oriented audit framework, sampling risk refers to the possibility that the auditor’s conclusions, based on the sampling results, do not conform to those obtained from the same audit procedure performed by the audit object. Non-sampling risk refers to the possibility that the auditor will make incorrect conclusions due to factors other than the sample size [
11]. Though statistical sampling has many inherent drawbacks, it is the only method that should be adopted under limited conditions, and any sampling method will produce sampling risks. If the auditors conduct full population testing, the risks of audit sampling can be effectively avoided [
1].
In a previous study, researchers attempted to improve audit efficiency in theory and practice. From a theoretical point of view, sampling audit is the universal choice for modern audit methods. As a cutting-edge tool for data analysis, machine learning emphasizes the combination of computing power and the learning ability of various algorithms to analyze massive data. Many researchers believe that machine learning is significant for abnormal audit discovery and judgment [
5,
7,
12,
13,
14]. Huang et al. have introduced a method of applying audit data analysis and machine learning to full population testing and have discussed the feasibility of this method [
1].
In practice, many researchers have attempted to obtain more effective audit information from mass data by introducing technical tools, based on the improvement of computing power and the development of big data audit. Issa et al. [
3] have pointed out that new technologies such as cloud computing and Hadoop can store and process data more efficiently. Deep learning technology can automatically extract features from unstructured or semi-structured data, such as images, voice, text, video, etc. Appelbaum et al. [
15] have proposed that many analysis techniques such as regression techniques, descriptive statistics, expert systems, big data visualization [
16], and other big data analysis techniques have been widely used in audit tasks to cope with the increasing requirements for audit data analysis. Huang and Vasarhelyi [
17] have proposed an RPA framework for audit scenarios to help auditors perform audit tasks with high repeatability and low judgment requirements. To sum up, researchers have paid much attention to the collation and analysis of massive audit data. Still, the audit process is dependent on the personal experience of the auditors, and the problem of the limits placed on audit work by human resources has not been fundamentally solved. Machine learning has made progress in many areas, such as optimizing management needs [
18], mental health monitoring [
19] and other areas but there are also some applications of machine learning in auditing. Lokanan et al. have proposed the use of the Mahalanobis distance to calculate the deviation distance of financial reports, identify abnormal financial reports, and divide them into different credit ratings [
20]. Kotsiantis et al. have proposed the use of the financial ratio to build a decision tree model to classify financial statements in order to identify false financial statements [
21].
However, in the business audit of the accounting process of an enterprise, the question of how to apply machine learning to full population auditing has been less studied and there is also a lack of practical application cases.
In view of the above literature, this paper collates
Table 1 and refines the point of view of each reference.
3. Research Question
In financial auditing, auditors can exhaust the transactions over the significance threshold and sample the transactions under the importance threshold to obtain audit opinions. In order to enhance the rationality of the audit opinion, this study attempts to cancel the audit sampling. For the proposed, machine-learning-based, full population auditing method, this study first demonstrates the feasibility of the method, and then selects the data of a large state-owned enterprise from 2020 to 2021 to further test and analyze the feasibility of the method. Finally, this study summarizes the key steps of practical application.
Full population auditing requires a review of each accounting record to identify unusual misstatements. To implement full population testing, it is necessary to know the accounting rules of various businesses and strictly check whether each business is properly accounted for according to the rules. If full population auditing is conducted using personal experience, a lot of human resources are consumed, and human errors cannot be avoided.
With the improvement in computing power, computers can use machine-learning algorithms to autonomously learn massive data, summarize hidden laws with far greater efficiency than human beings and identify anomalies in the data. “Learning” refers to a process in which, for a class of tasks T and performance metrics P, a computer program improves its performance on tasks T as measured by performance metrics P through experience E [
22]. Machine learning first determines the specific algorithm according to the task;. It then divides the preprocessed data set into a training set and a test set and trains the model by using the training set. Meanwhile, it selects the optimal function expression of the model by calculating the loss function. Finally, it measures the generalization performance of the optimal function on the test set. This self-learning characteristic of machine learning enables computers to have, to a certain extent, human-like professional judgment, thus removing the limitation imposed on the analysis process by its dependence on personal experience. Moreover, the application of machine learning is not limited to a specific type of sample data. Instead, it can be applied to various scenes to find out the rules according to the input data and complete the corresponding classification or prediction tasks. Machine learning relies on different algorithms to solve data problems, and the specific algorithm depends on the type of problem to solve. Common algorithms include supervised learning, unsupervised learning, reinforcement learning, etc. An appropriate machine-learning algorithm can be chosen according to the needs of different scenarios [
23].
The stronger the regularity between data, the better the learning effect of machine learning. Since financial datasets have uniform accounting rules and standards, machine learning has natural application advantages in processing financial data [
5]. In the audit scenario, machine learning can learn and summarize the hidden rules from the huge and complex audit data accumulated by the audited unit and identify any anomalies in the audit data by establishing a machine-learning model [
12,
13]. Compared with the traditional audit mode, machine learning adopts a completely different approach: it changes from relying on personal experience to training computer programs to master accounting rules, and it makes audit judgments by exploiting sufficient computing power. Thus, it can quickly and accurately locate abnormal accounting treatments. Different from the risk-oriented audit model, which is mainly aimed at specific businesses [
24], machine learning makes it possible to perform full population auditing while avoiding audit risks caused by human factors. Moreover, machine learning is limited to a specific audited unit or a specific audit scenario. Owing to its self-learning characteristic, it can process various input audit data and so can improve the performance of various applications. The above analysis indicates that the characteristics of machine learning can meet the needs of full population testing, which indicates that this method is feasible from a theoretical point of view.
On the basis of the above feasibility analysis, this study aims to propose a full population auditing method based on machine learning rather than on manpower and so overcome the dependence of an audit on manpower and thus the risks associated with sampling audits. In order for the machine to audit, two targets need to be achieved. The first target is to enable the machine to master the accounting rules used by financial personnel, and the second target is to enable the machine to detect anomalies in accounting processing based on the mastered accounting rules.
In order to achieve the research target, this study selected the travel expenses of an enterprise and tried to implement full population auditing based on machine learning at the application level. According to the above discussion, the process of full population auditing can be divided into two stages. First of all, it is necessary to build a machine-learning model based on existing accounting records. By learning accounting rules hidden in the accounting records, the machine can simulate the accounting process of financial personnel. Then, this study can use the machine-learning model to account for all travel expenses, and after comparing the results provided by the machine with the manual accounting records, we can quickly identify abnormal samples. In this way, this study implements this machine-learning-based full population auditing method.
The main research question of this study is whether one can use a machine to effectively replace the manual work needed to achieve effective full population testing. Referring to the two functions proposed above, it can be divided into the following two research questions:
Research Question 1: Can the machine master the accounting rules in the enterprise’s financial data based on machine learning?
Research Question 2: Can the constructed machine-learning model accurately screen out abnormal accounting treatments?
4. Research Design
Based on the above feasibility study, this study selected a large state-owned enterprise in China as the implementation object, one whose business data are of many types, of large quantities, and with high repeatability, and formally tested the effectiveness of this full population auditing method in practice. Specifically, a machine-learning-based full population audit was conducted on travel expenses data from 2020 to 2021. In the bookkeeping process, financial staff need to analyze the business information of travel expenses and record them to the correct accounting subject. The full population auditing method can test whether financial personnel record all travel expenses to the correct account in the bookkeeping process and can support more sufficient audit conclusions based on the more comprehensive audit evidence obtained.
The full population auditing process was divided into two stages. In the first stage, a machine-learning model was constructed based on the financial data by selecting sample data to train the model and determining the accounting rules hidden in the data. In the second stage, the constructed model was used to check the existing accounting treatment and detect the anomalies in the accounting records [
6].
Specifically, in the first stage, in order to enable the machine to learn the existing accounting rules in accounting processing, this study constructed a machine-learning model based on the travel expense sample in 2020. At this stage, 80% of the samples of travel expenses in 2020 were randomly divided into training sets, and the remaining 20% into test sets. The machine learned the accounting rules according to the randomly selected training set samples and used the test set to test the validity of the model. According to the case scenario, this study selects the appropriate machine-learning algorithm training model and selects appropriate evaluation indicators to evaluate the performance of the model, so as to analyze whether the machine-learning model has mastered the existing accounting rules. In addition, in the case of a sufficient number of samples, if the machine cannot accurately learn the accounting rules of a certain type of business, it shows that there are anomalies in this kind of business sample, which may be due to unclear design of the accounting rules or other abnormal reasons. In the second stage, in order to test whether the machine can identify abnormal samples in accounting processing, this study took all travel expenses in 2021 as test samples to test the practicability of the machine-learning model. In this study, the machine-learning model constructed in the first stage was used to account for each sample of travel expenses in 2021. The machine can determine which type of business the sample should be classified into. Each type of business corresponds to a different account. By comparing the account given by the machine and the account given by the financial staff, we can know whether the two results are consistent. From the perspective of a financial audit, this study took the consistency between machine accounting processing results and manual accounting processing records as the evaluation standard. If there was an inconsistency between the two results, then the sample was recognized as abnormal. For example, we can use the machine-learning model on a regular basis or after each bookkeeping, output the machine’s judgment of the business sample, and then match with the existing manual accounting records. If the match succeeds, the samples are considered to be processed correctly. If the match fails, the business sample is considered to be at risk and is detected as a fraud sample.
In this way, the machine-learning-based full population auditing method can quickly locate abnormal samples. Specifically, it enables the machine to master the accounting rules of financial personnel, which can effectively improve the audit efficiency. By using machines instead of manpower, machines can examine more samples with far more efficiency than manpower. This method can not only help to detect the anomalies in the existing accounting rules, but also help enterprises to check the human errors in the business. For large-scale enterprises in particular, this method can help enterprises to locate small errors quickly and obtain more sufficient audit evidence with a lower audit cost.
4.1. Data Sources and Sample Selection
This study selected 14,681 travel expense samples in 2020 to construct a machine-learning model and applied the model to conduct full population auditing of 10,738 travel expense samples in 2021. The business data and accounting records of the travel expenses in this study were all obtained from the internal database of the enterprise. As shown in
Table 2, each travel expense sample included transaction information from nine business features, based on which business staff needs to determine which of the 16 debit accounts should be accounted for. Additionally, each business feature is a classification variable and contains several categories. For example, the feature variable “Document Type” contains five different categories of transaction information in total. Each debit account represents a category of travel expenses (the accounting records of travel expenses include debit account, credit account and amount. In this case, the credit account is automatically generated by the system according to the payment method, which is usually an account such as a “bank deposit” or “cash”, and the amount is automatically filled by the system, which has nothing to do with the specific business, so this study chooses the debit account to represent the business category).
In order to enable machines to replace humans to undertake bookkeeping, it is necessary to clarify the input and output of the model. In this case, “input” refers to the information in nine business features of travel expenses, and “output” refers to the accounting subject that needs to be recorded. By summarizing the rules in the data, the machine-learning model can imitate human beings to establish mapping rules between the “input” and “output”.
The travel expense sample dataset in 2020 involves nine feature variables and sixteen corresponding debit accounts. The details of the sample dataset are presented in
Table 2.
Table 3 presents the sample distribution of each debit account in the travel expense dataset in 2020.
In
Table 3, there are 16 types of travel expense businesses in 2020. Among these, the three types of travel expenses represented by “Administrative Expenses-A”, “Main Business Cost-A”, and “Sales Expenses-A” involve 13,343 samples in total, accounting for 90.89% of the total sample. Meanwhile, the number of each type of travel expense business corresponding to “Administrative Expenses-C”, “Main Operation Cost-E”, “Payroll Payable-A”, “Other Business Costs-A”, and “Long-term Deferred Expenses-A” is ten or less. Furthermore, the five types of business involve 17 samples, accounting for no more than 0.12% of the total sample, and they belong to the debit account rarely found in travel expenses. To cover all types of travel expense businesses, this study retained the entire travel expense business sample in 2020.
To thoroughly test the effectiveness of the model, this study excluded travel expense business added in 2021, such as the travel expense business involving a new debit account or the travel expense business involving a new department and an existing debit account. Then, 10,738 samples of travel expense business (excluding new business) in 2021 were used to conduct full population auditing, as shown in
Table 4.
The sample distribution of each debit account in the 2021 travel expense dataset is presented in
Table 5 (as the percentage of each type of sample size is calculated with only two digits retained, the sum of percentages is not strictly equal to 100%).
In
Table 5, the travel expense business in 2021 involves 13 debit accounts, and each account represents a type of travel expense business. Among these, the three types of businesses “Administrative Expenses-A”, “Main business cost-A”, and “Sales Expenses-A” involve 9733 samples, accounting for 90.47% of the total sample. The number of samples of “Main Business Cost-C”, “Payroll Payable-A”, “Sales Expenses-B”, “Other Business Costs-A”, and “Long-term Deferred Expenses-A” are all less than 10. The five types of businesses involve a total of 31 samples, accounting for no more than 0.28% of the total sample.
4.2. Machine-Learning Model Selection
To establish a machine-learning model suitable for the audit scenario of this study, the machine-learning algorithm is chosen from the following four aspects: First, this study can obtain the input business data and the output accounting results, so a supervised learning algorithm is more suitable. Secondly, as the model’s output is a discrete class variable, this is considered a classification problem. Thirdly, when the prediction results of the model are inconsistent with the accounting records, the judgment process of the model needs to be verified, so the selected algorithm should be interpretable [
25].
The decision tree algorithm is one of the few supervised learning algorithms with good interpretability in machine learning [
26]. There are three classical decision tree algorithms: the ID3, C4.5, and CART. Among these, the CART decision tree algorithm that is based on the two former algorithms is proposed, which makes up for their defects [
27]. Based on the above considerations, this study adopts the CART decision tree algorithm to establish a machine-learning model.
A CART classification regression tree model was proposed by Breiman et al. in 1984 [
28]. CART consists of feature selection, tree generation and pruning, and can be used for both classification and regression. A CART algorithm uses a binary recursive segmentation technique, which divides the current sample into two subsample sets, so that the generated non-leaf nodes have two branches. Therefore, CART is actually a binary tree. When CART is a classification tree, a
Gini value is used as the basis for splitting nodes, and when CART is used as a regression tree, the minimum variance of samples is used as the basis for splitting nodes. For the binary classification problem, if the probability that the sample points belong to the first category is
p, then the
Gini index of the probability distribution is:
For a given sample set
D, the
Gini index is:
where
Ck is a subset of samples belonging to class
k in
D and
K is the number of classes.
|Ck| and
D indicate the number of subsets and the number of samples, respectively.
If the sample set
D is divided into
D1 and
D2 according to whether feature
A takes a possible value
a, that is:
Under the condition of feature
A, the Gini index of set
D is:
The Gini index Gini(D,A) denotes the uncertainty of the set after the decomposition of A = a. The greater the Gini index, the greater the uncertainty of the sample set.
The steps to build the CART model are:
- (1)
For each feature A dataset D can be divided into dataset D1 and D2 according to whether the sample point A is a or not. Calculate the Gini index of the existing feature for the data set.
- (2)
For all features A and all possible segmentation points a, the features with the lowest Gini index and the corresponding segmentation points are selected as the optimal features and segmentation points.
- (3)
Step (1) (2) is called recursively on the optimal subtree until the stop condition is met.
- (4)
Generate the CART classification tree.
According to the tree structure, it divides the complex decision-making process into a series of simple choices and can intuitively show the whole decision-making process. The decision tree starts from a root node, passes through a series of branch nodes, and finally obtains a plurality of leaf nodes. This process reflects the mapping relationship between the input data and output results. Considering the travel expense sample as the root node, each branch representative from the top to bottom subdivides the sample according to a specific category. Then, according to evaluation indicators such as the Gini coefficient, each level of subdivision category can be filtered until the travel expense sample is subdivided to the last leaf node level by level with the optimal path. The construction process of the decision tree is similar to the behavior pattern of people when they are making decisions. Its foundation is the establishment of the correspondence between the input data and output results through a series of rules. According to the above introduction, the CART decision tree algorithm is suitable for learning accounting rules in enterprises. This paper attempts to build a full population auditing model based on a CART classification tree (the model parameters are set as default values (the evaluation index of the model used in this paper is the Gini coefficient, the selection criterion of the split point is set as global optimum, and there is no limit to the number of categories to be considered. If a branch node is subdivided, the number of samples for that node should not be less than one, and the Gini coefficient must be greater than 0. The maximum number of nodes of the same branch is set to 6, and the minimum number of samples of leaf nodes is 2, which does not limit the maximum number of samples of leaf nodes. When dividing the sample data set, the model divides the training set and the test set in a random way (criterion=“gini”,splitter=“best”,max_depth=None,min_samples_split=2,min_samples_leaf=1,min_weight_fraction_leaf=0.0,max_features=None,random_state=None,max_leaf_nodes=None,min_impurity_decrease=0.0,ccp_alpha=0.0)), and use this model to test the accounting process of all samples.
4.3. Process Implementation
Step 1: Filter relevant business feature variables.
As mentioned above, based on the analysis of the accounting rules formulated by the enterprise, the following nine business feature variables were selected as inputs to the model: (1) Document Type; (2) Level-1 Budget Usage Department; (3) Level-2 Budget Usage Department; (4) Budget Project; (5) Budget Activity; (6) Budget Item; (7) Currency Type; (8) Travel Type; (9) Training Type.
Step 2: Data preprocessing.
For the dataset in this study, missing values need to be handled, and feature variables should be converted into feature vectors.
For the missing values in the dataset, this study considered them from the aspect of business features. Specifically, the missing values in each business feature variable are separated into one category and regarded as business feature variables. For example, the “Training Type”, a business feature variable, has null values in some samples. Additionally, null values are considered as another category. In addition to the other 12 categories with content in the “Training Type”, the “Training Type” includes 13 categories in total.
As for converting feature variables into feature vectors, since the corresponding categories in the business features are all text information, to enable the machine to understand the relationship between different categories of feature variables, one-hot encoding was adopted to convert the text information into data format that could then be identified by the machine [
29]. Taking the feature variable “Budget Item” as an example, this business feature includes eight categories, all of which are text information. After one-hot encoding, these eight categories are converted into one-hot vectors, such as [1, 0, 0, 0, 0, 0, 0, 0], [0, 1, 0, 0, 0, 0, 0, 0], [0, 0, 1, 0, 0, 0, 0, 0], [0, 0, 0, 1, 0, 0, 0, 0], [0, 0, 0, 0, 1, 0, 0, 0], [0, 0, 0, 0, 0, 1, 0, 0], [0, 0, 0, 0, 0, 0, 1, 0], or [0, 0, 0, 0, 0, 0, 0, 1]. To ensure that each category of the feature variables corresponds to a unique one-hot vector, the datasets of the travel business in 2020 and 2021 need to be encoded in the same way (for the sample data set used to construct the full-sample audit model and the sample data set used to implement the full-sample audit, it is necessary to perform one-hot encoding based on the same coding rules to ensure consistency among different sample data sets).
Step 3: Establish a machine-learning model.
Of the travel expenses samples in 2020, 80% were randomly selected as the training set and 20% as the test set, and the CART decision tree model was established. By analyzing the model indicators, the effectiveness of the model can be evaluated.
Step 4: Conduct full population auditing of the new business samples.
After constructing the CART decision tree model, the data of travel expenses in 2021 were input into the model, and the debit accounts were predicted in turn. In this process, inconsistent accounting treatments can be screened out by comparing the debit account predicted by the model with the existing accounting records.
5. Results and Analysis
To answer research question 1: “Can the machine master the accounting rules in the enterprise’s financial data based on machine learning?”, in the third step of building the machine-learning model, this study chose the CART decision tree algorithm and used the travel expense business dataset in 2020 to train and construct the CART decision tree model. The evaluation indicator results of the model on the test set are listed in
Table 6.
In this study, the model’s performance can be evaluated by the following evaluation indicators: precision, recall, F1 score, and accuracy. Specifically, precision = TP/(TP + FP), where TP indicates the number of correctly predicted samples in a business type, and the sum of TP and FP is the number of samples predicted as this business type in the test set. This measures the percentage of the samples correctly predicted as a business type. Recall = TP/(TP + FN), where the definition of TP is the same as above, and the sum of TP and FN indicates the number of the business type’s samples in the test set. This measures the percentage of samples correctly predicted in a business type. The F1 score is a comprehensive indicator that considers both precision and recall. Furthermore, accuracy measures the overall classification accuracy.
The results indicate that the precision and recall of nine types of travel expenses in the test set are not less than 99%, and the F1 scores all reach 1. This part of the business samples accounts for 98.37% of the samples in the test set, indicating that the model achieves excellent prediction results for these nine types of business samples. However, for the two types of businesses corresponding to “Employee Remuneration Payable-B” and “Employee Remuneration Payable-C”, the precision of the model is 85% and 80%, the recall is 85% and 94%, and the F1 score is 0.85 and 0.86, respectively. This indicates that only 85% and 84% of the samples predicted to be these two types of businesses were correctly classified, and only 85% and 94% of the samples of these two types of businesses were correctly classified, respectively. The classification results of the model have significantly decreased in these two types of business samples. Additionally, only four samples and ten samples were included for the businesses of “Main Business Cost-E” and “Employee Remuneration Payable-A” respectively, which resulted in a sparse distribution of samples. As a result, the model cannot provide enough information to learn the correct accounting rules, so the model cannot classify these two types of businesses well.
In view of the fact that the decision tree is an explainable model, we can understand its classification process of travel expenses from the perspective of machines. As the first research aim includes enabling the machine to master the accounting rules used by financial personnel, this study makes the machine simulate the way of thinking of financial personnel by constructing the decision tree model. By explaining the specific decision-making process of the decision tree model, we can know whether the machine masters the accounting rules. In the decision tree model, each category of business characteristic can become the branch point of the decision tree. Here is an example to describe the classification process of the decision tree model. For example, according to the decision tree model that was constructed, in this case, for a travel sample, and without knowing the business result, the machine performs the following judgment process: (1) check whether “Budget Activity” is “training expense”; (2) check whether “Budget Activity” is “marketing expense”; (3) check whether “Budget Project” is “promotion project” (4) check whether “Level 1 Budget Usage Department” is “Beijing branch”; (5) check whether “Budget Item” is “publicity speech”; (6) check whether “Level 2 Budget Usage Department” is “business unit”; (7) check whether “Travel Type” is “business trip”; (8) check whether “Training Type” is “advanced training”; (9) check whether “Document Type” is “domestic travel reimbursement”; (10) check whether “Budget Item” is “daily business”; and (11) check whether “Currency Type” is “RMB”. After all the above checks, it is concluded that the sample should be classified into this category of business with debit account “Administrative Expenses-A”. As in this example, for research question 1, “can the machine master the accounting rules in the enterprise’s financial data based on machine learning”, if the machine’s accounting results of the sample are consistent with the manual accounting records, it means that the machine has mastered the accounting rules of the financial staff in the sample.
The analysis results indicate that the model has mastered the accounting rules for the nine business samples mentioned above, which account for the vast majority (due to the existence of a small number of human errors in the travel business in 2020, the precision for some business types rate or recall rates were 99%, which did not reach one. In the case of large samples, this does not affect the overall prediction results of the model). For the two types of businesses of “Payroll Payable-B” and “Payroll Payable-C”, where both the accuracy and recall had significantly decreased, it was found through the manual review that these two types of businesses had not formed clear accounting rules in their accounting treatment, and that there is subsequently confusion and errors in judgment. Specifically, these two types of businesses are travel expense businesses for staff training. However, the relevant accounting rules are not apparent when conducting accounting treatment, and the classification of these types of businesses is often judged based on the personal experience of financial personnel. For example, as shown in
Table 7, Sample 1 and Sample 2 are travel expense businesses for staff training in 2020. The two samples have the same feature variables, but Sample 1 is debited to the account “Payroll Payable-C”, and Sample 2 is debited to the account “Payroll Payable-B”.
As for whether the accounting rules in the enterprise financial data can be obtained by employing the machine-learning method raised in research question 1, the above analysis indicates that the machine can obtain the accounting rules from the business data with clear rules by using the machine learning method. However, the machine cannot learn clear accounting rules from the business data with unclear business rules. The unclear formulation of accounting rules often reveals defects in the design of an enterprise’s internal controls, while machine learning can also effectively identify such anomalies.
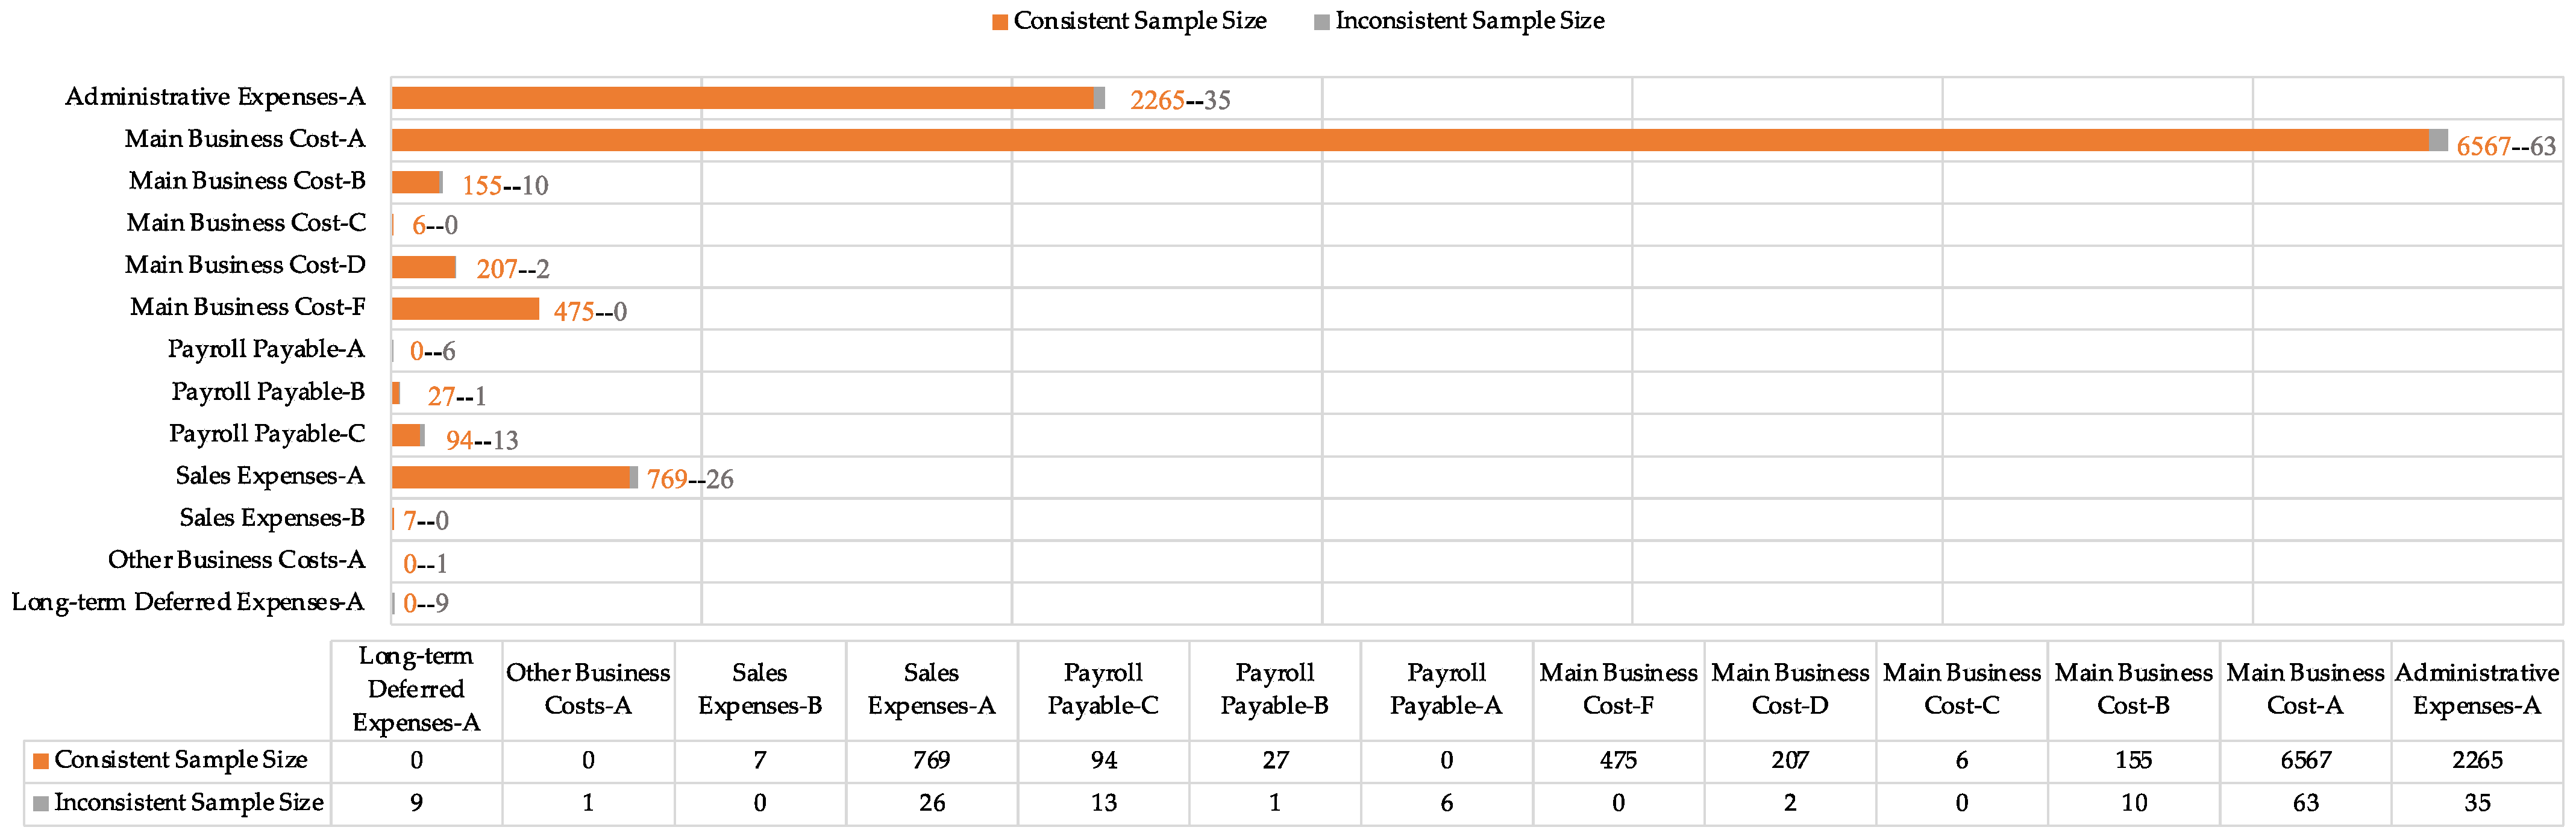
To answer research question 2: “Can the constructed machine-learning model accurately screen out the existing abnormal accounting treatments?”, in the fourth step, full population auditing of the travel expense samples in 2021 was conducted by using the constructed CART decision tree model. Then, the prediction results of the model were compared with the existing accounting records, and the statistical results are presented in
Table 8 and
Figure 1.
The results show that the consistency between the prediction results of the constructed model and the existing records reaches 98.45%, indicating that most business samples have been accounted for following the original rules. In particular, among the 10,738 travel business samples in 2021, the model prediction results of 166 business samples are inconsistent with the actual accounting records. These samples were accurately located after model screening and required a critical manual review.
This study reviewed the above 166 samples according to business types. The review results are shown in
Table 9. Taking into account the inconsistency between the machine-learned and the manual results, and bearing in mind that there may be unclear accounting rules, there are three types of situations. In the first type of situation, the machine prediction result is correct, but the manual bookkeeping result is incorrect. In the second situation, the bookkeeping record is correct, but the machine prediction result is incorrect. In the third situation, the accounting rules are unclear, and it is not easy to judge whether the manual and the machine are correct. Next, these three types of samples are analyzed with examples.
In the first situation, there are 116 samples, accounting for 69.88% of all inconsistent samples, which indicates that most errors in real business are caused by manual failure to follow the original accounting rules. For example, as shown in
Table 10, Sample 1 and Sample 2 have the same feature variables. The former was debited to the account “Main Business Cost-A” in 2020, and the latter was debited to the account “Sales Expenses-A” in 2021, indicating that Sample 2 was not accounted for following the original accounting rules.
In the second situation, there are 47 samples, accounting for 28.31% of all inconsistent samples. These samples were misjudged because the accounting rules were not formulated clearly, and the model could not learn clear rules. The 47 samples in 2021 involving the debit account of “Main Business Cost-A” belong to the same business (If the values of the feature variables are the same, the business is considered the same). Through the manual review, it was found that the business had unclear accounting rules in 2020. In 2020, there were 24 samples of this business, as shown in sample 3 in
Table 10. Among these samples, eight were accounted as the debit account of “Main Business Cost-A”, while the other 16 samples were accounted as the debit account of “Payroll Payable-C”, as shown in Sample 4. Therefore, the model could not learn accurate accounting rules, and there were relevant abnormal samples in 2021. Additionally, it should be noted that although there were 6,630 business samples involving the debit account of “Main Business Cost-A” in 2020, accounting for 61.74% of the total number of samples, and the samples with unclear accounting rules only accounted for 0.7% of this business type, it was difficult to find the anomaly through the evaluation indicators with the established model. However, by predicting each business sample in 2021, the problem can be accurately located.
In the third situation, there are three samples, accounting for 1.81% of all abnormal samples, which is an accidental situation. After a manual review, as for the sample corresponding to the debit account of “Other Business Costs-A”, the model cannot correctly predict this type of business because there is only one similar sample in 2020, and the sample fails to provide sufficient information. For the remaining two samples corresponding to the debit account of “Payroll Payable-B” and “Payroll Payable-C”, the reason for the incorrect prediction is that the machine learned from the human error in the same business in 2020, so the machine predicted the samples according to incorrect rules. These two abnormal samples, i.e., Samples 5 and 6, were erroneously accounted for as the debit account of “Main Business Cost-A” and “Administrative Expenses-A” in 2020, and they were correctly accounted for as the debit account of “Employee Remuneration Payable-B” and “Employee Remuneration Payable-C” in 2021, thus causing the inconsistency in this sample.
As for the question of whether the machine-learning model established in research question 2 can accurately screen out abnormal accounting treatment, the result analysis indicates that by implementing the full population auditing method, the abnormal samples in the enterprise business can be accurately located. In this study, this method can detect misstated samples that are not accounted for following the original rules and further accurately detect business samples that have unclear accounting rules. Therefore, the proposed method provides a supplement for the detection of internal control problems for enterprises in the model building stage and avoids situations in which these problems remain undetected due to the relatively small proportion of abnormal samples. Additionally, if there had been occasional human errors in the enterprise business in previous years, the proposed audit method based on machine learning can accurately locate those anomalies.
6. Conclusions, Limitations and Further Research
This paper proposes a full population auditing method that combines the learning ability of a machine-learning algorithm and a computer’s computing power. The effectiveness of full population auditing based on machine learning has been proven in practice, providing an essential reference for the intellectual development of future auditing. By taking the data of a state-owned enterprise as an example, this paper selected 14,681 travel expense samples in 2020 to construct a CART decision tree model and applied the model to conduct a full population audit of 10,738 travel expense samples in 2021. The research results indicate that full population auditing based on machine learning can accurately detect and locate the following two types of anomalies: misstatements in the accounting treatment of enterprise business, and the abnormal business in which the accounting rules are not formulated clearly. It is worth noting that the proposed method can also identify the anomalies for some low-frequency business samples. Therefore, the proposed full population auditing method based on machine learning can help enterprises quickly review all business data and accurately locate misstatements in the business. Additionally, this method can detect internal control problems of businesses in a timely manner and enable enterprises to improve the quality of their financial data and the effectiveness of internal control management.
For theoretical implications, this study demonstrates the feasibility of the full population auditing method with machine learning. Meanwhile, the relevant literature has been enriched by the proposal for a framework by which a full population auditing method can be used.
For practical implications, this study expands the application scenarios of machine learning in the audit field, as it applies a machine-learning-based full population auditing method to the accounting record audit scene of actual enterprises. Additionally, this study verifies the application value of the method through an enterprise case by effectively identifying abnormal situations in the design and implementation of internal control. Furthermore, this method can accurately locate the position of misstatements in big data and detect very small misstatements. This method can break through the limitations that result from the way in which risk-oriented audits pay more attention to significant misstatements, and it promotes the further development of full population auditing research. Moreover, this study provides a necessary reference for other audit application scenarios.
This study is limited to the discussion of full population auditing in the bookkeeping process. Due to the high threshold of professional knowledge, there may not be enough professional personnel to understand and develop its practical applications. For future research, the machine learning method used in this paper can also be extended to identify other internal control audit issues, including internal control design and internal control execution. The design defects of internal control will inevitably lead to inconsistent handling behaviors of different personnel. Additionally, the lack of internal control implementation effectiveness will hinder the effective execution by authorized personnel of the corresponding processes according to the due rules. From the perspective of application scenarios, future research will also explore the use of the full population auditing method in other business scenarios.
Based on the above, a general process of the proposed full population auditing method based on machine learning is presented below.
To select the business feature variables to construct the model, it is necessary to fully understand the business processing logic of the financial personnel to ensure that the selected feature variables provide sufficient rule information and help construct an effective machine-learning model. For example, in the above study, nine business features, such as “Document Type” and “Level-1 Budget User Department” were selected for the travel business to provide sufficient accounting rule information for the subsequent model construction.
When constructing data sets, data preprocessing is usually needed to facilitate the subsequent construction of the machine-learning model. Specifically, it includes a series of contents, such as processing missing values and data transcoding. For missing values, this study regards the missing value of each business feature as a category value or deletes samples with too many missing values. For data transcoding, the sample data are converted into a data format that the machine can recognize by feature discretization (feature discretization is a process of dividing feature values into multiple categories by using segmentation points) or one-hot encoding. For example, in the above research, the text information in the sample data is converted into one-hot vectors for machine recognition.
The construction of a machine-learning model involves selecting an appropriate machine-learning algorithm according to the application scene, dividing the sample dataset used for constructing a model into a training set and a test set at a particular proportion, constructing a machine-learning model, and using the dataset to train the model.
After preprocessing the sample dataset, the constructed machine-learning model is used to predict the sample to be audited. By comparing the prediction results of the model with the existing records, the inconsistent business samples are further reviewed.


