Article

Soil Heterogeneity Effects on Bridge Piles Deformation under Shield Tunnelling Disturbance

1
College of Civil Engineering, Hefei University of Technology, Hefei 230009, China
2
Hefei Rail Transit Group Co., Ltd., Hefei 230009, China
3
School of Resources and Safety Engineering, Central South University, Changsha 410083, China
4
School of Energy and Safety Engineering, Hunan University of Science and Technology, Xiangtan 411201, China
*
Authors to whom correspondence should be addressed.
Sustainability 2022, 14(24), 16854; https://doi.org/10.3390/su142416854
Submission received: 24 November 2022 / Revised: 13 December 2022 / Accepted: 14 December 2022 / Published: 15 December 2022

Abstract

:
This research examines the impact of soil heterogeneity on the bridge piles beneath a nearby tunnel excavation using Monte-Carlo stochastic analysis. Sensitivity analysis is specifically used to the variation of stratum range, variation coefficient (COV), and fluctuation distance of the soil Young’s modulus. Meanwhile, the reliability evaluation approach is also applied to systematically examine the impact of COV on the likelihood of a pile failing. The findings suggest that more consideration should be given to the degree and range of geological parameter variations in the strata surrounding the tunnel. The horizontal and vertical fluctuation distances in this project are predicted to be around 18 m and 4.5 m, respectively. The fluctuation range influences the frequency of low stiffness zones in the soil. Additionally, the variation coefficient has a significant effect on the pile deformation, presenting a positive association. The pile deformation exhibits an increasing tendency in the wake of the growing variation coefficient. More significantly, the increase of the COV will directly lead to a rising failure probability of the pile settlement. According to extensive Monte-Carlo simulation calculations, the simulation results considering the variability of soil parameters have a certain deviation from the deterministic in the perspective of probability statistics. It is quite necessary to attach importance to the soil heterogeneity effects in the pile foundation stability under construction disturbance.

1. Introduction

In recent decades, urban underground tunnel development has been in full swing, and issues with tunnel excavation near to structures are not uncommon. Scholars have carried out large numbers of studies on such problems [1,2,3,4,5,6]. As for the impact evaluation of shield tunnel construction adjacent to pile foundation, researchers have conducted in-depth research based on theoretical analysis [7,8,9,10], on-site monitoring [11,12,13], model tests [14,15,16], and numerical simulations [17,18]. Geological issues are seldom addressed in the few studies that exist, which focus mostly on the effect of tunnel construction parameters and the relative spatial locations of the pile and tunnel.
However, the influence of geological variability factors on the disturbance induced by adjacent construction is quite significant, especially in coastal areas [19,20,21]. Huang et al. [22] investigated the influence of spatial variability of soil elastic modulus on tunnel convergence, indicating that ignoring the spatial variability of elastic modulus will underestimate the convergence deformation of tunnel. Luo et al. [23] proposed the effects of soil vertical spatial variability on several major geotechnical and structural failure modes, also demonstrating the importance of addressing the spatial variation of soil properties for complicated soil-structural interaction problems. The soil deformation and strength parameters under construction disturbance are closely related to the stress and deformation of the existing pile foundation. The spatial variability of soil parameters exists objectively and satisfies certain laws [24]. Due to the inadequacy of present survey techniques, engineering geological conditions are minimally simplified as homogenous strata, which deviates significantly from real geological conditions and increases structural deformation uncertainty. Therefore, proper characterization of soil heterogeneity can better estimate the pile deformation induced by adjacent construction.
The variability of soil parameters can be divided into two categories in terms of performance characteristics [25]. As Yang et al. [26] proposed, the variability can be expressed as the difference between layers (inter-layer heterogeneity) and the spatial change of soil characteristic points in each layer (intra-layer heterogeneity) at large and small scales, respectively. Until now, numerical modeling, including random finite element method (RFEM) and random difference method (RDM), has been the only study technique capable of incorporating the spatial variability of soil properties (RFDM). The random soil parameters are defined in computer language as a collection of functional data with fluctuation and correlation, which are finally mapped into the numerical model. Quantitative characterization of soil parameters by random fields has been widely applied in geotechnical engineering, such as slope stability [27,28,29], tunneling [30,31,32], and foundation pit excavation [23,33].
In recent years, random field methods combined with the Monte-Carlo strategy have emerged in order to characterize the variability of soil parameters through computer technology and serve for engineering safety assessment. These methods aim to obtain large numbers of random statistics based on the vast generated random field models [34,35]. The outcome of a numerical computation is no longer a unique, deterministic value, but rather a probability that conforms to a particular distribution type.
In addition, Bayes methods have been extensively adopted in the investigation of reliability evaluation, especially the studies of soil variation based on the Monte-Carlo strategy. Accordingly, the Monte-Carlo method provides a large number of complex samples for Bayesian parameter estimation, hence ensuring the accuracy and reliability of the estimated probabilistic outcomes. Yang et al. [36] proposed an efficient probabilistic back estimation method for characterization of spatial variability based on the integration of three random field generation methods, and the correctness of this method was validated by subsequent field monitoring investigations [37,38]. Chen et al. [39] presented a simplified procedure to evaluate the failure probability of crossing tunnels considering the spatial variabilities of rock mass properties, and it provides an effective way to evaluate the safety and serviceability of tunnelling perpendicularly beneath an existing tunnel in spatial variable rock mass. El-Ramly et al. [40] applied a spreadsheet-based, probabilistic slope analysis methodology to evaluate the stability of a section of the Syncrude Tailings Dyke in Fort McMurray, Canada. Pang et al. [41] proposed a novel approach for nonlinear stochastic dynamic analysis, and for the first time, the impact of aftershocks on nonlinear structures is described from a probabilistic standpoint. From the perspective of geological parameter variability, these investigations indicated that Bayesian approaches based on the Monte-Carlo strategy and random field theory (RFT) can better characterize reliable probabilistic assessments of structure or geology. However, published studies considering the spatial variability of soil parameters on the deformation of pile foundation under disturbed dynamic conditions is rarely involved. As a result, related research exploration has attracted attention and warrants further study.
Based on Monte-Carlo stochastic analysis, this study explores the influence rule under the spatial variability of soil parameters on pile foundation deformation (including differential settlement and lateral displacement) caused by the disruption of neighboring tunnel excavation. Specifically, the variation of stratum range, variation coefficient (COV) and fluctuation distance of the soil are taken as the object of sensitivity analysis of Young’s modulus. Meanwhile, the influence of COV on the pile failure probability is also systematically analyzed by the Bayesian reliability evaluation method.

2. Random Field Theory (RFT) and Reliability Evaluation

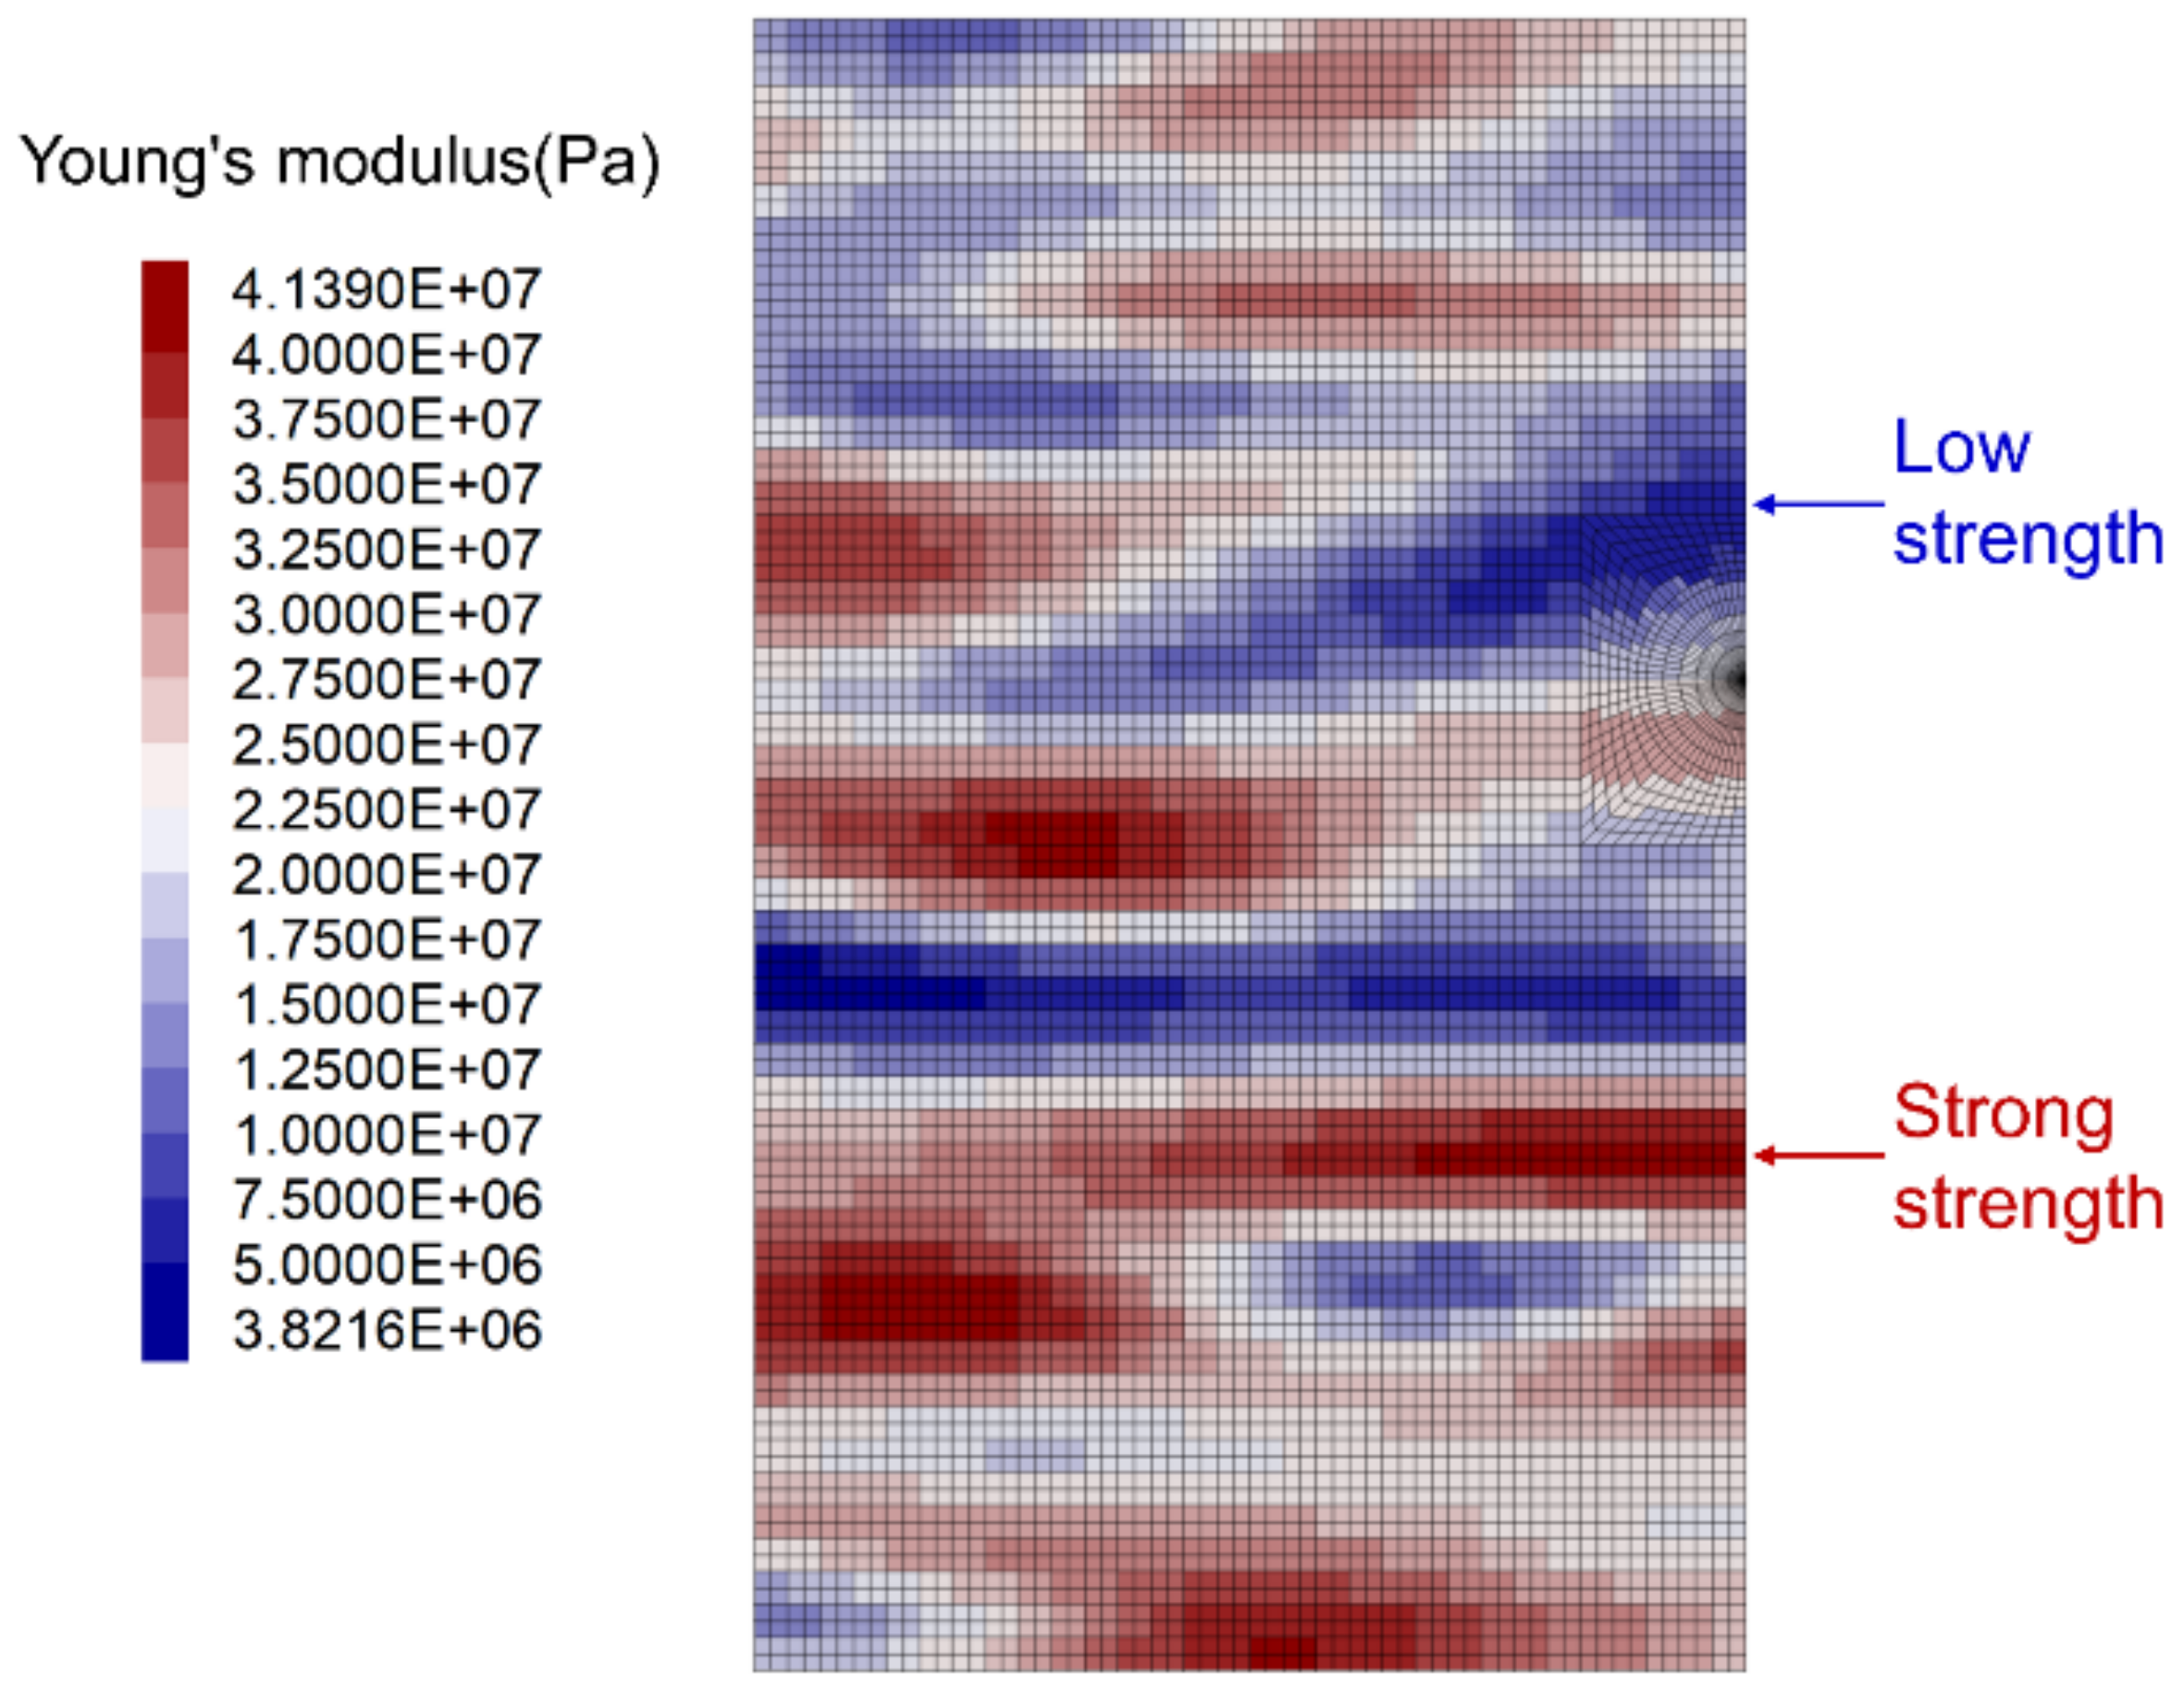
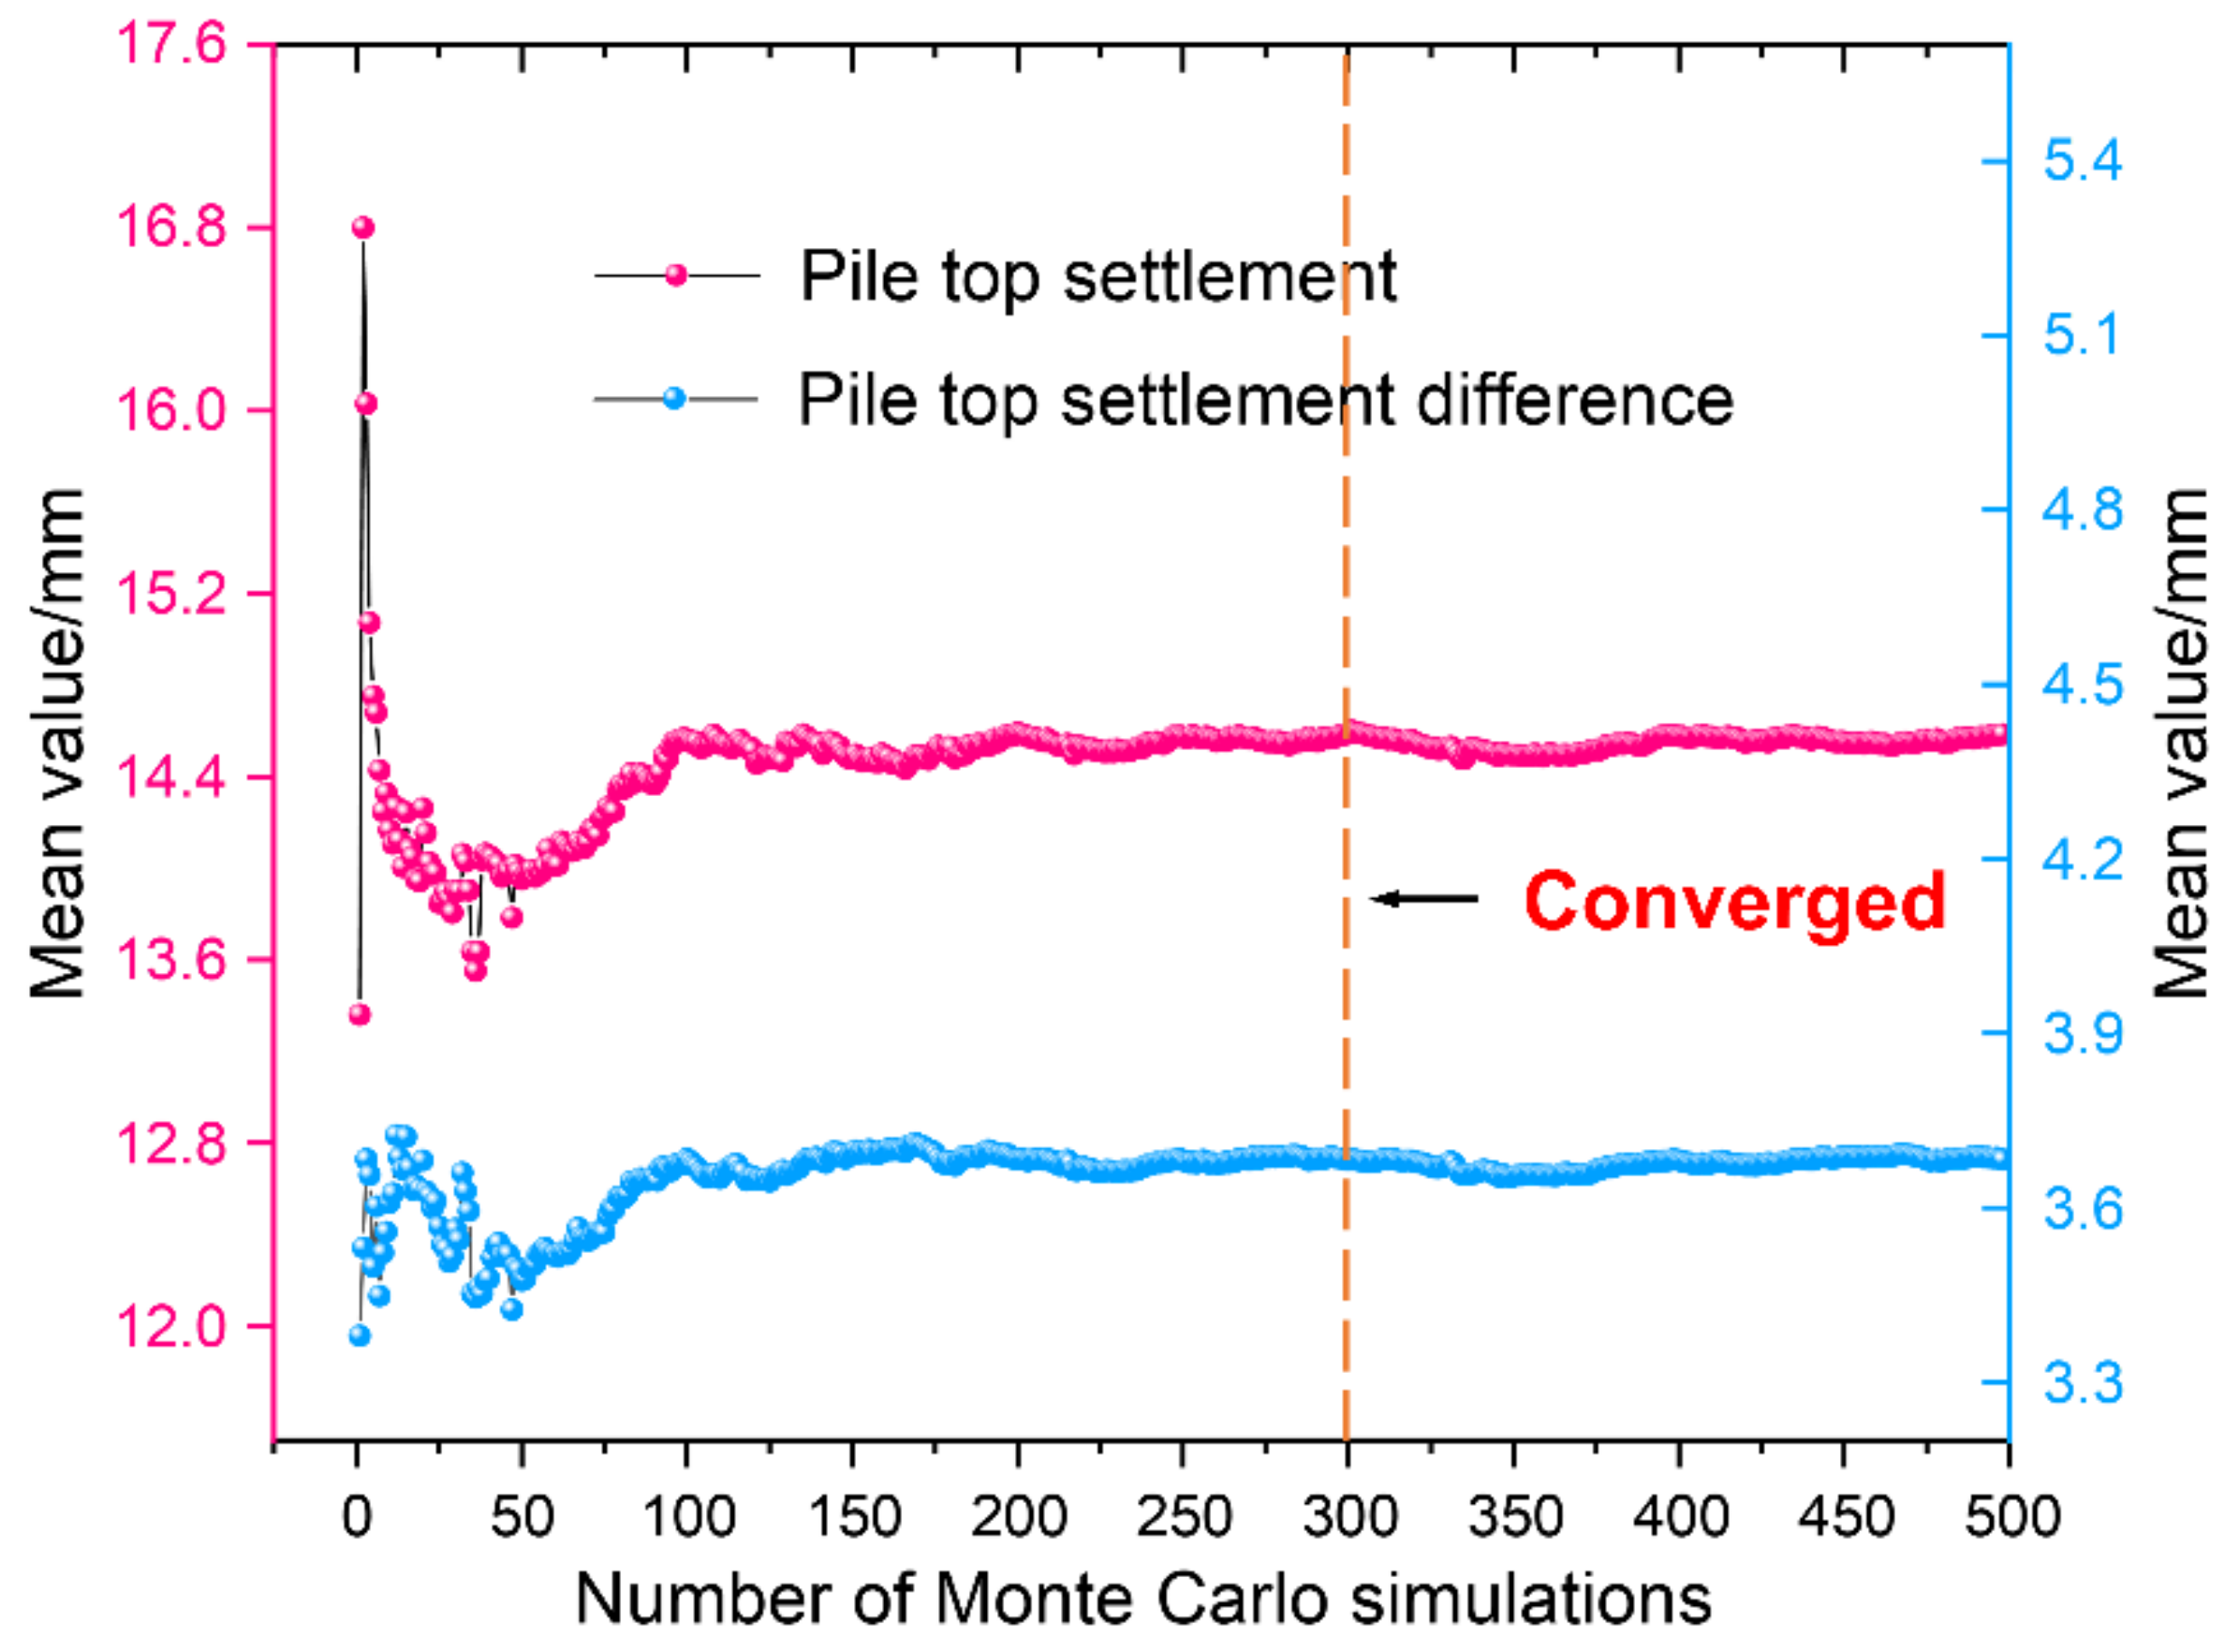
2.1. Random Field Theory (RFT) and Monte-Carlo Analysis

The properties of the soil exhibit stochasticity and spatial variation, according to the random field theory, are the soil properties at any given location which are random variables that approach a specified probability distribution. In the meanwhile, statistical features of the random field are described by the standard deviation (σln) and mean value (μln) of the log-normal function due to the stringent non-negative merit of log-normal distribution and in accordance with the statistical characteristics of soil parameters. The relevant parameters can be expressed as
σ ln = ln ( 1 + C O V 2 ) 1 / 2
μ ln = ln μ 0.5 σ ln 2
where COV represents the variation coefficient.
Correspondingly, COV, fluctuation distance (including horizontal and vertical directions) and other parameters are applied in the random field model to reflect the spatial variability of soil properties. In this study, the log-normal distribution function is introduced to describe the uncertainty of soil parameters. The autocorrelation function that satisfies the anisotropy can be expressed as [34,42,43]
ρ ln ( τ x , τ z ) = exp ( 2 τ x δ x 2 τ z δ z )
where ρlnx, τz) represents the autocorrelation coefficient of two points in the logarithmic modulus fields, indicating the strength of the correlation between two points. τx and τz are horizontal and vertical distances, respectively; in proportion, δx and δz are expressed as the horizontal and vertical of fluctuation scales.
In order to realize the accurate mapping of random field parameters in the numerical model, the authors have edited the random field generation program by Python language, applying random fields to simulate the soil spatial variability. It is integral to first discretize the soil parameters and then generate random data conforming to the log-normal distribution, mapping the random parameters to the grid in the numerical model one by one. Methods of random field simulation include the Karhunen-Loève (K-L) expansion series method [35,44,45,46], the matrix decomposition method [47], the fast Fourier transform method [48], the local average method [49], the spectral representation method [50], the Fourier series transform method [51], the loop nesting method [52] and other methods. In this paper, a matrix decomposition method is used to generate random field samples. The n-order covariance matrix C is constructed according to Equation (3), and the matrix obtained by Cholesky decomposition is positively definite symmetric. The equation can be expressed as
C = M N = M M T
where M and N are the lower triangular matrix and the upper triangular matrix, respectively, and MT is the transpose of the matrix M.
The generated column vectors Q are independent of each other and obey the standard normal distribution, and the stationary standard normal random field P is obtained by left multiplying the matrix M. Thus, the matrix P can be expressed as
P = M Q
According to Monte-Carlo strategy, substantial random field DOM files under various operating conditions are generated, then the DOM files will be imported into the numerical models with the help of the built-in IPython module of FLAC3D. In this way, the mapping of random field parameters to numerical models is realized, and plentiful Monte-Carlo stochastic analysis could be implemented.

2.2. Probabilistic Analysis Model

In addition, several studies have shown that incorporating random field theory into probability analysis and reliability assessment is constructive [47,53]. On the basis of a large number of Monte-Carlo simulations under above random processes, the resultant data is used as analysis samples to analyze the allowable value of a certain control index in the project, which can be the value including the deformation, displacement and internal force of the structure or soil. The allowable value Dl of an index is evaluated with the probability of exceeding the standard. Based on a large number of result values Dt, the function Z is established, and the failure probability Pf is imported. Accordingly, the relevant equations can be expressed as
Z = D t D l
P f = N f N a × 100 %
where Nf is the number of results greater than Dl in the samples (Z > 0), and Na is the total number of results. The failure probability Pf is solved by integral method, expressed as
P f = P Z < 0 = 0 f z Z d z = Φ μ z / σ z
Substituting reliability index β into μz/σz, and the value of β can be derived as
P f = Φ β = 1 Φ β
β = Φ 1 1 P f = Φ 1 P s
where Ps represents the effective probability.

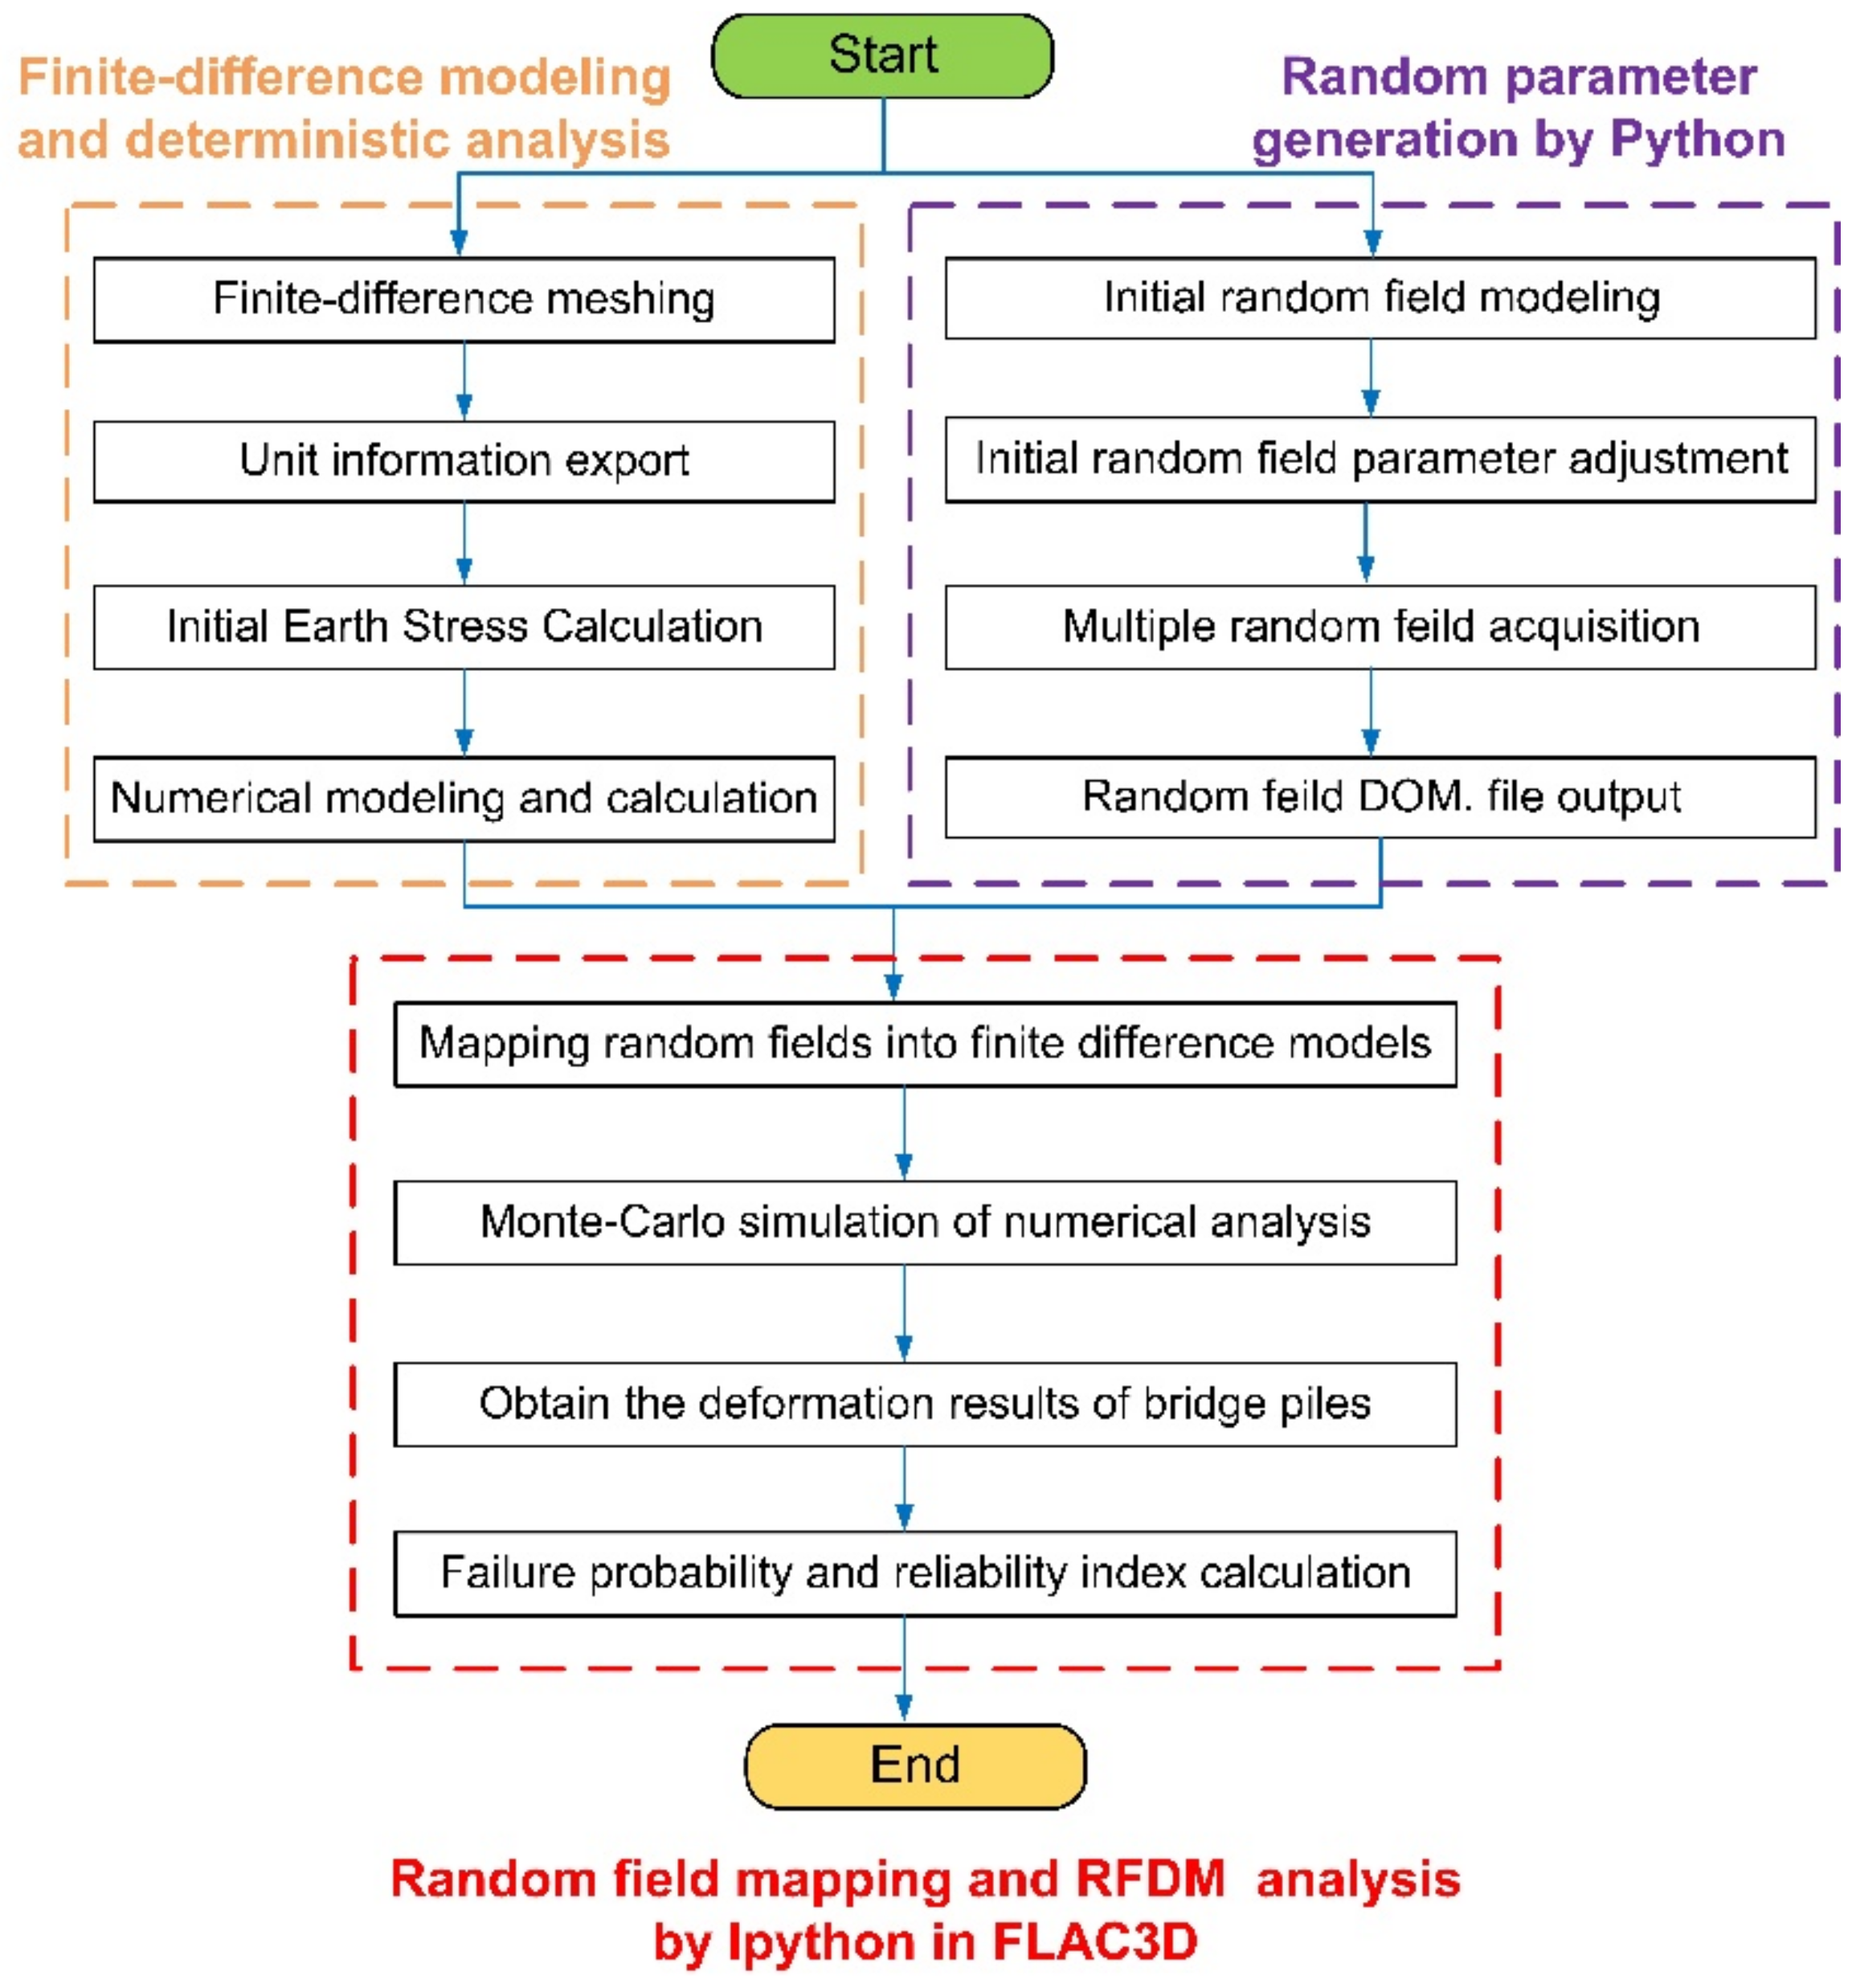
2.3. RFDM Analysis Procedure

To clearly demonstrate the whole derivation process of the proposed analytical method, a flow chart is helpful, which is presented in Figure 1.

3. Finite Difference Analysis

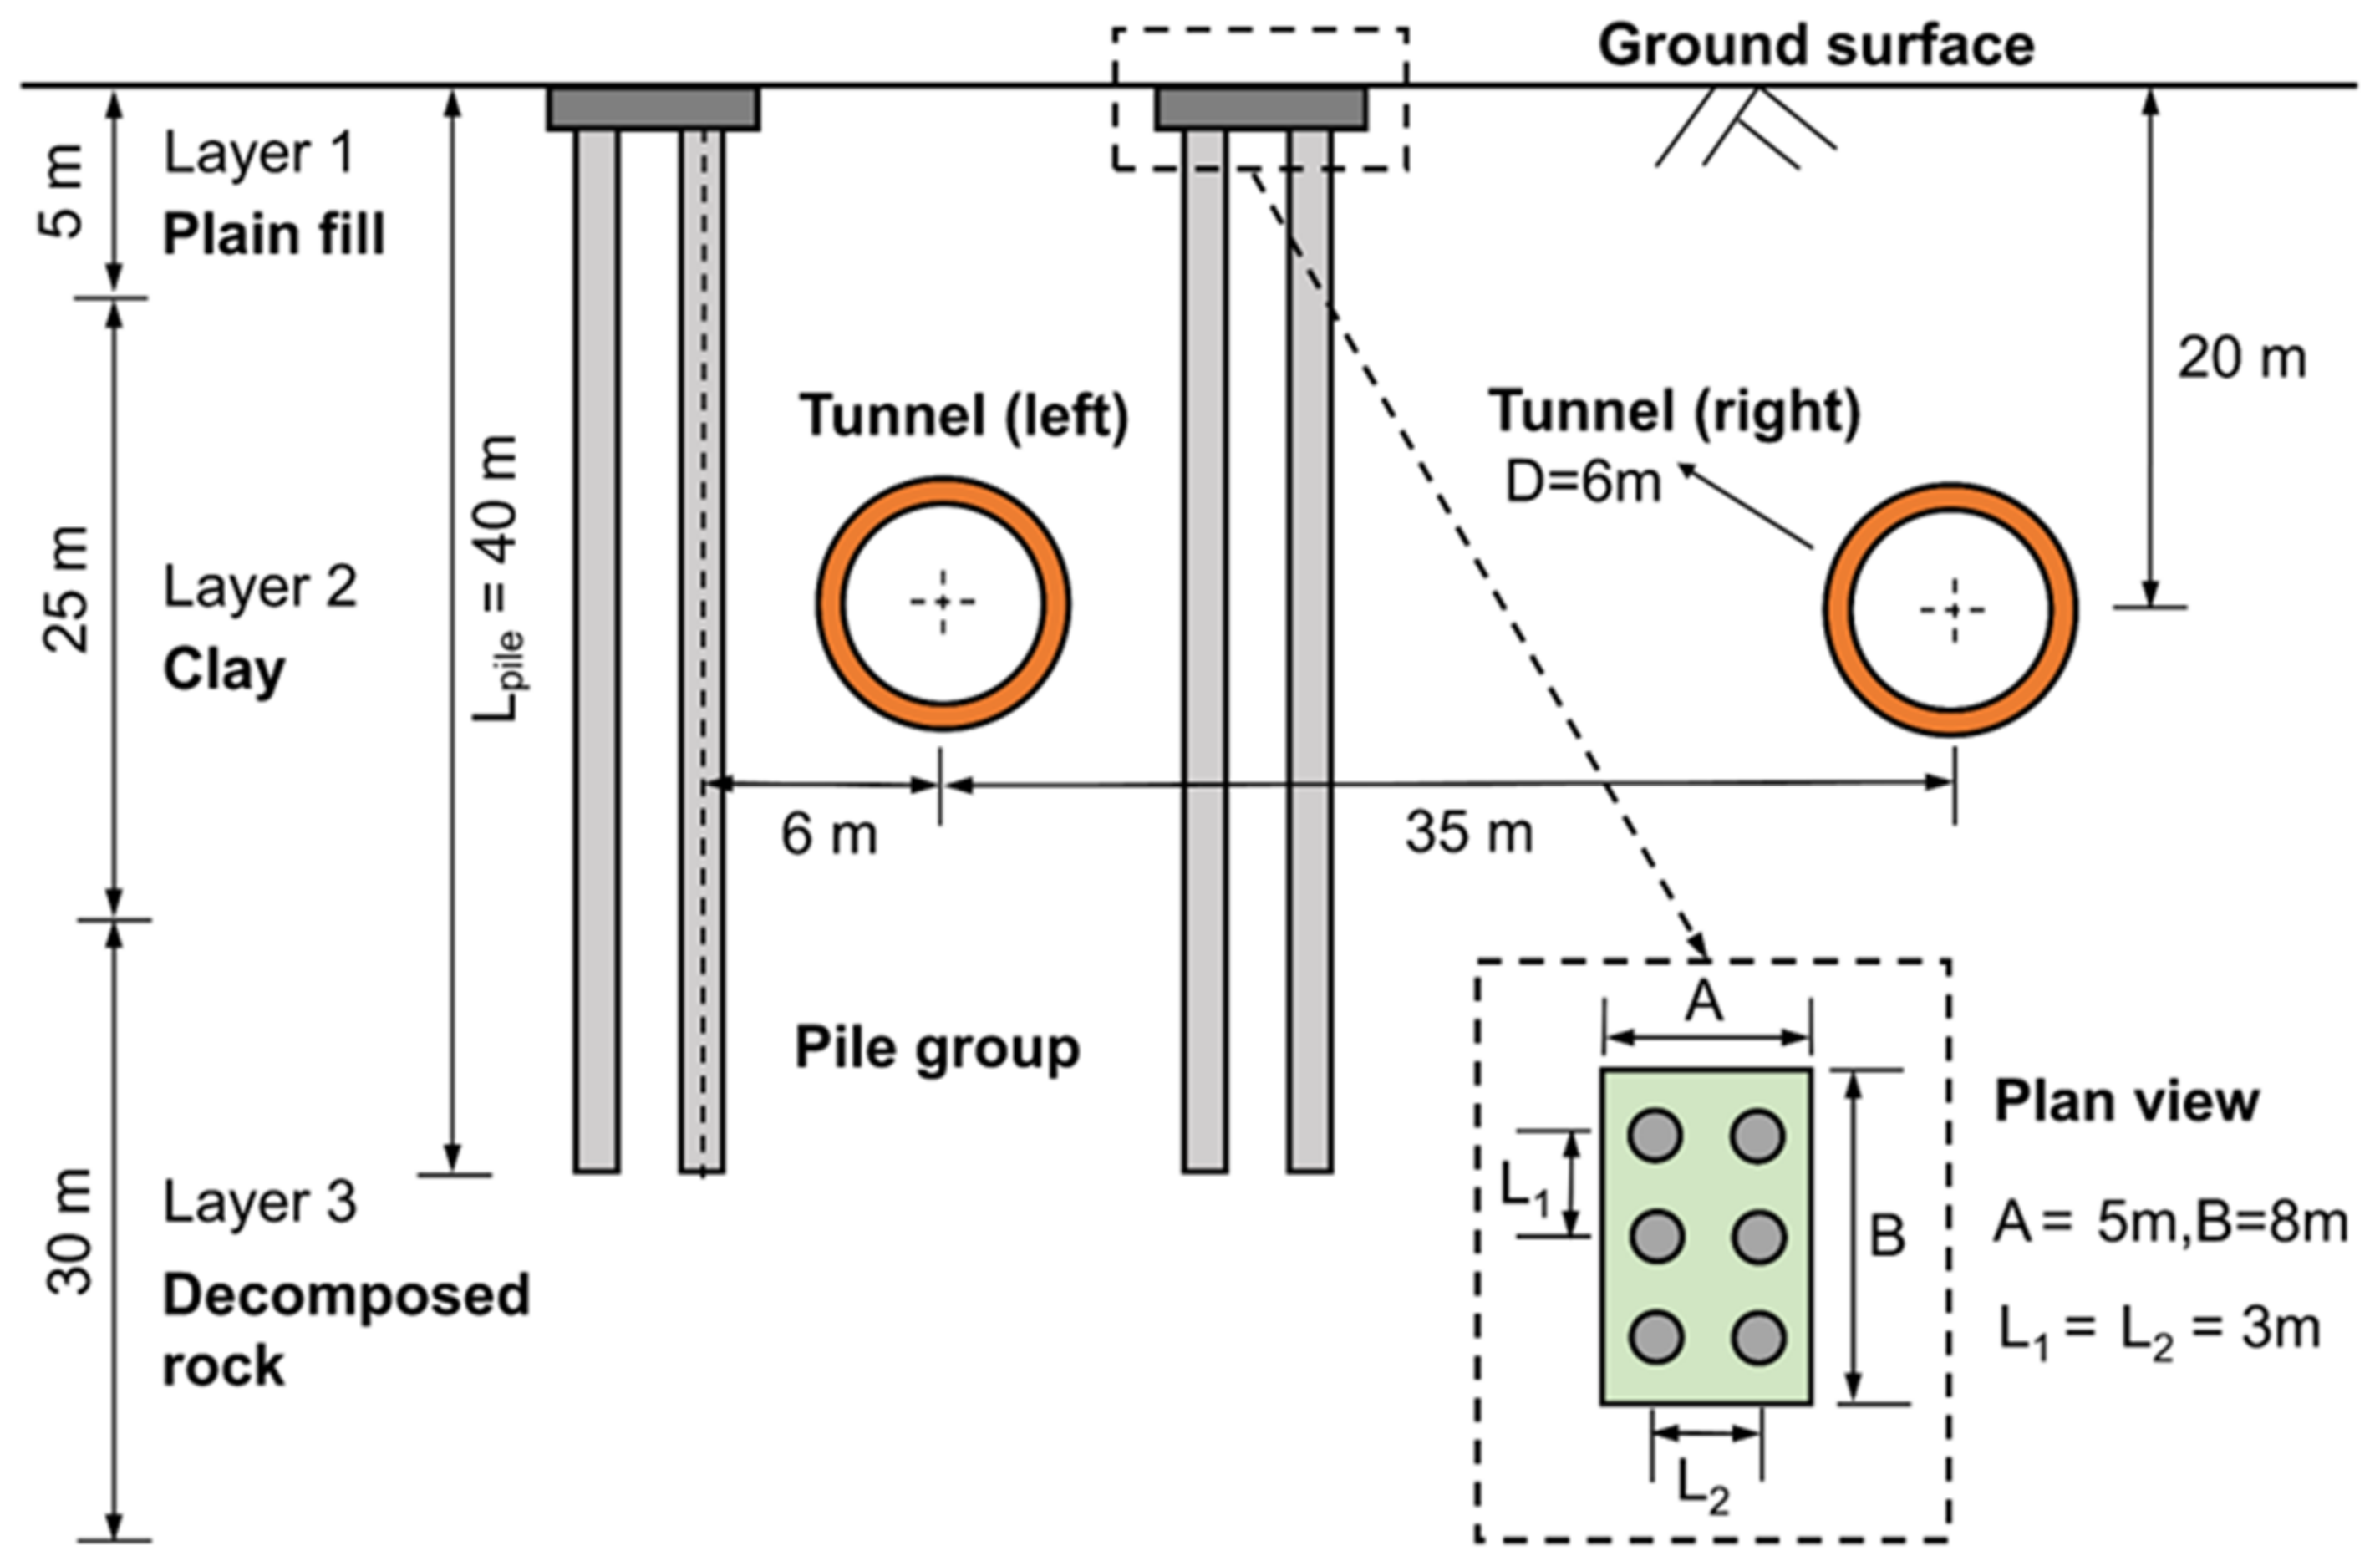
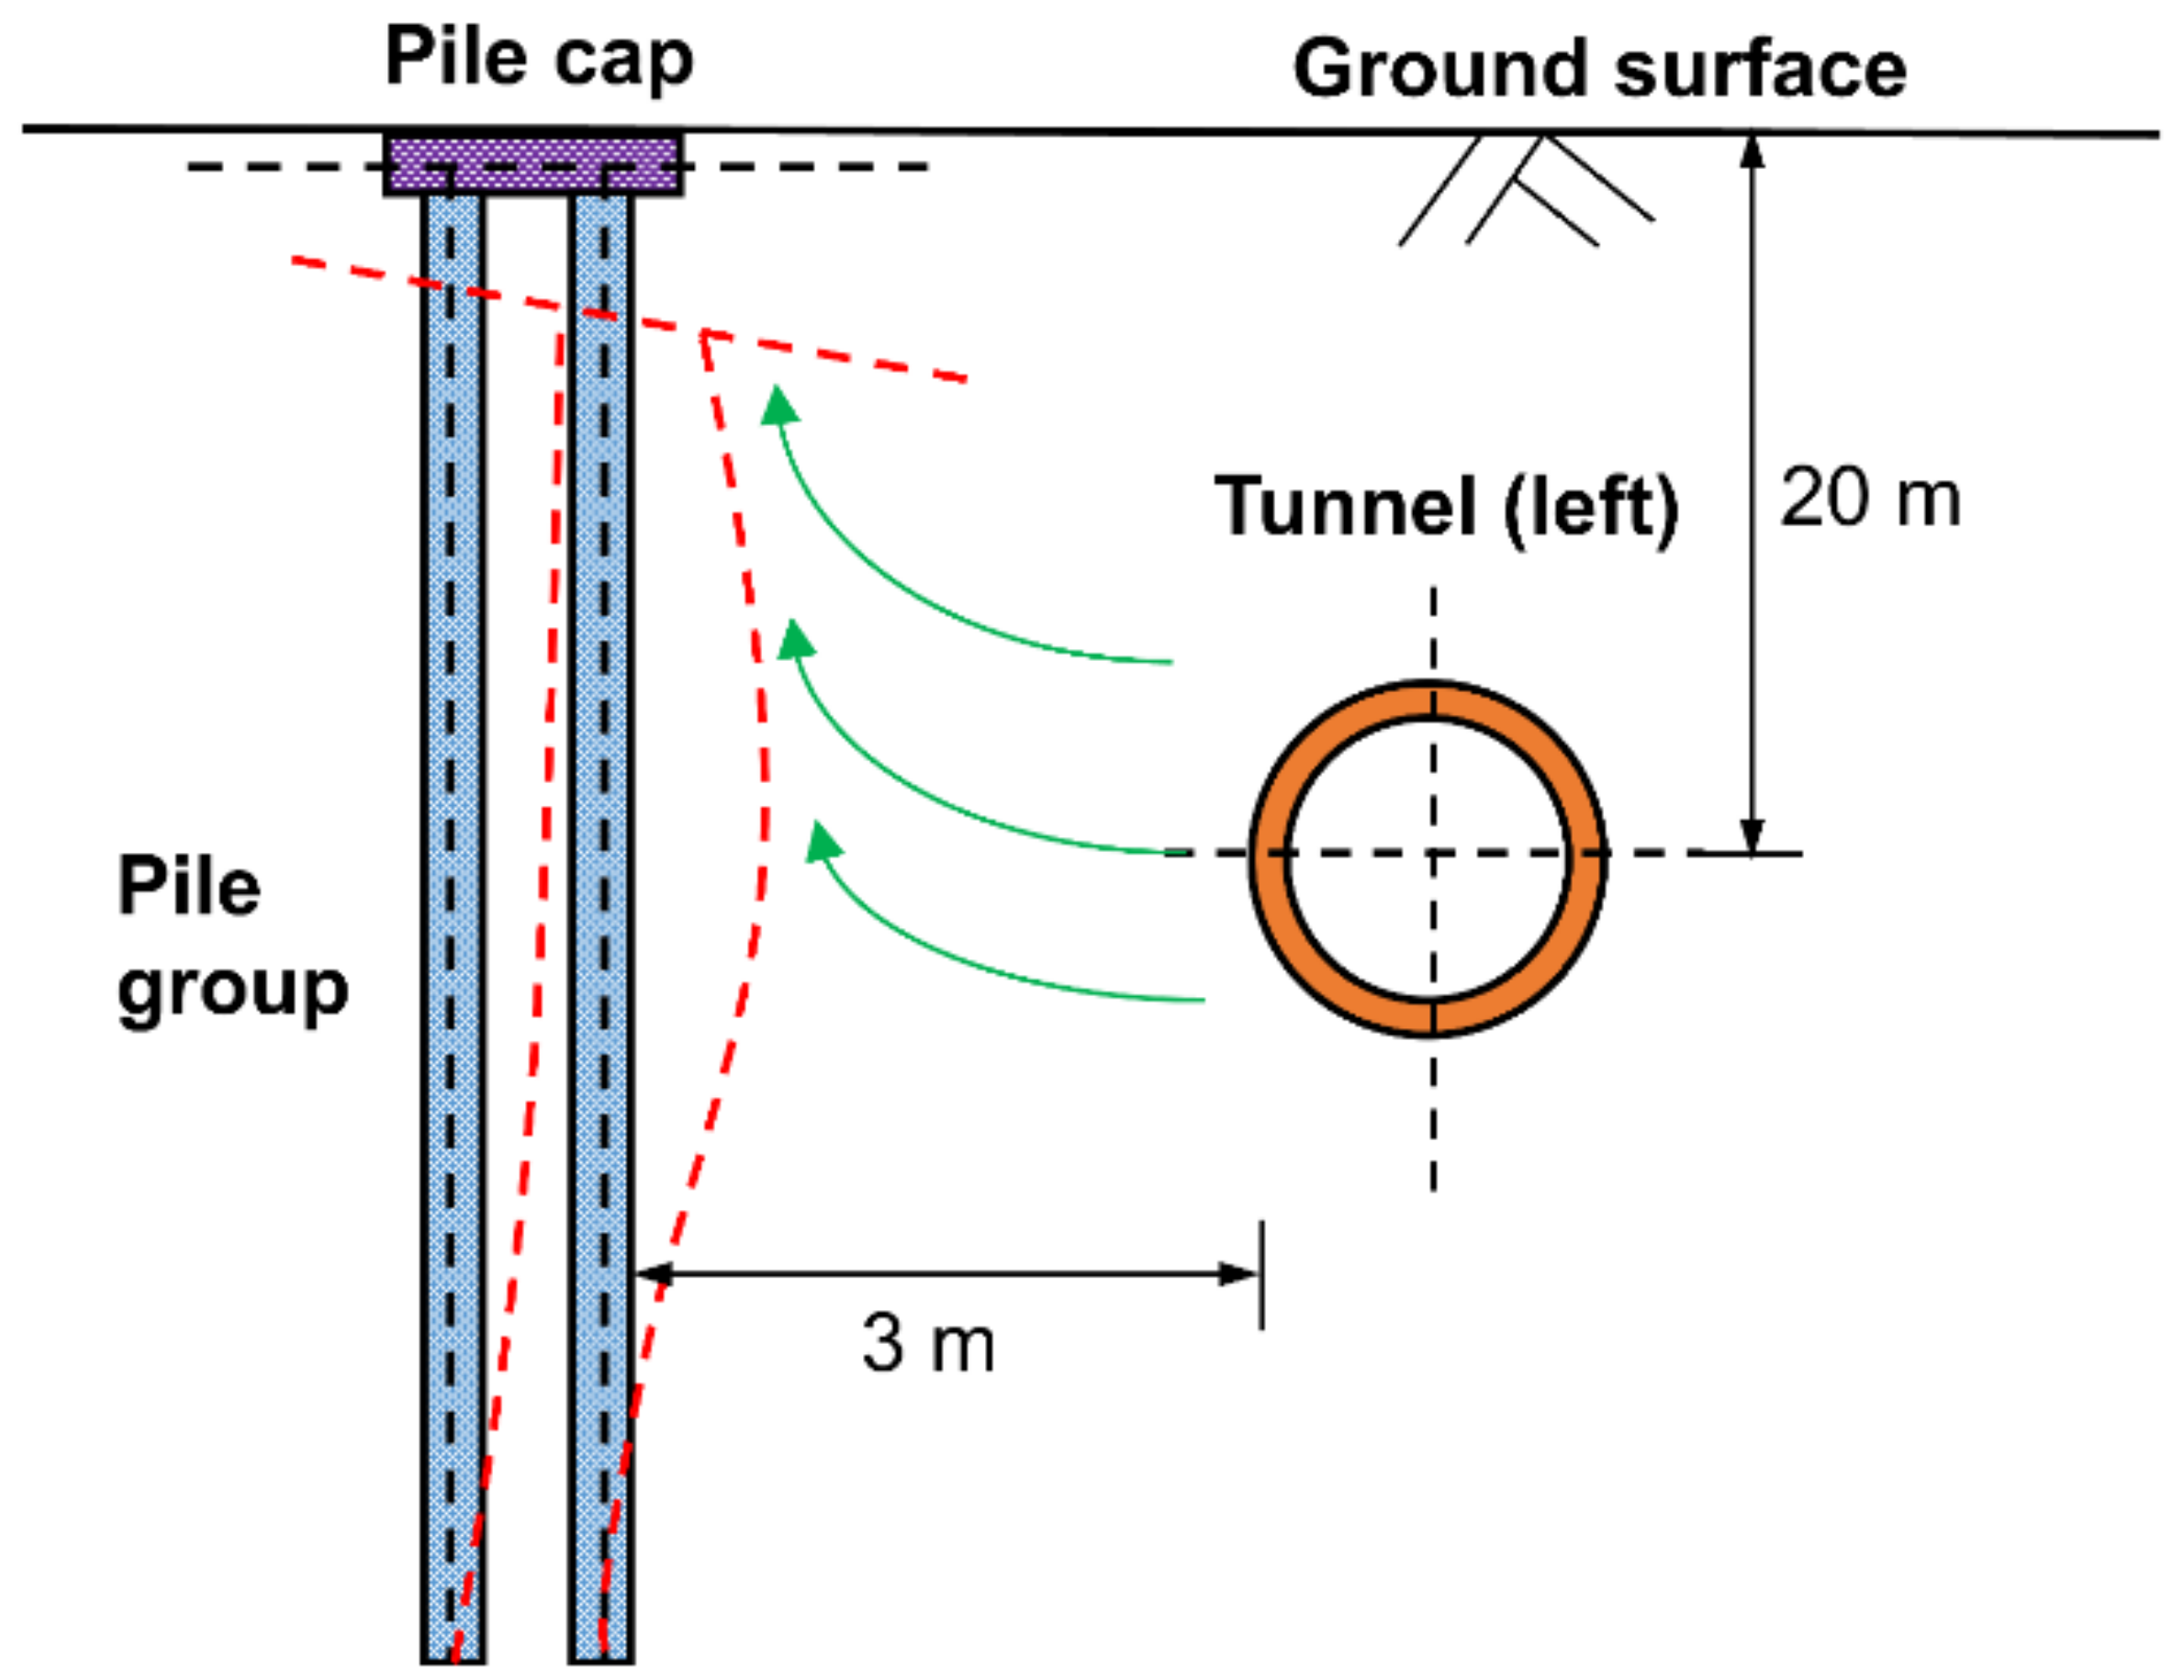
3.1. Project Overview

The case study under consideration is a twin shield tunneling machine near viaduct pile group foundation for the construction of Hefei Metro in Hefei, China. The relative location of the twin tunnels and pile groups is depicted in Figure 2. The engineering geological conditions are relatively uncomplicated, and, from top to bottom, are plain fill stratum, clay stratum, and decomposed rock stratum.
The twin tunnels (left and right tunnels) were dug to a cover depth of 20 m, and the horizontal distance between the tunnel axes of the left and right tunnels is 35 m. In addition, the dimension of the tunnel segment is 0.3 m in thickness and 1.5 m in ring width. The tunnel has an exterior diameter of 6 m and an interior diameter of 5.4 m. Aside from that, the grouting in the Tunnel Boring Machine (TBM) tail interspace is 0.3 m thick. The piling foundation consists of six one-meter-diameter by forty-meter-long bored concrete piles. The distance between the axis of two adjacent piles is 3 m, distributed in the midst of the pile cap, which has a size of 8 × 5 × 0.5 m (i.e., length × width × thickness). As depicted in Figure 2, the left tunnel, sited in the center of the twin pile groups, is only clear 3 m away from the pile groups, hence settlement and deformation of bridge pile foundation attracts intensive attention. The top viaduct pier has suffered significantly as a result of differential settling and lateral displacement of bridge pile groups.

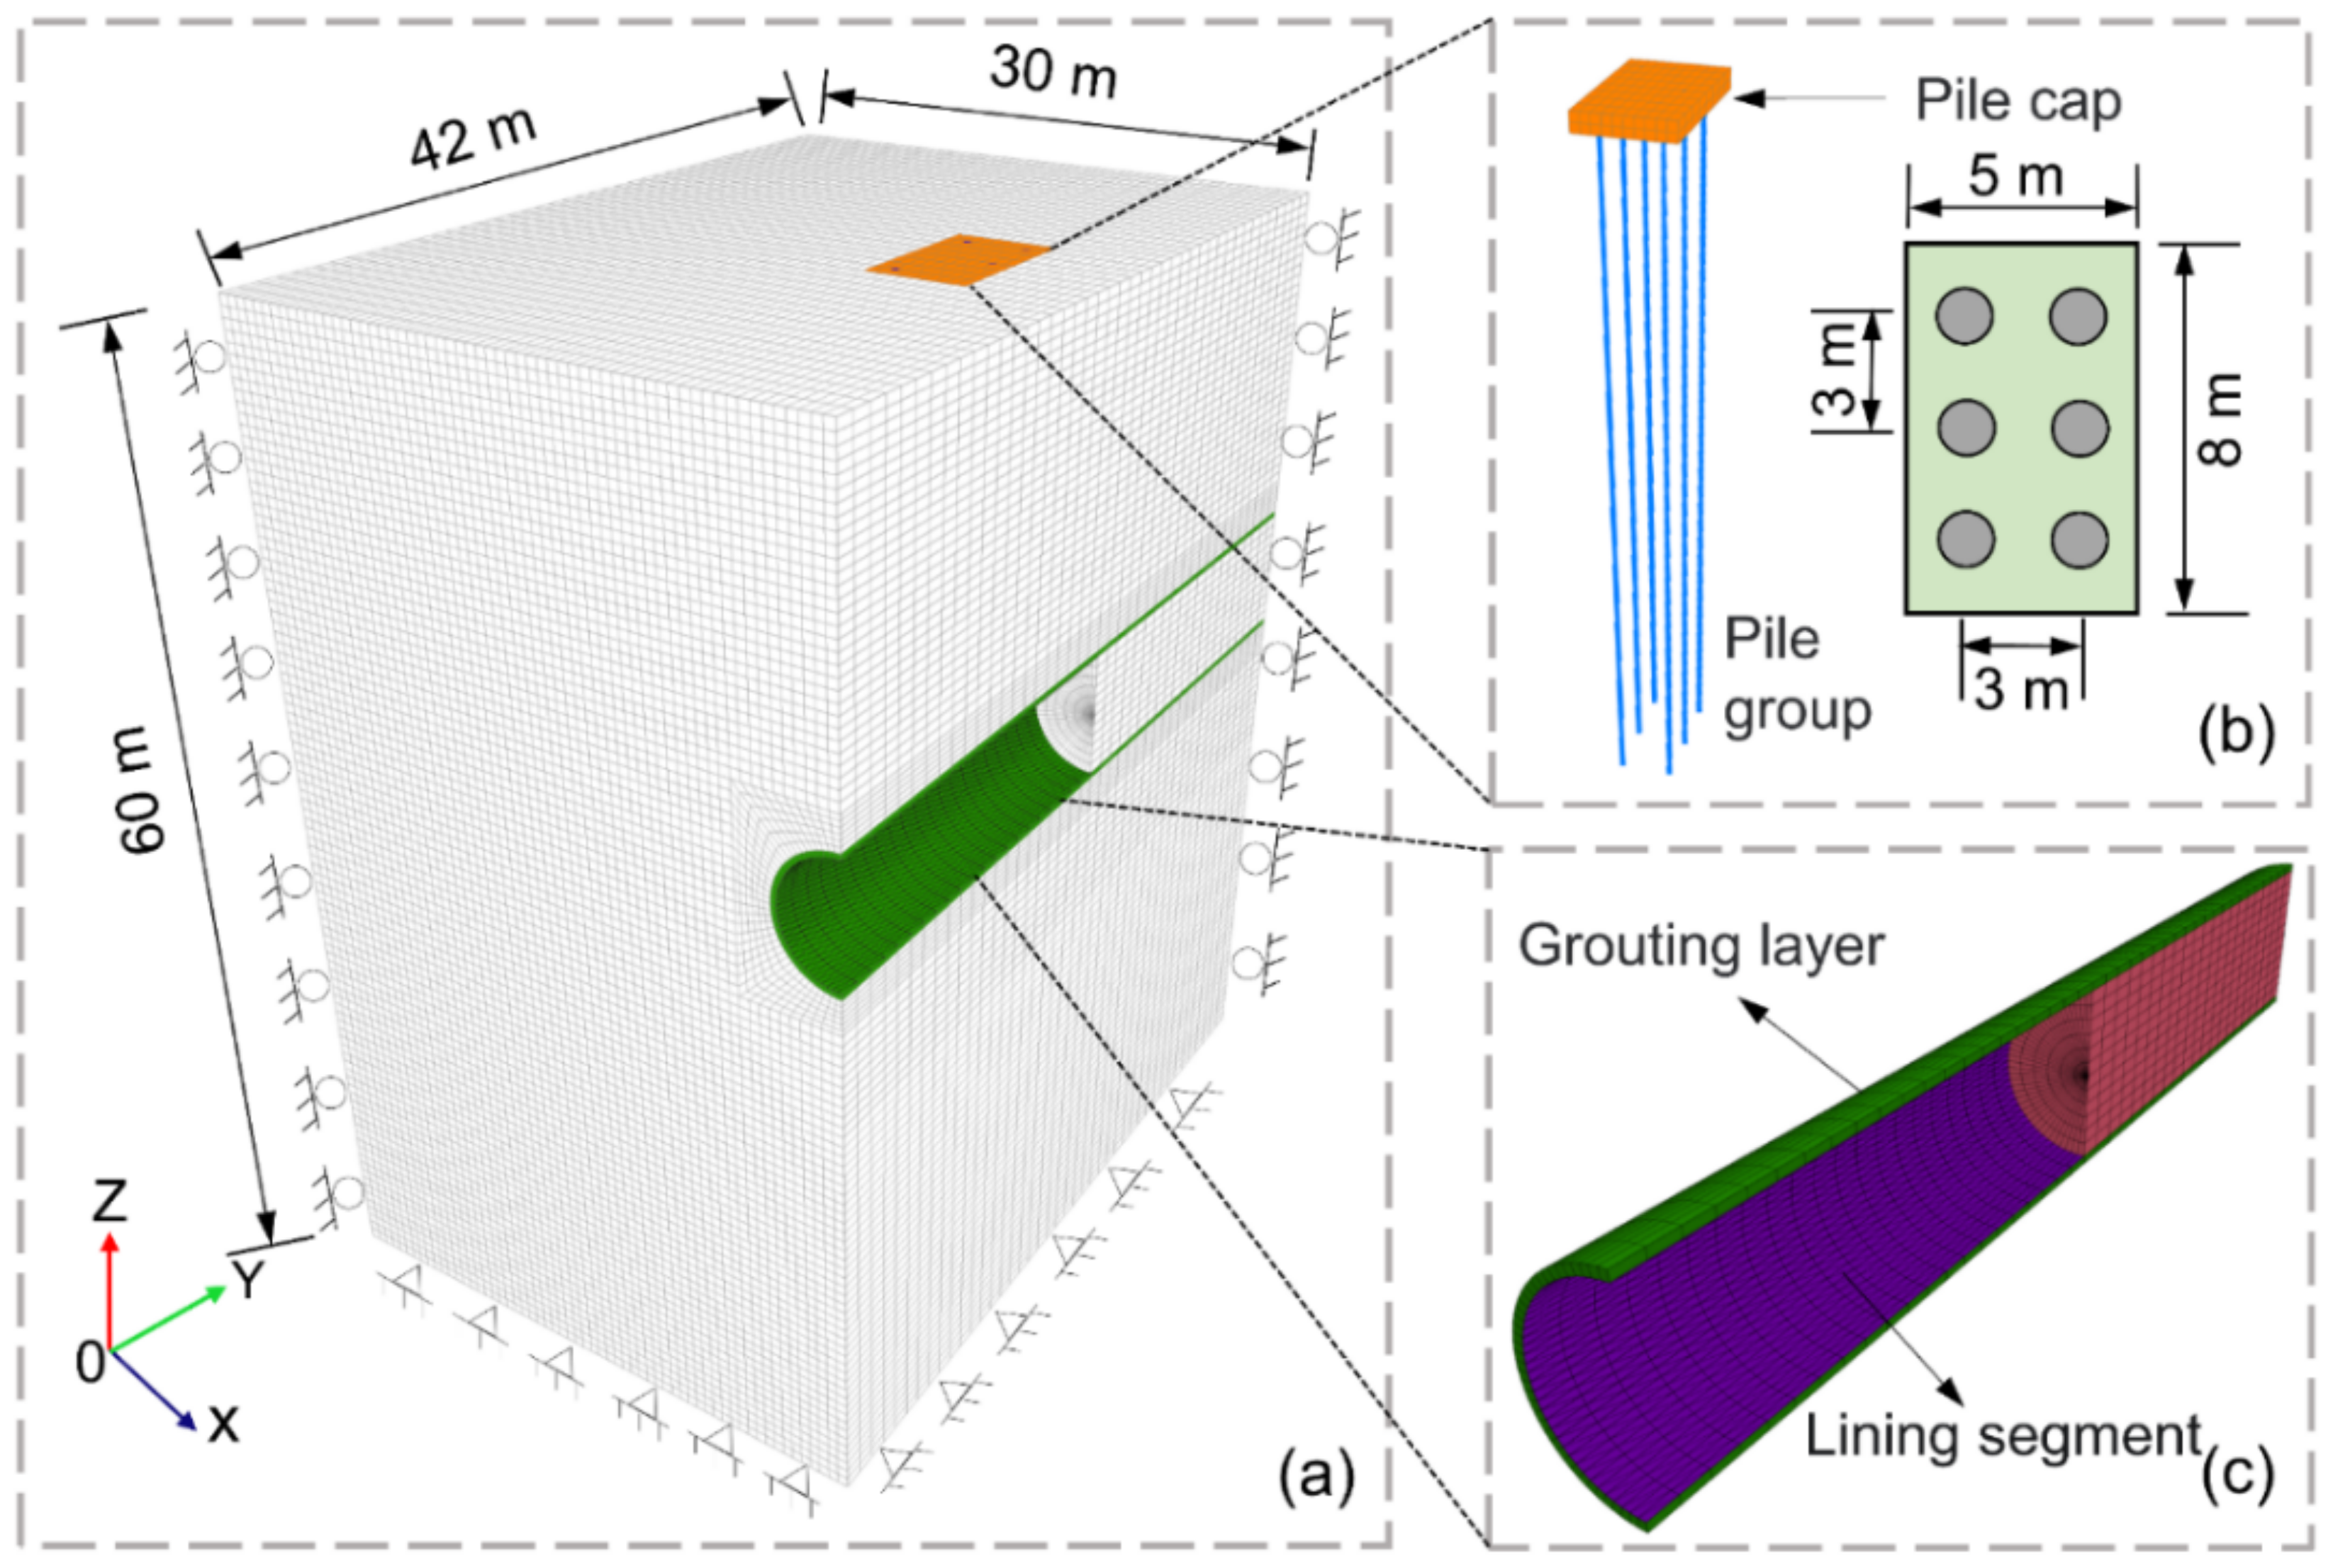
3.2. Numerical Modeling

This section establishes a three-dimensional simulation model in Fast Lagrangian Analysis software (FLAC3D, ITASCA, Minneapolis, MN, USA), providing a more efficient way of solving the geotechnical engineering problems. FLAC3D is based on the finite difference approach, in addition to the discrete model method and the dynamic solution method. The laws of motion of a continuous unity are converted into the discrete version of Newton’s laws at the nodes using these methods, and the resultant system of ordinary differential equations is solved numerically using the explicit finite difference technique in time. Additionally, FLAC3D has been used in many tunneling-by-shield tunnel projects and proved to be highly accurate and reliable [54,55].
In the actual construction, the twin tunnels penetrate through both sides of the bridge piles. In particular, the horizontal distance between the two tunnels is approximately 35 m, and the distance between the left-line tunnel and the pile group has been shortened to 22 m, which has minimal effect on the pile group foundation during tunnel excavation. Considering the parameters, this study disregards the influence of the model’s right-line tunnel building procedure. Since the left-line tunnel is sited in the center of the bridge piles on both sides, the disturbance to the surrounding stratum and pile foundations during tunnel excavation can be regarded as symmetrical, and the stress and deformation of the pile group is consistent, which has been successfully applied in many simplified modeling cases [43,56,57,58]. Therefore, only half of the pile-tunnel model needs to be established, which could save a significant amount of time for subsequent Monte-Carlo analysis without affecting the research results.
In general, the groundwater level affects the mechanical properties of soil and consequently, the stress and strain distribution of an already existing pile foundation. However, the groundwater level generally fluctuates within a relatively fixed depth range, and the variability of hydraulic gradient and pore water pressure is minimal. This study focuses on the influence of soil parameter variability on the existing pile foundation under disturbed construction. Taking the water factor into consideration in this numerical model enhances the complexity of the study and is of little significance. Consequently, the influence of water is disregarded in the simulation, and the geographic diversity of stratums is emphasized.
Figure 3 presents the meshing of the FLAC3D-based numerical model. A spatial model size of 30 × 42 × 60 m (i.e., x × y × z) is selected for the purpose of minimizing the potential boundary effects. The boundary conditions were fixed for the base surface and rollered for the vertical surfaces. Solid elements are adopted here to mesh the soil stratums, the pile cap, and the grouting layer. The shield segments and pile groups are modeled with shell elements and pile elements, respectively.
As clearly shown in Table 1, the constitutive behaviors of geomaterials (i.e., plain fill, clay, and decomposed rock) are described by Mohr–Coulomb models with different parameters. As for artificial materials, including pile caps and tunnel grouting layers, an elastic constitutive is assigned. Isotropic properties are assigned to structural components like pile groups and tunnel segments. As the spacing between concrete group piles is often rather small, it is possible that a more accurate simulation of the mechanical behavior of the piles and soil can be achieved by employing solid components. Tests on the model suggest that under comparison modeling, the difference in calculation results between the solid elements and structural elements used in the model is negligible.

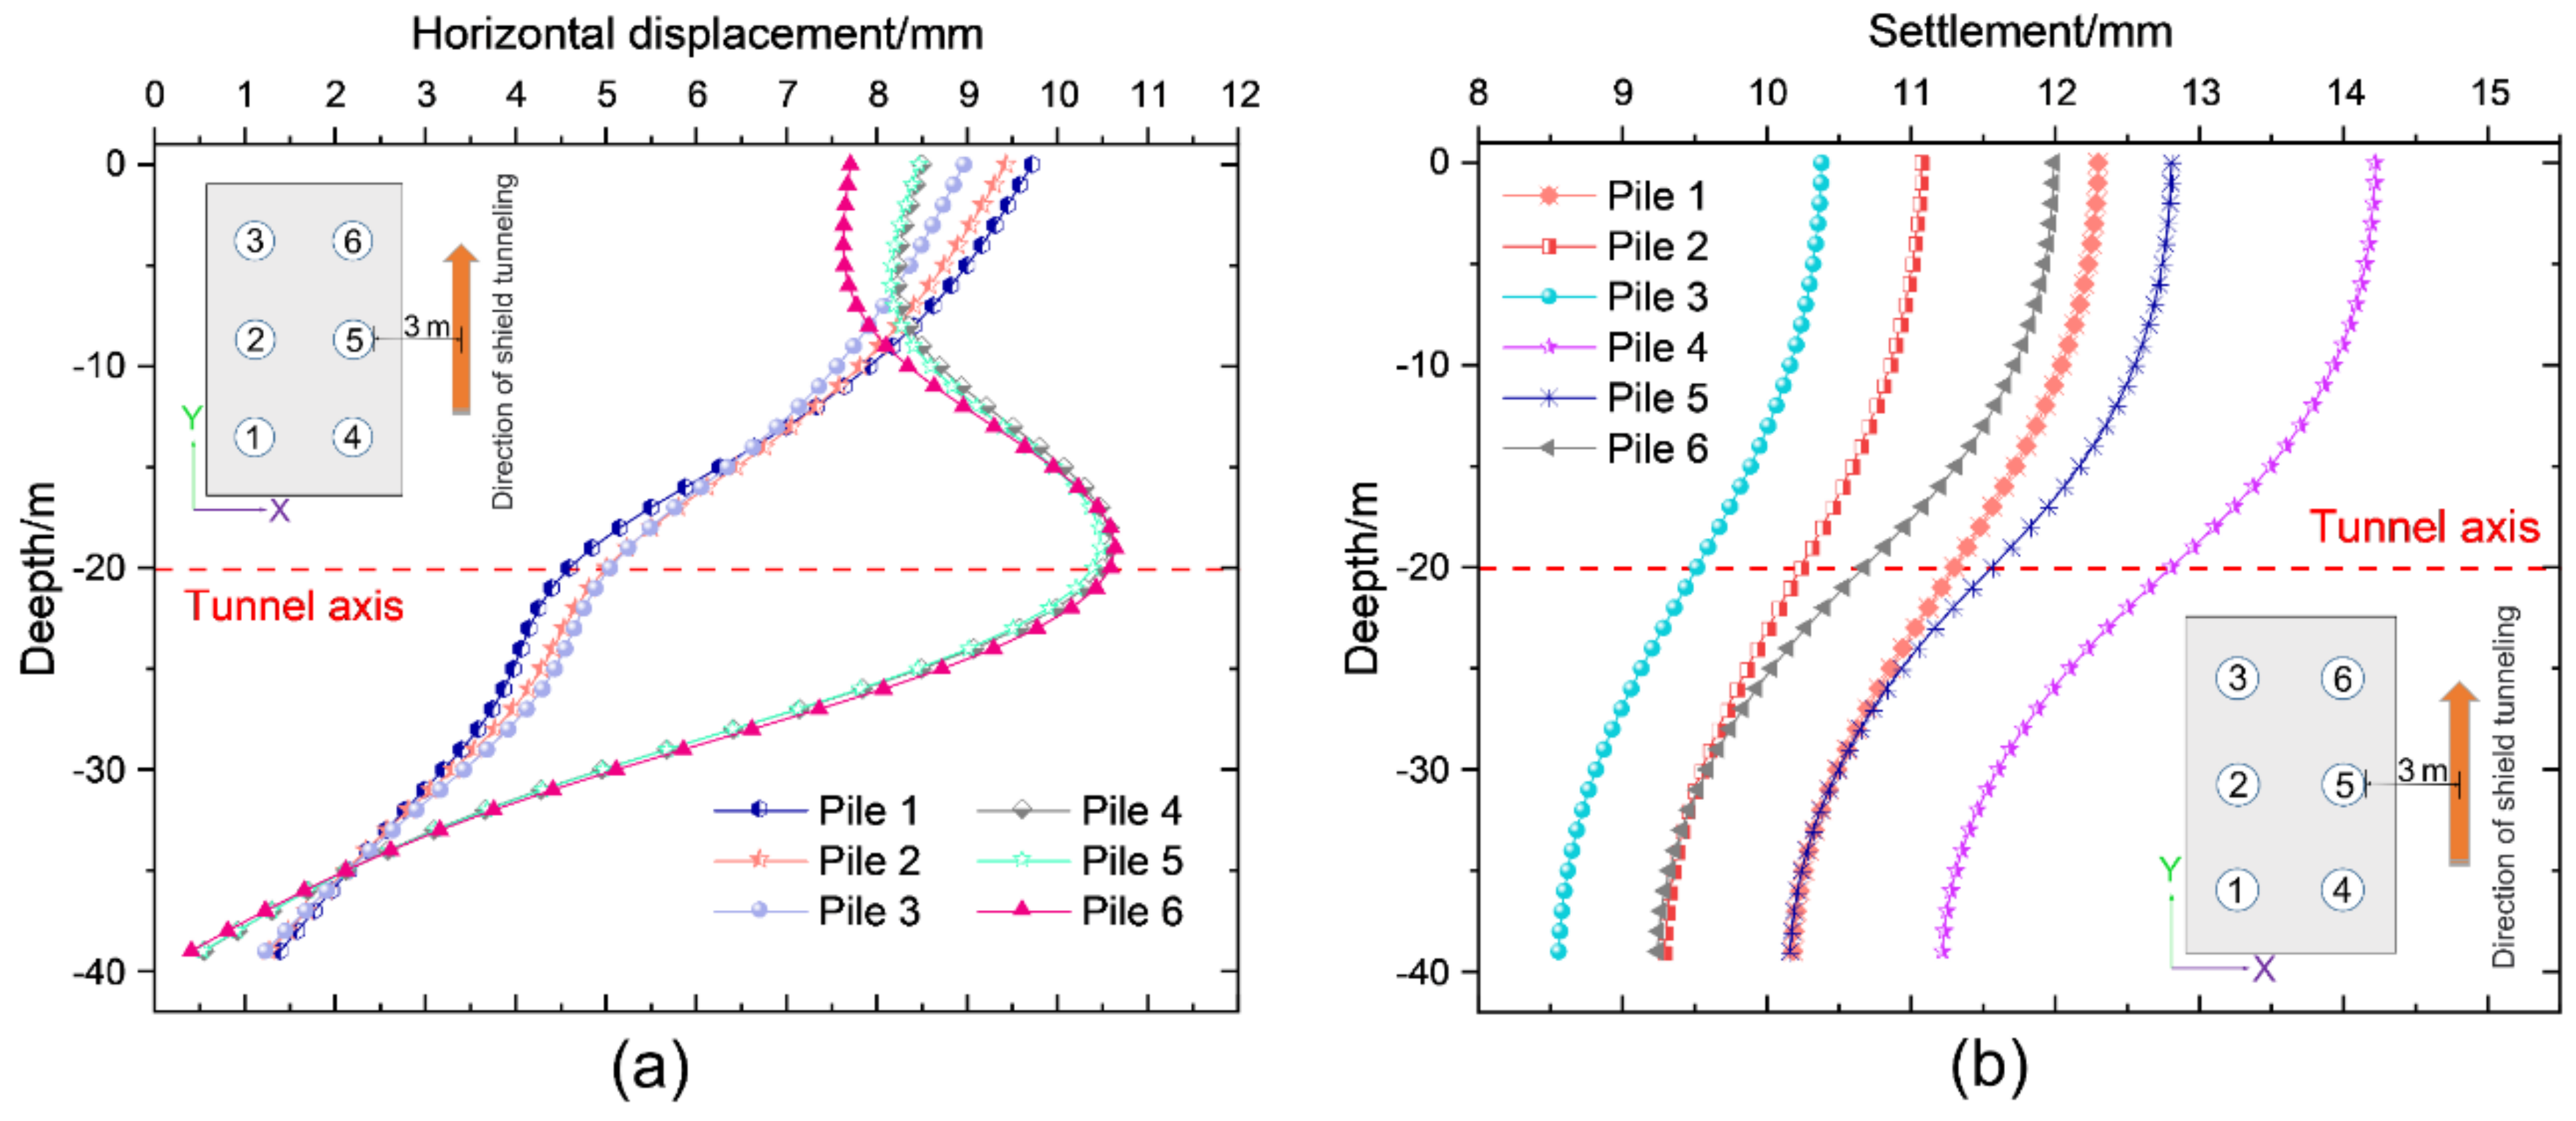
3.3. Deterministic Analysis Results

Considering the project geology as a homogeneous stratum, the shield excavation is calculated according to the above model and parameter settings. The calculated displacement of 6 piles is revealed in Figure 4. Among them, Pile 4, Pile 5 and Pile 6 are close to the tunnel with a net distance of about 3 m, while the other three are located far from the tunnel side. In addition, the tunneling excavation direction of the shield machine is from Pile 4 to Pile 6. It could be observed that the piles closer to the tunnel are greatly affected by the shield construction, and their horizontal displacement and vertical settlement is larger than those far from the tunnel.
In the horizontal displacement caused by neighboring tunnel excavation, the pile foundations take on various properties. The greatest horizontal displacement of the piles (Pile 4, 5, 6) near the tunnel is located along the tunnel axis. In contrast to piles closer to the tunnel, the horizontal displacement of the top of the piles (Pile 1, 2, 3) distant from the tunnel side has a maximum value of roughly 9.5 mm and falls along the depth direction of the pile body. Similarly, the horizontal displacement at the piles’ bottoms is all near to zero.
In addition, the vertical displacement of the piles is strongly connected to their distance from the tunnel, with what seems to be a negative connection between the pile top settlement and the distance from the tunnel. According to the settlement curve of the piles, it can be concluded that the settlement of the pile body is the overall settlement of the piles, mainly manifested in the friction and sliding between the piles and the surrounding soil. As a result, the pile’s compressibility is quite low, with only a settling difference of around 2 mm between the pile’s top and bottom.
Engineers and scholars emphasize the influence of the bridge piles deformation induced by the adjacent tunneling process. According to the data above, Pile 4’s horizontal displacement (8.50 mm) and pile top settlement (14.22 mm) are the largest since it is the closest to the tunnel. Pile 3 is the farthest from the tunnel, hence its displacement is expressed as the smallest. The settlement difference between Pile 3 and Pile 4 is the maximum of 3.84 mm. Figure 5 provides a detailed description of the deformation trend and pattern of pile groups and pile caps based on numerical calculation results. As the piles supporting a bridge are normally buried in the ground, the movement of the piers is usually solely monitored for safety purposes. According to automatic monitoring data collected on the construction site, the maximum settlement value of the bridge pier observed during the tunnel construction period is about 12 mm, the maximum lateral displacement is about 6 mm and the inclined settlement of the bridge pier is around 3 mm. This monitoring result is consistent with the pile deformation in this numerical simulation, which has a deviation within 20% between them, primely proving the accuracy of the finite difference model. Nevertheless, the reasons for the 20% bias between numerical calculation and field monitoring deserve deeper investigation and reflection. One important factor is that the spatial variability of geological parameters has not been adequately accounted for in the numerical model, which will be addressed in the following sections. Under the influence of the pile group foundation deformation, the upper pier would incline toward the tunnel. On the condition that the pile group’s absolute or differential settlement exceeds a certain limit, the pier abutment may have excessive settlement and inclination, and the consequences are unacceptable and unforgivable.

4. Random Parameter Analysis

4.1. Settings of RFDM Analysis

The deformation of pile foundation is not only relevant to the adjacent construction disturbance conditions, but also directly correlative to the formation parameters. Based on the random field theory and the Monte-Carlo strategy, this study maps the random field model of soil parameters into the finite difference model and carries out massive random modeling analysis. The random finite difference model generated at one time is revealed in Figure 6.
The stratum deformation induced by construction disturbance mainly depends on the deformation parameters, including Young’s modulus, cohesive force and Poisson’s ratio. He et al. [59] found that the pile deformation under adjacent tunnel excavation is greatest affected by the soil in Young’s modulus. As a result, it is of great significance to study the variability of the soil in Young’s modulus for the pile foundation deformation under the adjacent tunnel excavation. This research exclusively investigates the influence of the spatial variability of the soil in Young’s modulus on the pile foundation deformation, ignoring the spatial variability of other soil deformation and strength factors. The parameter settings of other geotechnical materials (i.e., plain fill, clay and decomposed rock) and artificial materials (i.e., piles, pile cap and grouting) in the model are all accordant with parameters in deterministic modeling.
In light of the special engineering characteristics of the pile foundation deformation disturbed by the tunnel excavation in this study, it is also essential to investigate the influence of the stratum variation range. The following will evaluate the sensitivity and influence patterns of soil in Young’s modulus spatial variability on adjacent pile group foundations induced by shield tunnel excavation from four aspects: soil variation range, variation coefficient (COV), horizontal fluctuation distance (δx) and vertical fluctuation distance (δz).
For stochastic analysis, the simulation number of random models should be firstly determined to obtain a converged result. If the number of runs is limited, an event with a small probability may not occur in a Monte-Carlo simulation, and may result in a major error of the confidence level in a failure probability assessment [60,61]. Conversely, the computational efficiency will be unacceptable if the number of runs is too large. Therefore, a suitable number should be optimized from the point of the required accuracy and efficiency [22]. Before the formal Monte-Carlo operation, the authors conducted a rigorous trial calculation on vast quantities of simulation times. The selected case is COV = 0.5, δx = 12 m and δz = 3 m, which could characterize most of the random field operating conditions. In addition, the influence of run number on the variations of calculated mean values of Pile 4 absolute settlement and differential settlement between Pile 3 and Pile 4 is depicted in Figure 7. It can be clearly observed that the variation of mean tends to be stable and converged with a value larger than 300. Therefore, 300 runs are suitable for the subsequent RFDM analysis and can well satisfy the requirements of calculation accuracy in this paper.

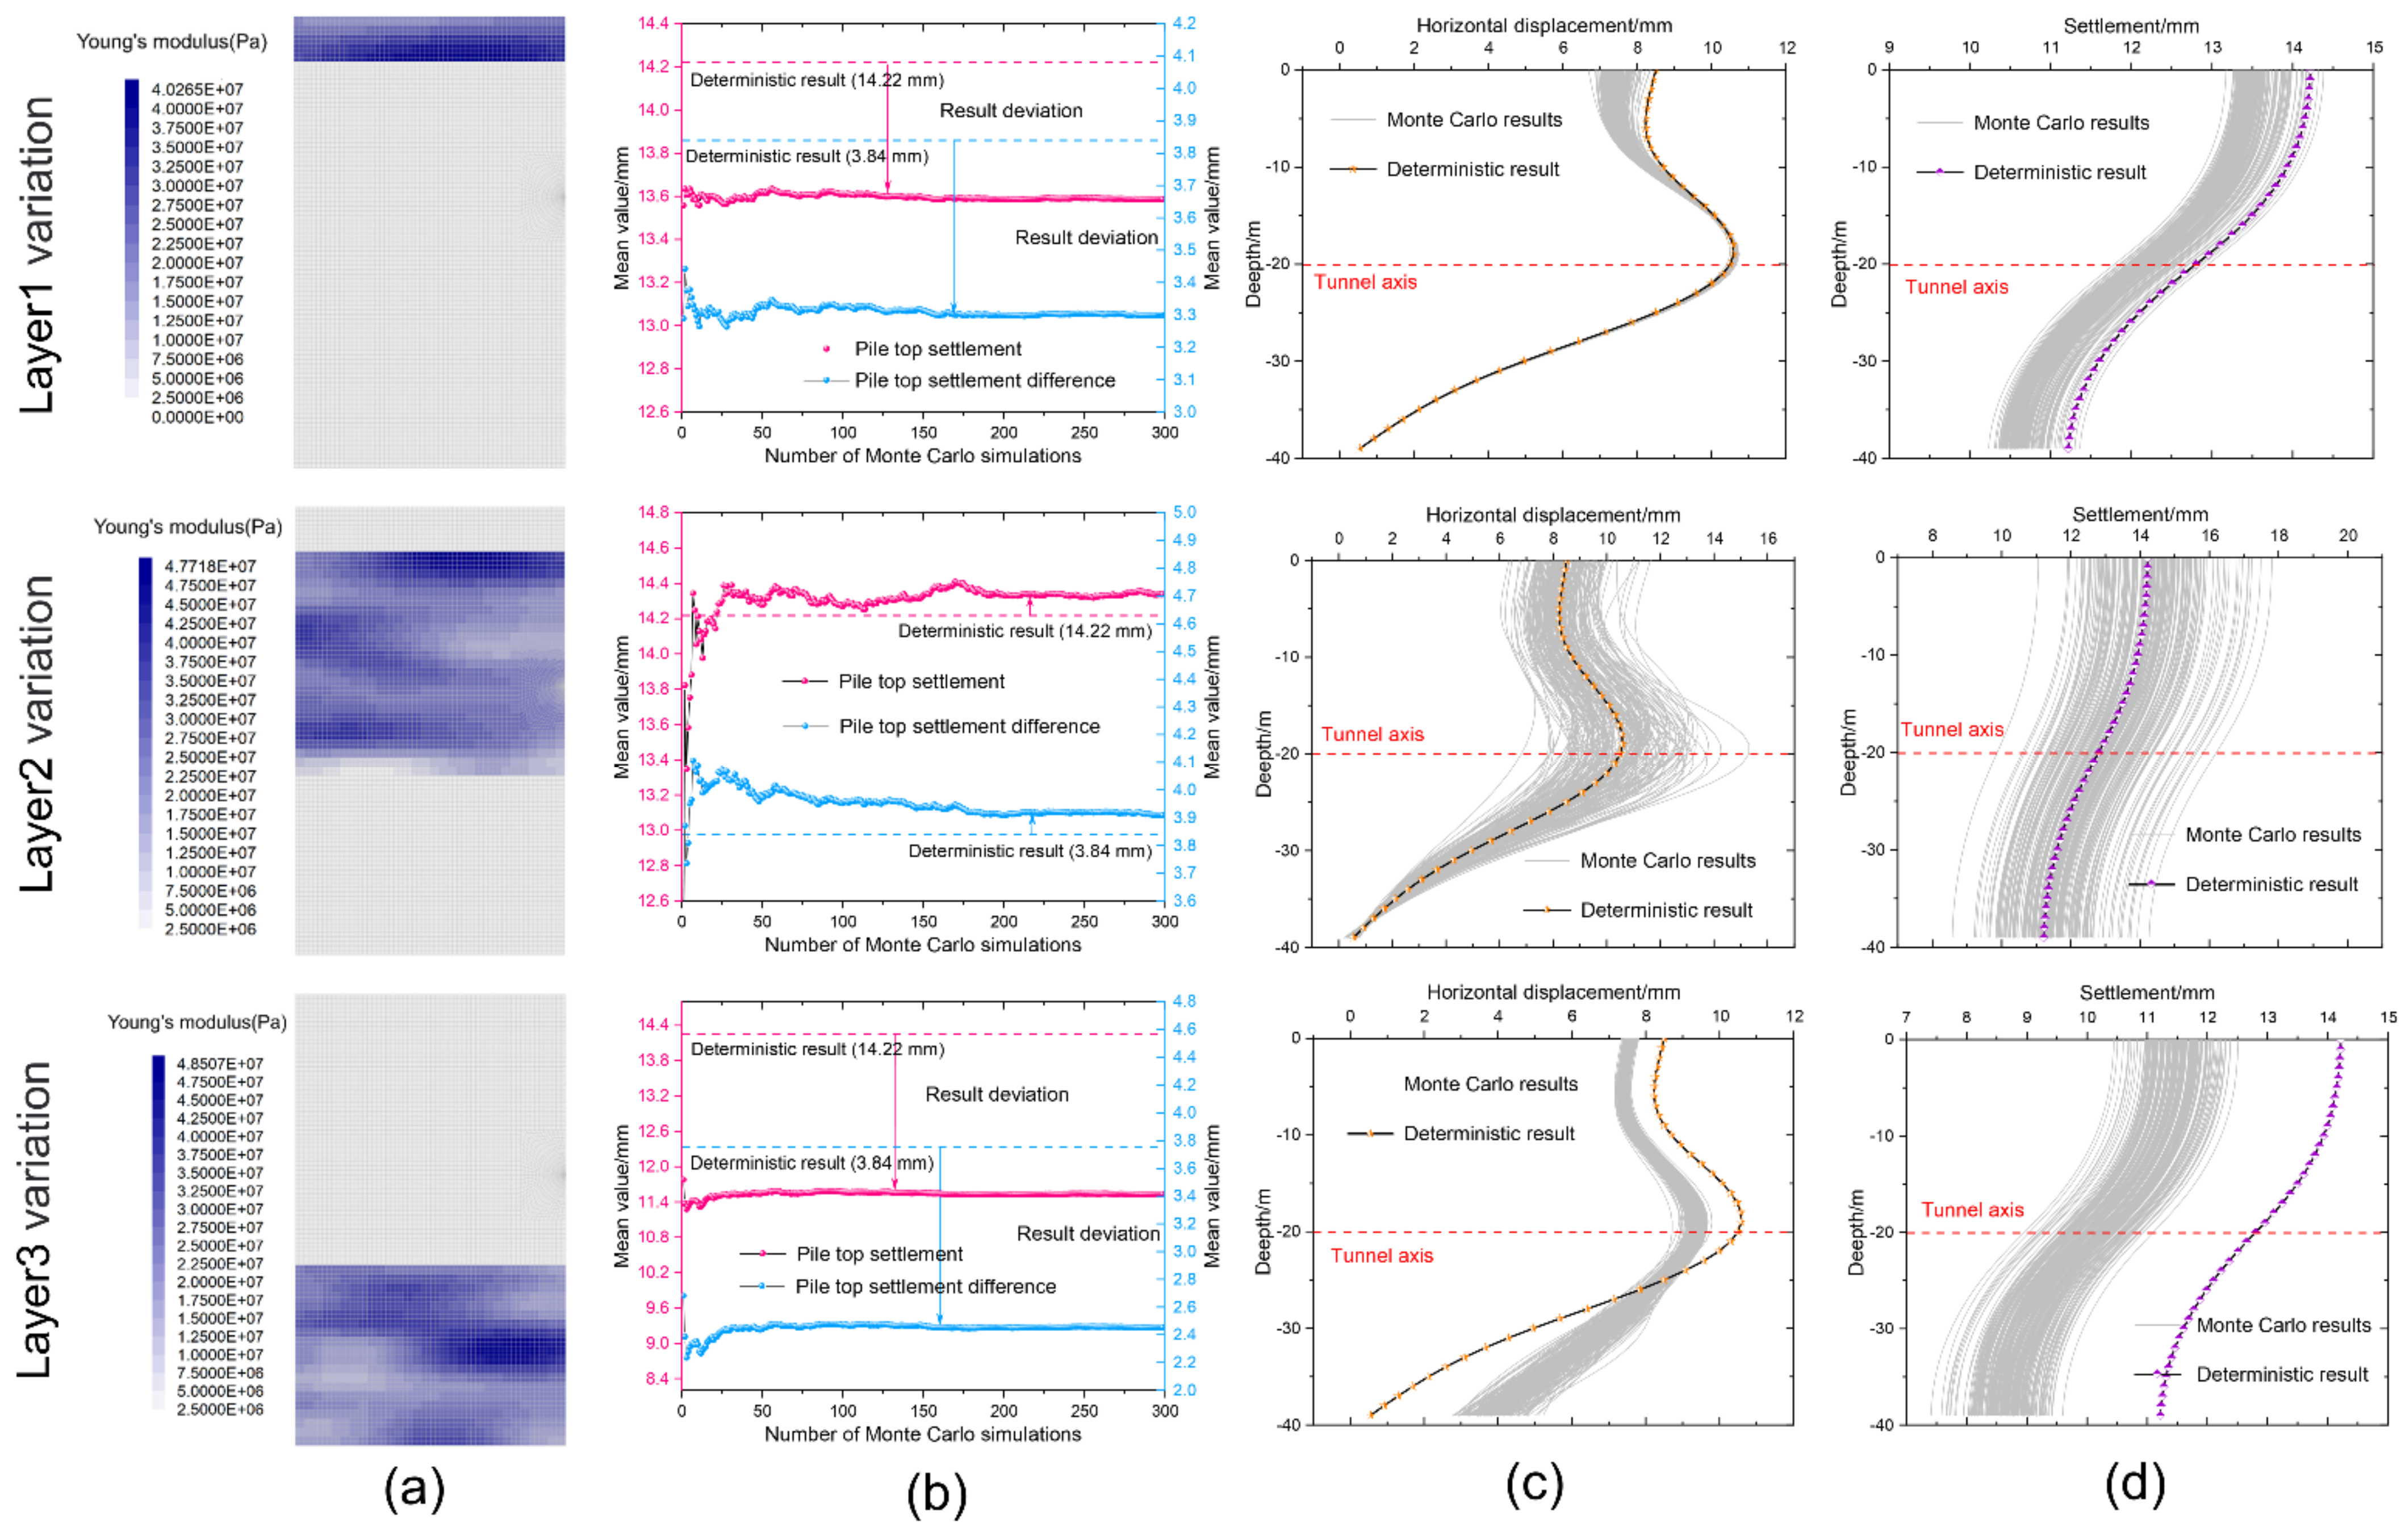
4.2. Effect of Different Stratum Variation

The group piles penetrate three strata: plain fill, clay and decomposed rock. The shield tunnel is positioned inside the intermediate clay layer. This paper aims to analyze the variability of different soil layers where the pile foundation is located and explore the impact of the soil in Young’s modulus variability of each stratum on the pile deformation under tunnel excavation. As shown in Table 2, only the soil layer variation area is altered, and other random field parameters are kept consistent.
According to the relevant research results [22,62,63], the horizontal fluctuation distance of strata is in the range of 3–80 m, and the vertical is between 0.4 and 10 m. In general, the range of horizontal fluctuations is often more extensive than its vertical counterpart. Consequently, the horizontal and vertical fluctuation ranges in this study are, respectively, set as 12 m (twice the tunnel outer diameter) and 3 m (0.5 times the tunnel outer diameter). A total of 300 Monte-Carlo random calculations are performed according to the above parameter settings, and the processed data results are presented in the form of the following curves, as depicted in Figure 8.
There are certain differences in horizontal displacement and settlement of the six piles due to the distance from the shield tunnel, as observed from Section 3.3. Nonetheless, it can be determined that the horizontal displacement and settlement of Pile 4 is the maximum, while that of Pile 3 is the smallest. Therefore, the following research and analysis can concentrate on Pile 3 and 4, and three crucial data (piles’ maximum settlement, piles’ maximum horizontal deformation and differential settlement between piles) that characterize the overall stability of pile groups can be obtained. In particular, the two curves in Figure 8b represent the average value of the Monte-Carlo calculation of the pile top settlement of Pile 4 and the differential settlement between Pile 3 and 4. Figure 8c,d reflect the outcomes of horizontal displacement and settlement of Pile 4 by 300 Monte-Carlo calculations. The following graphs and curves are produced based on this guideline and will not be duplicated.
According to the results of 300 stochastic analyses, compared with the deterministic analysis, the stratum variability where the pile’s top and bottom are positioned is conducive to minimizing the pile’s absolute and differential settlement. However, the spatial variability of the soil layer the tunnel excavated expands the settlement and differential settlement of the pile. Although the COV setup is in accordance with Monte-Carlo stochastic simulation, the discreteness of pile displacement under three working conditions is considerably different, and the variation of layer 2 in Young’s modulus has a significant influence on the pile deformation. In general, it stands to reason that the pile deformation is directly triggered by the tunnel excavation, and that the geological characteristics of the stratum around the tunnel have a tight relationship with the pile deformation. From this perspective, it is crucial to concentrate on the spatial parameter variability of the stratum in which the tunnel is situated.

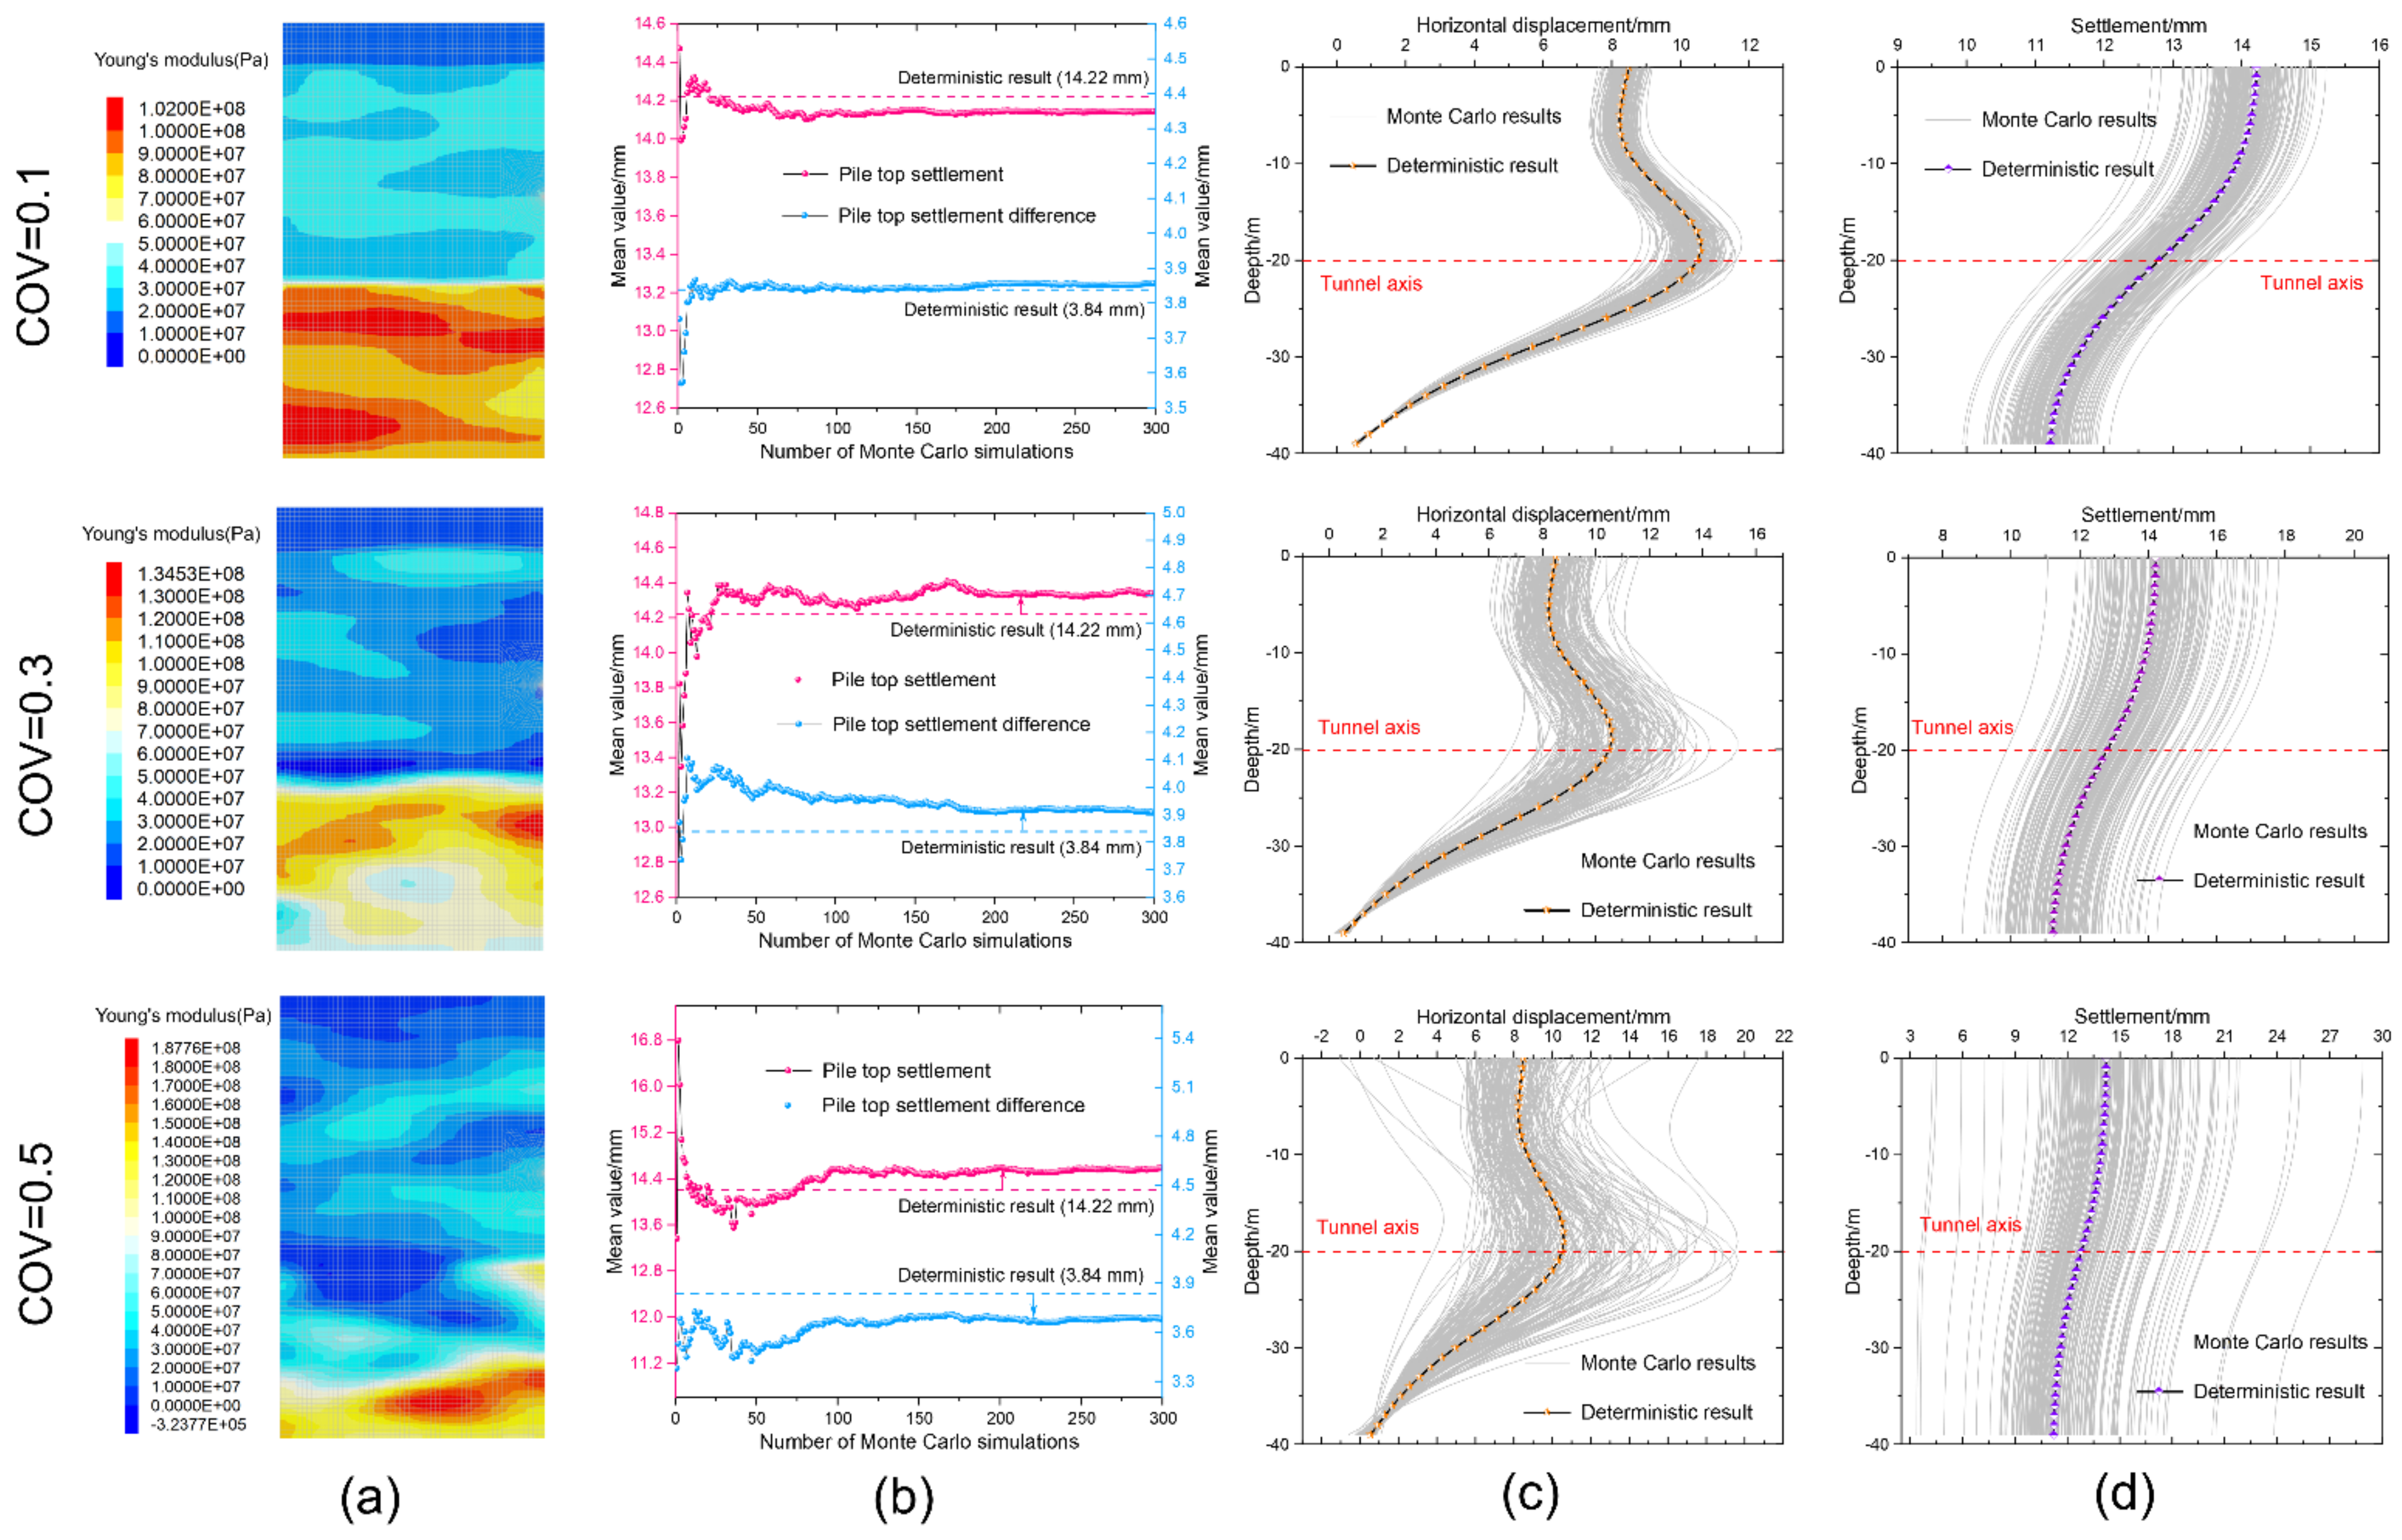
4.3. Effect of Variable Coefficient

In order to investigate the sensitivity of the soil mechanical parameters to pile deformation under different variation levels, the influences of the soil variable coefficient must be comprehensively considered. According to Phoon [62], the COV of clay mostly falls within the range of 5%~45%, hence the COV could be divided into three levels (i.e., 0.1, 0.3 and 0.5), which can well describe clay variability in the field. In this paper, three reference conditions for variation coefficient were similarly designed, with variation levels of COV = 0.1, 0.3, and 0.5, respectively. Compared to the variational stratigraphic range study in the previous section, the range of variation in this section is expanded to the entire stratigraphic range involved in the model, while keeping other parameters unchanged. Accordingly, random parameters are assigned to the three strata in the model, which are mapped three times by the Ipython module in flac3D. The corresponding working conditions and random field parameter settings are displayed in Table 3.
Figure 9 reflects the statistical results of the pile deformation that occurred under 300 Monte-Carlo stochastic calculations when δx = 12 m, δz = 3 m, COV = 0.1, 0.3 and 0.5, specifically including the effect of the Young’s modulus variation coefficient fluctuation on the horizontal deformation, absolute settlement and differential settlement of piles. Under the condition of COV = 0.1, it can be noted that the horizontal displacement curve and settlement curve of Pile 4 are highly concentrated, while the deformation curve swings within a limited range close to the deterministic result. Along with the increase of COV, the inhomogeneity of formation parameters intensifies, and the curve distribution tends to be discrete and quite different from the deterministic results.
Pile deformation varies significantly over the range of Young’s modulus variations in the strata, as seen by the shape of the mean and differential settlement curves. The stochastic calculation results deviate little from the deterministic findings at low levels of variance, particularly for the pile differential settlement. When compared to the deterministic results, the mean absolute settlement of Pile 4 in the simulated circumstances of COV = 0.3 and COV = 0.5 is found to have a slight increase, while the settlement value of the conditions with a significant variation degree extends to be larger. It can be perceived that the variation of the stratum of Young’s modulus is not conducive to the pile stability under the disturbance of the tunnel excavation, and the spatial variation of the strata parameters has a quite significant influence on the pile deformation.

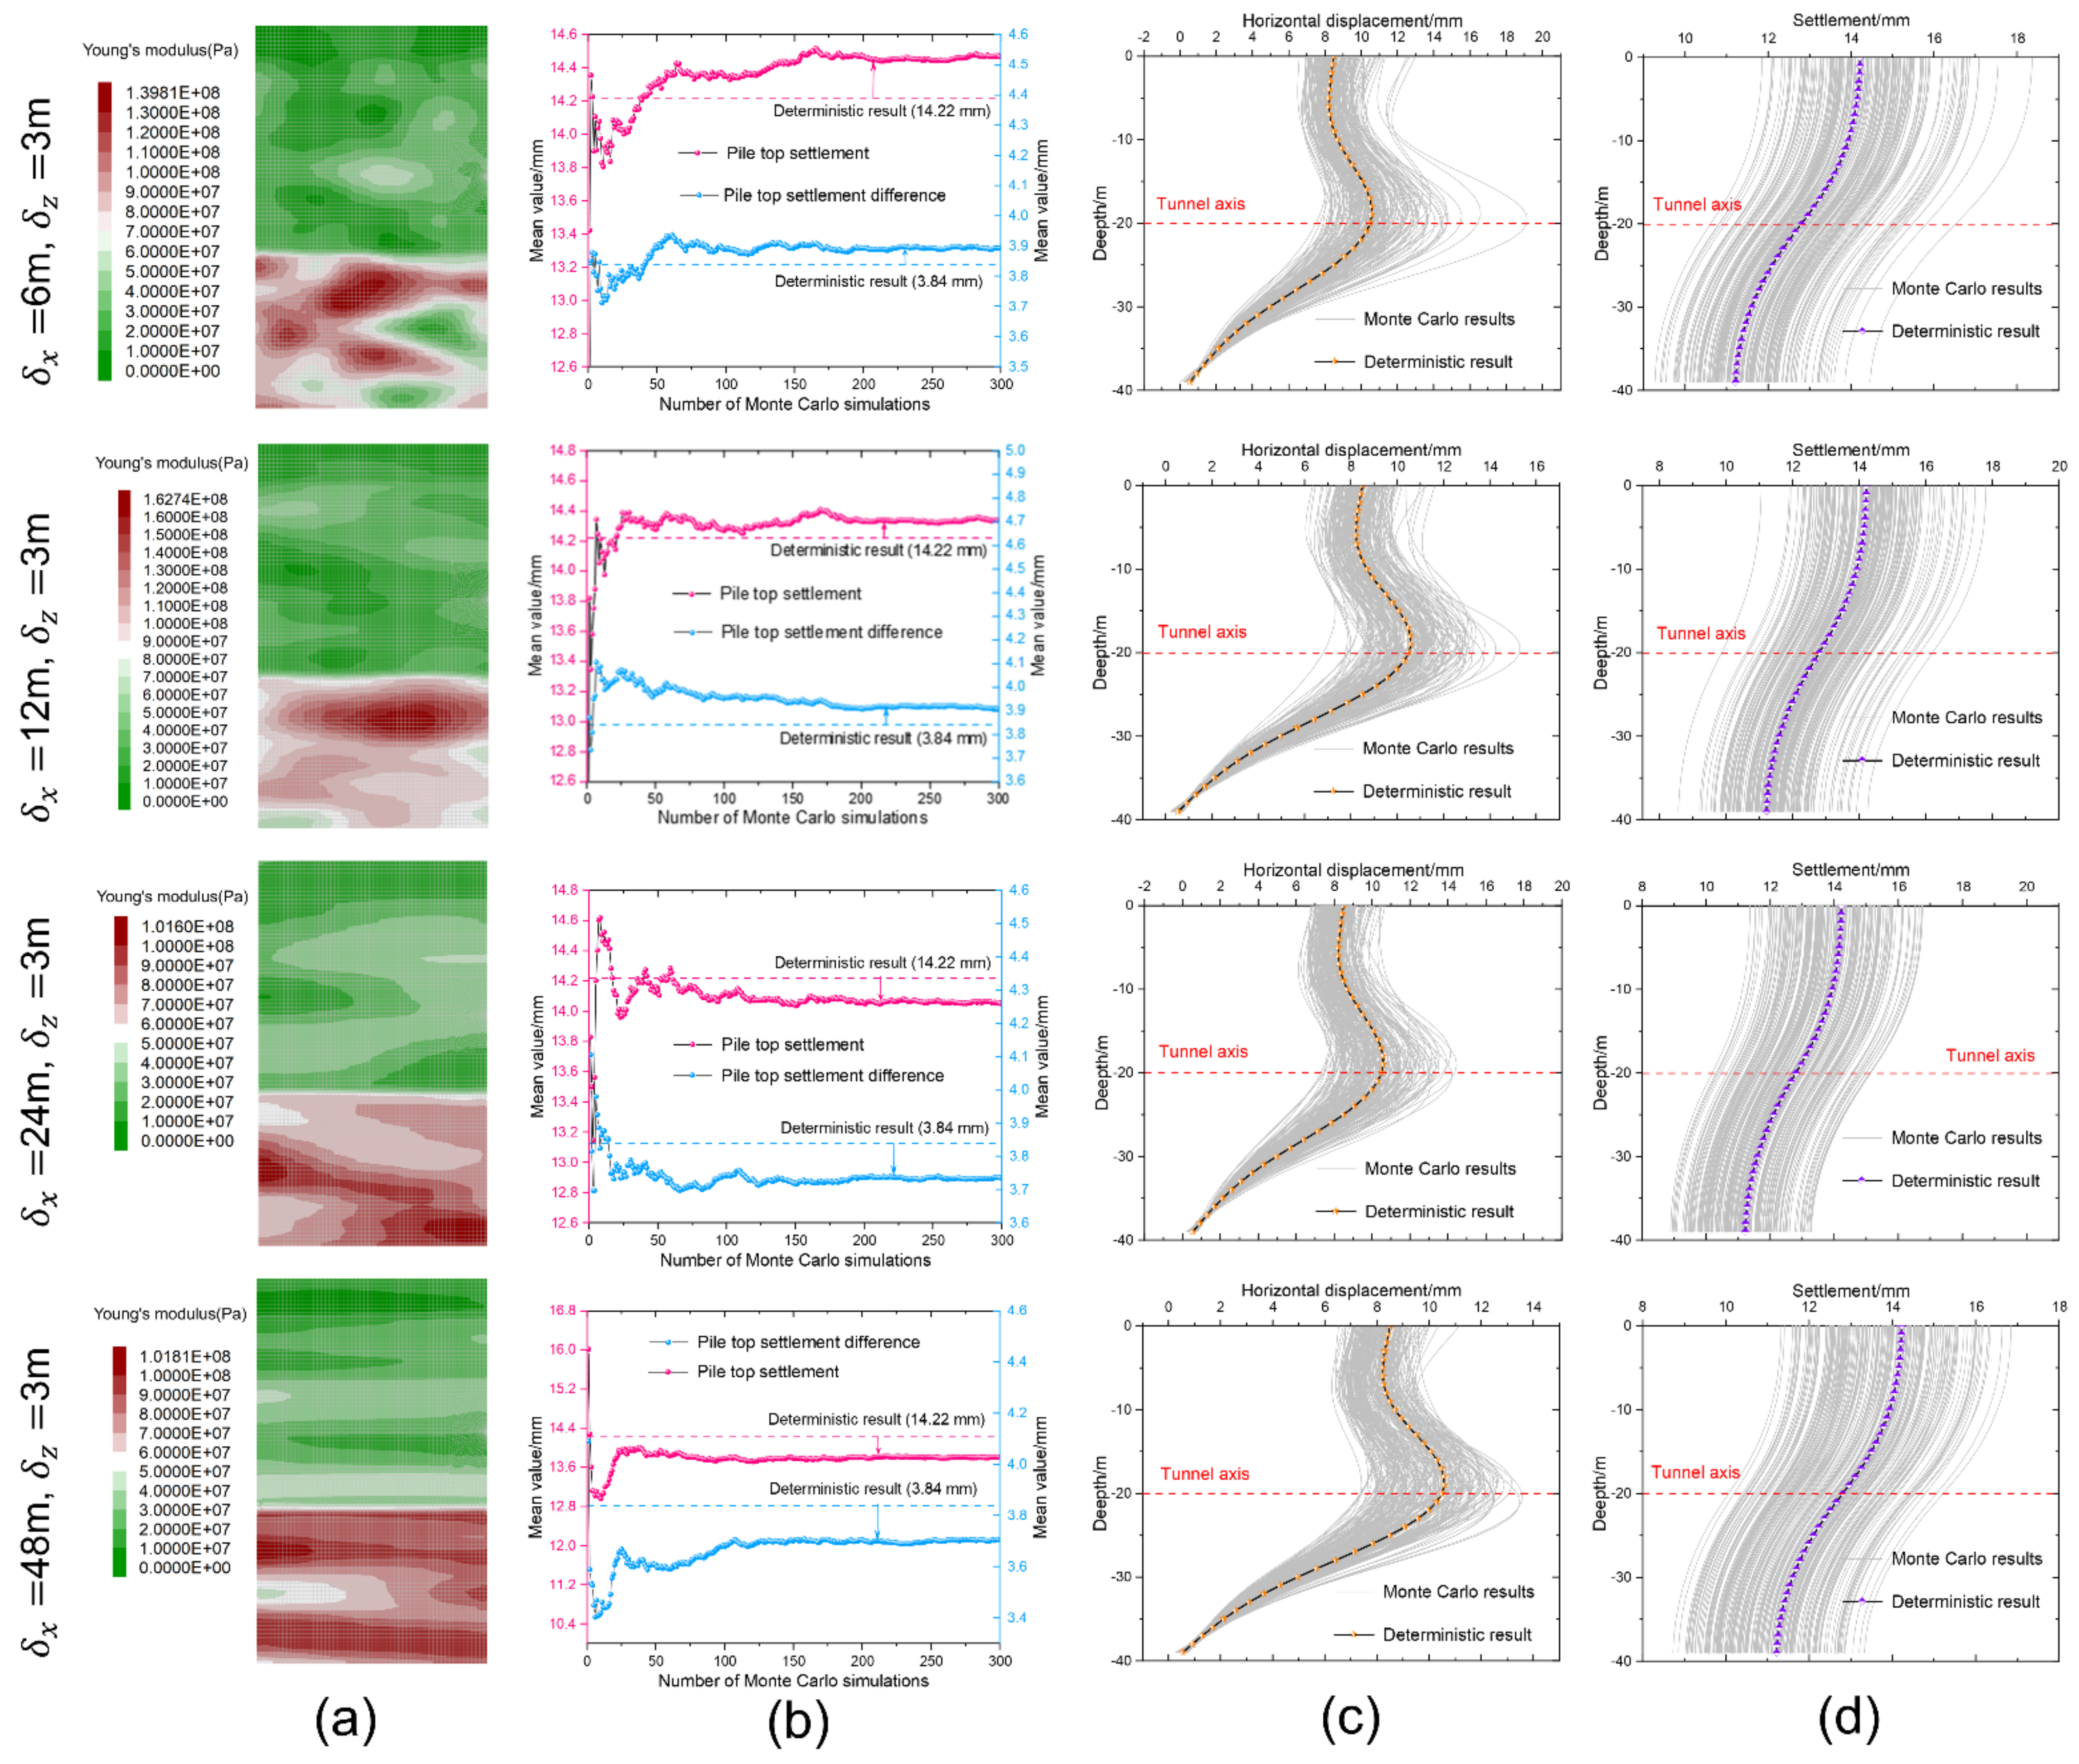
4.4. Effect of Horizontal Fluctuation Distance

Under the identical formation parameter variation level, the influence rule of Young’s modulus fluctuation distance on pile deformation is studied. The influence of the horizontal fluctuation distance is firstly investigated, while the vertical fluctuation distance is held constant at 3 m, and other random field parameters are set in accordance with Table 4.
Figure 10 presents the pile foundation displacements under different horizontal fluctuation distances for 300 Monte-Carlo stochastic simulations. The coverage of displacement curve is quite accordant, indicating that the horizontal fluctuation distance variation has little influence on the fluctuation range of the pile deformation. Then, the discreteness of the random results tends to be relatively consistent. The pile absolute settlement and differential settlement under different δx present different characteristics, as depicted by the mean curve in Figure 10b. Under the cases with small horizontal correlation distance (δx = 6 m, δx = 12 m), the pile settlement increases slightly compared with the deterministic result. Whereas for other cases of HOR_3 and HOR_4 (δx = 24 m, δx = 48 m), the settlement values are lower than the deterministic results. Thus, it can be inferred that the actual δx of stratum parameters in this project is within the range of 12–24 m, where results of stochastic calculation is close to that of deterministic calculation and fluctuates up and down. The pile deformation value under the disturbance of adjacent tunnel excavation is inversely correlated with the δx value of strata Young’s modulus, manifesting that the pile foundation stability would keep nonlinearly rising along with the increase of δx.
It reasons that the stiffness of some areas in the model does not approach the average value, since the random field Young’s modulus parameter following the lognormal distribution is mapped into the finite difference model. The existence of a relatively low stiffness area in the model would result in a disproportionately significant pile displacement in comparison to the deterministic result. However, since the size and frequency of the localized low-stiffness region in the random model are closely related to the δx, then the random models with smaller δx would enhance the occurrence of low stiffness zones. Conversely, the larger the δx is, the smaller the unit difference in one random field simulation calculation becomes, and the probability of the pile foundation being disturbed by the local low stiffness area in the surrounding stratum will also be greatly diminished.

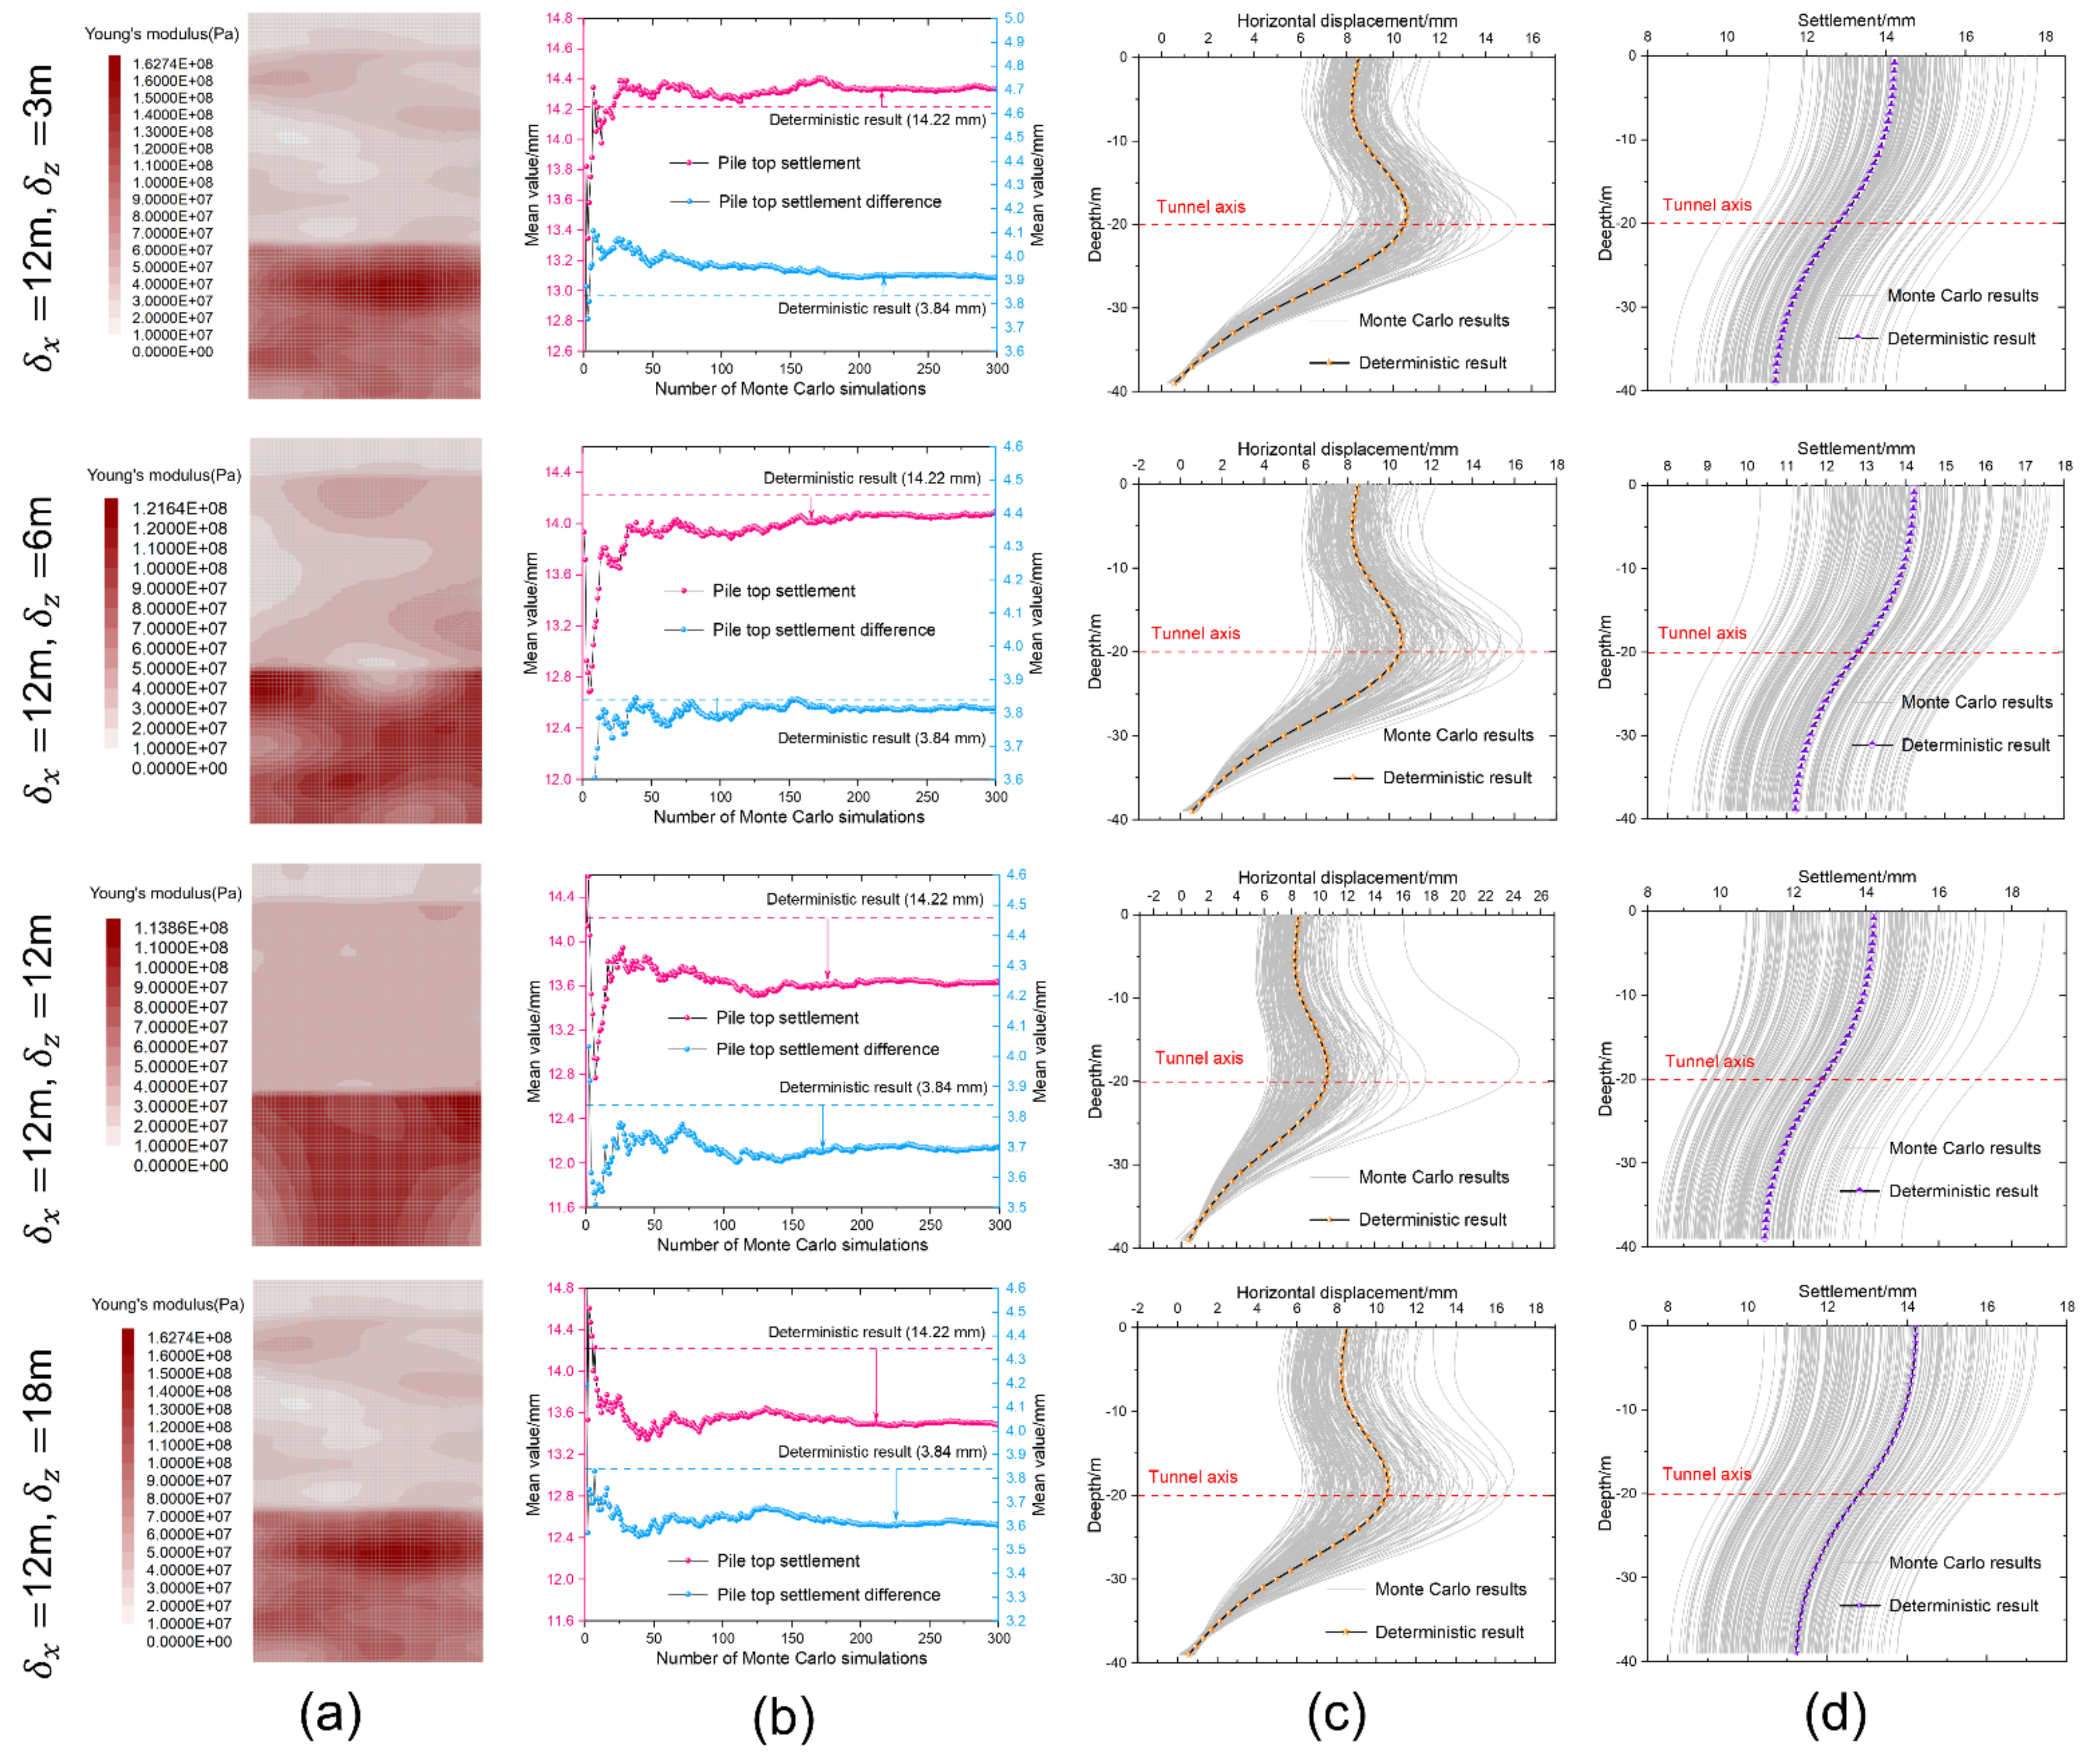
4.5. Effect of Vertical Fluctuation Distance

Despite the fact that the degree of vertical fluctuation of formation parameters is significantly lower than that of horizontal variation, investigating the δz influence of Young’s modulus on pile foundation deformation under tunnel excavation disturbance is still of great necessity. In the following simulation condition settings, only the δz is altered, and δx is controlled with 12 m. Other random field parameters are kept consistent with the above settings, as described in Table 5.
Figure 11 illustrates the pile displacement under different vertical fluctuation distance conditions of 300 Monte-Carlo stochastic simulations. It can be observed that the variation of the δz has little influence on the pile deformation fluctuation, and the discreteness of the stochastic results is relatively consistent. The pile absolute settlement and differential settlement under different δz present different characteristics, as depicted by the mean curve in Figure 11b. In the case of VER_1 with a small δz of 3 m, the pile settlement value rises slightly compared with the deterministic results. However, in other cases with large δz (δz = 6, 12 and 18 m, respectively), the settlement values are all less than the deterministic results.
It is observed that the pile deformation is inversely correlated with the Young’s modulus δz, and the δz of the formation parameters is closely related to the pile stability under the adjacent tunnel excavation disturbance. Based on the above analysis, it can be inferred that the actual δz of the project strata parameters should be fluctuated within the range of 3–6 m, where the results of stochastic calculation are close to that of deterministic calculation and fluctuate up and down. Once δz exceeds this range, whether the pile’s absolute settlement or differential settlement, the deviation between the random calculation results and the deterministic results is further expanded, and the random results show a decreasing trend.

5. Reliability Analysis

Excessive absolute or differential settlement of bridge piles would result in the entire settlement and inclination of bridge piers, which would perhaps pose unbearable safety hazards. In this section, the settlement value of Pile 4 top and the settlement difference between Pile 3 and 4 are selected as two key indicators to evaluate the bridge pier’s reliability. In view of the absence of preexisting bridge pile settlement control specifications and the insufficient applicability of the control value for the construction impact of adjacent preexisting bridges, the spatial variability of soil strength is introduced into the analysis of pile foundation reliability and failure probability. Accordingly, this paper explores such issues from the perspective of the variation degree of the soil in Young’s modulus, and the relevant working conditions and parameter settings are concordant with those in Section 4.2.

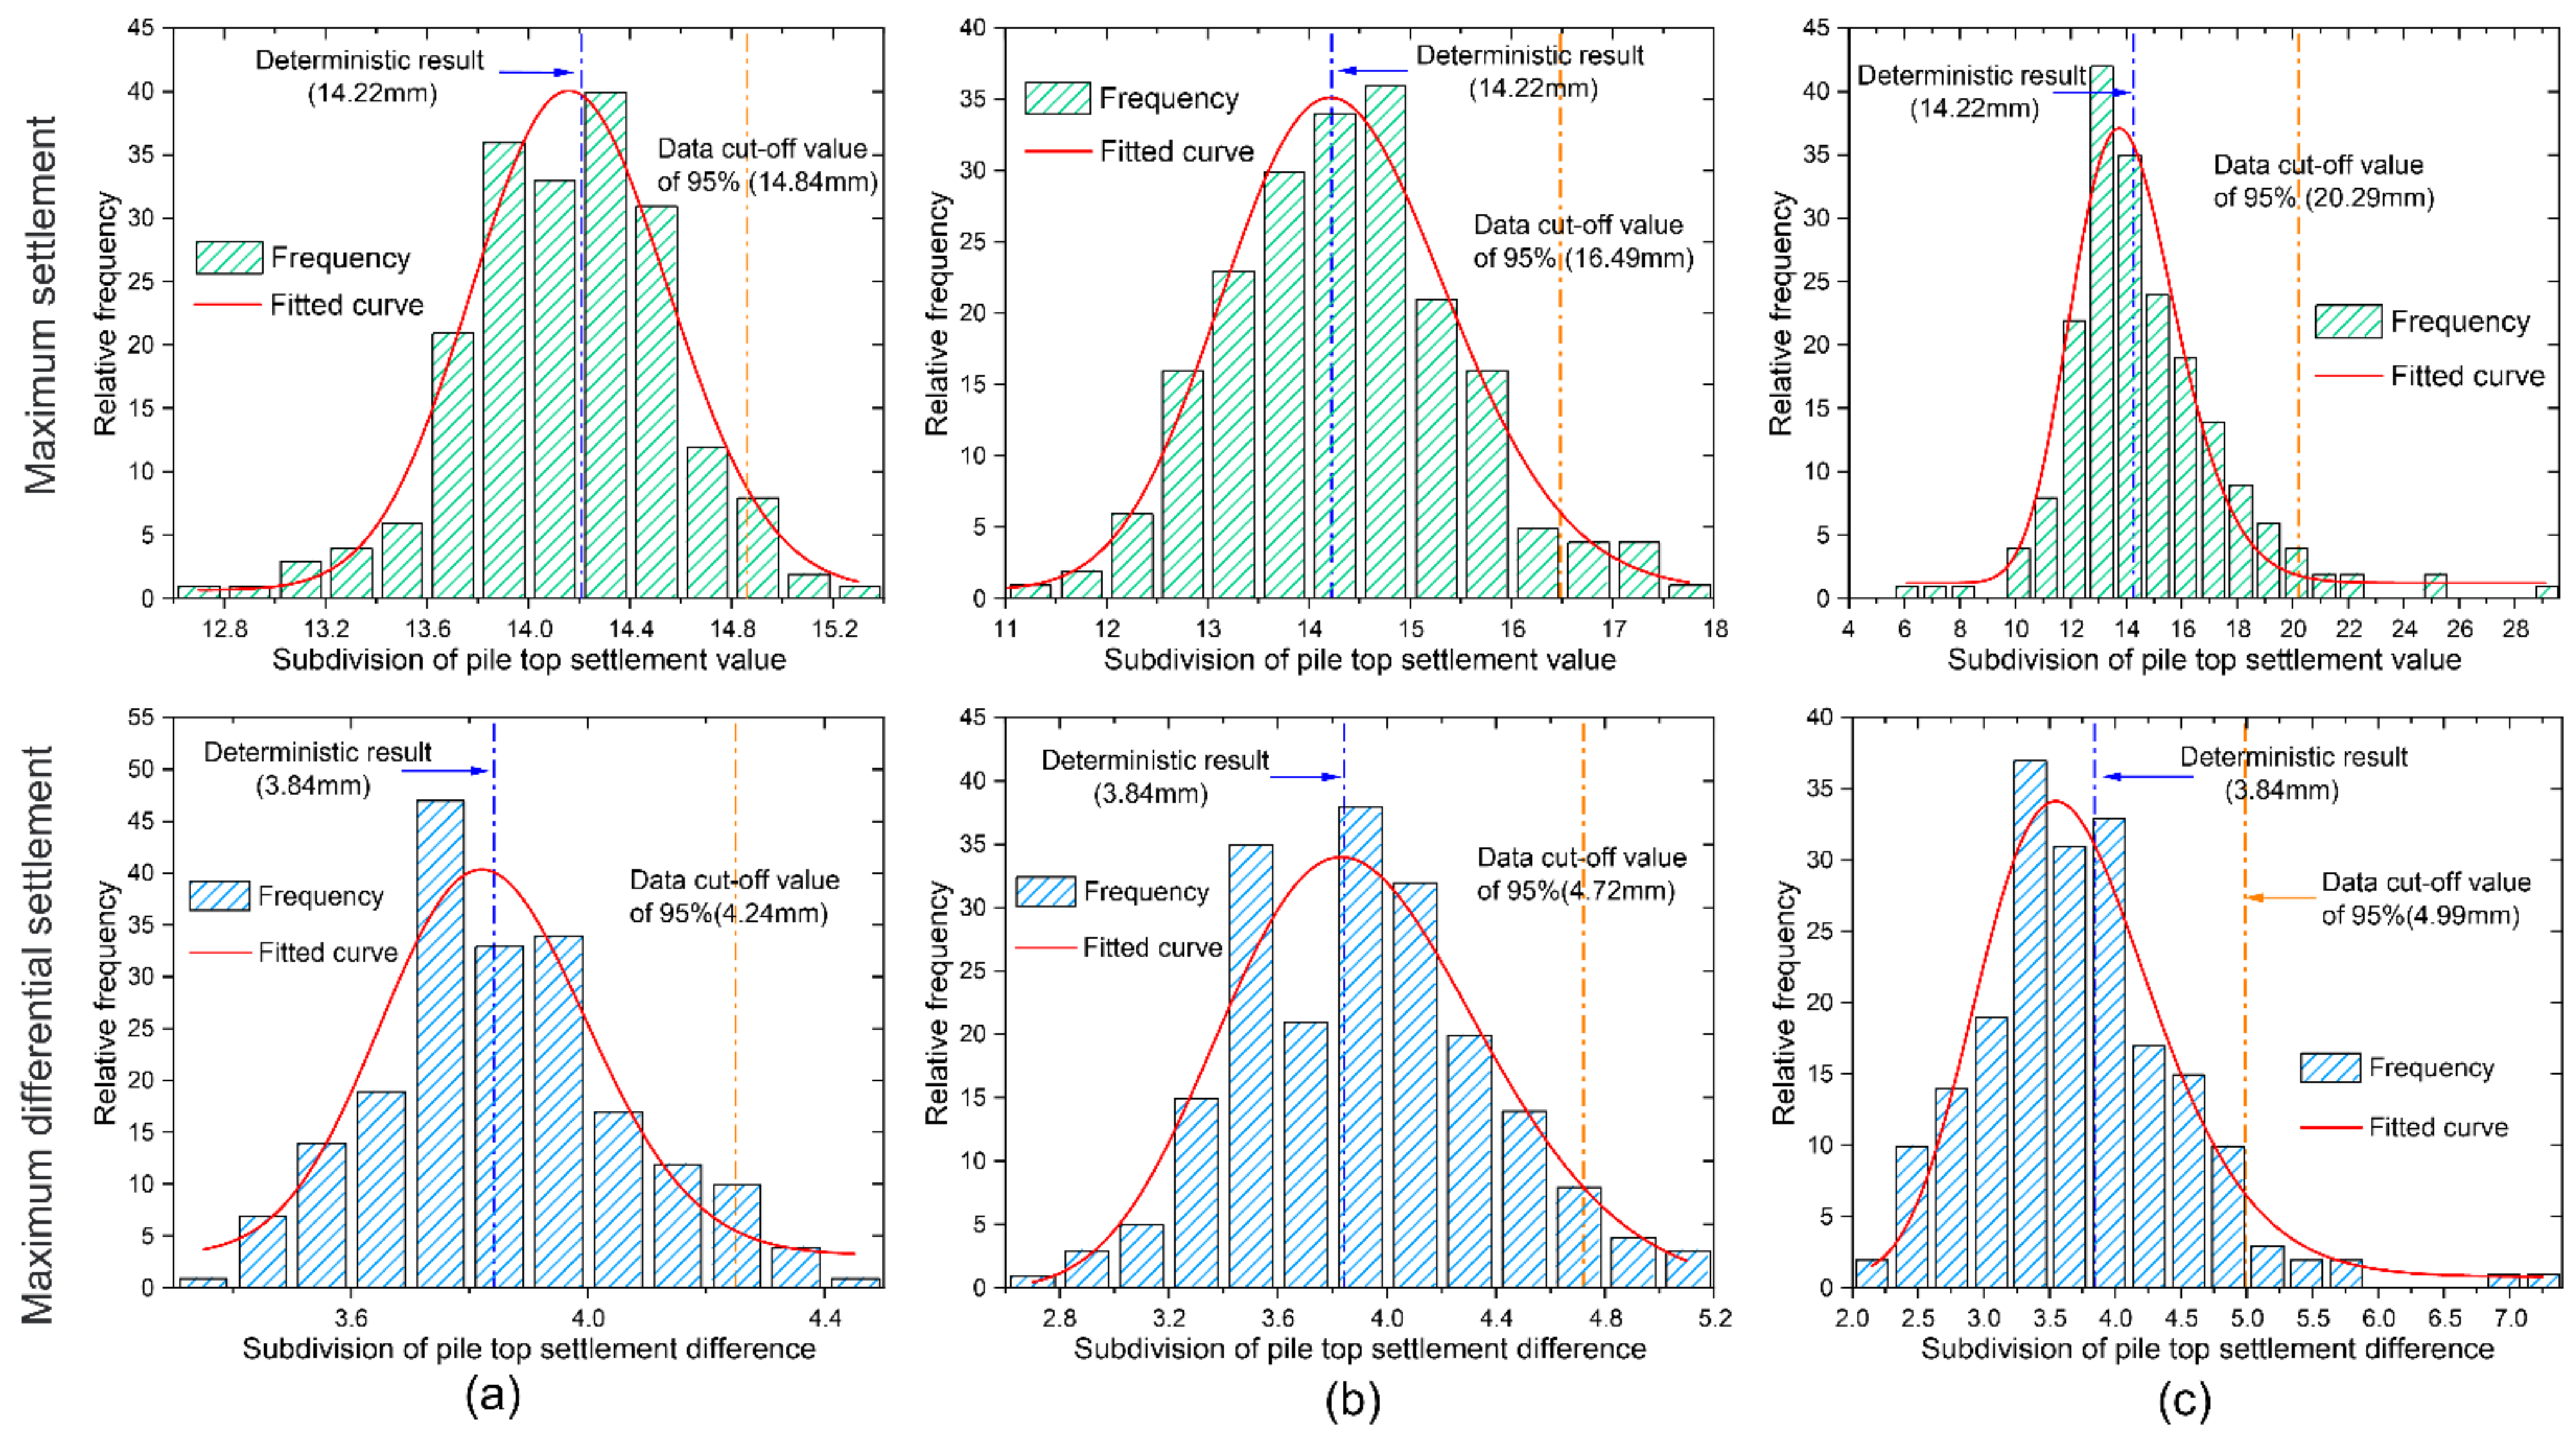
5.1. Frequency Distribution of the Pile Settlement

300 Monte-Carlo stochastic simulation results under three variation coefficients of soil in Young’s modulus (COV = 0.1, 0.3, 0.5) are revealed in Figure 12. The green histogram depicts the frequency distribution of the settlement value at the top of Pile 4, while the blue histogram represents the frequency distribution of the differential settlement between the tops of Pile 3 and Pile 4. The frequency results are fitted into a log-normal distribution curve by a powerful function (as signed with the red curve). In addition, the top 95% random computed statistics are identified by the orange dashed lines (in ascending order). The deterministic results are also depicted by the blue dashed lines as a reference.
It is clear from the graph’s abscissa that both absolute and differential settlement of piles become more granular as COV rises. The calculated fitting curves under three simulation conditions accord well with the respective deterministic results, which further proves the stochastic finite difference model in this study greatly accurate. As depicted in Figure 12 curve, the pile settlement developing in an unfavorable direction rises with the increase of Young’s modulus variability. Varieties of the top 95% statistical data cut-off value in ascending order (hereinafter referred to as “DV-95%”) indicates that for absolute settlement or differential settlement of piles, the “DV-95%” is positively correlated with the corresponding COV, and the probability of pile settlement and differential settlement expansion keeps the same trend. Specifically, when the COV increases from 0.1 to 0.5, the absolute and differential settlement of the pile “DV-95%” expands from 14.84 to 20.29 mm, and from 4.24 to 4.99 mm, respectively. It can be inferred that the soil inhomogeneity has a very significant impact on pile settlement, and that geological surveys should take this into account.

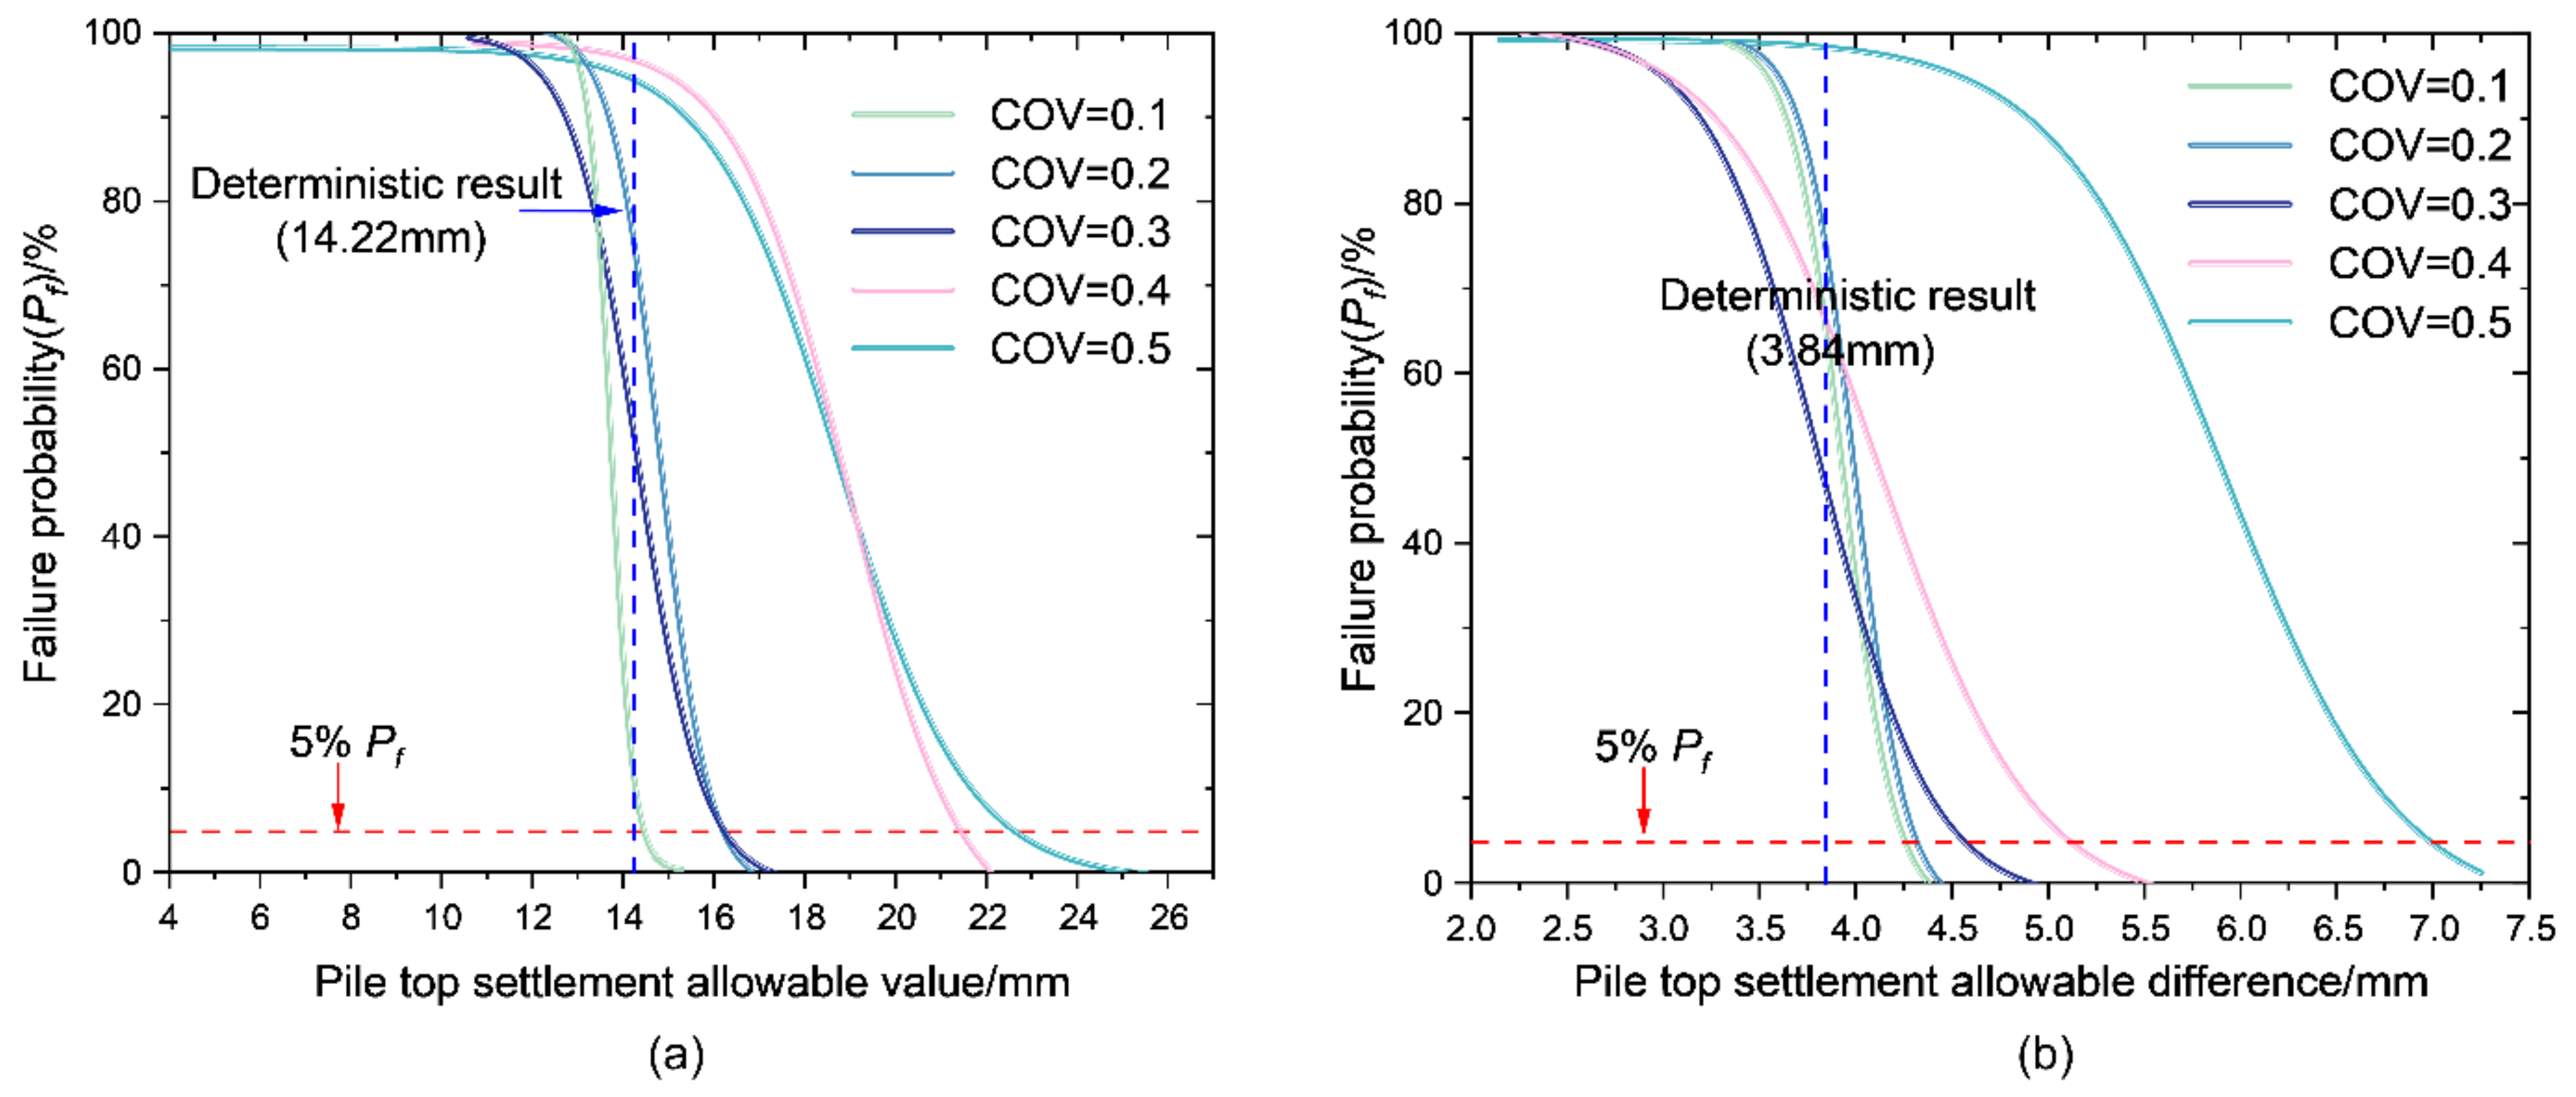
5.2. Reliability Analysis under Different COVs

Figure 13 illustrates the relationship between the failure probability of the pile settlement and the allowable value under different soil Young’s modulus variation levels. Two cases of COV = 0.2 and COV = 0.4 are added on the basis of the three variation coefficient conditions in the previous section. The data are derived from the statistics of 300 Monte-Carlo stochastic calculations, then numerous data points are fitted into smooth curves.
It can be seen from Figure 13 that the intervals of curves with different coefficients of variation are quite different. The larger the coefficient of variation is, the longer the interval develops, and the more scattered the data tends to be. Meanwhile, the curve with the large COV presents a tendency of shifting to the right. With regard to the pile absolute settlement data in Figure 13a, for the case with small variation coefficients (COV = 0.1, 0.2, 0.3), the pile top settlement value is mostly concentrated within the range of 11–17 mm. Other situations with substantial variation coefficients (COV = 0.4, 0.5) have corresponding span lengths of 10 and 20 mm, respectively, and the data tends to be relatively discrete. Similar to the pile absolute settlement data, the pile top differential settlement values also incline to be discrete under the large COV, then the data distribution under the low variation level is relatively concentrated. Therefore, the degree of geological parameter fluctuation must be thoroughly considered while establishing the settlement control specification for disturbed bridge piles. Millimeter-level deviations of soil parameters under low variation levels will result in a huge impact on the reliability results.
However, a key problem is the determination of the allowable maximum displacement of the pier, that is, the acceptable maximum settlement value and differential settlement value of the bridge piles. However, the engineering construction control standard for the maximum allowable deformation of bridge piles has not been proposed, and detailed engineering survey data and field monitoring is insufficient to judge the specific deformation state of each bridge pile buried in the soil, therefore it is difficult to define the maximum settlement and differential settlement that bridge piles can withstand. In this paper, the deformation values of the bridge pile in the deterministic analysis, including the maximum absolute settlement and differential settlement of the pile top, were selected as the criterion of the failure of bridge piles. Additionally, the influence of considering soil variability on the reliability evaluation can be clearly presented. Referring to the deterministic analysis results, the absolute settlement and differential settlement of piles in the deterministic model (depicted by the blue dashed line) are marked in Figure 13. The failure probability, as determined by deterministic results at various levels of variation, is depicted by the point where the blue dashed line and the curve intersect. Similarly, the allowable settlement values corresponding to different variation levels under 5% failure probability are marked with red dashed lines. The data above has been collated in Table 6.
According to the data fed back in Table 6, the failure probability of the pile settlement based on the deterministic results is directly related to the variation coefficient. The rule of thumb is that the failure probability increases as the variation coefficient raises. It has been thoroughly studied how the soil parameter variation coefficient below 5% Pf relates to the allowable value of pile foundation settlement (hereafter referred to as “AV-5%”). The value of “AV-5%” is positively correlated with the COV of soil in Young’s modulus. With the expansion of COV, the allowable value of pile differential settlement tends to increase slightly. Once COV exceeds 0.4, the allowable value of the pile absolute settlement has a saltation, presenting a trend of substantial increase.

6. Conclusions

Based on random field theory and the Monte-Carlo strategy, this study carries out test statistics on a large number of stochastic samples, transforming the findings from being purely deterministic to being statistically probabilistic. As the entry point for the spatial variability of soil properties, the soil in Young’s modulus variability is emphatically investigated. In the meanwhile, the influence of nearby tunnel excavation on pile deformation is studied systematically, along with the sensitivity of stratum range, COV and fluctuation distance (including δx and δz). In addition, the influence of COV on the pile Pf is further analyzed by the reliability evaluation approach. The main conclusions are summarized as follows:
  • The expansion of COV is detrimental to the building stability. For the construction of the tunnel excavation adjacent to the pile foundation, consideration should be given to the stratum variability characteristics of the pile top and bottom, as well as the geological conditions and the degree of stratum variation surrounding the tunnel where the disturbance source is located. The spatial variation degree of soil parameters greatly influences the pile deformation results, especially the range of probability distribution.
  • The influence of δx and δz on the strata is consistent. The fluctuation range of soil parameters affects the probability of low stiffness areas in the stratum and has little correlation with the discreteness of pile deformation results. The pile displacement tends to increase under the cases of small fluctuation range. In addition, based on many random Monte-Carlo calculation results compared with deterministic results, the actual δx and δz are inferred to lie in the ranges of 12–24 m and 3–6 m, respectively.
  • In a Monte-Carlo stochastic analysis, the COV is proportional to the analysis’s degree of discreteness. Under the same pile foundation deformation control index, the case Pf with a large variation coefficient is higher than that with a small COV, and this trend presents more significantly as COV increases. The distribution of findings is highly concentrated under geological settings with a small COV, and differences in millimeter-level control indicators may lead to huge variation in Pf.
According to the analysis results, applying random field theory to assess engineering failure probability and reliability is practical and promising. As a result, in the event of tunnel excavation or disturbance construction of nearby existing buildings, it is required to examine the diversity of geological characteristics (including inter-layer and intra-layer heterogeneity), which has a significant influence on construction safety evaluation. This study has only taken the spatial variability of Young’s modulus into consideration in the stochastic finite difference model, whereas other soil deformation and strength parameters (e.g., Poisson’s ratio, cohesion and internal friction angle) also exist objectively. Their influences on the pile deformation under the disturbance of tunnel excavation deserve further exploration. Furthermore, this article only investigated the pile foundation deformation in a single pier under strata heterogeneity induced by adjacent construction disturbance, and more complex differential settlement between multiple piers would be carried out in subsequent work.

Author Contributions

Conceptualization, S.C., P.G. and Y.W.; methodology, Y.Z.; software, P.G. and J.M.; validation, X.L.; investigation, H.L. All authors have read and agreed to the published version of the manuscript.

Funding

This research work was funded by the National Natural Science Foundation of China (42077249, 51774107), and the Hefei Rail Transit Group Co., Ltd. Funded Project (2021BFFBZ02689).

Institutional Review Board Statement

Not applicable.

Informed Consent Statement

Not applicable.

Data Availability Statement

Not applicable.

Conflicts of Interest

The authors declare no conflict of interest.

References

  1. Xu, Q.W.; Zhu, H.H.; Ma, X.F.; Ma, Z.Z.; Li, X.J.; Tang, Z.H.; Zhuo, K. A Case History of Shield Tunnel Crossing through Group Pile Foundation of a Road Bridge with Pile Underpinning Technologies in Shanghai. Tunn. Undergr. Space Technol. 2015, 45, 20–33. [Google Scholar] [CrossRef]
  2. Soomro, M.A.; Ng, C.W.W.; Liu, K.; Memon, N.A. Pile Responses to Side-by-Side Twin Tunnelling in Stiff Clay: Effects of Different Tunnel Depths Relative to Pile. Comput. Geotech. 2017, 84, 101–116. [Google Scholar] [CrossRef]
  3. Huang, F.; Wang, Z.; Zhang, M.; Li, S. Failure Mechanism of the Bearing Stratum at the End of a Pile Induced by Shield Tunnel Excavation Beneath a Piled Building. KSCE J. Civ. Eng. 2022, 26, 942–954. [Google Scholar] [CrossRef]
  4. Rui, S.; Wang, L.; Guo, Z.; Zhou, W.; Li, Y. Cyclic Behavior of Interface Shear between Carbonate Sand and Steel. Acta Geotech. 2020, 16, 189–209. [Google Scholar] [CrossRef]
  5. Rui, S.; Wang, L.; Guo, Z.; Cheng, X.; Wu, B. Monotonic Behavior of Interface Shear between Carbonate Sands and Steel. Acta Geotech. 2020, 16, 167–187. [Google Scholar] [CrossRef]
  6. Geng, Z.; Jin, D.L.; Yuan, D.J. Face Stability Analysis of Cohesion-Frictional Soils Considering the Soil Arch Effect and the Instability Failure Process. Comput. Geotech. 2023, 153, 105050. [Google Scholar] [CrossRef]
  7. Loganathan, N.; Poulos, H.G.; Xu, K.J. Ground and Pile-Group Responses Due to Tunnelling. Soils Found. 2001, 41, 57–67. [Google Scholar] [CrossRef] [Green Version]
  8. Zhou, J.Q.; Wang, S.Y.; Yang, J.S.; Fu, J.Y. Analysis of Influence of Tunnel Excavation on Adjacent Pile Foundation based on Mindlin Solution. Rock Soil Mech. 2017, 38, 1075–1081. [Google Scholar] [CrossRef]
  9. Liu, X.; Wang, D.C.; Zhang, Y.; Jiang, A.N.; Fang, Q.; Zhang, R. Analytical Solutions on Non-Darcy Seepage of Grouted and Lined Subsea Tunnels under Dynamic Water Levels. Ocean Eng. 2023, 267, 113276. [Google Scholar] [CrossRef]
  10. Liu, X.; Fang, Q.; Jiang, A.N.; Zhang, D.L.; Li, J.Y. Discontinuous Mechanical Behaviors of Existing Shield Tunnel with Stiffness Reduction at Longitudinal Joints. Front. Struct. Civ. Eng. 2022, 3, 920. [Google Scholar] [CrossRef]
  11. Tornborg, J.; Karlsson, M.; Kullingsjo, A.; Karstunen, M. Modelling the Construction and Long-Term Response of Go?Ta Tunnel. Comput. Geotech. 2021, 134, 104027. [Google Scholar] [CrossRef]
  12. Jiang, X.; Zhang, X.H.; Wang, S.; Bai, Y.; Huang, B.S. Case Study of the Largest Concrete Earth Pressure Balance Pipe-Jacking Project in the World. Transp. Res. Rec. 2022, 2676, 92–105. [Google Scholar] [CrossRef]
  13. Jiang, X.; Zhang, Y.; Zhang, Z.; Bai, Y. Bai Study on Risks and Countermeasures of Shallow Biogas during Construction of Metro Tunnels by Shield Boring Machine. Transp. Res. Rec. J. Transp. Res. Board 2021, 2675, 105–116. [Google Scholar] [CrossRef]
  14. Ma, S.K.; Wong, K.S.; Lu, H.; Wu, H.W. Study on the Influence of Tunnel Construction on Pile Groups in Expansive Soil Foundation. Rock Soil Mech. 2013, 34, 3055–3060. [Google Scholar] [CrossRef]
  15. Franza, A.; Marshall, A.M. Marshall Centrifuge Modeling Study of the Response of Piled Structures to Tunneling. J. Geotech. Geoenviron. 2018, 144, 04017109. [Google Scholar] [CrossRef] [Green Version]
  16. Franza, A.; Zheng, C.; Marshall, A.M.; Jimenez, R. Investigation of Soil-Pile-Structure Interaction Induced by Vertical Loads and Tunnelling. Comput. Geotech. 2021, 139, 104386. [Google Scholar] [CrossRef]
  17. Hong, Y.; Soomro, M.A.; Ng, C.W.W.; Wang, L.Z.; Yan, J.J.; Li, B. Tunnelling under Pile Groups and Rafts: Numerical Parametric Study on Tension Effects. Comput. Geotech. 2015, 68, 54–65. [Google Scholar] [CrossRef]
  18. Soomro, M.A.; Mangi, N.; Xiong, H.; Kumar, M.; Mangnejo, D.A. Centrifuge and Numerical Modelling of Stress Transfer Mechanisms and Settlement of Pile Group Due to Twin Stacked Tunnelling with Different Construction Sequences. Comput. Geotech. 2020, 121, 103449. [Google Scholar] [CrossRef]
  19. Zhao, Y.; Luo, S.; Wang, Y.; Wang, W.; Zhang, L.; Wan, W. Numerical Analysis of Karst Water Inrush and a Criterion for Establishing the Width of Water-Resistant Rock Pillars. Mine Water Environ. 2017, 36, 508–519. [Google Scholar] [CrossRef]
  20. Yu, S.Q.; Mo, Q.F.; Chen, Y.Q.; Li, Y.W.; Li, Y.X.; Zou, B.; Xia, H.P.; Jun, W.; Li, Z.; Wang, F.M. Effects of Seasonal Precipitation Change on Soil Respiration Processes in a Seasonally Dry Tropical Forest. Ecol. Evol. 2020, 10, 467–479. [Google Scholar] [CrossRef]
  21. Liu, S.K.; Nie, Y.X.; Hu, W.; Ashiru, M.; Li, Z.; Zuo, J. The Influence of Mixing Degree between Coarse and Fine Particles on the Strength of Offshore and Coast Foundations. Sustainability 2022, 14, 9177. [Google Scholar] [CrossRef]
  22. Huang, H.W.; Xiao, L.; Zhang, D.M.; Zhang, J. Influence of Spatial Variability of Soil Young’s Modulus on Tunnel Convergence in Soft Soils. Eng. Geol. 2017, 228, 357–370. [Google Scholar] [CrossRef]
  23. Luo, Z.; Li, Y.; Zhou, S.; Di, H. Effects of Vertical Spatial Variability on Supported Excavations in Sands Considering Multiple Geotechnical and Structural Failure Modes. Comput. Geotech. 2018, 95, 16–29. [Google Scholar] [CrossRef]
  24. Vanmarcke, E.H. Probabilistic Modeling of Soil Profiles. J. Geotech. Geoenviron. 1977, 103, 49. [Google Scholar] [CrossRef]
  25. Elkateb, T.; Chalaturnyk, R.; Robertson, P.K. An Overview of Soil Heterogeneity: Quantification and Implications on Geotechnical Field Problems. Can. Geotech. J. 2003, 40, 1–15. [Google Scholar] [CrossRef]
  26. Yang, H.Q.; Chen, X.Y.; Zhang, L.L.; Zhang, J.; Wei, X.; Tang, C. Conditions of Hydraulic Heterogeneity under Which Bayesian Estimation Is More Reliable. Water 2020, 12, 160. [Google Scholar] [CrossRef] [Green Version]
  27. Li, D.Q.; Jiang, S.H.; Cao, Z.J.; Zhou, W.; Zhang, L.M. A Multiple Response-Surface Method for Slope Reliability Analysis Considering Spatial Variability of Soil Properties. Eng. Geol. 2014, 187, 60–72. [Google Scholar] [CrossRef]
  28. Gong, W.P.; Tang, H.M.; Wang, H.; Wang, X.R.; Juang, C.H. Probabilistic Analysis and Design of Stabilizing Piles in Slope Considering Stratigraphic Uncertainty. Eng. Geol. 2019, 259, 105162. [Google Scholar] [CrossRef]
  29. Pang, R.; Xu, B.; Zhou, Y.; Song, L. Seismic Time-History Response and System Reliability Analysis of Slopes Considering Uncertainty of Multi-Parameters and Earthquake Excitations. Comput. Geotech. 2021, 136, 104245. [Google Scholar] [CrossRef]
  30. Huang, H.W.; Gong, W.P.; Khoshnevisan, S.; Juang, C.H.; Zhang, D.M.; Wang, L. Simplified Procedure for Finite Element Analysis of the Longitudinal Performance of Shield Tunnels Considering Spatial Soil Variability in Longitudinal Direction. Comput. Geotech. 2015, 64, 132–145. [Google Scholar] [CrossRef]
  31. Wang, X.R.; Li, Z.; Wang, H.; Rong, Q.G.; Liang, R.Y. Probabilistic Analysis of Shield-Driven Tunnel in Multiple Strata Considering Stratigraphic Uncertainty. Struct. Saf. 2016, 62, 88–100. [Google Scholar] [CrossRef]
  32. Wu, G.Q.; Zhao, H.; Zhao, M.H.; Zhu, Z.R. Stochastic Analysis of Dual Tunnels in Spatially Random Soil. Comput. Geotech. 2021, 129, 103861. [Google Scholar] [CrossRef]
  33. Zhang, W.G.; Han, L.; Gu, X.; Wang, L.; Chen, F.Y.; Liu, H.L. Tunneling and Deep Excavations in Spatially Variable Soil and Rock Masses: A Short Review. Undergr. Space 2022, 7, 380–407. [Google Scholar] [CrossRef]
  34. Cheng, H.Z.; Chen, J.; Chen, R.P.; Chen, G.L. Reliability Study on Shield Tunnel Face Using a Random Limit Analysis Method in Multilayered Soils. Tunn. Undergr. Space Technol. 2019, 84, 353–363. [Google Scholar] [CrossRef]
  35. Zhang, J.Z.; Huang, H.W.; Zhang, D.M.; Zhou, M.L.; Tang, C.; Liu, D.J. Effect of Ground Surface Surcharge on Deformational Performance of Tunnel in Spatially Variable Soil. Comput. Geotech. 2021, 136, 104229. [Google Scholar] [CrossRef]
  36. Yang, H.Q.; Zhang, L.L.; Li, D.Q. Efficient Method for Probabilistic Estimation of Spatially Varied Hydraulic Properties in a Soil Slope Based on Field Responses: A Bayesian Approach. Comput. Geotech. 2018, 102, 262–272. [Google Scholar] [CrossRef]
  37. Yang, H.Q.; Zhang, L.L.; Xue, J.F.; Zhang, J.; Li, X. Unsaturated Soil Slope Characterization with Karhunen-LoSve and Polynomial Chaos via Bayesian Approach. Eng. Comput. 2019, 35, 337–350. [Google Scholar] [CrossRef]
  38. Yang, H.Q.; Zhang, L.L.; Pan, Q.J.; Phoon, K.K.; Shen, Z.C. Bayesian Estimation of Spatially Varying Soil Parameters with Spatiotemporal Monitoring Data. Acta Geotech. 2021, 16, 263–278. [Google Scholar] [CrossRef]
  39. Chen, F.Y.; Wang, L.; Zhang, W.G. Reliability Assessment on Stability of Tunnelling Perpendicularly beneath an Existing Tunnel Considering Spatial Variabilities of Rock Mass Properties. Tunn. Undergr. Space Technol. 2019, 88, 276–289. [Google Scholar] [CrossRef]
  40. El-Ramly, H.; Morgenstern, N.R.; Cruden, D.M. Probabilistic Stability Analysis of a Tailings Dyke on Presheared Clay-Shale. Can. Geotech. J. 2003, 40, 192–208. [Google Scholar] [CrossRef]
  41. Pang, R.; Zhou, Y.; Chen, G.H.; Jing, M.Y.; Yang, D.X. Stochastic Mainshock-Aftershock Simulation and Its Applications in Dynamic Reliability of Structural Systems via DPIM. J. Eng. Mech. 2023, 149, 04022096. [Google Scholar] [CrossRef]
  42. Li, J.B.; Huang, J.G.; Tong, H.W.; Zhang, S.K. Reliability Analysis of Safety Assessment of Buildings above Twin Shield Tunnels Based on Random Field Theory. Math. Probl. Eng. 2022, 2022, 2252580. [Google Scholar] [CrossRef]
  43. Cheng, H.Z.; Chen, J.; Chen, R.P.; Huang, J.H.; Li, J.H. Three-Dimensional Analysis of Tunnel Face Stability in Spatially Variable Soils. Comput. Geotech. 2019, 111, 76–88. [Google Scholar] [CrossRef]
  44. Jiang, S.H.; Li, D.Q.; Zhou, C.B.; Fang, G.G. Slope Reliability Analysis Considering the Influence of Autocorrelation Function. Chin. J. Geotech. Eng. 2014, 36, 508–518. [Google Scholar]
  45. Guo, X.F.; Dias, D.; Pan, Q.J. Probabilistic Stability Analysis of an Embankment Dam Considering Soil Spatial Variability. Comput. Geotech. 2019, 113, 103093. [Google Scholar] [CrossRef]
  46. Li, Y.C.; Pang, R.; Xu, B.; Wang, X.L.; Fan, Q.Y.; Jiang, F. GPDEM-Based Stochastic Seismic Response Analysis of High Concrete-Faced Rockfill Dam with Spatial Variability of Rockfill Properties Based on Plastic Deformation. Comput. Geotech. 2021, 139, 104416. [Google Scholar] [CrossRef]
  47. Cheng, H.Z.; Chen, J.; Li, J.B. Probabilistic Analysis of Ground Movements Caused by Tunneling in a Spatially Variable Soil. Int. J. Geomech. 2019, 19, 04019125. [Google Scholar] [CrossRef]
  48. Fenton, G.A. Error Evaluation of Three Random-Field Generators. J. Eng. Mech. 1994, 120, 2478–2497. [Google Scholar] [CrossRef]
  49. Fenton, G.A.; Griffiths, D.V. Bearing-Capacity Prediction of Spatially Random c-Phi Soils. Can. Geotech. J. 2003, 40, 54–65. [Google Scholar] [CrossRef]
  50. Hu, B.; Schiehlen, W. On the Simulation of Stochastic Processes by Spectral Representation. Probabilistic Eng. Mech. 1997, 12, 105–113. [Google Scholar] [CrossRef]
  51. Jha, S.K.; Ching, J. Simulating Spatial Averages of Stationary Random Field Using the Fourier Series Method. J. Eng. Mech. 2013, 139, 594–605. [Google Scholar] [CrossRef]
  52. Dietrich, C.R.; Newsam, G.N. Fast and Exact Simulation of Stationary Gaussian Processes through Circulant Embedding of the Covariance Matrix. SIAM J. Sci. Comput. 1997, 18, 1088–1107. [Google Scholar] [CrossRef] [Green Version]
  53. Li, J.B.; Chen, J. Comprehensive Reliability Analysis of Ground Deformation in Shield Tunneling Considering Spatial Variability of Parameters. J. Yangtze River Sci. Res. Inst. 2020, 37, 127–133. [Google Scholar]
  54. Guo, P.P.; Gong, X.N.; Wang, Y.X. Displacement and Force Analyses of Braced Structure of Deep Excavation Considering Unsymmetrical Surcharge Effect. Comput. Geotech. 2019, 113, 103102. [Google Scholar] [CrossRef]
  55. Guo, P.P.; Lei, G.; Luo, L.N.; Gong, X.N.; Wang, Y.X.; Li, B.J.; Hu, X.J.; Hu, H.B. Soil Creep Effect on Time-Dependent Deformation of Deep Braced Excavation. Adv. Mater. Sci. Eng. 2022, 2022, 5655592. [Google Scholar] [CrossRef]
  56. Cheng, H.Z.; Chen, J.; Chen, R.P.; Chen, G.L. Comparison of Modeling Soil Parameters Using Random Variables and Random Fields in Reliability Analysis of Tunnel Face. Int. J. Geomech. 2019, 19, 04018184. [Google Scholar] [CrossRef]
  57. Tang, K.D.; Wang, J.L.; Li, L.L. A Prediction Method Based on Monte Carlo Simulations for Finite Element Analysis of Soil Medium Considering Spatial Variability in Soil Parameters. Adv. Mater. Sci. Eng. 2020, 2020, 7064640. [Google Scholar] [CrossRef]
  58. Ling, X.Z.; Kong, X.X.; Tang, L.; Zhao, Y.Z.; Tang, W.C.; Zhang, Y.F. Predicting Earth Pressure Balance (EPB) Shield Tunneling-Induced Ground Settlement in Compound Strata Using Random Forest. Transp. Geotech. 2022, 35, 100771. [Google Scholar] [CrossRef]
  59. He, H.J.; Xiang, Y.Y.; Liu, W.N. Probability Analysis of Differential Settlement of Adjacent Bridge Pile Foundation caused by Subway Construction. Chin. J. Rock Mech. Eng. 2007, 26, 3257–3265. [Google Scholar]
  60. Fenton, G.A.; Griffiths, D.V. Risk Assessment in Geotechnical Engineering; John and Wiley and Sons, Inc.: Hoboken, NJ, USA, 2008; p. 461. ISBN 978-0-470-28470-4. [Google Scholar]
  61. Li, J.H.; Tian, Y.H.; Cassidy, M.J. Failure Mechanism and Bearing Capacity of Footings Buried at Various Depths in Spatially Random Soil. J. Geotech. Geoenviron. 2015, 141, 04014099. [Google Scholar] [CrossRef] [Green Version]
  62. Phoon, K.K.; Kulhawy, F.H. Characterization of Geotechnical Variability. Can. Geotech. J. 1999, 36, 612–624. [Google Scholar] [CrossRef]
  63. Gong, W.P.; Juang, C.H.; Martin, J.R.; Tang, H.M.; Wang, Q.Q.; Huang, H.W. Probabilistic Analysis of Tunnel Longitudinal Performance Based upon Conditional Random Field Simulation of Soil Properties. Tunn. Undergr. Space Technol. 2018, 73, 1–14. [Google Scholar] [CrossRef]
Figure 1. Flow chart of the proposed RFDM method.
Sustainability 14 16854 g001
Figure 2. The relative position of twin tunnels and pile foundation.
Sustainability 14 16854 g002
Figure 3. Numerical model presentation: (a) the overall model; (b) the pile group and pile cap; (c) left-line tunnel and grouting.
Sustainability 14 16854 g003
Figure 4. The pile group displacement curve: (a) horizontal displacement; (b) vertical displacement.
Sustainability 14 16854 g004
Figure 5. The pile group displacement induced by tunnel excavation.
Sustainability 14 16854 g005
Figure 6. The random finite difference model.
Sustainability 14 16854 g006
Figure 7. The converging trend of piles’ settlement.
Sustainability 14 16854 g007
Figure 8. Statistics of 300 Monte-Carlo stochastic simulation results under different variation stratum: (a) The random finite difference model; (b) Mean statistics; (c) Horizontal displacement of Pile 4; (d) Settlement of Pile 4.
Sustainability 14 16854 g008
Figure 9. Statistics of 300 Monte-Carlo stochastic simulation results under different variation coefficients: (a) The random finite difference model; (b) Mean statistics; (c) Horizontal displacement of Pile 4; (d) Settlement of Pile 4.
Sustainability 14 16854 g009
Figure 10. Statistics of 300 Monte-Carlo stochastic simulation results under different horizontal fluctuation distance: (a) The random finite difference model; (b) Mean statistics; (c) Horizontal displacement of Pile 4; (d) Settlement of Pile 4.
Sustainability 14 16854 g010
Figure 11. Statistics of 300 Monte-Carlo stochastic simulation results under different vertical fluctuation distance: (a) The random finite difference model; (b) Mean statistics; (c) Horizontal displacement of Pile 4; (d) Settlement of Pile 4.
Sustainability 14 16854 g011
Figure 12. Frequency distribution of the pile maximum settlement and settlement difference: (a) COV = 0.1; (b) COV = 0.3; (c) COV = 0.5.
Sustainability 14 16854 g012
Figure 13. Cumulative distribution of failure probability under different COV: (a) The pile top settlement allowable value; (b) the pile top settlement allowable difference.
Sustainability 14 16854 g013
Table 1. Properties of the materials modeled in numerical analysis.
CategoryPlain FillClayDecomposed RockGrouting LayerLining
Segment
Pile
Caps
Pile
ModelMohr-
Coulomb
Mohr-
Coulomb
Mohr-
Coulomb
ElasticIsotropicElasticIsotropic
ElementSolidSolidSolidSolidShellSolidPile
Thickness(diameter)/m5.025.020.00.30.30.51.0
Density/kg·m−31700190018002400245025002500
Young’s modulus/mPa13271001006.0 × 1033.0 × 1043.3 × 104
Friction angle/°81215----
Cohesion/kPa104035----
Poisson’s ratio0.350.330.30.250.20.20.2
Table 2. Parameters of random fields under different variation stratum (D = 6 m).
Variation ObjectCaseVariation LayerCOVFluctuation Scale
δxδz
Variable stratumSTR_1Layer10.312 m/2 D3 m/0.5 D
STR_2Layer20.312 m/2 D3 m/0.5 D
STR_3Layer30.312 m/2 D3 m/0.5 D
Table 3. Parameters of random fields under different variation coefficients (D = 6 m).
Variation ObjectCaseCOVScale of Fluctuation
δxδz
Variable coefficientCOE_10.112 m/2 D3 m/0.5 D
COE_20.312 m/2 D3 m/0.5 D
COE_30.512 m/2 D3 m/0.5 D
Table 4. Parameters of random fields under different horizontal fluctuation distance (D = 6 m).
Variation ObjectCaseScale of FluctuationCOV
δxδz
Horizontal fluctuation distanceHOR_16 m/1 D3 m/0.5 D0.3
HOR_212 m/2 D3 m/0.5 D0.3
HOR_324 m/4 D3 m/0.5 D0.3
HOR_448 m/8 D3 m/0.5 D0.3
Table 5. Parameters of random fields under different vertical fluctuation distance (D = 6 m).
Variation ObjectCaseScale of FluctuationCOV
δxδz
Vertical fluctuation distanceVER_112 m/2 D3 m/0.5 D0.3
VER_212 m/2 D6 m/1 D0.3
VER_312 m/2 D12 m/2 D0.3
VER_412 m/2 D18 m/3 D0.3
Table 6. Analysis of failure probability and allowable settlement value.
COVFailure Probability under Deterministic ResultAllowed Values Corresponding to 5% Pf
Absolute SettlementDifferential SettlementAbsolute SettlementDifferential Settlement
0.112.22%68.17%14.62 mm4.31 mm
0.276.89%76.05%16.35 mm4.36 mm
0.355.18%51.79%18.09 mm4.59 mm
0.494.86%69.24%21.59 mm5.35 mm
0.595.52%98.63%22.96 mm6.83 mm
Publisher’s Note: MDPI stays neutral with regard to jurisdictional claims in published maps and institutional affiliations.

