


Influence of Pipeline Leakage on the Ground Settlement around the Tunnel during Shield Tunneling

Abstract
:1. Introduction
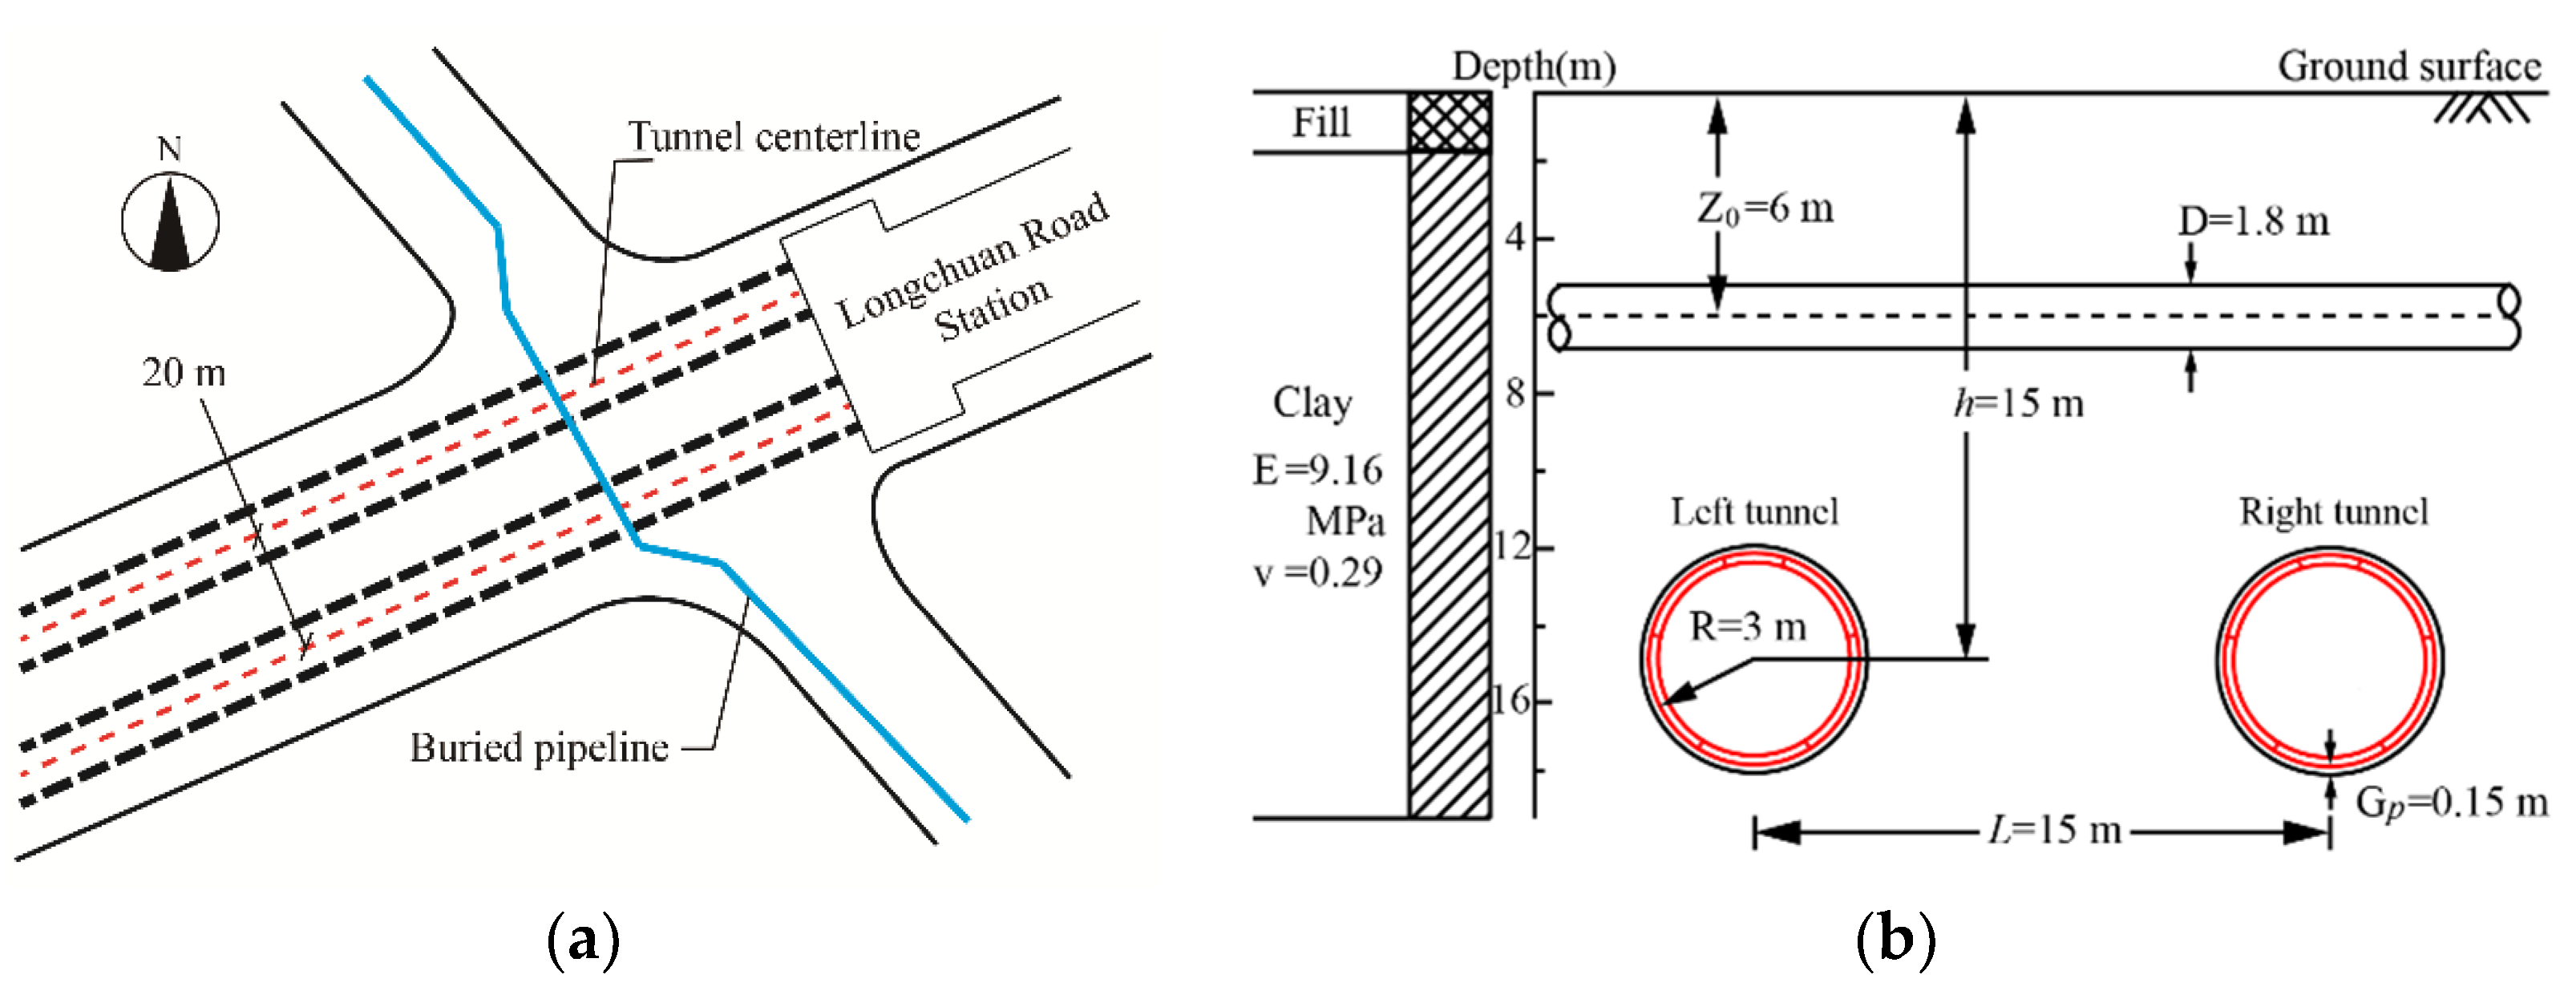
2. Project Overview
3. Numerical Simulation
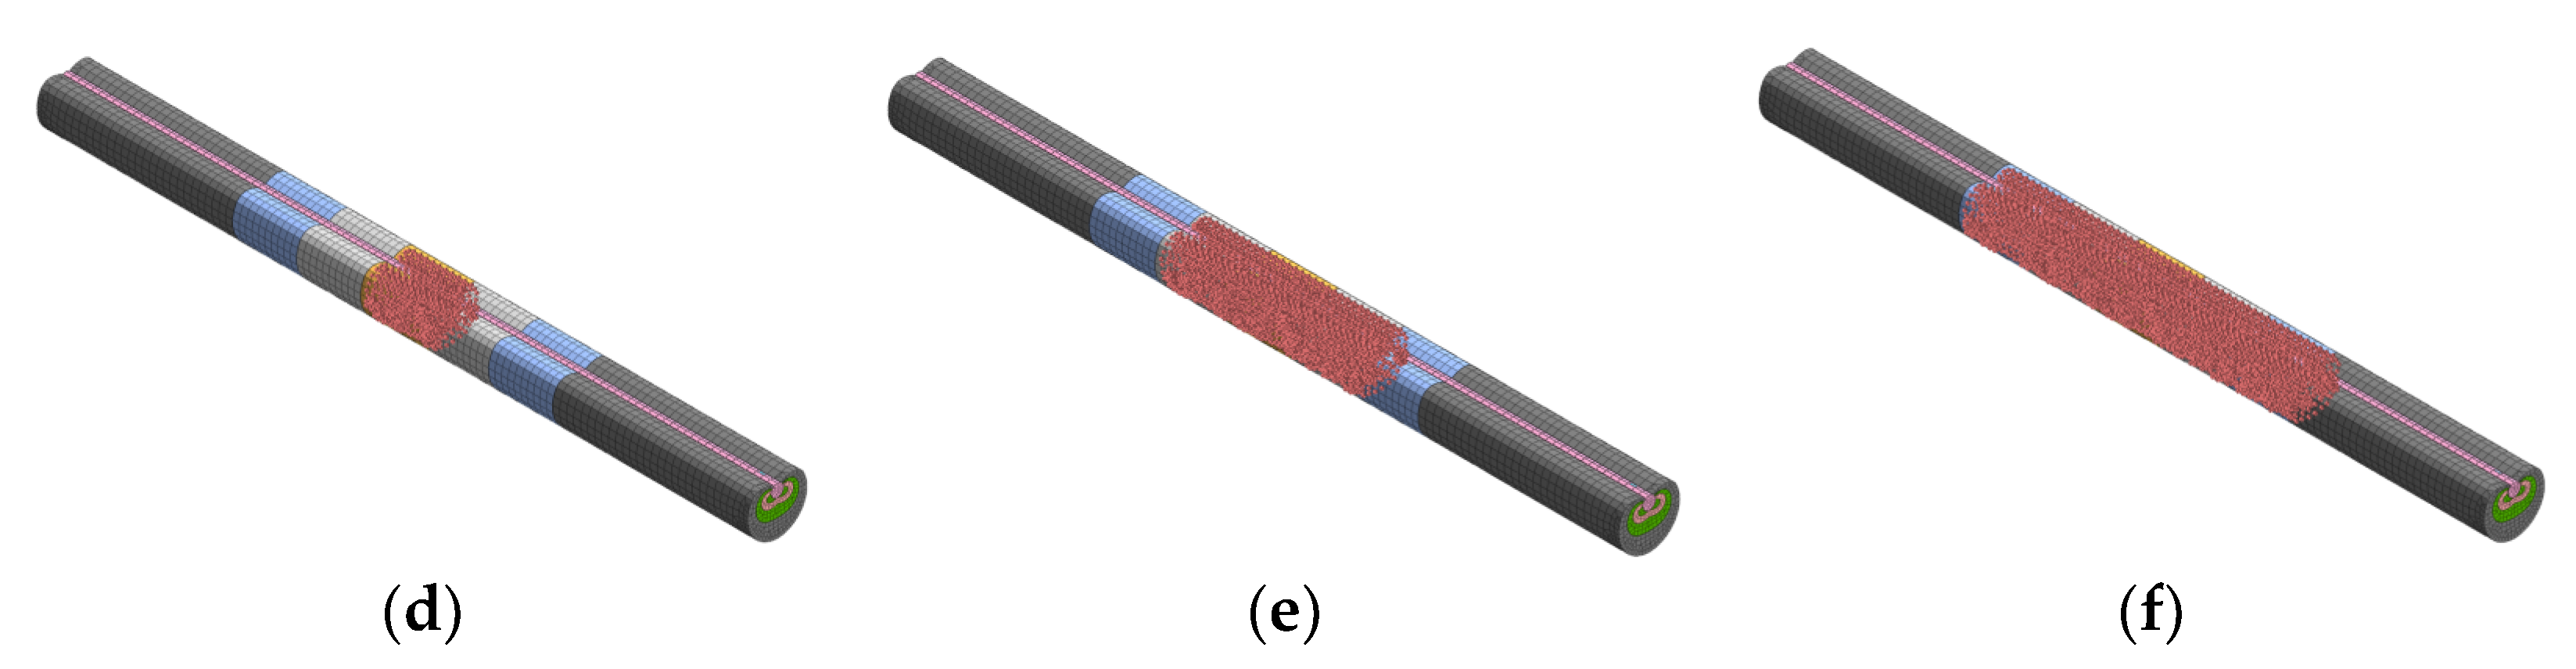
3.1. Simulation Analysis of Pipeline Leakage Diffusion
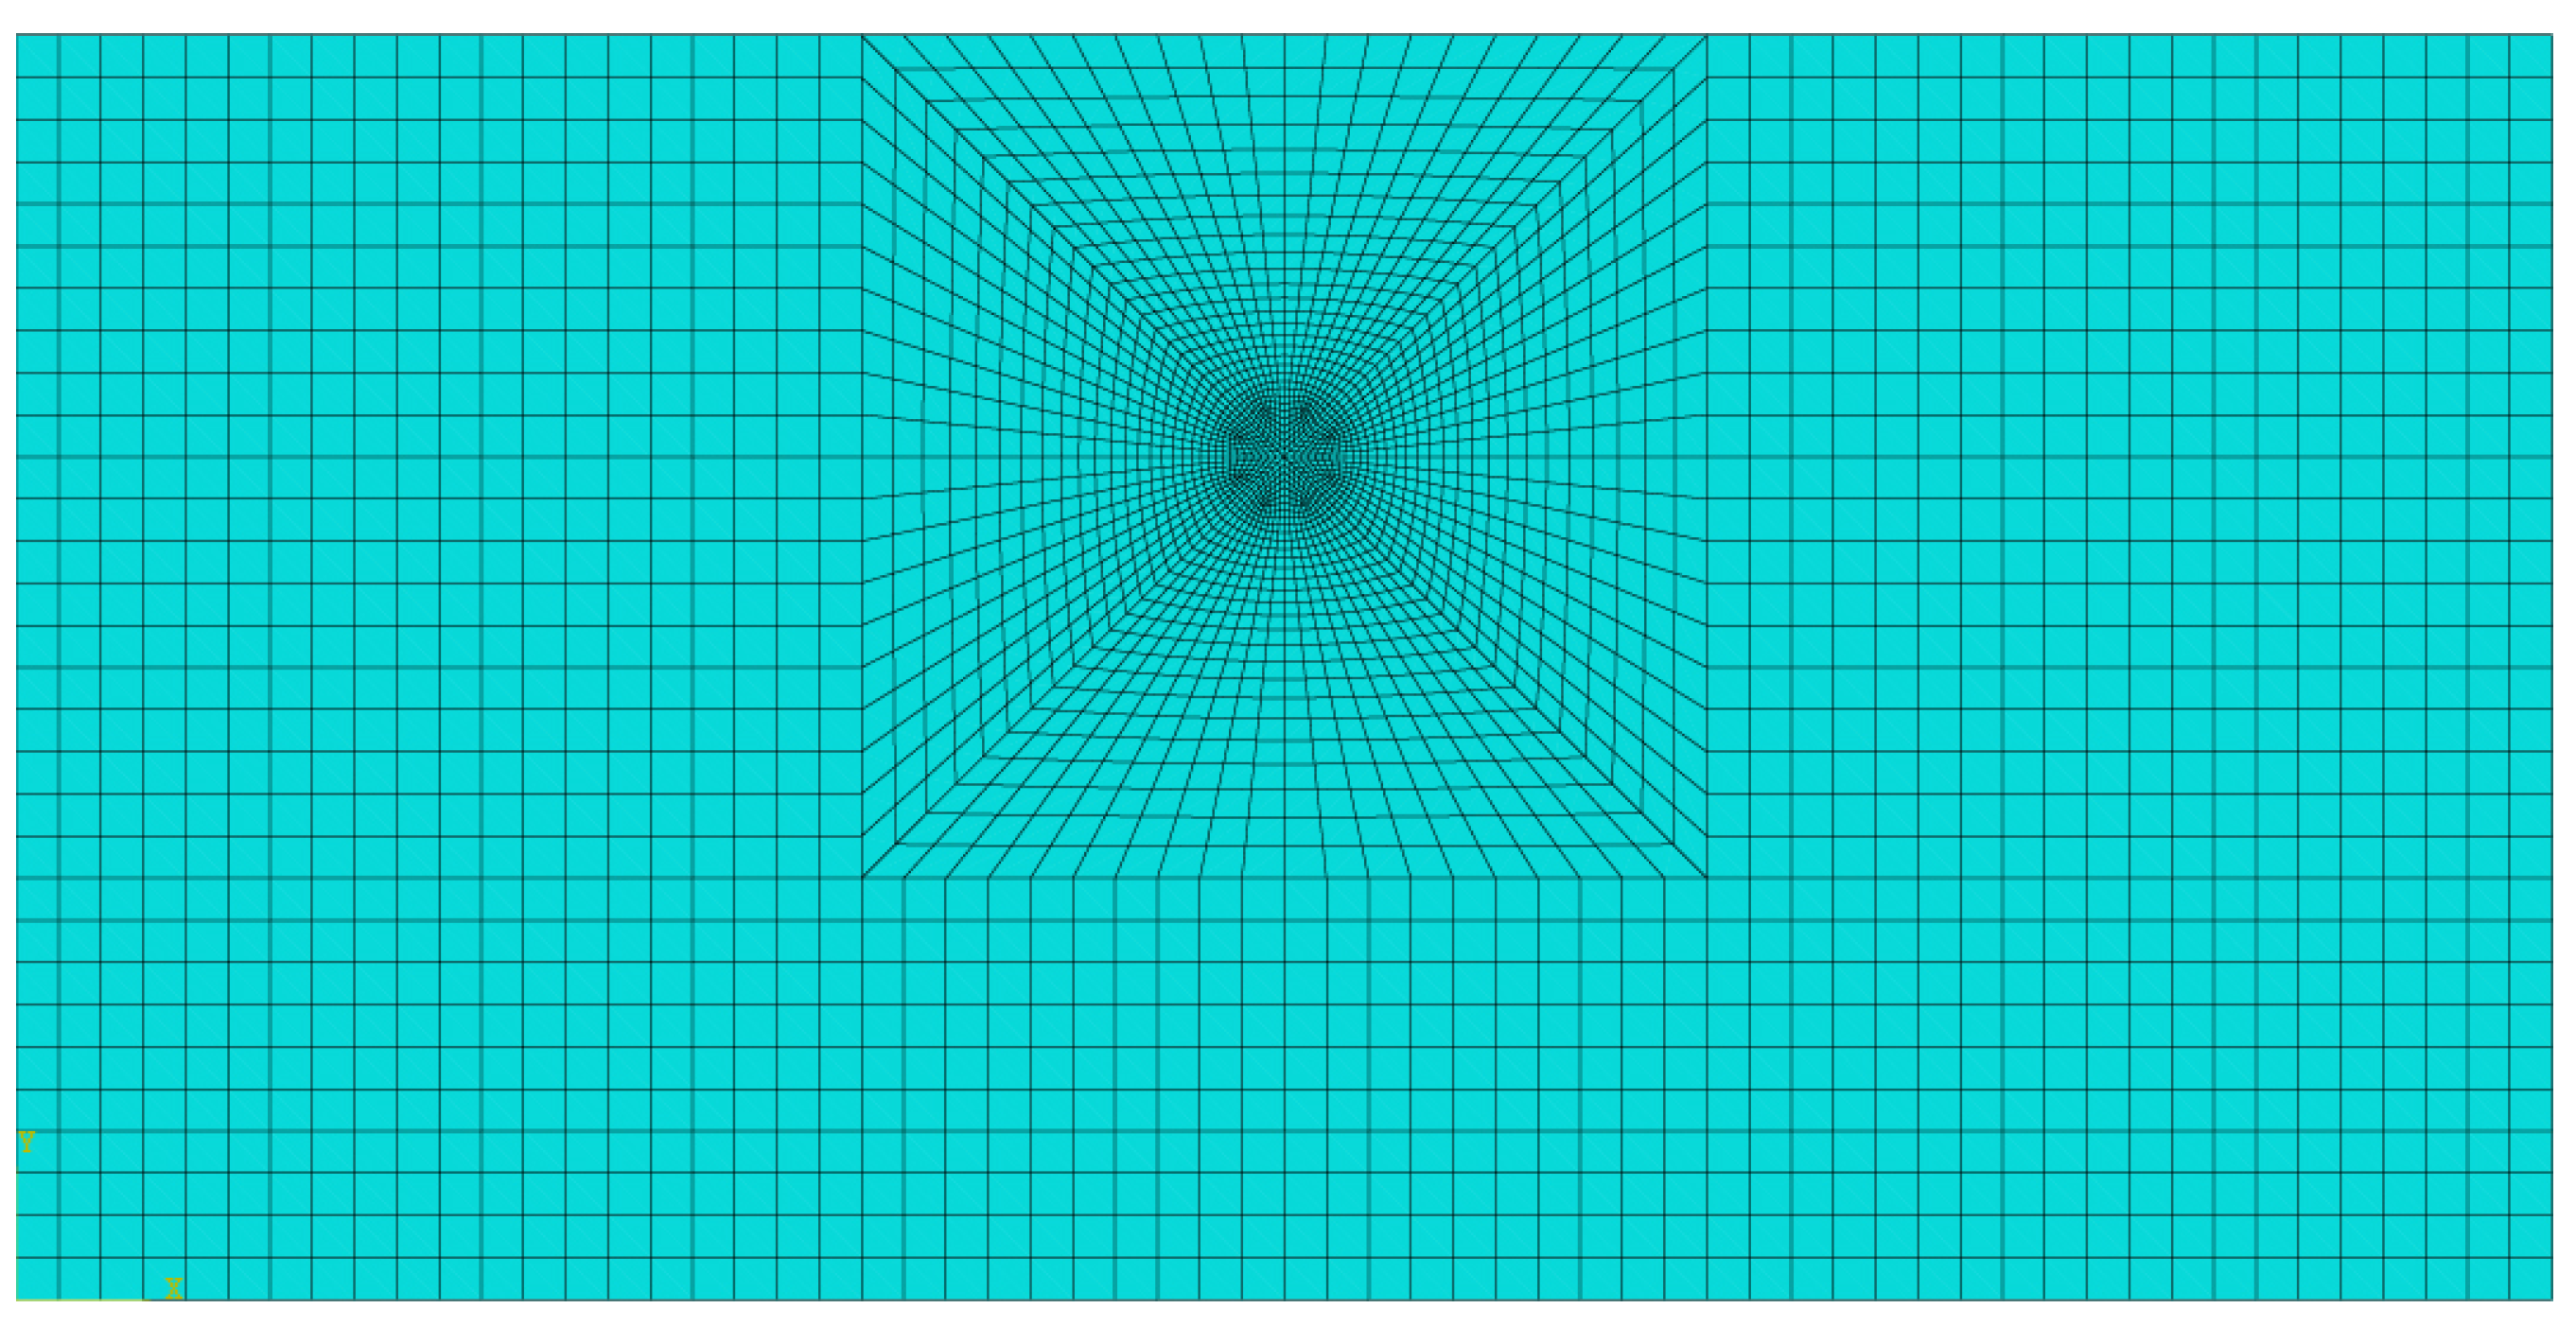
3.2. Establishment of Shield Construction Model under Pipeline Leakage
3.3. Determination of Parameters
4. Rationality Verification of the Model
4.1. Analytical Study on Ground Settlement Caused by Shield Construction Considering Multiple Factors
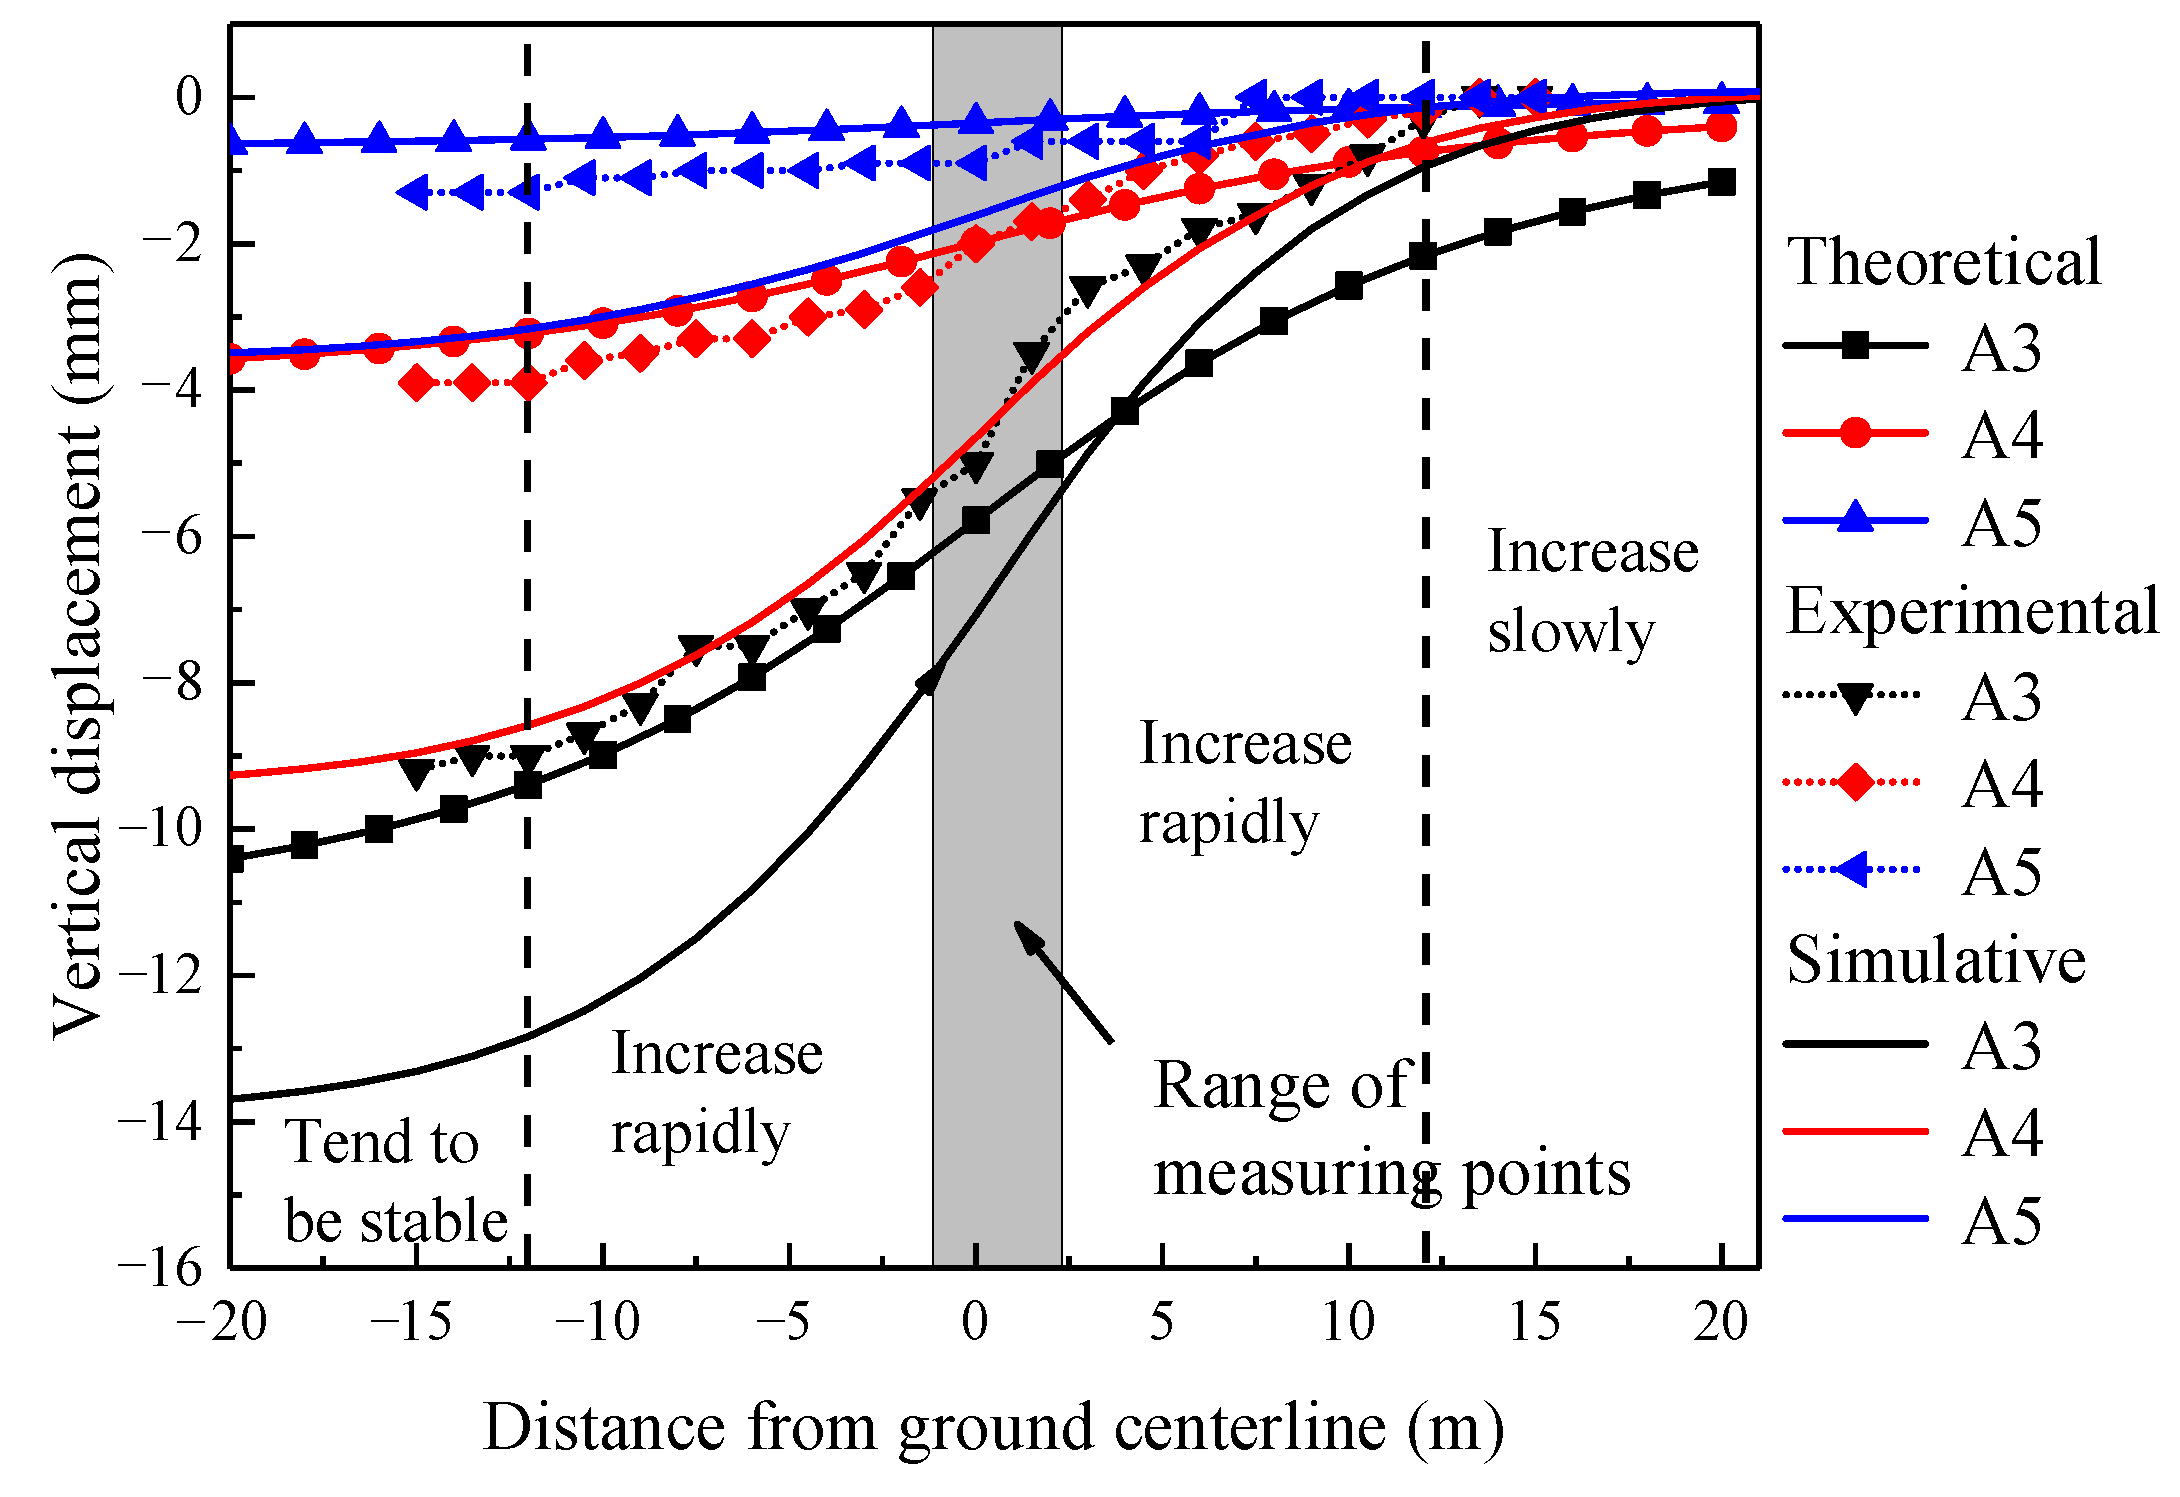
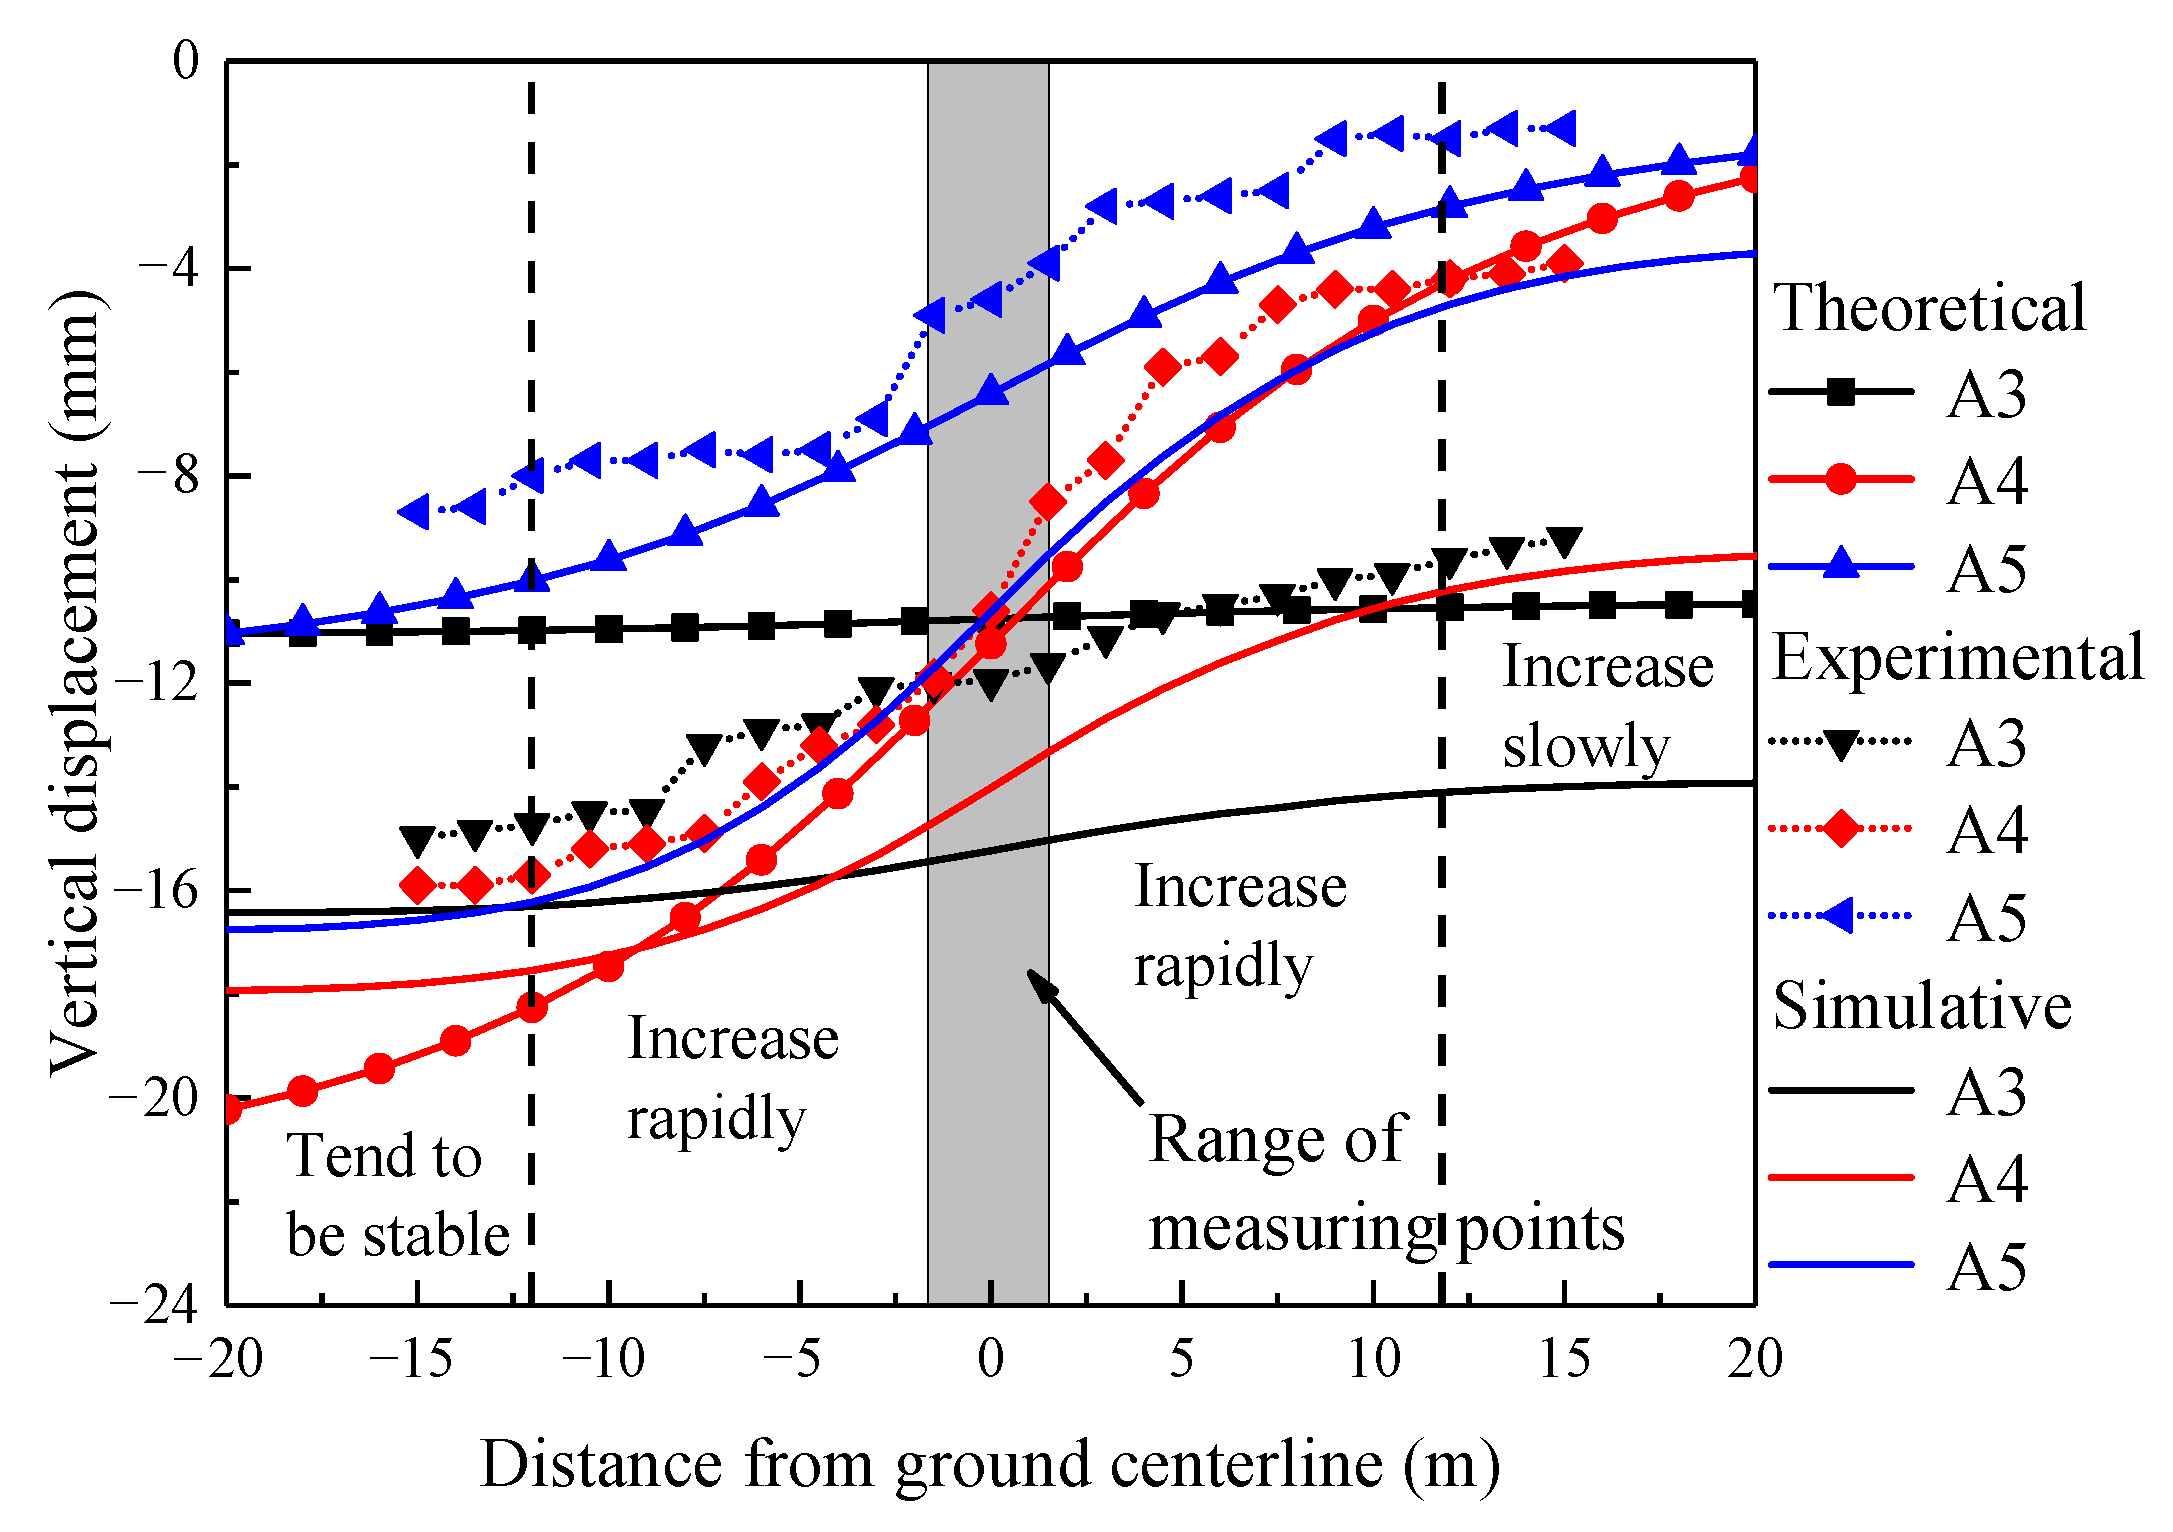
4.2. Comparison between Theoretical Analysis and Simulation Results without Leakage
5. Analysis of Influence of Pipeline Leakage Diffusion Range and Leakage Length
Change Rule of Ground Displacement under the Influence of Pipeline Leakage
6. Conclusions
- (1)
- The seepage water mainly diffuses vertically under the action of gravity. As the pipeline leakage gradually reaches the predetermined depth, the leakage diffusion range calculated by the numerical simulation tends to be consistent with that in the test results. However, owing to the existence of a large pore structure in the soil during the test, the leakage water is more likely to spread to the bottom of the pipeline under the action of gravity. Therefore, the error in the numerical simulation at the top of the pipeline is slightly larger than that at the bottom.
- (2)
- Under the condition that the pipeline does not leak, the theoretical solution is more accurate for predicting the excavation settlement of a single tunnel. In the calculations for twin tunnel excavation, the numerical simulation can consider the influence of repeated disturbances of the left and right tunnel construction, and is more accurate than the theoretical solution. Thus, the rationality of the three-dimensional calculation model is verified.
- (3)
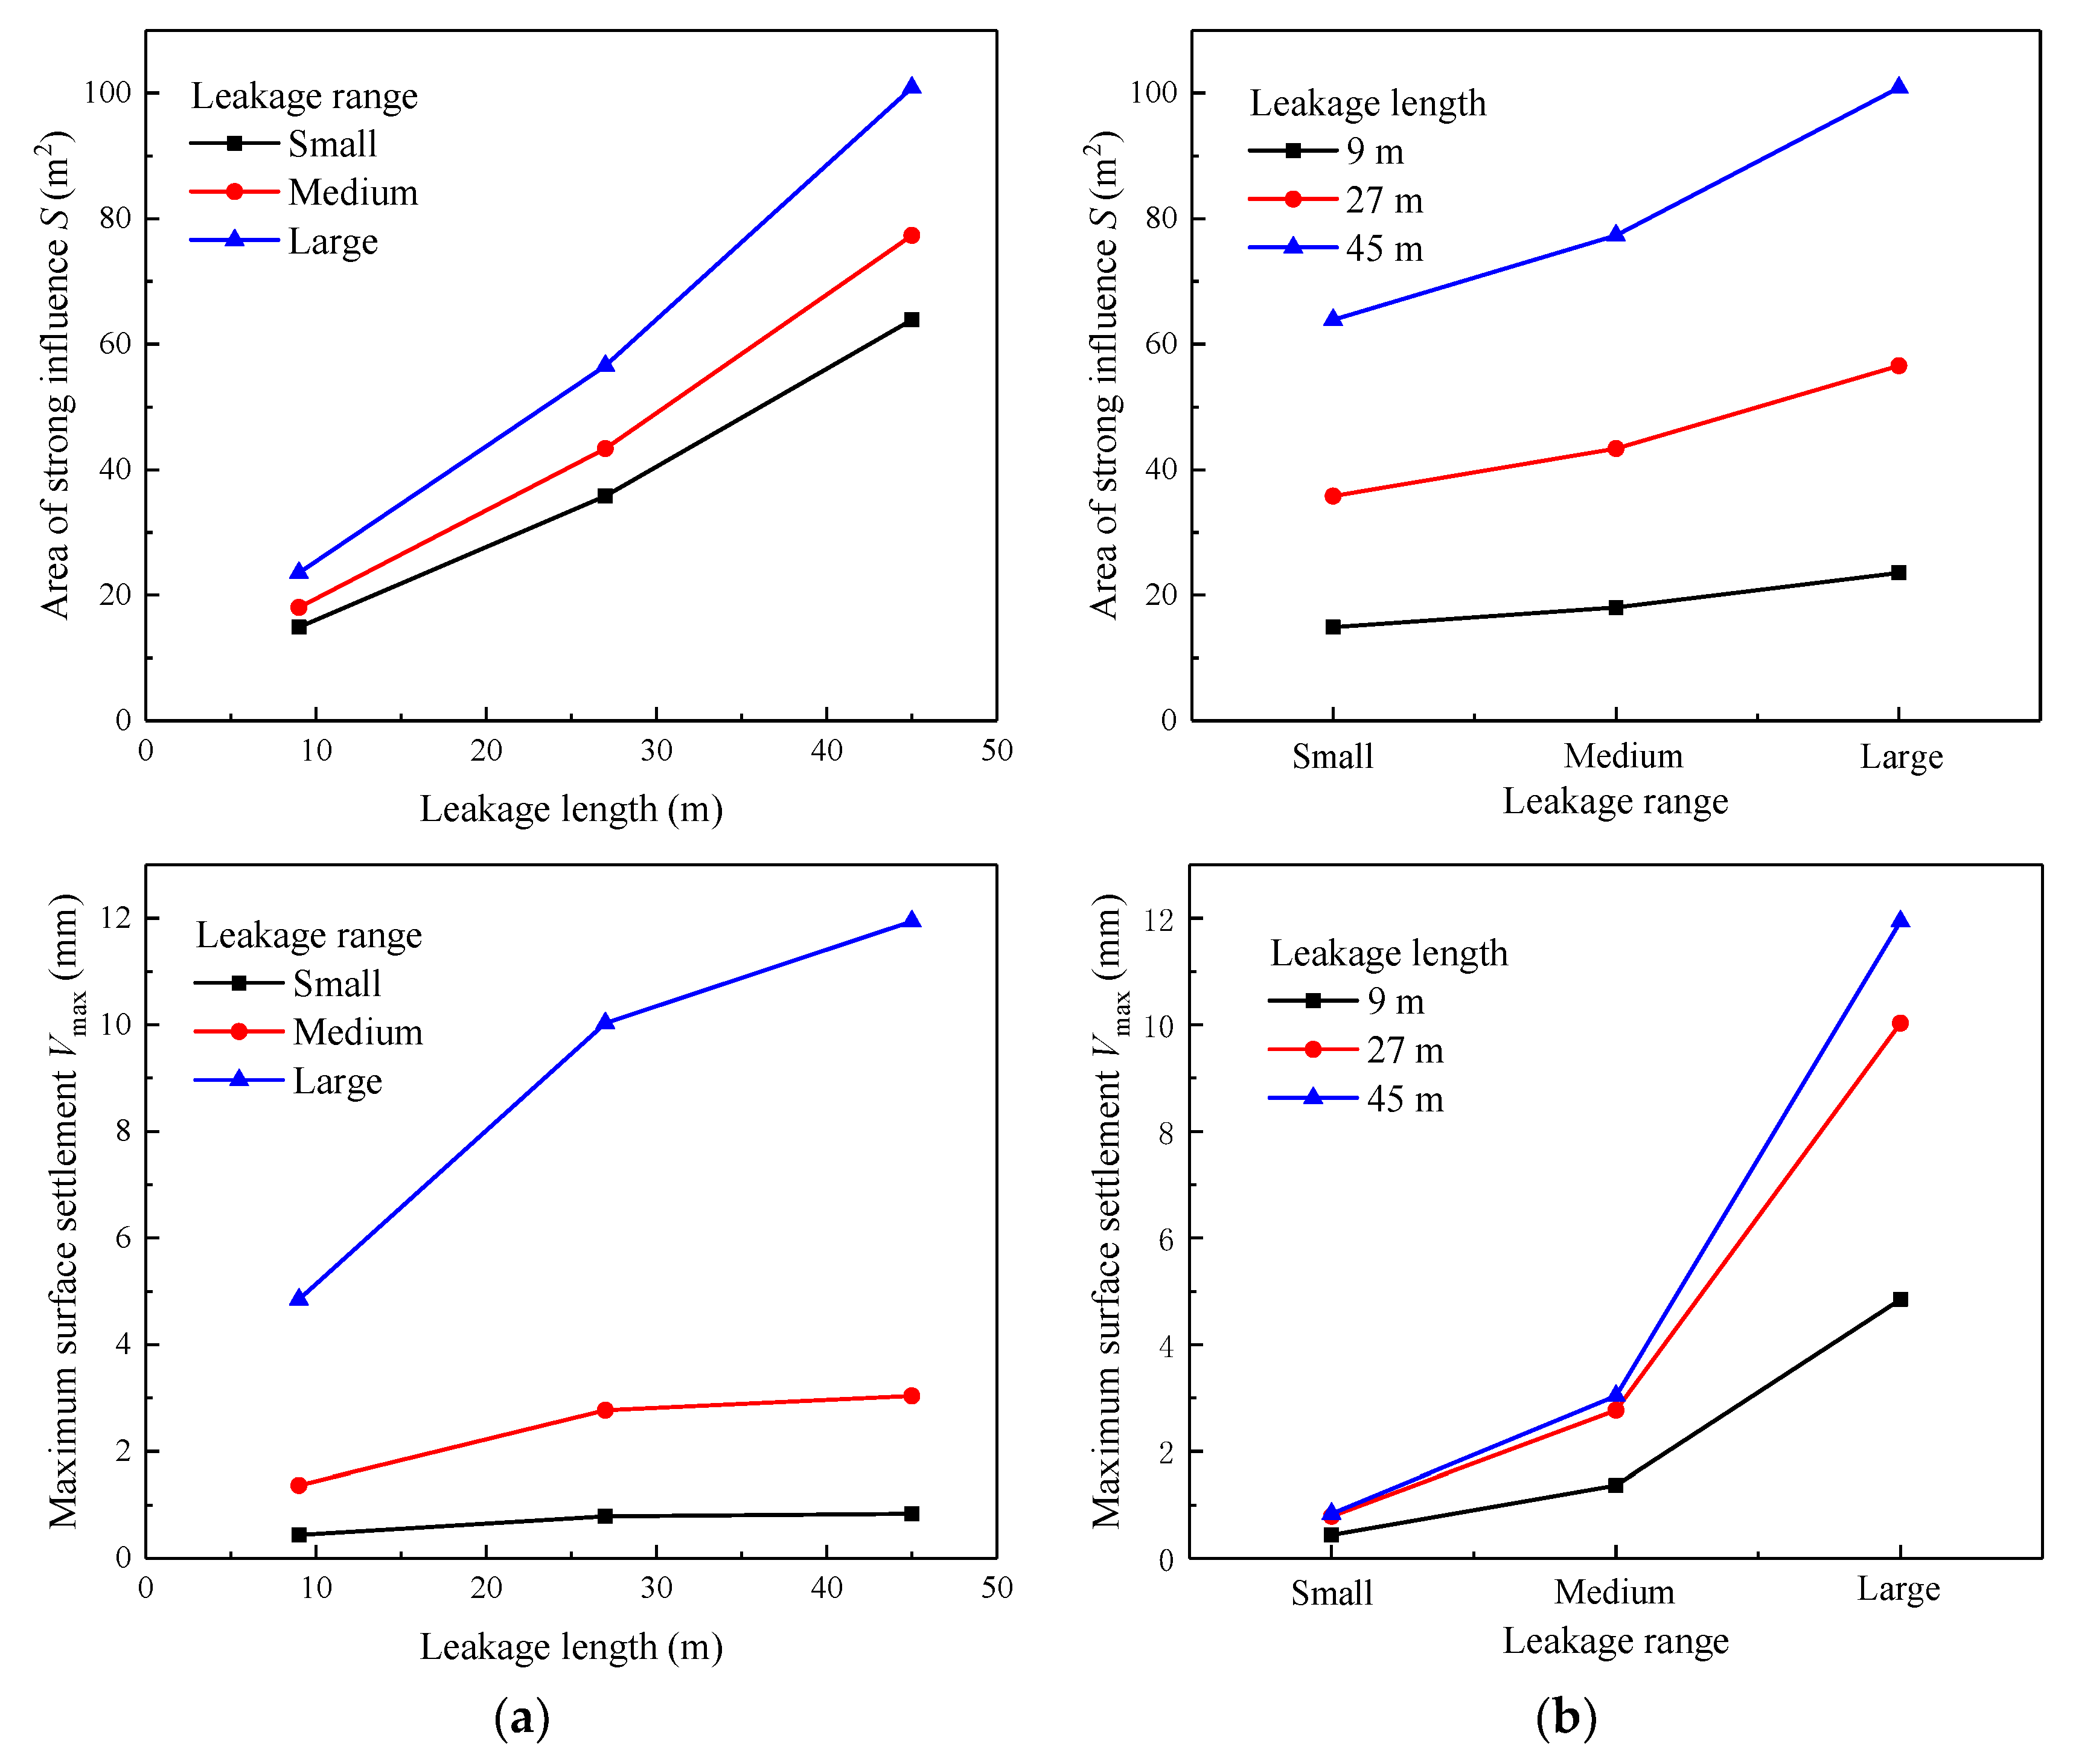
- Through an influence analysis and calculation of the leakage parameters, it can be concluded that the surface settlement caused by pipeline leakage exhibits an elliptical distribution. Increases in the leakage length and scope cause the surface settlement range to expand along the pipeline length and stratum depth, respectively. The maximum surface settlement increases with the expansion of the leakage length and leakage range, of which the leakage range is the main factor determining the maximum surface settlement.
- (4)
- For the soil displacement at different depths owing to the excavation of the double-track tunnel, the variation rule is determined by the arrangement depth of the measuring points and influence angle . The influence of leakage on the formation settlement is related to the amount of soil loss and degree of disturbance. In the same stratum, the influence of the water leakage is greater in areas with strong disturbances and large soil losses.
Author Contributions
Funding
Institutional Review Board Statement
Informed Consent Statement
Data Availability Statement
Acknowledgments
Conflicts of Interest
References
- Ni, P.; Mangalathu, S. Fragility analysis of gray iron pipelines subjected to tunneling induced ground settlement. Tunn. Undergr. Space Technol. 2018, 76, 133–144. [Google Scholar] [CrossRef]
- Shi, X.; Rong, C.; Cheng, H.; Cui, L.; Kong, J. An Energy Solution for Predicting Buried Pipeline Response Induced by Tunneling Based on a Uniform Ground Movement Model. Math. Probl. Eng. 2020, 2020, 1–12. [Google Scholar] [CrossRef]
- Yu, J.; Zhang, C.; Huang, M. Soil–pipe interaction due to tunnelling: Assessment of Winkler modulus for underground pipelines. Comput. Geotech. 2013, 50, 17–28. [Google Scholar] [CrossRef]
- Huang, M.; Zhou, X.; Yu, J.; Leung, C.; Tan, J.Q.W. Estimating the effects of tunnelling on existing jointed pipelines based on Winkler model. Tunn. Undergr. Space Technol. 2019, 86, 89–99. [Google Scholar] [CrossRef]
- Lin, C.G.; Huang, M.S.; Nadim, F.; Liu, Z. Tunnelling-induced response of buried pipelines and their effects on ground settle-ments. Tunn. Undergr. Space Technol. 2020, 96, 103193. [Google Scholar] [CrossRef]
- Lin, C.; Huang, M. Tunnelling-induced response of a jointed pipeline and its equivalence to a continuous structure. Soils Found. 2019, 59, 828–839. [Google Scholar] [CrossRef]
- Shi, J.; Wang, Y.; Ng, C.W. Numerical parametric study of tunneling-induced joint rotation angle in jointed pipelines. Can. Geotech. J. 2016, 53, 2058–2071. [Google Scholar] [CrossRef]
- Wham, B.P.; Argyrou, C.; O’Rourke, T.D. Jointed pipeline response to tunneling-induced ground deformation. Can. Geotech. J. 2016, 53, 1794–1806. [Google Scholar] [CrossRef] [Green Version]
- Shi, J.W.; Wang, Y.; Charles, W.W.N. Three-dimensional centrifuge modeling of ground and pipeline response to tunnel ex-cavation. J. Geotech. Geoenviron. Eng. 2016, 142, 04016054. [Google Scholar] [CrossRef]
- Loganathan, N.; Poulos, H.G.; Stewart, D.P. Centrifuge model testing of tunnelling-induced ground and pile deformations. Geotechnique 2000, 50, 283–294. [Google Scholar] [CrossRef]
- Ma, S.; Shao, Y.; Liu, Y.; Jiang, J.; Fan, X. Responses of pipeline to side-by-side twin tunnelling at different depths: 3D centrifuge tests and numerical modelling. Tunn. Undergr. Space Technol. 2017, 66, 157–173. [Google Scholar] [CrossRef]
- Wu, J.; Jing, H.; Gao, Y.; Meng, Q.; Yin, Q.; Du, Y. Effects of carbon nanotube dosage and aggregate size distribution on mechanical property and microstructure of cemented rockfill. Cem. Concr. Compos. 2022, 127, 104408. [Google Scholar] [CrossRef]
- Liu, X.; Zhang, Y.; Bao, Y. Full-scale experimental investigation on stagger effect of segmental tunnel linings. Tunn. Undergr. Space Technol. 2020, 102, 103423. [Google Scholar] [CrossRef]
- Vorster, T.; Assaf, K.; Kenichi, S.; Mair, R.J. Estimating the effects of tunneling on existing pipelines. J. Geotech. Geoenviron. Eng. 2005, 131, 1399–1410. [Google Scholar] [CrossRef]
- Saiyar, M.S.; Take, W.A.; Moore, I.D. Post-failure fracture angle of brittle pipes subjected to differential ground movements. Tunn. Undergr. Space Technol. 2015, 49, 114–120. [Google Scholar] [CrossRef]
- Wang, Y.; Shi, J.; Ng, C.W. Numerical modeling of tunneling effect on buried pipelines. Can. Geotech. J. 2011, 48, 1125–1137. [Google Scholar] [CrossRef]
- Shi, H.; Song, L.; Zhang, H.; Chen, W.; Lin, H.; Li, D.; Wang, G.; Zhao, H. Experimental and numerical studies on progressive debonding of grouted rock bolts. Int. J. Min. Sci. Technol. 2021, 32, 63–74. [Google Scholar] [CrossRef]
- Hou, Y.; Fang, Q.; Zhang, D.; Wong, L.N.Y. Excavation failure due to pipeline damage during shallow tunnelling in soft ground. Tunn. Undergr. Space Technol. 2015, 46, 76–84. [Google Scholar] [CrossRef]
- Zhang, C.; Zhu, J.; Huang, M.; Yu, J. Winkler load-transfer analysis for pipelines subjected to surface load. Comput. Geotech. 2019, 111, 147–156. [Google Scholar] [CrossRef]
- Wu, J.; Feng, M.; Mao, X.; Xu, J.; Zhang, W.; Ni, X.; Han, G. Particle size distribution of aggregate effects on mechanical and structural properties of cemented rockfill: Experiments and modeling. Constr. Build. Mater. 2018, 193, 295–311. [Google Scholar] [CrossRef]
- Zhang, J.; Xie, R. Numerical Analysis of Mechanical Behavior of Buried Pipes in Subsidence Area Caused by Underground Mining. J. Press. Vessel Technol. 2019, 141, 4042711. [Google Scholar] [CrossRef]
- Cocchetti, G.; di Prisco, C.; Galli, A. Soil-pipeline interaction along unstable slopes; a coupled three-dimensional approach; Part 1, Theoretical formulation. Can. Geotech. J. 2009, 46, 1289–1304. [Google Scholar] [CrossRef]
- Zhang, J.; Xie, R.; Zhang, H. Mechanical response analysis of the buried pipeline due to adjacent foundation pit excavation. Tunn. Undergr. Space Technol. 2018, 78, 135–145. [Google Scholar] [CrossRef]
- Huang, Y.F.; Rong, C.X.; Shi, X. Experiment on the influence of soil suction and shear strength of unsaturated clay. Sci. Tech. Eng. 2021, 21, 10859–10866. (In Chinese) [Google Scholar]
- Shi, X. Research on the Law of Ground Settlement and Pipeline Deformation under the Coupling Effect of Shield Construction and Adjacent Pipeline Leakage. Ph.D. Thesis, AnHui University of Science and Technology, Huainan, China, 2021. (In Chinese). [Google Scholar]
- Yin, Z. An Experimental Study of the Relationships between Color, Degree of Saturation and Matrix Suction of Unsaturated Soils. Ph.D. Thesis, Tianjin University, Tianjin, China, 2014. (In Chinese). [Google Scholar]
- Zhang, C.; Yue, Y.; Cai, Y. Influence of pipeline leakage range on ground deformation and failure during shallow tunnelling. Chin. J. Rock Mech. Eng. 2015, 34, 392–400. (In Chinese) [Google Scholar]
- Shi, X.; Rong, C.; Cheng, H.; Cui, L.; Wang, B.; Sun, S. Analysis on Deformation and Stress Characteristics of a Multibraced Pit-in-Pit Excavation in a Subway Transfer Station. Adv. Civ. Eng. 2020, 2020, 1–19. [Google Scholar] [CrossRef]
- Shi, X.; Rong, C.; Wang, H.; Cui, L.; Cai, H.; Wang, B. Analytical Study of Soil Displacement Induced by Twin Shield Tunneling in Semi-Infinite Viscoelastic Ground. Adv. Civ. Eng. 2020, 2020, 1–20. [Google Scholar] [CrossRef]
- Wongsaroj, J.; Soga, K.; Mair, R. Tunnelling-induced consolidation settlements in London Clay. Géotechnique 2013, 63, 1103–1115. [Google Scholar] [CrossRef]
- Cao, Y.; Jiang, J.; Xie, K.-H.; Huang, W.-M. Analytical solutions for nonlinear consolidation of soft soil around a shield tunnel with idealized sealing linings. Comput. Geotech. 2014, 61, 144–152. [Google Scholar] [CrossRef]


| Tunnel Radius R/m | Buried Depth of Tunnel h/m | Burial Depth of Pipeline Z0/m | Outer Diameter of Pipeline D/m | Pipeline Thickness d/m | Pipeline Stiffness EpIp/(kN·m2) | Elastic Modulus of Soil E/MPa | Poisson’s Ratio of Soil ν | Soil Loss Rate ε0 |
|---|---|---|---|---|---|---|---|---|
| 3 | 15 | 6 | 1.8 | 0.18 | 1.82 × 10⁷ | 9.16 | 0.29 | 0.0184 |
| Soil Name | γ: kN/m3 | C′: kPa | Φ′: Degrees | K0 | ES: MPa |
|---|---|---|---|---|---|
| Fill | 18.8 | 10 | 8 | 0.65 | 8 |
| Medium clay | 19.5 | 55 | 14 | 0.39 | 12 |
| Stiff clay | 19.9 | 36 | 16 | 0.38 | 13 |
| Fully weathered sandy mudstone | 19.0 | 35 | 18 | 0.38 | - |
| Strongly weathered sandy mudstone | 21.3 | 45 | 20 | 0.32 | 27.86 |
| Moderately weathered sandy mudstone | 21.7 | 50 | 25 | - | 33.64 |
| Type | Initial Stress Distribution | Initial Pore Pressure (kPa) | Initial Saturation | Initial Void Ratio |
|---|---|---|---|---|
| 3 | 15 | 6 | 1.8 | 0.18 |
| Shear Strength Parameters | Saturation | |||||||
|---|---|---|---|---|---|---|---|---|
| 30% | 40% | 50% | 60% | 70% | 80% | 90% | 100% | |
| /kPa | 11.81 | 32.13 | 65.51 | 72.24 | 62.33 | 45.23 | 29.59 | 14.21 |
| /(°) | 32.5 | 29.27 | 26 | 22.72 | 19.45 | 16.18 | 12.91 | 9.64 |
| Parameters | Unit | Fill | Medium Clay | Stiff Clay | Strongly Weathered Sandy Mudstone | Moderately Weathered Sandy Mudstone |
|---|---|---|---|---|---|---|
| 18.8 | 19.5 | 19.9 | 21.3 | 21.7 | ||
| 18.8 | 19.5 | 19.9 | 21.3 | 21.7 | ||
| 10 | 55 | 36 | 45 | 50 | ||
| ° | 8 | 14 | 16 | 20 | 25 | |
| - | 0.65 | 0.39 | 0.38 | 0.32 | 0.30 | |
| ° | 0 | 0 | 0 | 0 | 0 | |
| 8054 | 12,167 | 13,286 | 27,860 | 33,640 | ||
| 8054 | 12,167 | 13,286 | 27,860 | 33,640 | ||
| - | 0.8 | 0.8 | 0.8 | 0.5 | 0.5 | |
| 24,162 | 36,501 | 39,858 | 83,580 | 100,920 | ||
| - | 0.2 | 0.2 | 0.2 | 0.2 | 0.2 | |
| 100 | 100 | 100 | 100 | 100 | ||
| - | 0.9 | 0.9 | 0.9 | 0.9 | 0.9 | |
| 8054 | 12,167 | 13,286 | 27,860 | 33,640 | ||
| - | 0.8 | 0.7 | 0.6 | 0.5 | 0.5 |
| Leakage Length | 9 m | 27 m | 45 m | |
|---|---|---|---|---|
| Leakage Range | ||||
| Small range | 1 | 2 | 3 | |
| Medium range | 4 | 5 | 6 | |
| Large range | 7 | 8 | 9 | |
| Leakage Ranges | Depth of Measuring Points/m | Single Tunnel Construction Completed | Twin Tunnel Construction Completed | ||||
|---|---|---|---|---|---|---|---|
| Axis 3 | Axis 4 | Axis 5 | Axis 3 | Axis 4 | Axis 5 | ||
| Small | 0 | −15 | −9.7 | −4.6 | −17.4 | −19 | −17.7 |
| 3 | −14.6 | −10.3 | −4.4 | −16.7 | −18.7 | −17.2 | |
| 9.9 | −16.7 | −5 | −1.2 | −17.7 | −9.7 | −18.1 | |
| Medium | 0 | −17.9 | −13.5 | −7.2 | −20.4 | −22.2 | −20.7 |
| 3 | −17.4 | −13.2 | −6.9 | −19.9 | −21.6 | −20.3 | |
| 9.9 | −18.8 | −4.9 | −1.3 | −21 | −9.9 | −21.5 | |
| Large | 0 | −29 | −24.7 | −17.1 | −32.4 | −36 | −34 |
| 3 | −28.4 | −24.2 | −16.6 | −31.3 | −35.5 | −33.4 | |
| 9.9 | −31.1 | −6.3 | −1.4 | −34.7 | −11 | −34.9 | |
| Leakage Lengths/m | Depth of Measuring Points/m | Single Tunnel Construction Completed | Twin Tunnel Construction Completed | ||||
|---|---|---|---|---|---|---|---|
| Axis 3 | Axis 4 | Axis 5 | Axis 3 | Axis 4 | Axis 5 | ||
| 9 | 0 | −18.2 | −16.5 | −7.4 | −21.2 | −26.9 | −21.9 |
| 3 | −17.3 | −16.2 | −6.9 | −19.8 | −26.4 | −20.4 | |
| 9.9 | −18.9 | −4.5 | −3 | −21.3 | −8.9 | −22.2 | |
| 27 | 0 | −25.8 | −22.8 | −14.2 | −29.1 | −33.9 | −30.6 |
| 3 | −25.2 | −22.3 | −14 | −28.3 | −33.4 | −30 | |
| 9.9 | −26.7 | −5.4 | −0.7 | −30.2 | −10.1 | −31 | |
| 45 | 0 | −29 | −24.7 | −17.1 | −32.4 | −36 | −34 |
| 3 | −28.4 | −24.2 | −16.6 | −31.3 | −35.5 | −33.4 | |
| 9.9 | −31.1 | −6.3 | −1.4 | −34.7 | −11 | −34.9 | |
Publisher’s Note: MDPI stays neutral with regard to jurisdictional claims in published maps and institutional affiliations. |
© 2022 by the authors. Licensee MDPI, Basel, Switzerland. This article is an open access article distributed under the terms and conditions of the Creative Commons Attribution (CC BY) license (https://creativecommons.org/licenses/by/4.0/).
Share and Cite
Shi, X.; Cao, Y.; Rong, C.; An, G.; Wang, H.; Cui, L. Influence of Pipeline Leakage on the Ground Settlement around the Tunnel during Shield Tunneling. Sustainability 2022, 14, 16802. https://doi.org/10.3390/su142416802
Shi X, Cao Y, Rong C, An G, Wang H, Cui L. Influence of Pipeline Leakage on the Ground Settlement around the Tunnel during Shield Tunneling. Sustainability. 2022; 14(24):16802. https://doi.org/10.3390/su142416802
Chicago/Turabian StyleShi, Xin, Yi Cao, Chuanxin Rong, Gangjian An, Houliang Wang, and Linzhao Cui. 2022. "Influence of Pipeline Leakage on the Ground Settlement around the Tunnel during Shield Tunneling" Sustainability 14, no. 24: 16802. https://doi.org/10.3390/su142416802