
Life Cycle Sustainability Assessment of Single Stream and Multi-Stream Waste Recycling Systems
Abstract
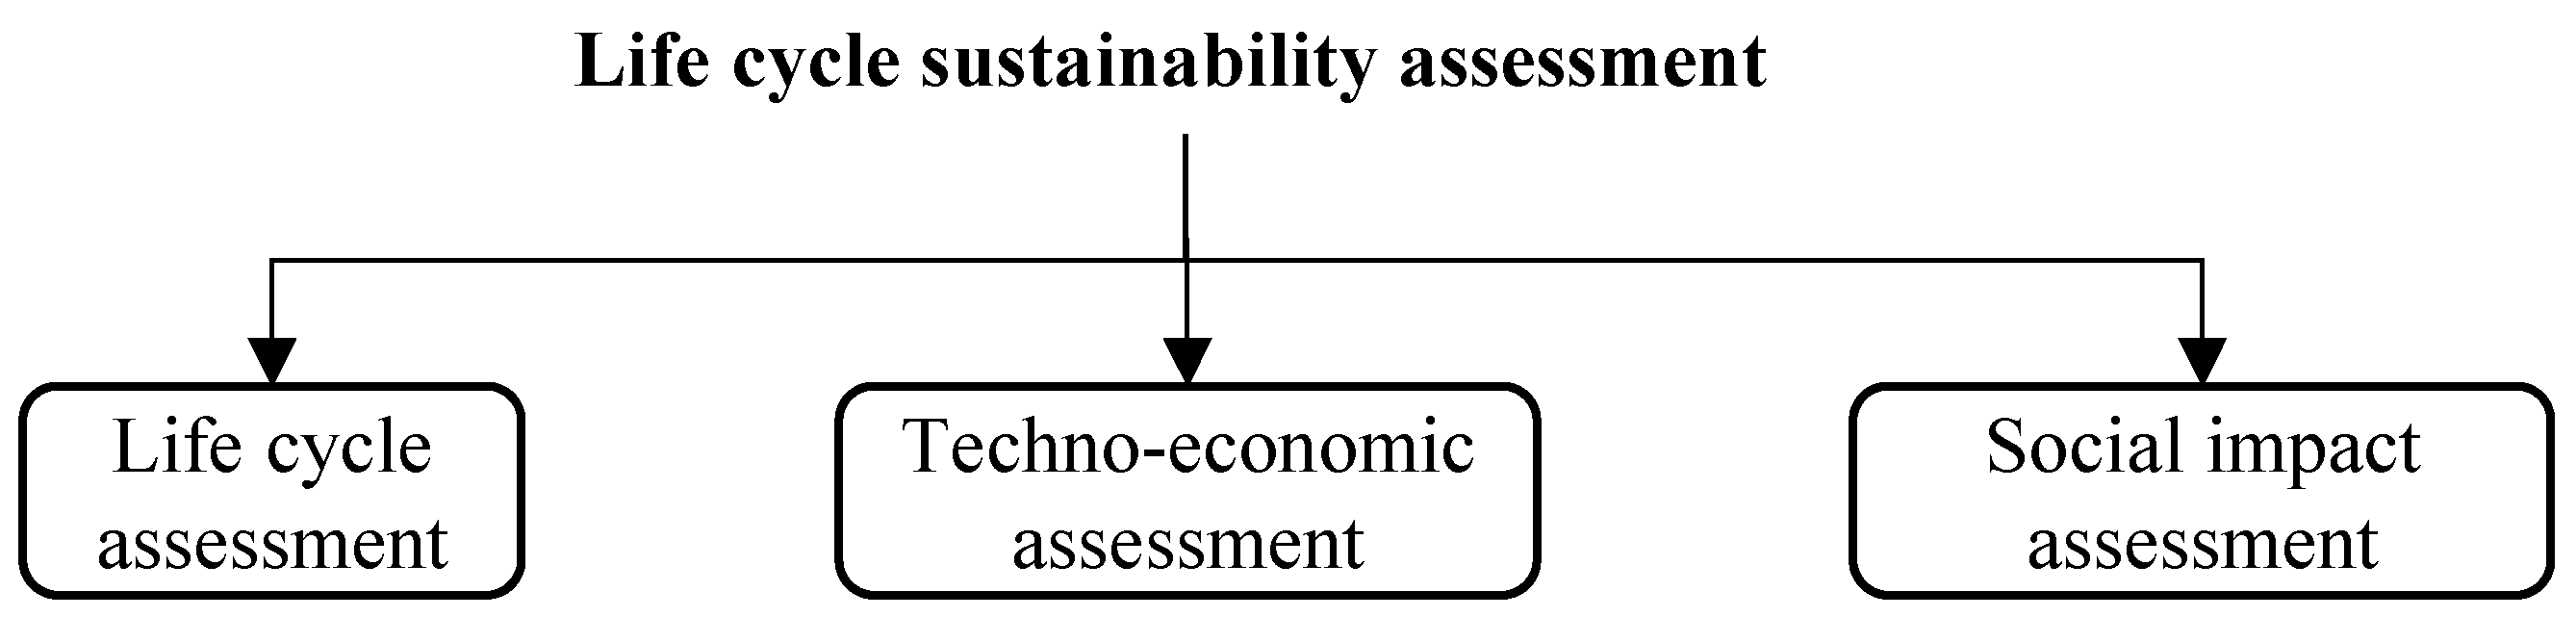
:1. Introduction
2. Literature Review
3. Methodology
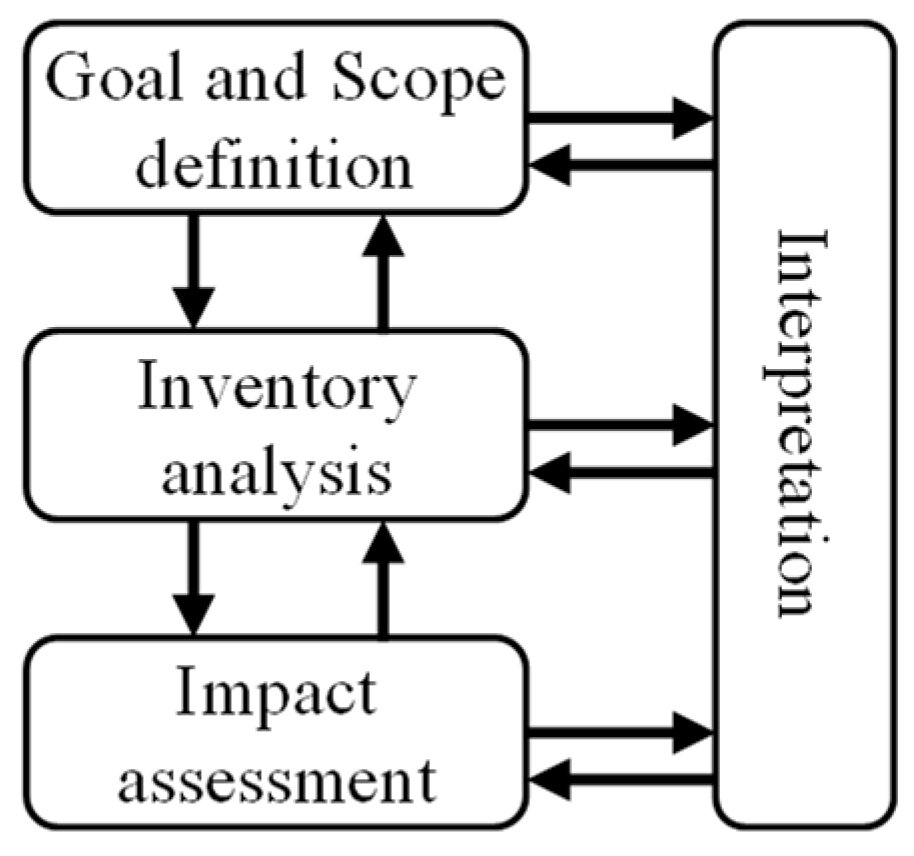
3.1. Life Cycle Assessment
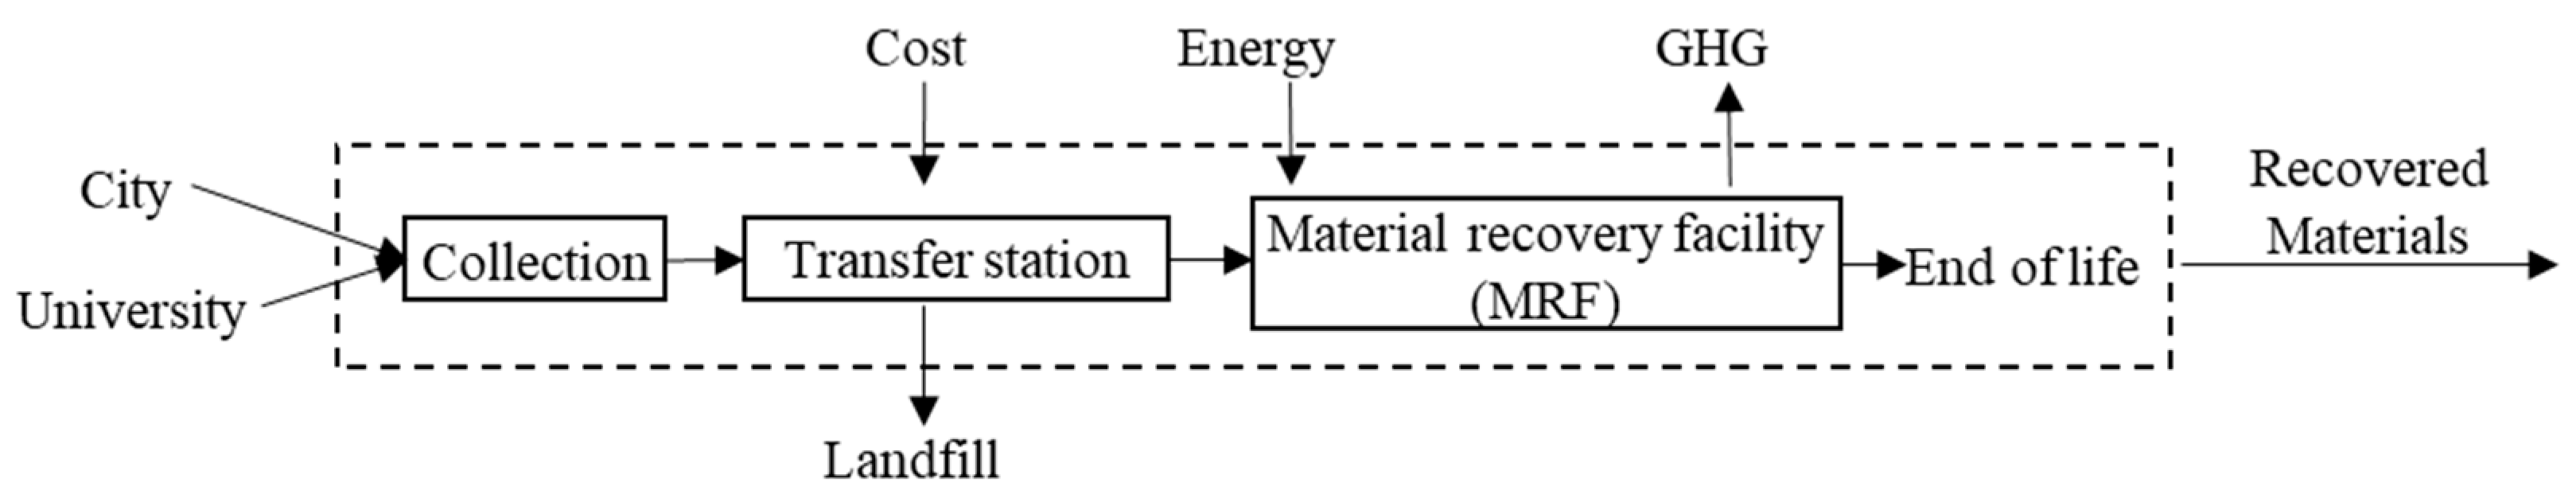
3.1.1. Goal and Scope Definition
3.1.2. Life Cycle Inventory
- Waste Component
- b.
- Collection and Transportation (City Single-Stream vs University Multi-Stream)
- c.
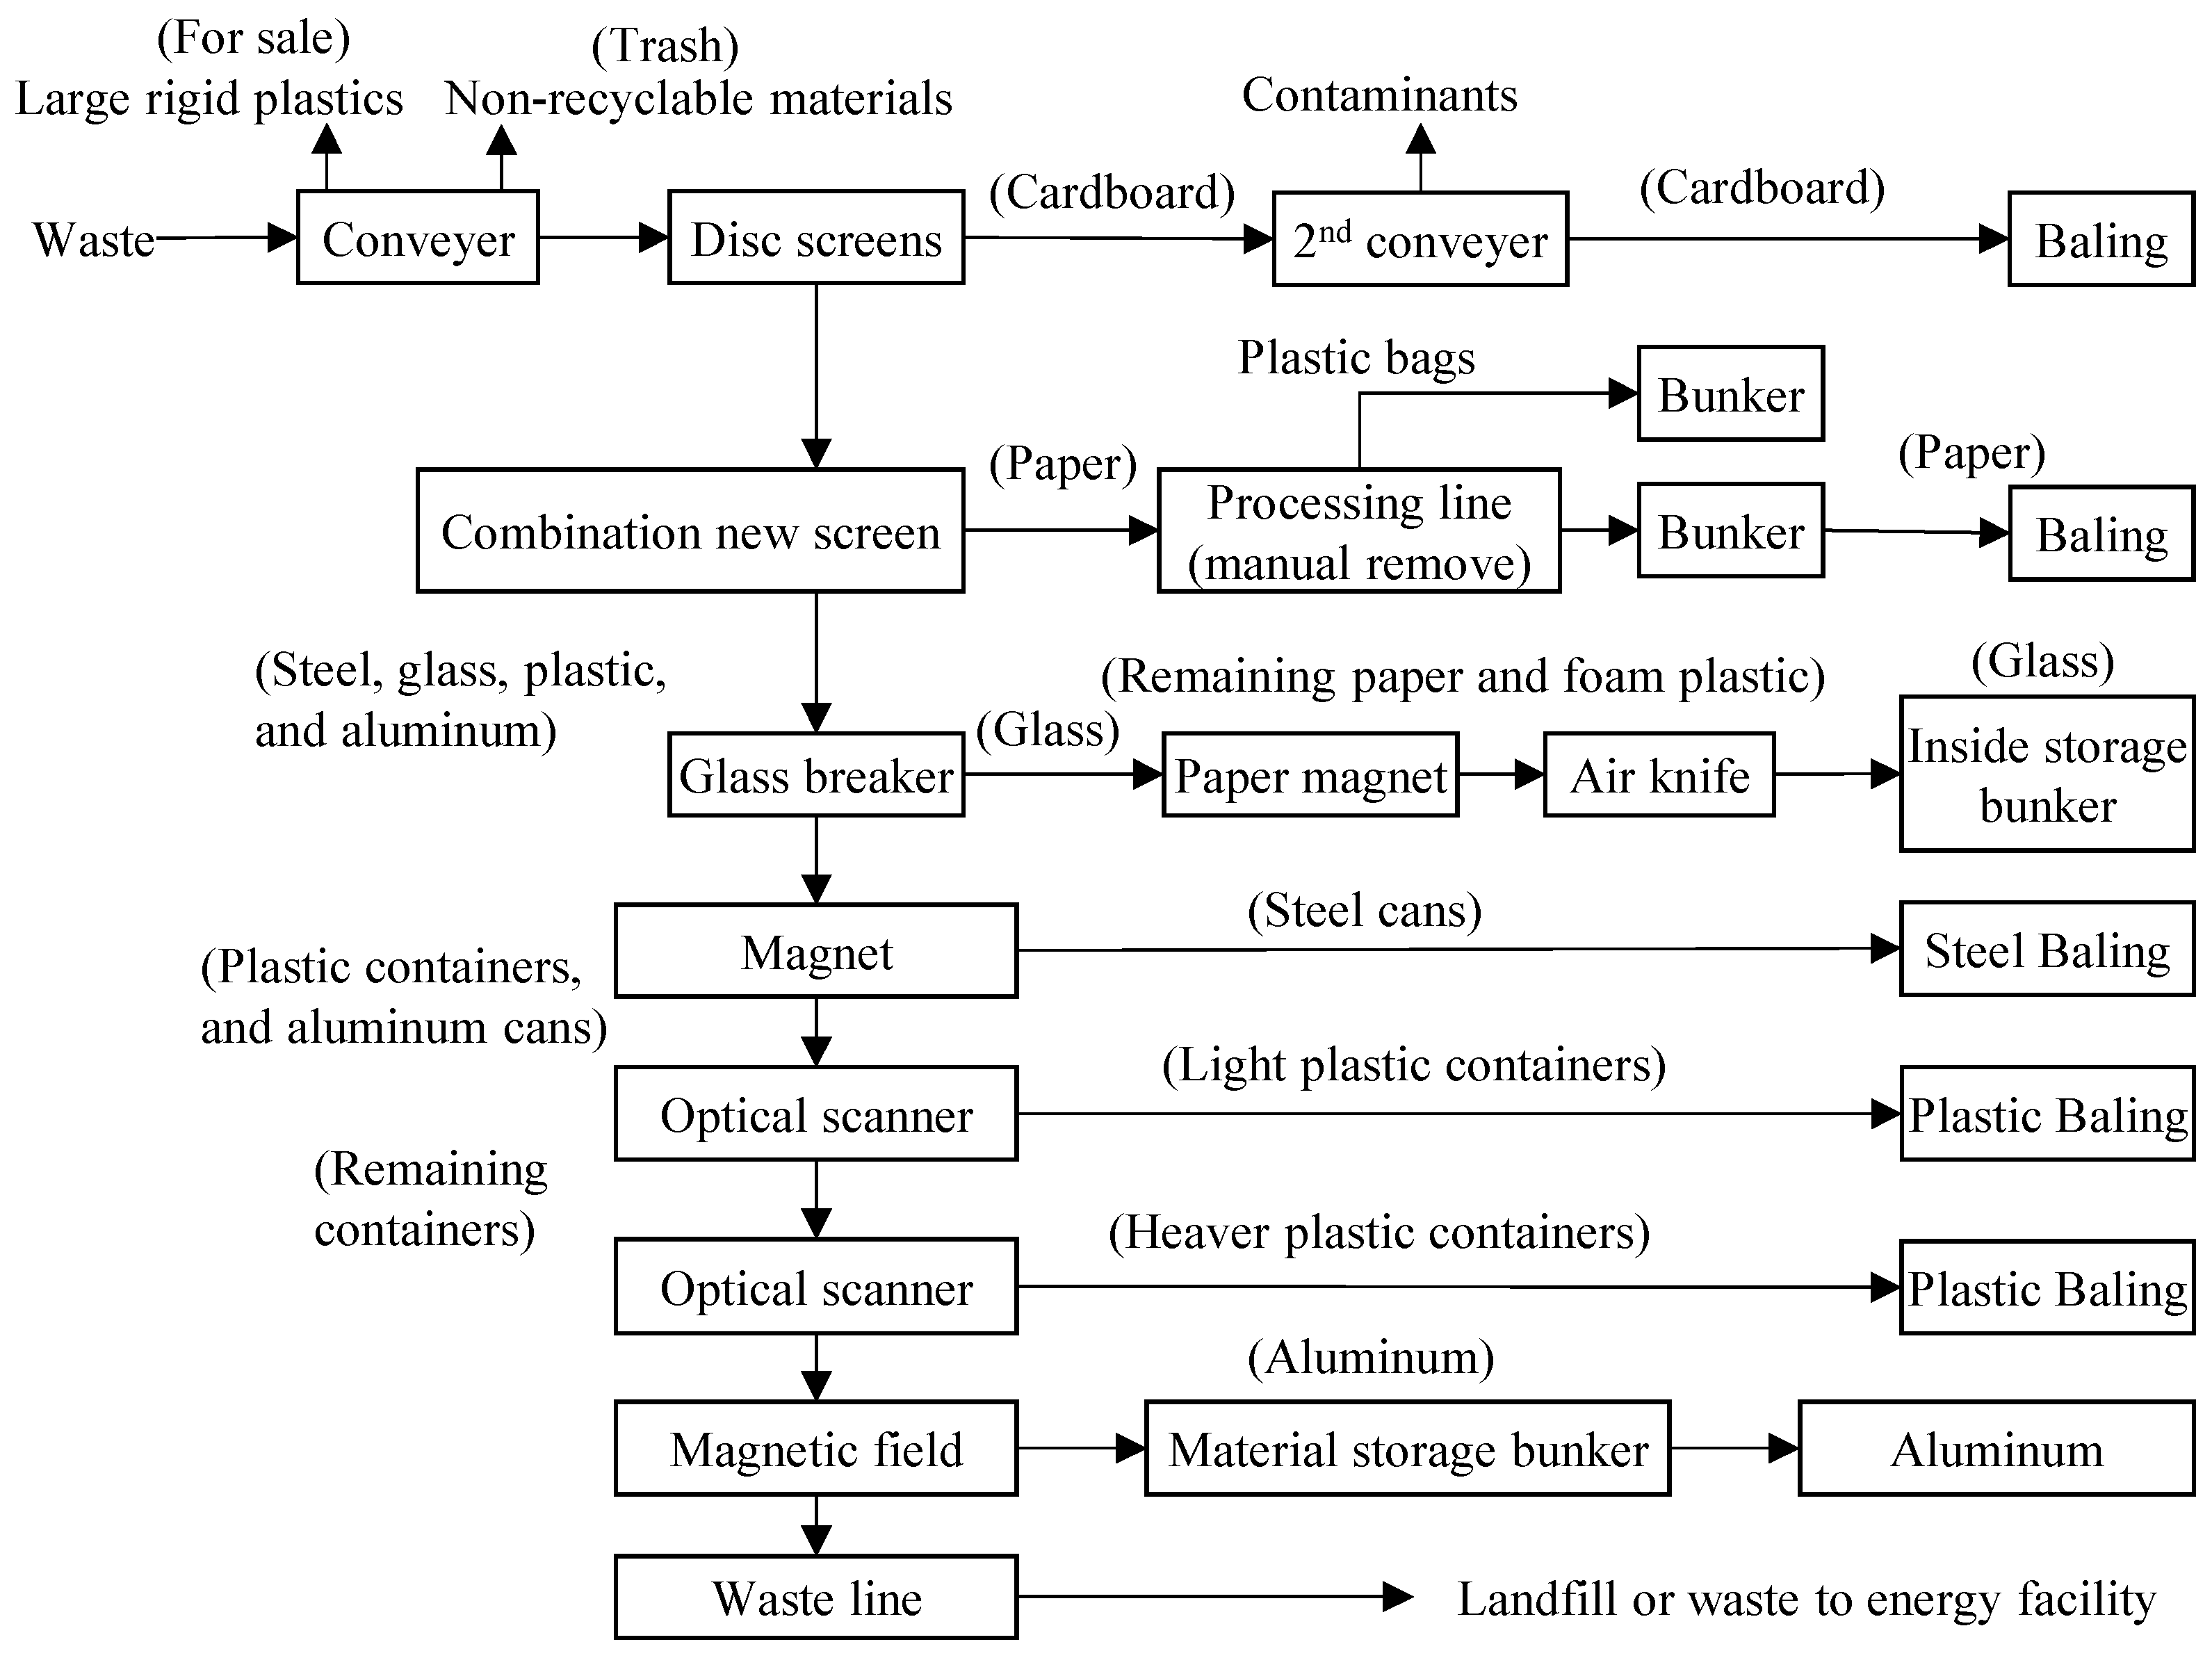
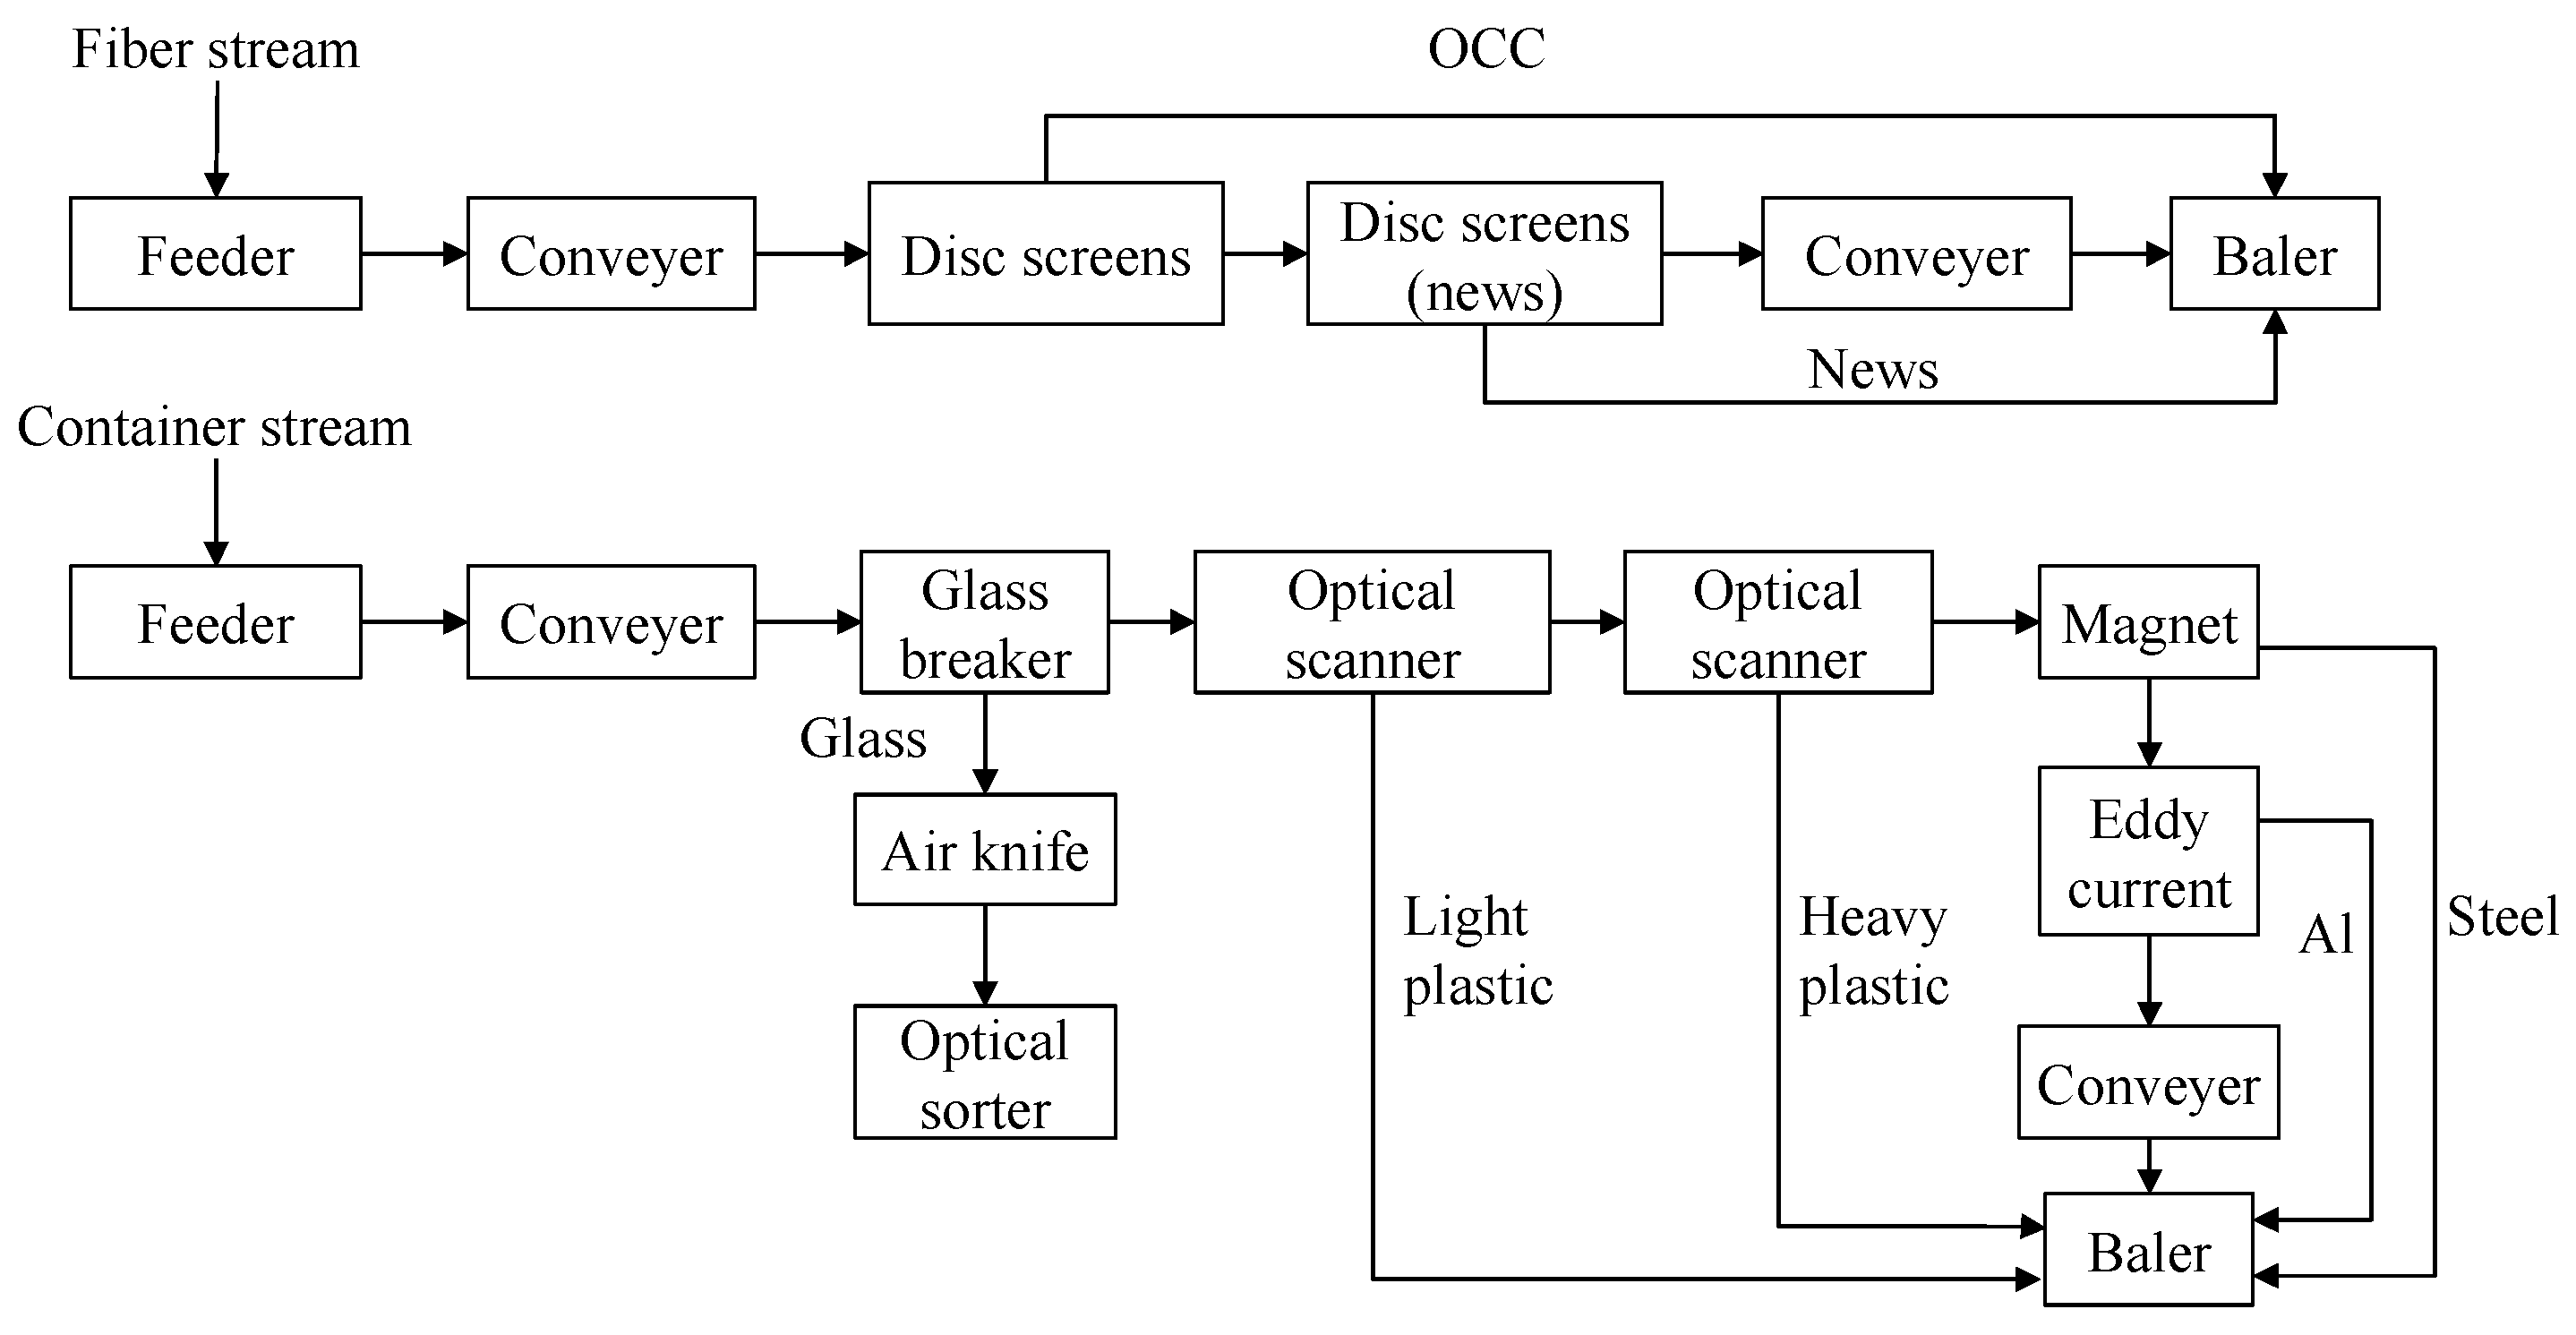
- Material Recovery Facility
- d.
- End of Life
4. Results
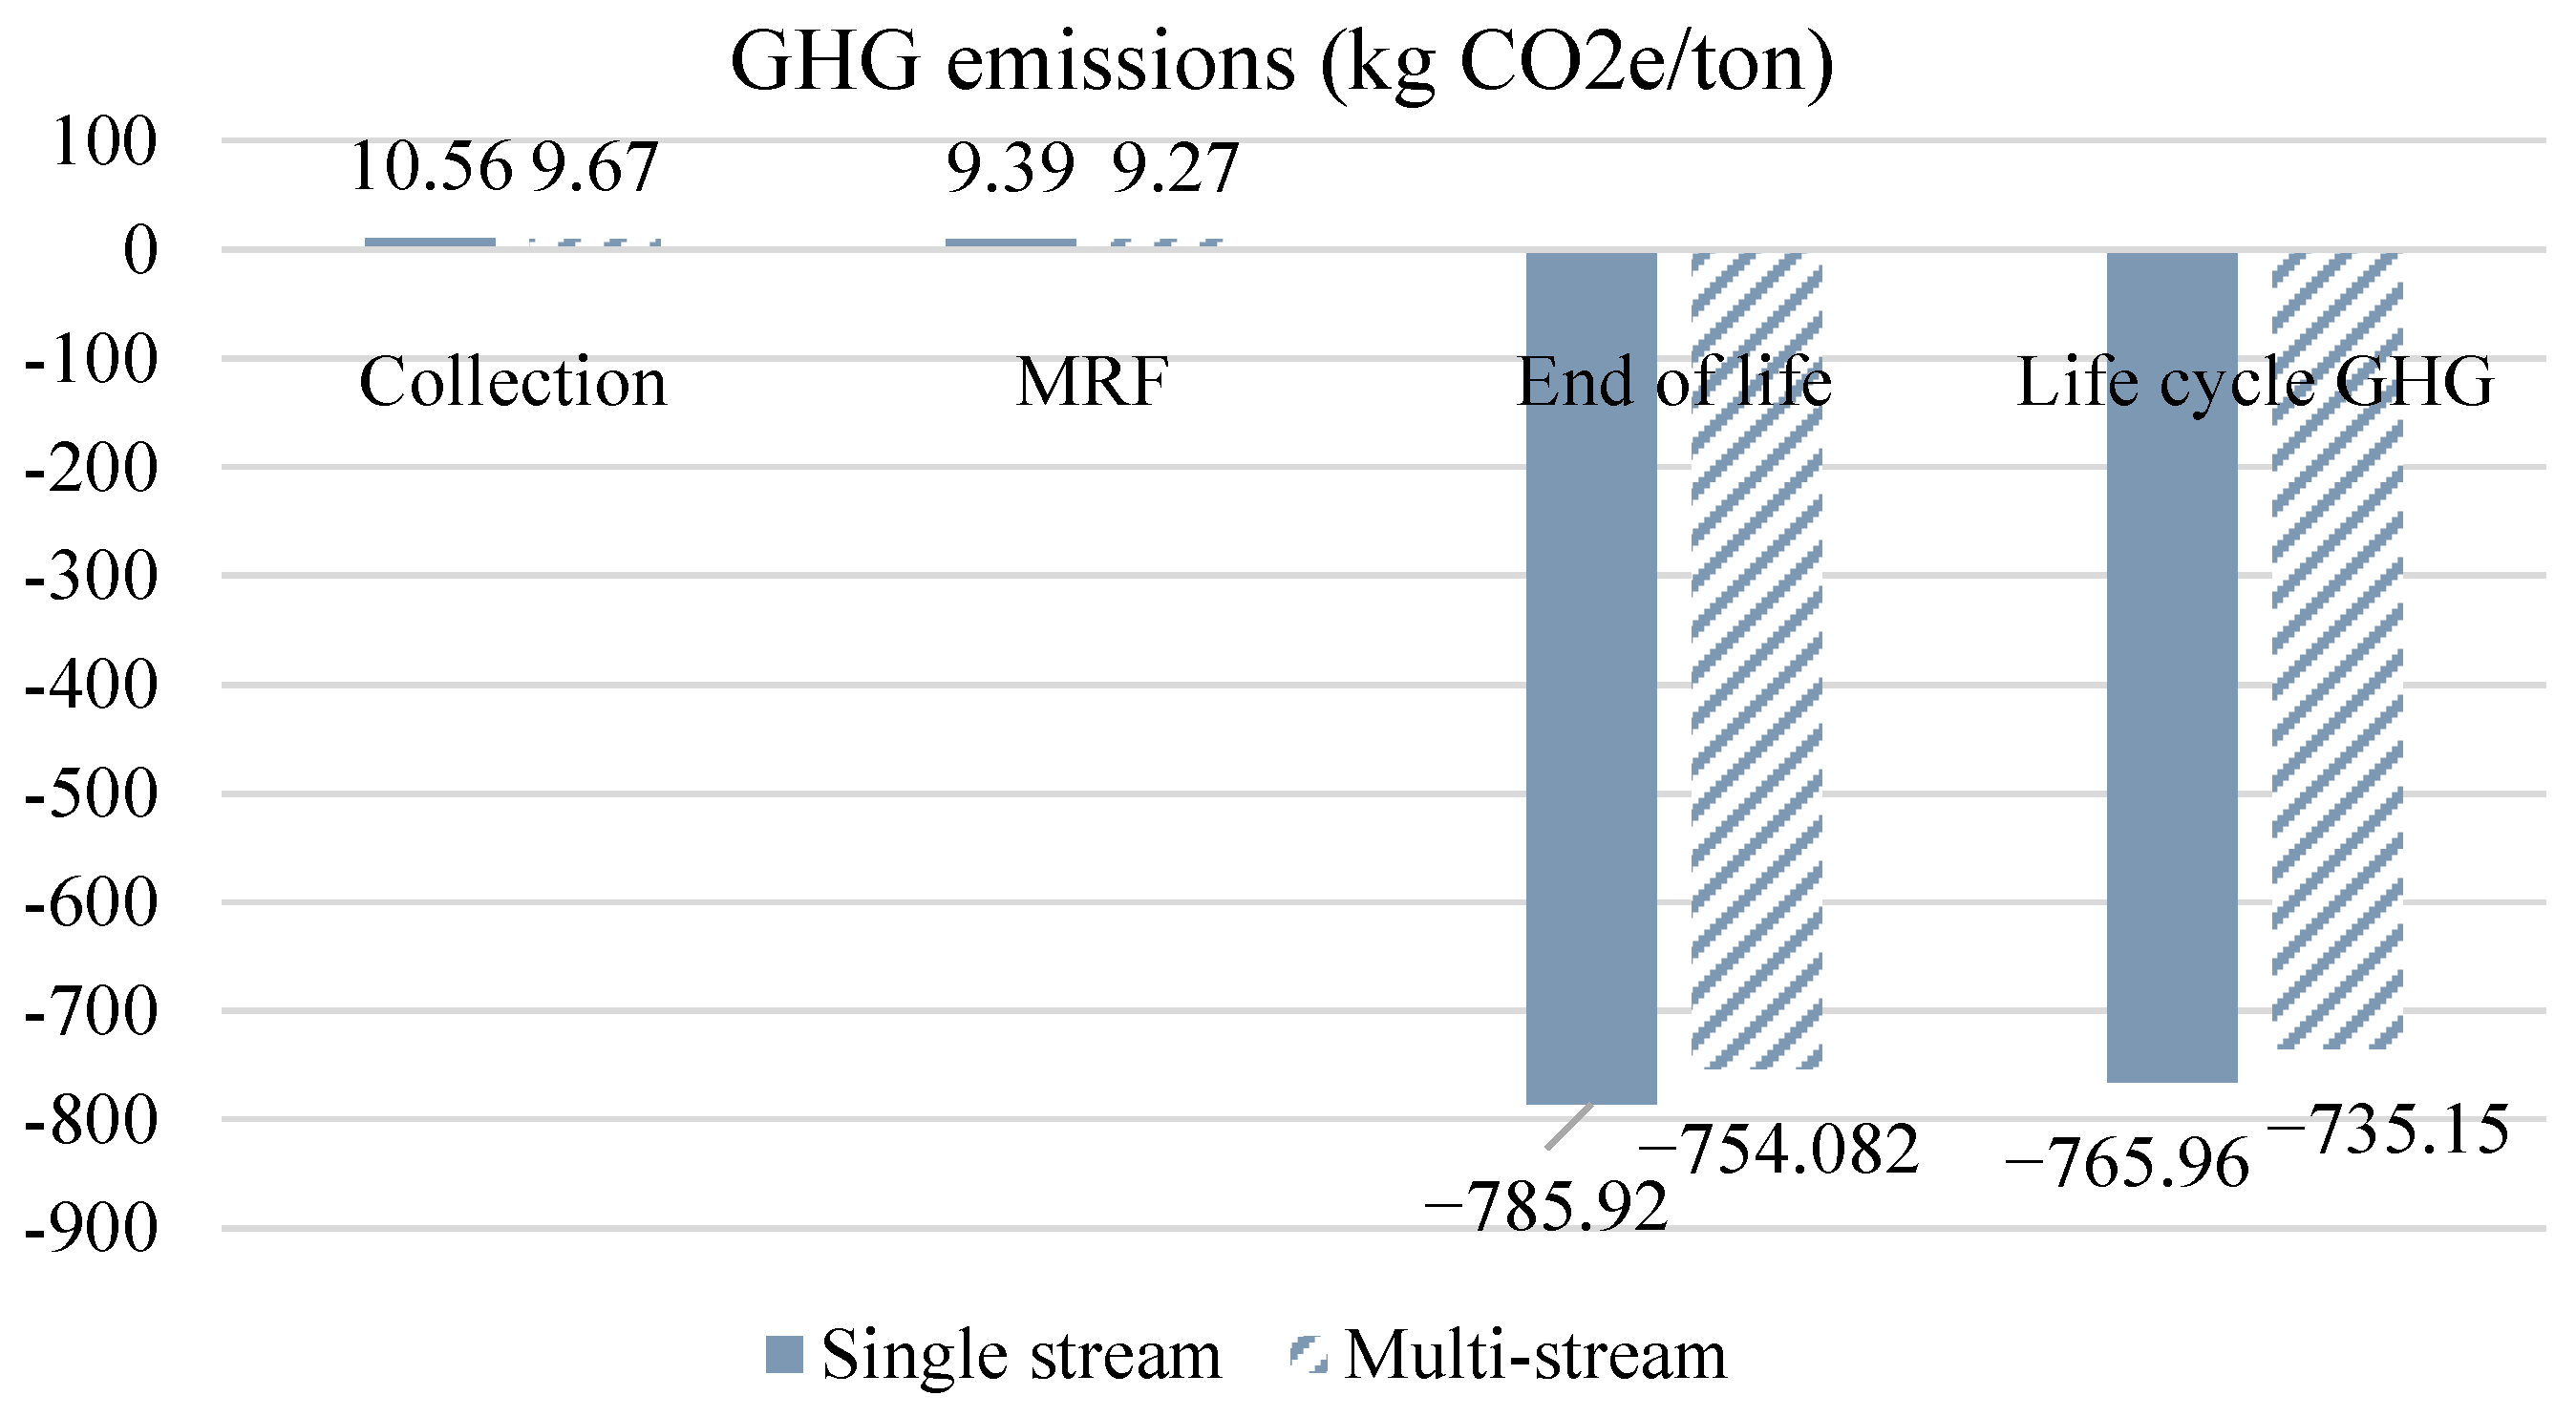
4.1. Life Cycle Impact Assessment Results
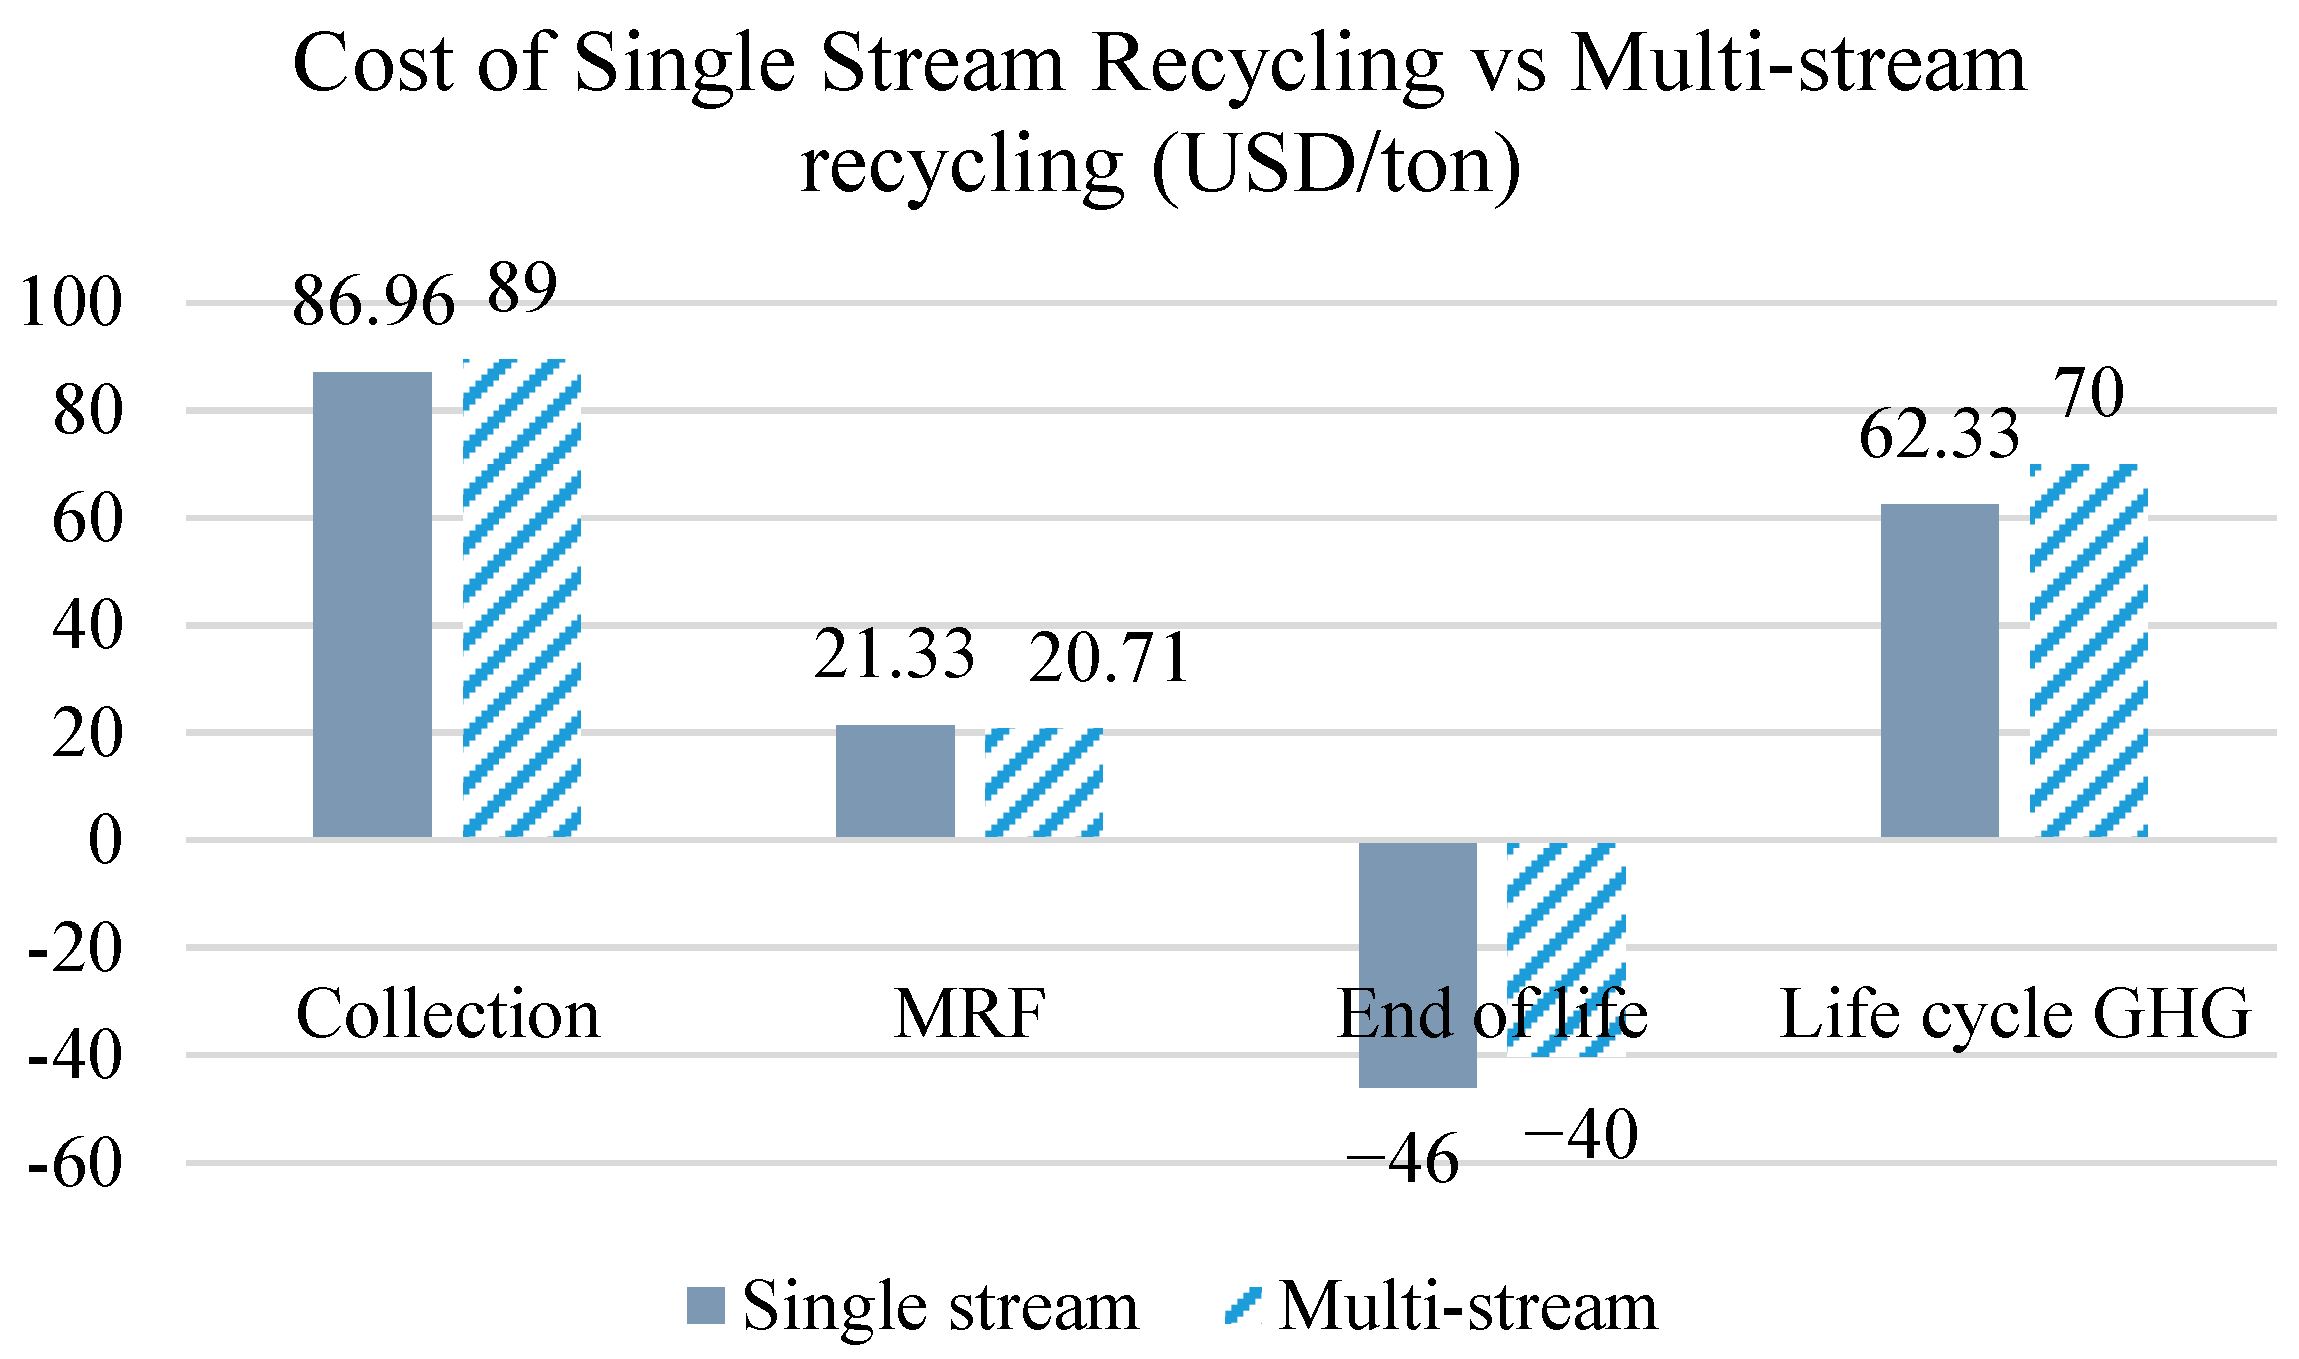
4.2. Techno-Economic Assessment Results
4.3. Social Impact Assessment Results
5. Assessment of Alternative Scenarios
5.1. Waste Composition
5.2. MRF Process Efficiency
5.3. Recycling Price
6. Discussion
7. Conclusions
Author Contributions
Funding
Institutional Review Board Statement
Informed Consent Statement
Data Availability Statement
Acknowledgments
Conflicts of Interest
References
- Kollikkathara, N.; Feng, H.; Yu, D. A System Dynamic Modeling Approach for Evaluating Municipal Solid Waste Generation, Landfill Capacity and Related Cost Management Issues. Waste Manag. 2010, 30, 2194–2203. [Google Scholar] [CrossRef] [PubMed]
- US EPA. Versions of the Waste Reduction Model (WARM). Available online: https://www.epa.gov/warm/versions-waste-reduction-model-warm (accessed on 27 May 2018).
- Jamelske, E.; Kipperberg, G. A Contingent Valuation Study and Benefit-Cost Analysis of the Switch to Automated Collection of Solid Waste with Single Stream Recycling in Madison, Wisconsin. Public Work. Manag. Policy 2006, 11, 89–103. [Google Scholar] [CrossRef]
- Bashir, M.J.K.; Chong, S.-T.; Chin, Y.-T.; Yusoff, M.S.; Aziz, H.A. Single Waste Stream Processing and Material Recovery Facility (MRF). In Solid Waste Engineering and Management: Volume 2; Handbook of Environmental Engineering; Wang, L.K., Wang, M.-H.S., Hung, Y.-T., Eds.; Springer International Publishing: Cham, Switzerland, 2022; pp. 71–164. ISBN 978-3-030-89336-1. [Google Scholar]
- Citrasari, N.; Sitogasa, P.S.A.; Burhan, A.L.; Sari, N.K. The Design of Material Recovery Facilities (MRF)-Based Temporary Disposal Site (TDS) at Universitas Airlangga Campus C: International Conference Research Collaboration of Environmental Science 2018. IOP Conf. Ser. Earth Environ. Sci. 2019, 245, 012010. [Google Scholar] [CrossRef]
- Lakhan, C. A Comparison of Single and Multi-Stream Recycling Systems in Ontario, Canada. Resources 2015, 4, 384–397. [Google Scholar] [CrossRef] [Green Version]
- Mcdonald, B.; Smithers, M. Implementing a Waste Management Plan during the Construction Phase of a Project: A Case Study. Constr. Manag. Econ. 1998, 16, 71–78. [Google Scholar] [CrossRef]
- Ullo, J. Single Stream Recycling Contamination; Florida Department of Environmental Protection: Tallahassee, FL, USA, 2015. [Google Scholar]
- Robinson, S. The Changing Waste Stream; EPA: Houston, TX, USA, 2014. [Google Scholar]
- Bafail, O. A DEMATEL Framework for Modeling Cause-and-Effect Relationships of Inbound Contamination in Single-Stream Recycling Programs. Sustainability 2022, 14, 10884. [Google Scholar] [CrossRef]
- Brown, P. Popular Epidemiology and Toxic Waste Contamination: Lay and Professional Ways of Knowing. J. Health Soc. Behav. 1992, 33, 267–281. [Google Scholar] [CrossRef] [Green Version]
- Miranda, R.; Monte, M.C.; Blanco, A. Analysis of the Quality of the Recovered Paper from Commingled Collection Systems. Resour. Conserv. Recycl. 2013, 72, 60–66. [Google Scholar] [CrossRef]
- Tonjes, D.J.; Aphale, O.; Clark, L.; Thyberg, K.L. Conversion from Dual Stream to Single Stream Recycling Results in Nuanced Effects on Revenues and Waste Stream Amounts and Composition. Resour. Conserv. Recycl. 2018, 138, 151–159. [Google Scholar] [CrossRef]
- Banar, M.; Cokaygil, Z.; Ozkan, A. Life Cycle Assessment of Solid Waste Management Options for Eskisehir, Turkey. Waste Manag. 2009, 29, 54–62. [Google Scholar] [CrossRef]
- Bozorgirad, M.A.; Zhang, H.; Haapala, K.R.; Murthy, G.S. Environmental Impact and Cost Assessment of Incineration and Ethanol Production as Municipal Solid Waste Management Strategies. Int. J. Life Cycle Assess. 2013, 18, 1502–1512. [Google Scholar] [CrossRef]
- Chen, D.; Christensen, T.H. Life-Cycle Assessment (EASEWASTE) of Two Municipal Solid Waste Incineration Technologies in China. Waste Manag. Res. 2010, 28, 508–519. [Google Scholar] [CrossRef] [PubMed]
- Cherubini, F.; Bargigli, S.; Ulgiati, S. Life Cycle Assessment (LCA) of Waste Management Strategies: Landfilling, Sorting Plant and Incineration. Energy 2009, 34, 2116–2123. [Google Scholar] [CrossRef]
- De Feo, G.; Malvano, C. The Use of LCA in Selecting the Best MSW Management System. Waste Manag. 2009, 29, 1901–1915. [Google Scholar] [CrossRef] [PubMed]
- Hong, R.J.; Wang, G.F.; Guo, R.Z.; Cheng, X.; Liu, Q.; Zhang, P.J.; Qian, G.R. Life Cycle Assessment of BMT-Based Integrated Municipal Solid Waste Management: Case Study in Pudong, China. Resour. Conserv. Recycl. 2006, 49, 129–146. [Google Scholar] [CrossRef]
- Liamsanguan, C.; Gheewala, S.H. LCA: A Decision Support Tool for Environmental Assessment of MSW Management Systems. J. Environ. Manag. 2008, 87, 132–138. [Google Scholar] [CrossRef]
- Mendes, M.R.; Aramaki, T.; Hanaki, K. Comparison of the Environmental Impact of Incineration and Landfilling in São Paulo City as Determined by LCA. Resour. Conserv. Recycl. 2004, 41, 47–63. [Google Scholar] [CrossRef]
- Ozeler, D.; Yetiş, U.; Demirer, G.N. Life Cycle Assessment of Municipal Solid Waste Management Methods: Ankara Case Study. Environ. Int. 2006, 32, 405–411. [Google Scholar] [CrossRef]
- Wanichpongpan, W.; Gheewala, S.H. Life Cycle Assessment as a Decision Support Tool for Landfill Gas-to Energy Projects. J. Clean. Prod. 2007, 15, 1819–1826. [Google Scholar] [CrossRef]
- Snyder, M.T. Single Stream vs. Dual Stream. Available online: https://operations.tufts.edu/recycle/news/2014/10/06/single-stream-vs-dual-stream/ (accessed on 14 November 2022).
- Zhang, D.; Wang, G.; Joo, H. A Systematic Review of Economic Evidence on Community Hypertension Interventions. Am. J. Prev. Med. 2017, 53, S121–S130. [Google Scholar] [CrossRef]
- Kanaoka, K. Forecasting the Value of Recyclable Waste Streams for a Circular Economy Transition in Orlando, Florida; Duke University: Durhan, NC, USA, 2018. [Google Scholar]
- Fitzgerald, G.C.; Krones, J.S.; Themelis, N.J. Greenhouse Gas Impact of Dual Stream and Single Stream Collection and Separation of Recyclables. Resour. Conserv. Recycl. 2012, 69, 50–56. [Google Scholar] [CrossRef]
- Chester, M.; Martin, E.; Sathaye, N. Energy, Greenhouse Gas, and Cost Reductions for Municipal Recycling Systems. Environ. Sci. Technol. 2008, 42, 2142–2149. [Google Scholar] [CrossRef] [PubMed]
- Bell, J.; Huber, J.; Viscusi, W.K. Fostering Recycling Participation in Wisconsin Households through Single-Stream Programs. Land Econ. 2017, 93, 481–502. [Google Scholar] [CrossRef]
- ISO 14040:2006; Environmental Management—Life Cycle Assessment—Principles and Framwork. International Organization for Standardization: Geneva, Switzerland, 2006.
- Cole, R.J.; Sterner, E. Reconciling Theory and Practice of Life-Cycle Costing. Build. Res. Inf. 2000, 28, 368–375. [Google Scholar] [CrossRef]
- Benoît, C.; Norris, G.A.; Valdivia, S.; Ciroth, A.; Moberg, A.; Bos, U.; Prakash, S.; Ugaya, C.; Beck, T. The Guidelines for Social Life Cycle Assessment of Products: Just in Time! Int. J. Life Cycle Assess. 2010, 15, 156–163. [Google Scholar] [CrossRef]
- Abduli, M.A.; Naghib, A.; Yonesi, M.; Akbari, A. Life Cycle Assessment (LCA) of Solid Waste Management Strategies in Tehran: Landfill and Composting plus Landfill. Environ. Monit. Assess. 2010, 178, 487–498. [Google Scholar] [CrossRef]
- TRI Environmental Consulting. Central Waste Management Commission Red Deer Area and Leduc and District Regional Waste Management Athority Leduc Waste Compositon Study; Alberta Innovatives: Calgary, AB, Canada, 2014. [Google Scholar]
- Public Works. City of Harrisonnburg, Solid Waste Management Plan; Public Works: Harrisonburg, VA, USA, 2015; p. 52. [Google Scholar]
- Alam, R.; Chowdhury, M.A.I.; Hasan, G.M.J.; Karanjit, B.; Shrestha, L.R. Generation, Storage, Collection and Transportation of Municipal Solid Waste—A Case Study in the City of Kathmandu, Capital of Nepal. Waste Manag. 2008, 28, 1088–1097. [Google Scholar] [CrossRef]
- Bohlig, J.W.; Duffy, S.P. Systems and Methods for Sorting, Collecting Data Pertaining to and Certifying Recyclables at a Material Recovery Facility. U.S. Patent 7,341,156, 11 March 2018. [Google Scholar]
- Pressley, P.N. Material Recovery Facility Process; NC State University: Raleigh, NC, USA, 2014. [Google Scholar]
- Pressley, P.N.; Aziz, T.N.; DeCarolis, J.F.; Barlaz, M.A.; He, F.; Li, F.; Damgaard, A. Municipal Solid Waste Conversion to Transportation Fuels: A Life-Cycle Estimation of Global Warming Potential and Energy Consumption. J. Clean. Prod. 2014, 70, 145–153. [Google Scholar] [CrossRef]
- Waste 360 Old Corrugated Cardboard Prices Continue to Fall. Available online: http://www.waste360.com/old-corrugated-cardboard-occ/old-corrugated-cardboard-prices-continue-fall (accessed on 27 May 2018).
- Plasticsmarkets Scrap Pricing. Available online: http://www.plasticsmarkets.org/plastics/pricing.html (accessed on 27 May 2018).
- Janes, B. Is Recycling Glass Worth the Cost? Available online: http://kdhnews.com/news/is-recycling-glass-worth-the-cost/article_8e2dd0e6-d956-11e2-ab95-0019bb30f31a.html (accessed on 27 May 2018).
- West Seattle Recycling Prices Paid for Your Recycling Materials at West Seattle Recycling. Available online: https://www.westseattlerecycling.com/prices (accessed on 27 May 2018).
- Solano-Mora, E. Description of the Material Recovery Facilities Process Model; NC State: Raleigh, NC, USA, 1997; p. 93. [Google Scholar]
- Bernstein, J. Social Assessment and Public Participation in Municipal Solid Waste Management-Toolkit; The World Bank: Washington, DC, USA, 2004. [Google Scholar]
- Den Boer, J.; Den Boer, E.; Jager, J. LCA-IWM: A Decision Support Tool for Sustainability Assessment of Waste Management Systems. Waste Manag. 2007, 27, 1032–1045. [Google Scholar] [CrossRef]


| Materials | Waste Component | City (%) (Single-Stream) | University (%) (Multi-Stream) | Single-Stream Waste (ton) | Multi-Stream Waste (ton) * |
|---|---|---|---|---|---|
| Paper | Recyclable paper | 8.7 | 15 | 3844.1 | 582.9 |
| Non-recyclable paper | 7.2 | 3181.3 | |||
| Plastics | Recyclable plastics | 3.3 | 18 | 1458.1 | 699.5 |
| Non-recyclable plastics | 14.3 | 6318.5 | |||
| Organic waste | Compostable organic waste | 36.3 | 48 | 16,039.2 | 1865.3 |
| Non-compost organics | 4.4 | 1944.1 | |||
| Recyclables | Glass | 2.3 | 2 | 1016.3 | 77.7 |
| Electronics | 2.2 | 1 | 972.1 | 38.9 | |
| Household hygiene | 9.2 | 8 | 4065.1 | 310.9 | |
| Bulky objects | 1.6 | 1 | 706.9 | 38.9 | |
| Fines | 1.1 | 1 | 486.1 | 38.9 | |
| Household hazardous | 1.4 | 1 | 618.6 | 38.9 | |
| Building materials | 3 | 1 | 1325.6 | 38.9 | |
| Beverage containers | 1 | 3 | 441.8 | 116.6 | |
| Metals | 3.9 | 1 | 1723.2 | 38.9 |
| Parameters | Amount | Unit |
|---|---|---|
| Number of trash trucks | 8 | |
| Truck cost | 250,000 | USD/truck |
| Waste collection factor (one way) | 3.5 | miles/truck/day |
| Distance traveled per day | 56 | miles |
| Distance traveled per year | 16,800 | miles/year |
| Diesel consumption | 4200 | gallons/year |
| Diesel cost | 9618 | USD/year |
| Labor | 480,000 | USD/year |
| Landfill | 32 | USD/ton |
| Total landfill fee | 352,396.16 | USD/year |
| Parameters | Amount | Unit |
|---|---|---|
| City transfer to MRF | 74.3 | miles |
| Number of transports per day | 2 | |
| Total miles traveled per day | 297.2 | miles |
| Diesel consumption per day | 74.3 | gallons |
| Diesel consumption per year | 27,119.5 | gallons |
| Diesel cost | 62,103.6 | USD/year |
| Parameters | Amount | Unit |
|---|---|---|
| Number of times/day | 2 | |
| Number of workers | 10 | |
| Distance within campus | 2.8 | miles |
| Distance to Royal Oak (organics) | 117 | miles |
| Distance to Sonoco (paper glass cardboard) | 86 | miles |
| Miles per gallon (MPG) | 41 | miles/gallon |
| Diesel consumption | 11.2 | gallons/day |
| Emission factor | 10.2 | kg CO2eq/gallon |
| Operations | Throughput (ton/h) | Power (kw) | Utilization | Process Time (h) | Energy (kwh/ton) | Cost (USD) | Life (Year) | O&M (USD/Year) | |
|---|---|---|---|---|---|---|---|---|---|
| Cardboard | Feeder | 30 | 15 | 1 | 0.033 | 0.50 | 150,000 | 10 | 100 |
| Conveyer | 30 | 5.6 | 0.85 | 0.033 | 0.16 | 46,000 | 10 | 10,000 | |
| Disc screens | 45 | 8.5 | 0.85 | 0.022 | 0.16 | 175,000 | 10 | 10,000 | |
| 2nd conveyer | 30 | 5.6 | 0.85 | 0.033 | 0.16 | 46,000 | 10 | 10,000 | |
| Paper | Combination new screen | 7 | 10 | 0.85 | 0.143 | 1.21 | 280,000 | 10 | 13,000 |
| Vacuum | 10 | 5 | 0.85 | 0.100 | 0.43 | 150,000 | 10 | 100 | |
| Processing line | 10 | 5.6 | 0.85 | 0.100 | 0.48 | 46,000 | 10 | 10,000 | |
| Glass | Glass breaker | 9.9 | 30 | 0.85 | 0.101 | 2.58 | 220,000 | 10 | 10,000 |
| Paper magnet | 2 | 4 | 0.85 | 0.500 | 1.70 | 35,000 | 10 | 5000 | |
| Conveyer | 30 | 5.6 | 0.85 | 0.033 | 0.16 | 46,000 | 10 | 10,000 | |
| Steel | Magnet | 2 | 4 | 0.85 | 0.500 | 1.70 | 35,000 | 10 | 5000 |
| Plastics | Optical scanner | 10 | 13 | 0.85 | 0.100 | 1.11 | 225,000 | 10 | 5000 |
| Heavier plastic | Optical scanner | 10 | 40 | 0.85 | 0.100 | 3.40 | 450,000 | 10 | 10,000 |
| Aluminum | Magnetic field (Eddy current) | 12 | 9 | 0.85 | 0.083 | 0.64 | 128,000 | 10 | 5000 |
| Balers | 30 | 59 | 1 | 0.033 | 3.93 | 530,000 | 10 | 5000 | |
| Operations | Throughput (ton/h) | Power (kw) | Utilization | Process Time (h) | Energy (kwh/ton) | Cost (USD) | Life Time (Years) | O&M (USD/Year) | |
|---|---|---|---|---|---|---|---|---|---|
| Fiber stream | Feeder | 30 | 15 | 1 | 0.033 | 0.50 | 150,000 | 10 | 100 |
| Conveyer | 30 | 5.6 | 0.85 | 0.033 | 0.16 | 46,000 | 10 | 10,000 | |
| Disc screen (OCC) | 45 | 8.5 | 0.85 | 0.022 | 0.16 | 175,000 | 10 | 10,000 | |
| Disc screen (News) | 7 | 10 | 0.85 | 0.143 | 1.21 | 280,000 | 10 | 13,000 | |
| Conveyer | 30 | 5.6 | 0.85 | 0.033 | 0.16 | 46,000 | 10 | 10,000 | |
| Baler | 30 | 59 | 1 | 0.033 | 3.93 | 530,000 | 10 | 5000 | |
| Container stream | Feeder | 30 | 15 | 1 | 0.033 | 0.50 | 150,000 | 10 | 100 |
| Conveyer (manual sort) | 30 | 5.6 | 0.85 | 0.033 | 0.16 | 46,000 | 10 | 10,000 | |
| Glass breaker | 9.9 | 30 | 0.85 | 0.101 | 2.58 | 220,000 | 10 | 10,000 | |
| Optical scanner | 10 | 13 | 0.85 | 0.100 | 1.11 | 225,000 | 10 | 5000 | |
| Optical scanner 2 | 10 | 13 | 0.85 | 0.100 | 1.11 | 225,000 | 10 | 5000 | |
| Magnet | 2 | 4 | 0.85 | 0.500 | 1.70 | 35,000 | 10 | 5000 | |
| Eddy current | 12 | 9 | 0.85 | 0.083 | 0.64 | 128,000 | 10 | 5000 | |
| Conveyer | 30 | 5.6 | 0.85 | 0.033 | 0.16 | 46,000 | 10 | 10,000 | |
| Baler | 30 | 59 | 1 | 0.033 | 3.93 | 530,000 | 10 | 5000 | |
| Waste Component | Price (US Cents/lb) | Emission Factor (ton CO2eq/ton) | |
|---|---|---|---|
| Paper | Recyclable paper | 4.75 1 | −3.53 |
| Non-recyclable paper | 0.02 | ||
| Plastics | Recyclable plastics | 7 2 | −1.02 |
| Non-recyclable plastics | 0.02 | ||
| Recyclables | Glass | 0.5 3 | −0.28 |
| Electronics | 32 4 | −2.5 | |
| Household hygiene | 20 5 | −0.07 | |
| Bulky objects | 20 5 | −0.07 | |
| Fines | 100 4 | −4.71 | |
| Building materials | 20 5 | −0.01 | |
| Beverage containers | 33 4 | −9.11 | |
| Metals | 5 4 | −4.34 | |
| Stages | Multi-Stream | Single-Stream | ||||
|---|---|---|---|---|---|---|
| Collection | Diesel cost | 7694.4 | USD/year | Overhead | 1,032,685 | USD/year |
| Labor cost | 306,300 | USD/year | Solid waste collection | 1,339,448 | USD/year | |
| Equipment cost | 8.6 | USD/ton | Equipment cost | 8.6 | USD/ton | |
| Collection cost | 89.4 | USD/ton | Collection cost | 86.96 | USD/ton | |
| MRF | Equipment cost | 5.3 | USD/ton | Equipment cost | 5.8 | USD/ton |
| Wire cost | 1.2 | USD/ton | Wire cost | 1.3 | USD/ton | |
| Fuel electricity cost | 1.91 | USD/ton | Fuel electricity cost | 1.93 | USD/ton | |
| Building and land capital | 12.3 | USD/ton/year | Building and land capital cost | 12.3 | USD/ton/year | |
| MRF cost | 20.71 | USD/ton | MRF cost | 21.33 | USD/ton | |
| End of life | Total recycling revenue | 416,287 | USD/year | Total recycling revenue | 5,076,635 | USD/year |
| Revenue per ton | 107.13 | USD/ton | Revenue per ton | 114.9 | USD/ton | |
| Life cycle | Life cycle cost | 2.99 | USD/ton | Life cycle cost | −6.61 | USD/ton |
| Scenarios | GHG Emission (kg CO2eq/ton) | Cost (USD/ton) | |||||||
|---|---|---|---|---|---|---|---|---|---|
| System | Recycling Rate | Collection | MRF | End of Life | Life Cycle | Collection | MRF | End of Life | Life Cycle |
| Single-stream | 0.4 | 10.56 | 21.33 | −318.9 | −291.5 | 10.56 | 21.33 | −46 | 62.33 |
| Multi-stream | 0.35 | 9.67 | 20.71 | −279.1 | −252.8 | 9.67 | 20.71 | −40 | 70 |
| Multi-stream | 0.4 | 9.67 | 20.71 | −318.9 | −292.63 | 9.67 | 20.71 | −46 | 64 |
| Single-stream | 0.35 | 10.56 | 21.33 | −279.1 | −251.61 | 10.56 | 21.33 | −40 | 68.1 |
| Multi-stream | 0.4 | 9.67 | 20.71 | −318.9 | −292.63 | 9.67 | 20.71 | −46 | 64 |
| Single-stream | 0.4 | 10.56 | 21.33 | −318.9 | −291.5 | 10.56 | 21.33 | −46 | 62.33 |
| Cost (USD/ton) | GHG Emission (kg CO2eq/ton) | |||||||
|---|---|---|---|---|---|---|---|---|
| Baseline | Change 1 | Change 2 | Change 3 | Baseline | Change 1 | Change 2 | Change 3 | |
| Single-stream | 21.33 | 20.71 | 21.33 | 20.71 | 16.9 | 9.39 | 16.9 | 9.39 |
| Multi-stream | 20.71 | 20.71 | 20.1 | 20.1 | 16.65 | 16.65 | 9.27 | 9.27 |
| Electricity (kwh/ton) | Diesel (L/ton) | Wire (kg/ton) | Equipment Cost (USD/ton) | Wire Cost (USD/ton) | Fuel Electricity Cost (USD/ton) | Building and Land Capital Cost (USD/ton/Year) | Total (USD/ton) | |
|---|---|---|---|---|---|---|---|---|
| Single-stream | 18.30 | 0.7 | 0.6 | 5.8 | 1.3 | 1.930 | 12.3 | 21.33 |
| Multi-stream | 18.00 | 0.7 | 0.6 | 5.3 | 1.2 | 1.910 | 12.3 | 20.71 |
| Baseline (USD/Life Cycle) | Change 1 | Change 2 | |
|---|---|---|---|
| Paper Cost 0.955 US Cents/lb | Paper Cost 7 US Cents/lb | ||
| Single-stream | −6.61 | 0 | −10.52 |
| Multi-stream | 3 | 9 | 0 |
Publisher’s Note: MDPI stays neutral with regard to jurisdictional claims in published maps and institutional affiliations. |
© 2022 by the authors. Licensee MDPI, Basel, Switzerland. This article is an open access article distributed under the terms and conditions of the Creative Commons Attribution (CC BY) license (https://creativecommons.org/licenses/by/4.0/).
Share and Cite
Berardocco, C.; Delawter, H.; Putzu, T.; Wolfe, L.C.; Zhang, H. Life Cycle Sustainability Assessment of Single Stream and Multi-Stream Waste Recycling Systems. Sustainability 2022, 14, 16747. https://doi.org/10.3390/su142416747
Berardocco C, Delawter H, Putzu T, Wolfe LC, Zhang H. Life Cycle Sustainability Assessment of Single Stream and Multi-Stream Waste Recycling Systems. Sustainability. 2022; 14(24):16747. https://doi.org/10.3390/su142416747
Chicago/Turabian StyleBerardocco, Costantino, Hannah Delawter, Thomas Putzu, Larson Curtis Wolfe, and Hao Zhang. 2022. "Life Cycle Sustainability Assessment of Single Stream and Multi-Stream Waste Recycling Systems" Sustainability 14, no. 24: 16747. https://doi.org/10.3390/su142416747