
Testing of a Multiple Criteria Assessment Tool for Healthcare Facilities Quality and Sustainability: The Case of German Hospitals

 ,
, 
Abstract
:1. Introduction
1.1. Background
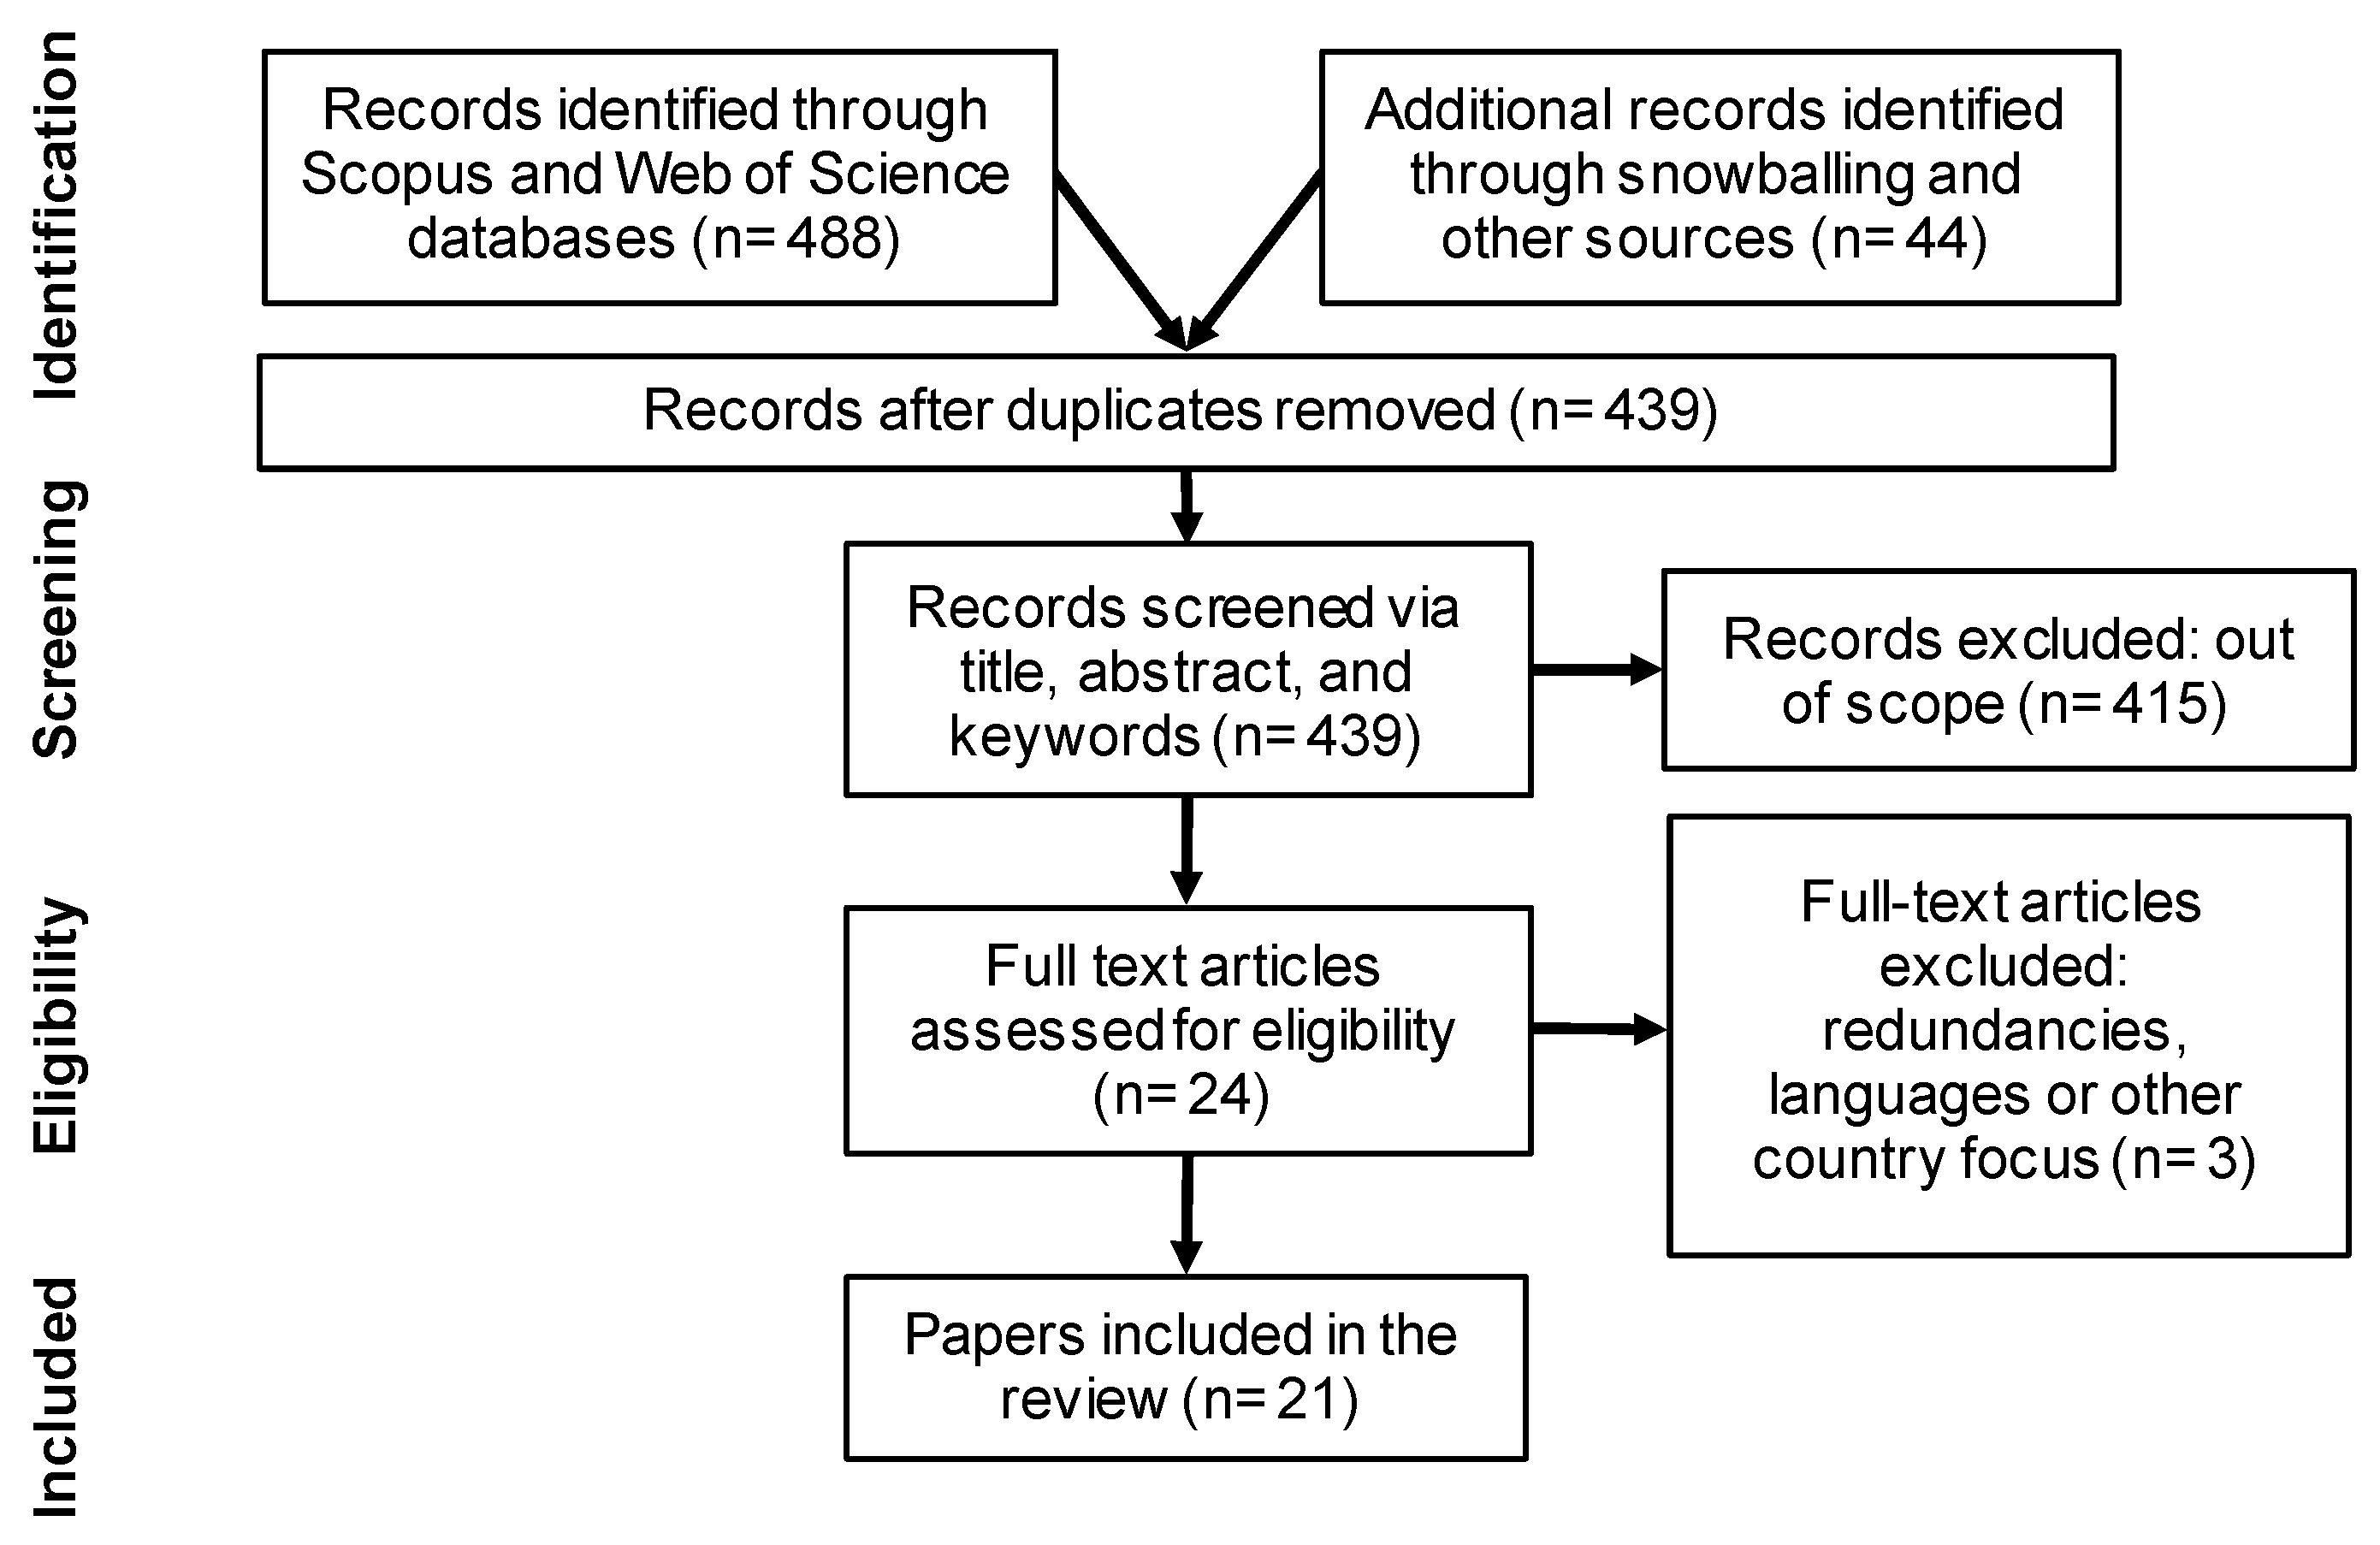
1.2. Review of Scientific Literature
- o
- Patient: meaning exclusion when the content focuses solely on the patient’s well-being, mainly about the disease and subsequent treatment. Parts of the research still had significant overlaps with a medical focus even after omitting the subject area of medicine;
- o
- Countries: Exclusion occurred when results were only relevant for hospitals in low- and middle-income countries;
- o
- Facilities: Omission where the areas under investigation are either not part of the hospital or concerns hospitals still to be built.
1.3. Study Objective and Focus
2. Materials and Methods
2.1. Methodological Approach
2.2. Data Collection
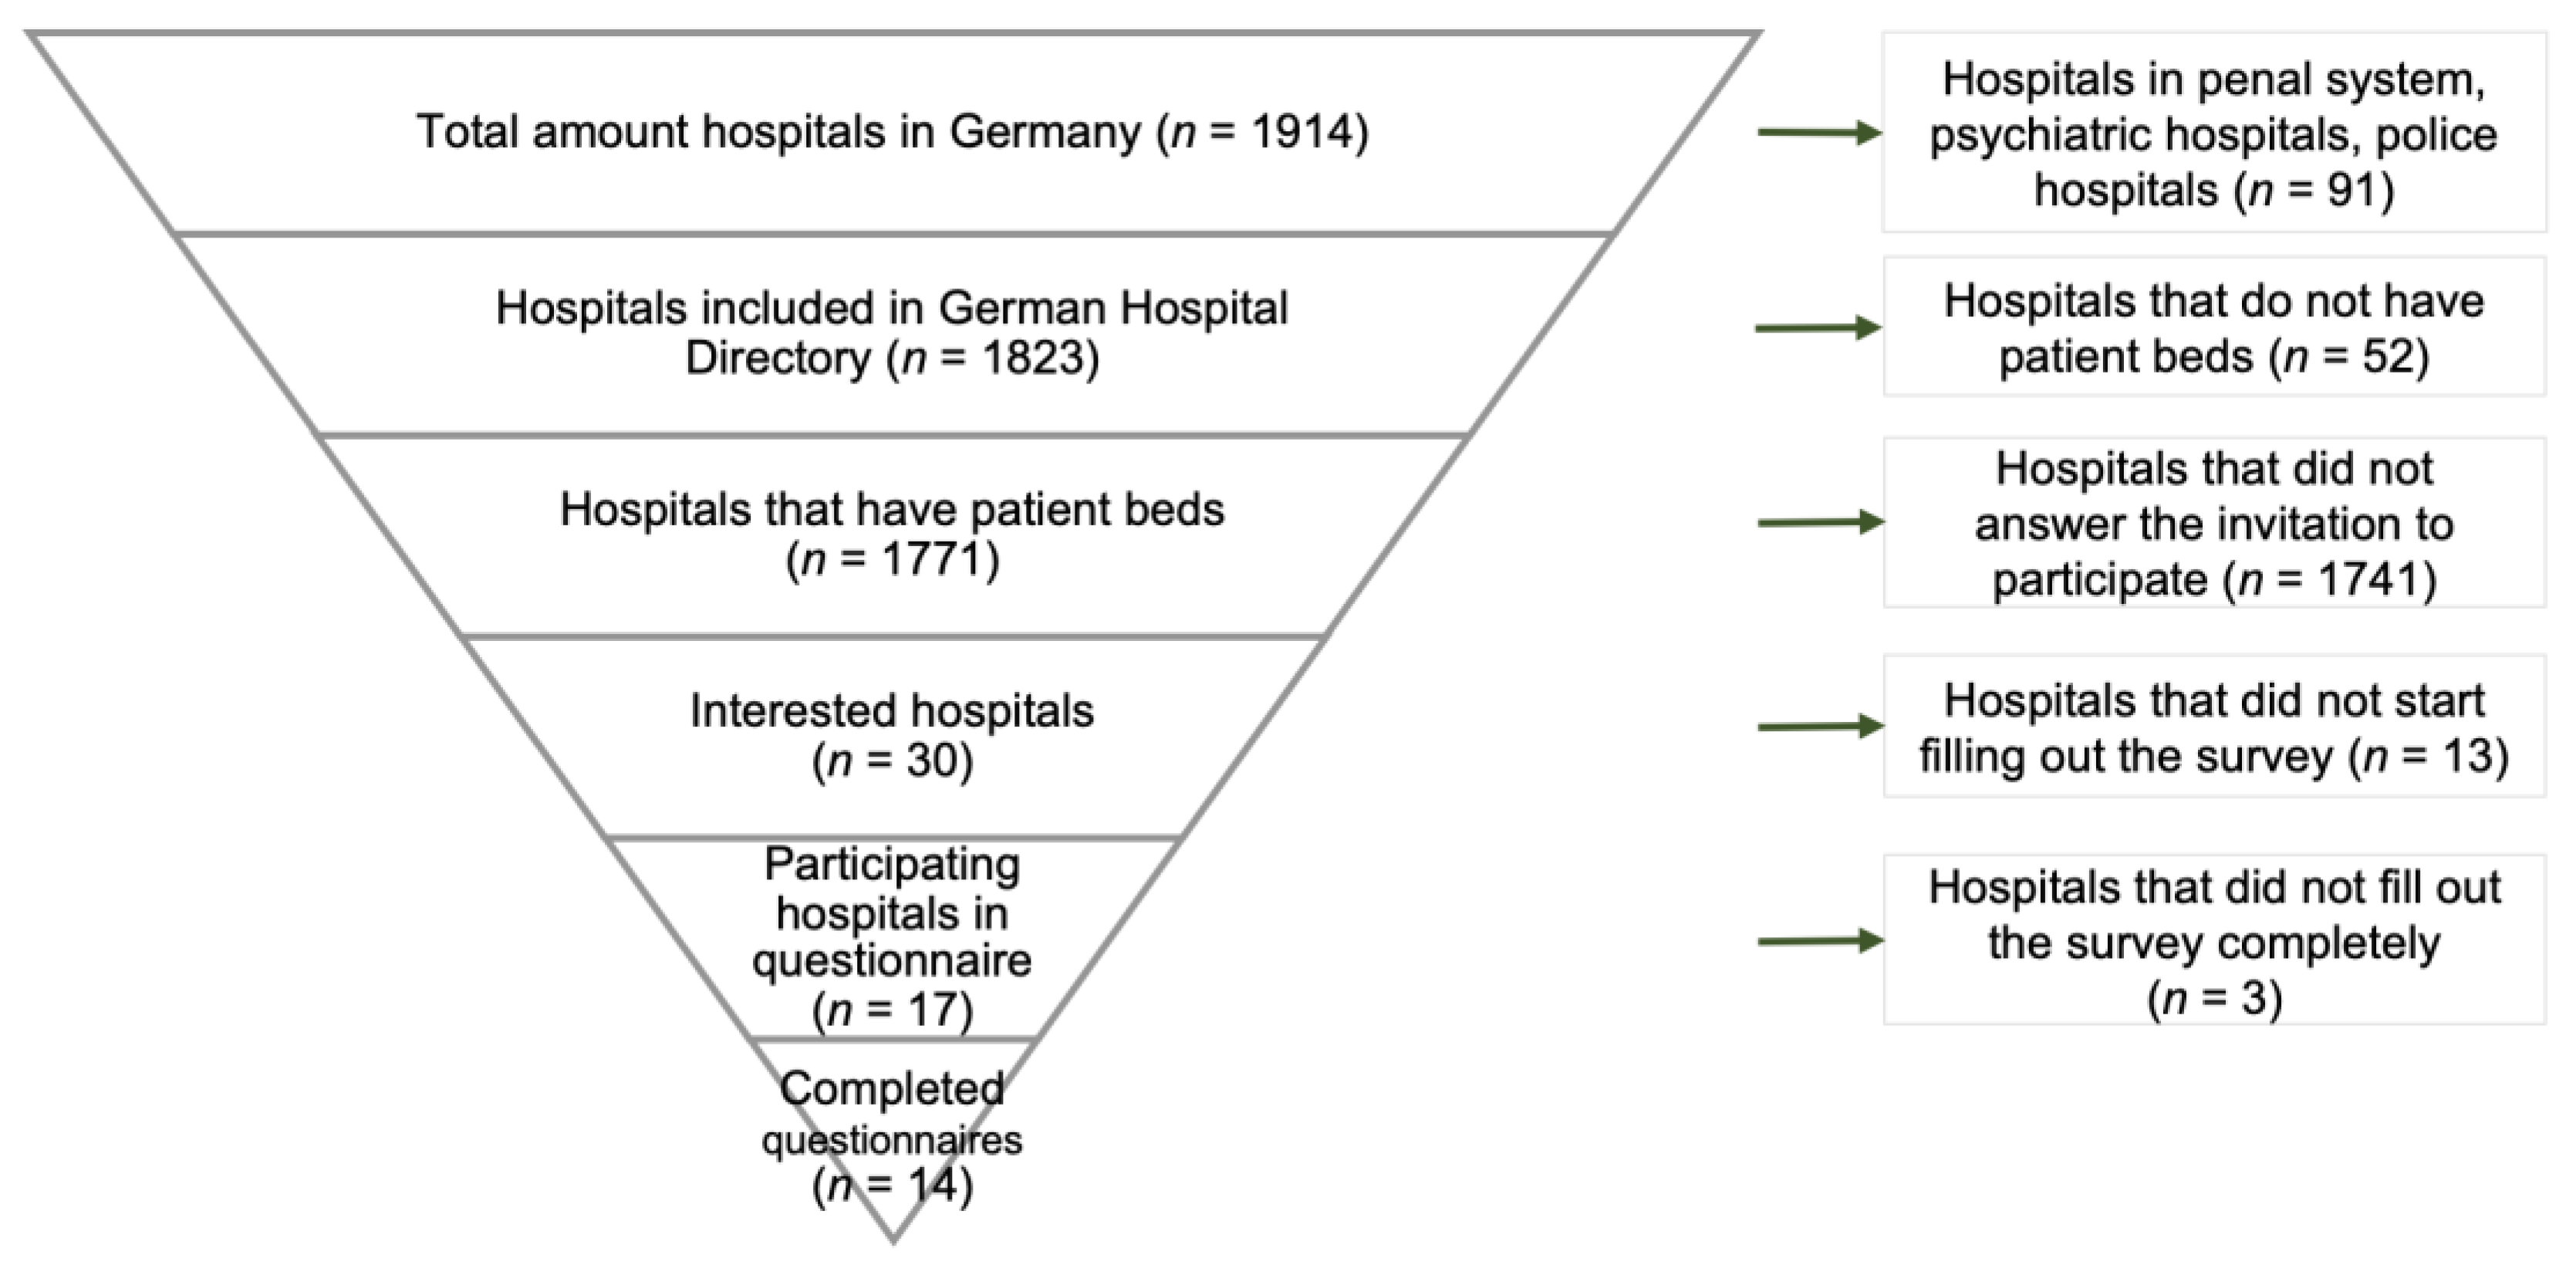
2.3. Sample Selection
2.4. Data Analysis
3. Results
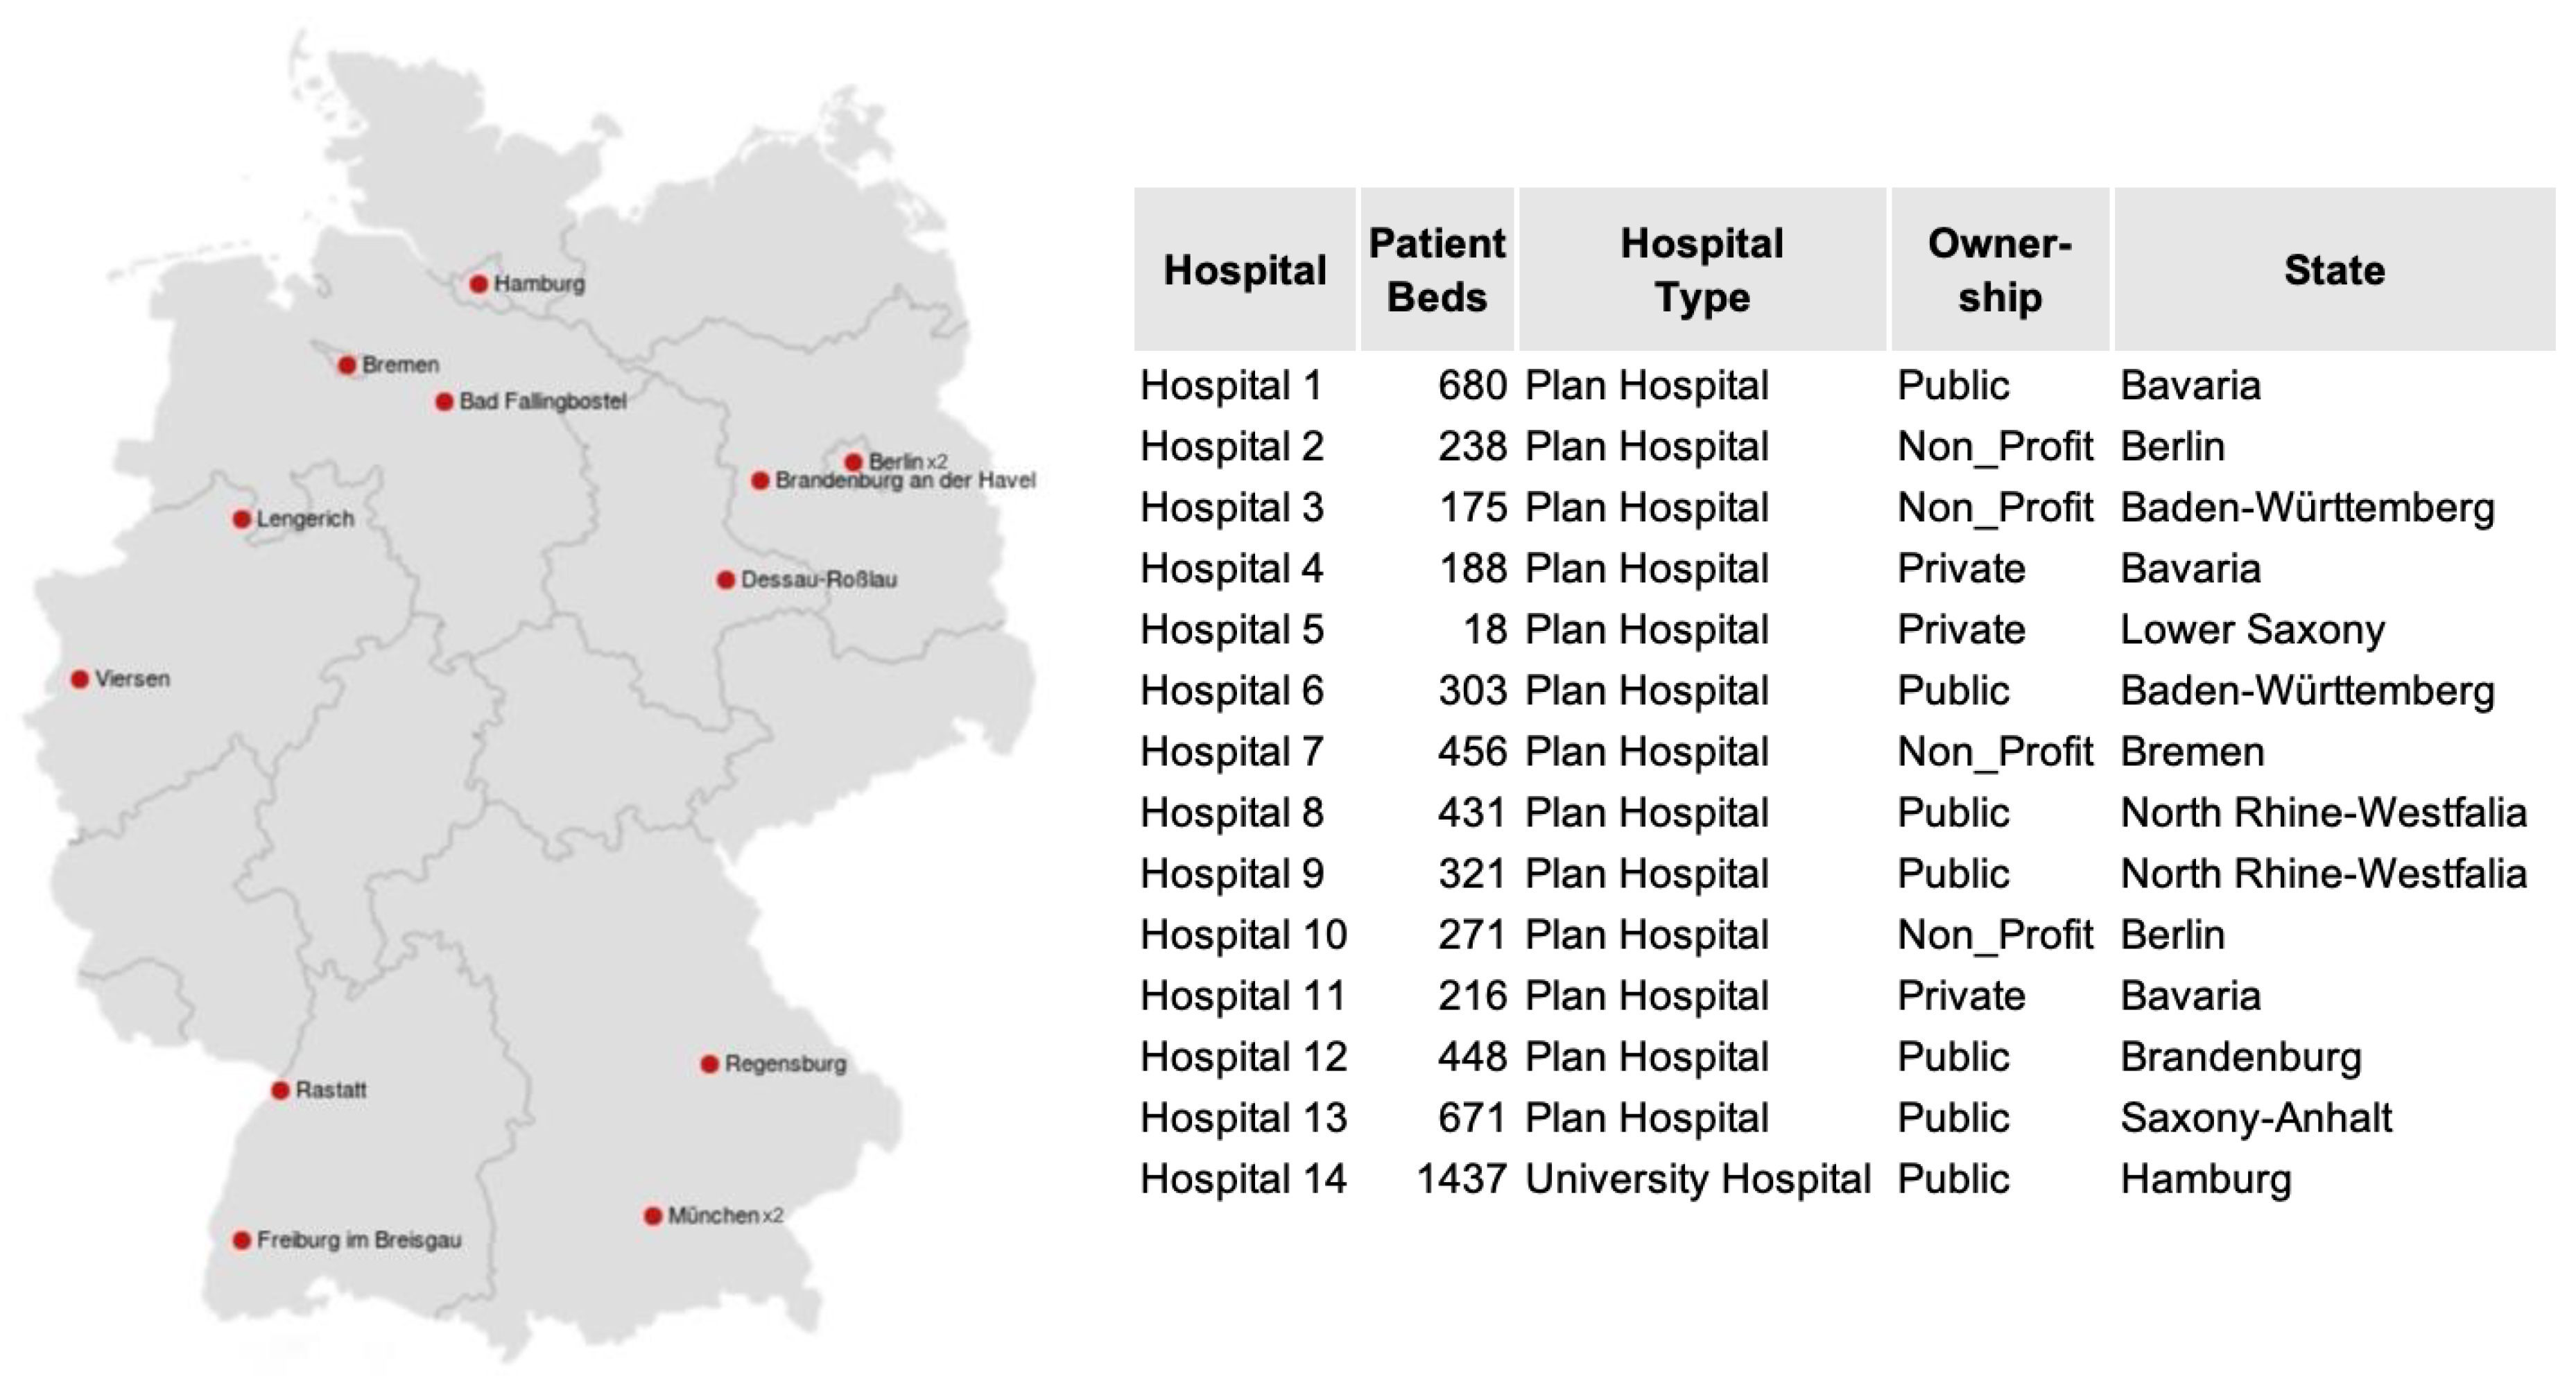
3.1. Descriptive Statistics
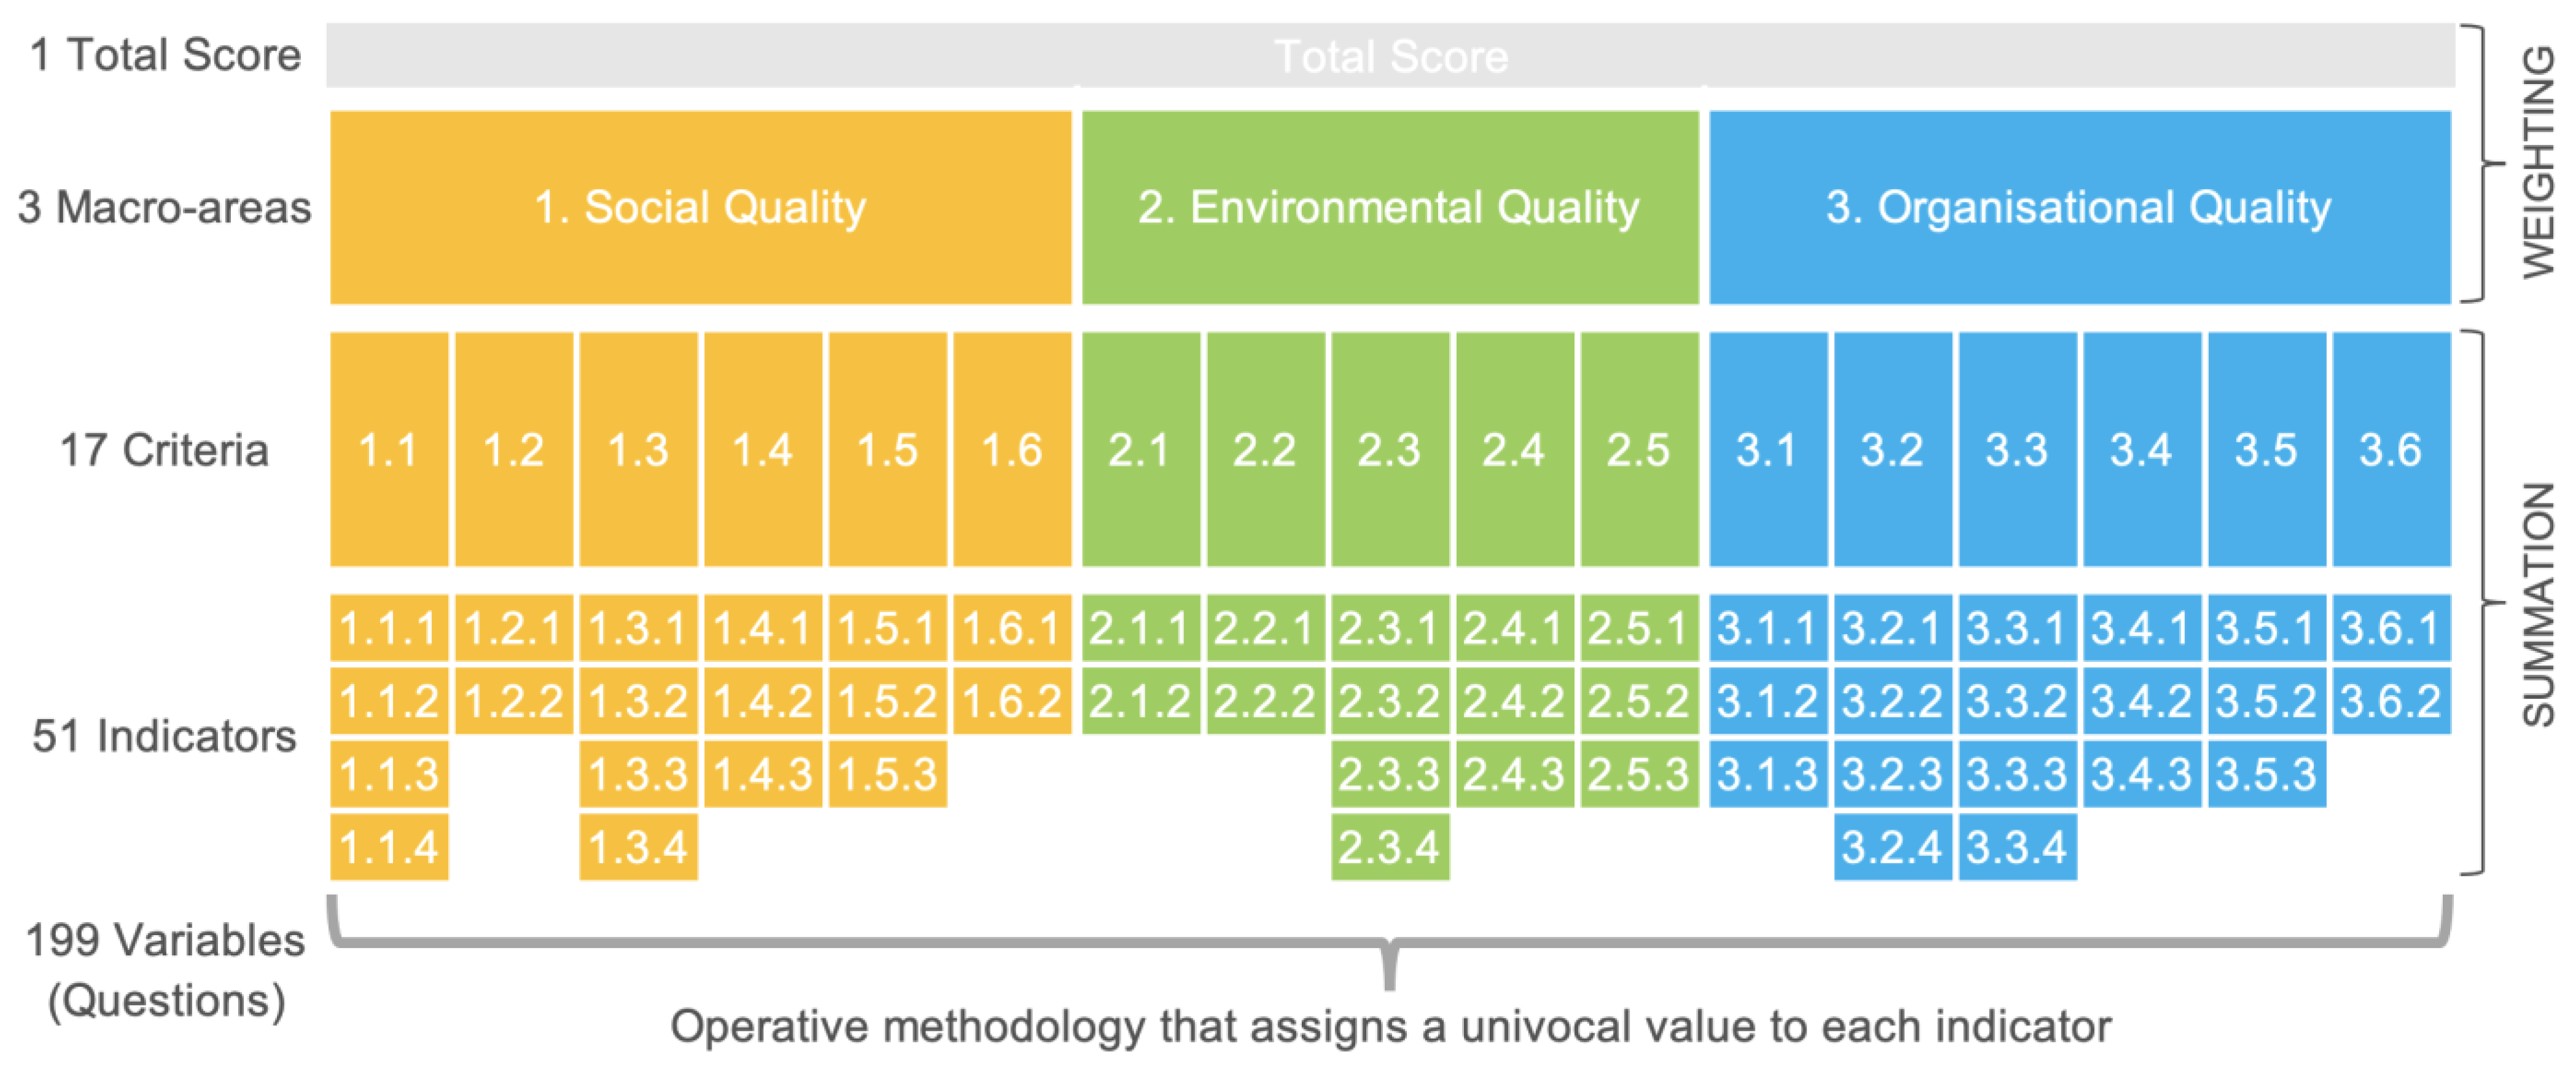
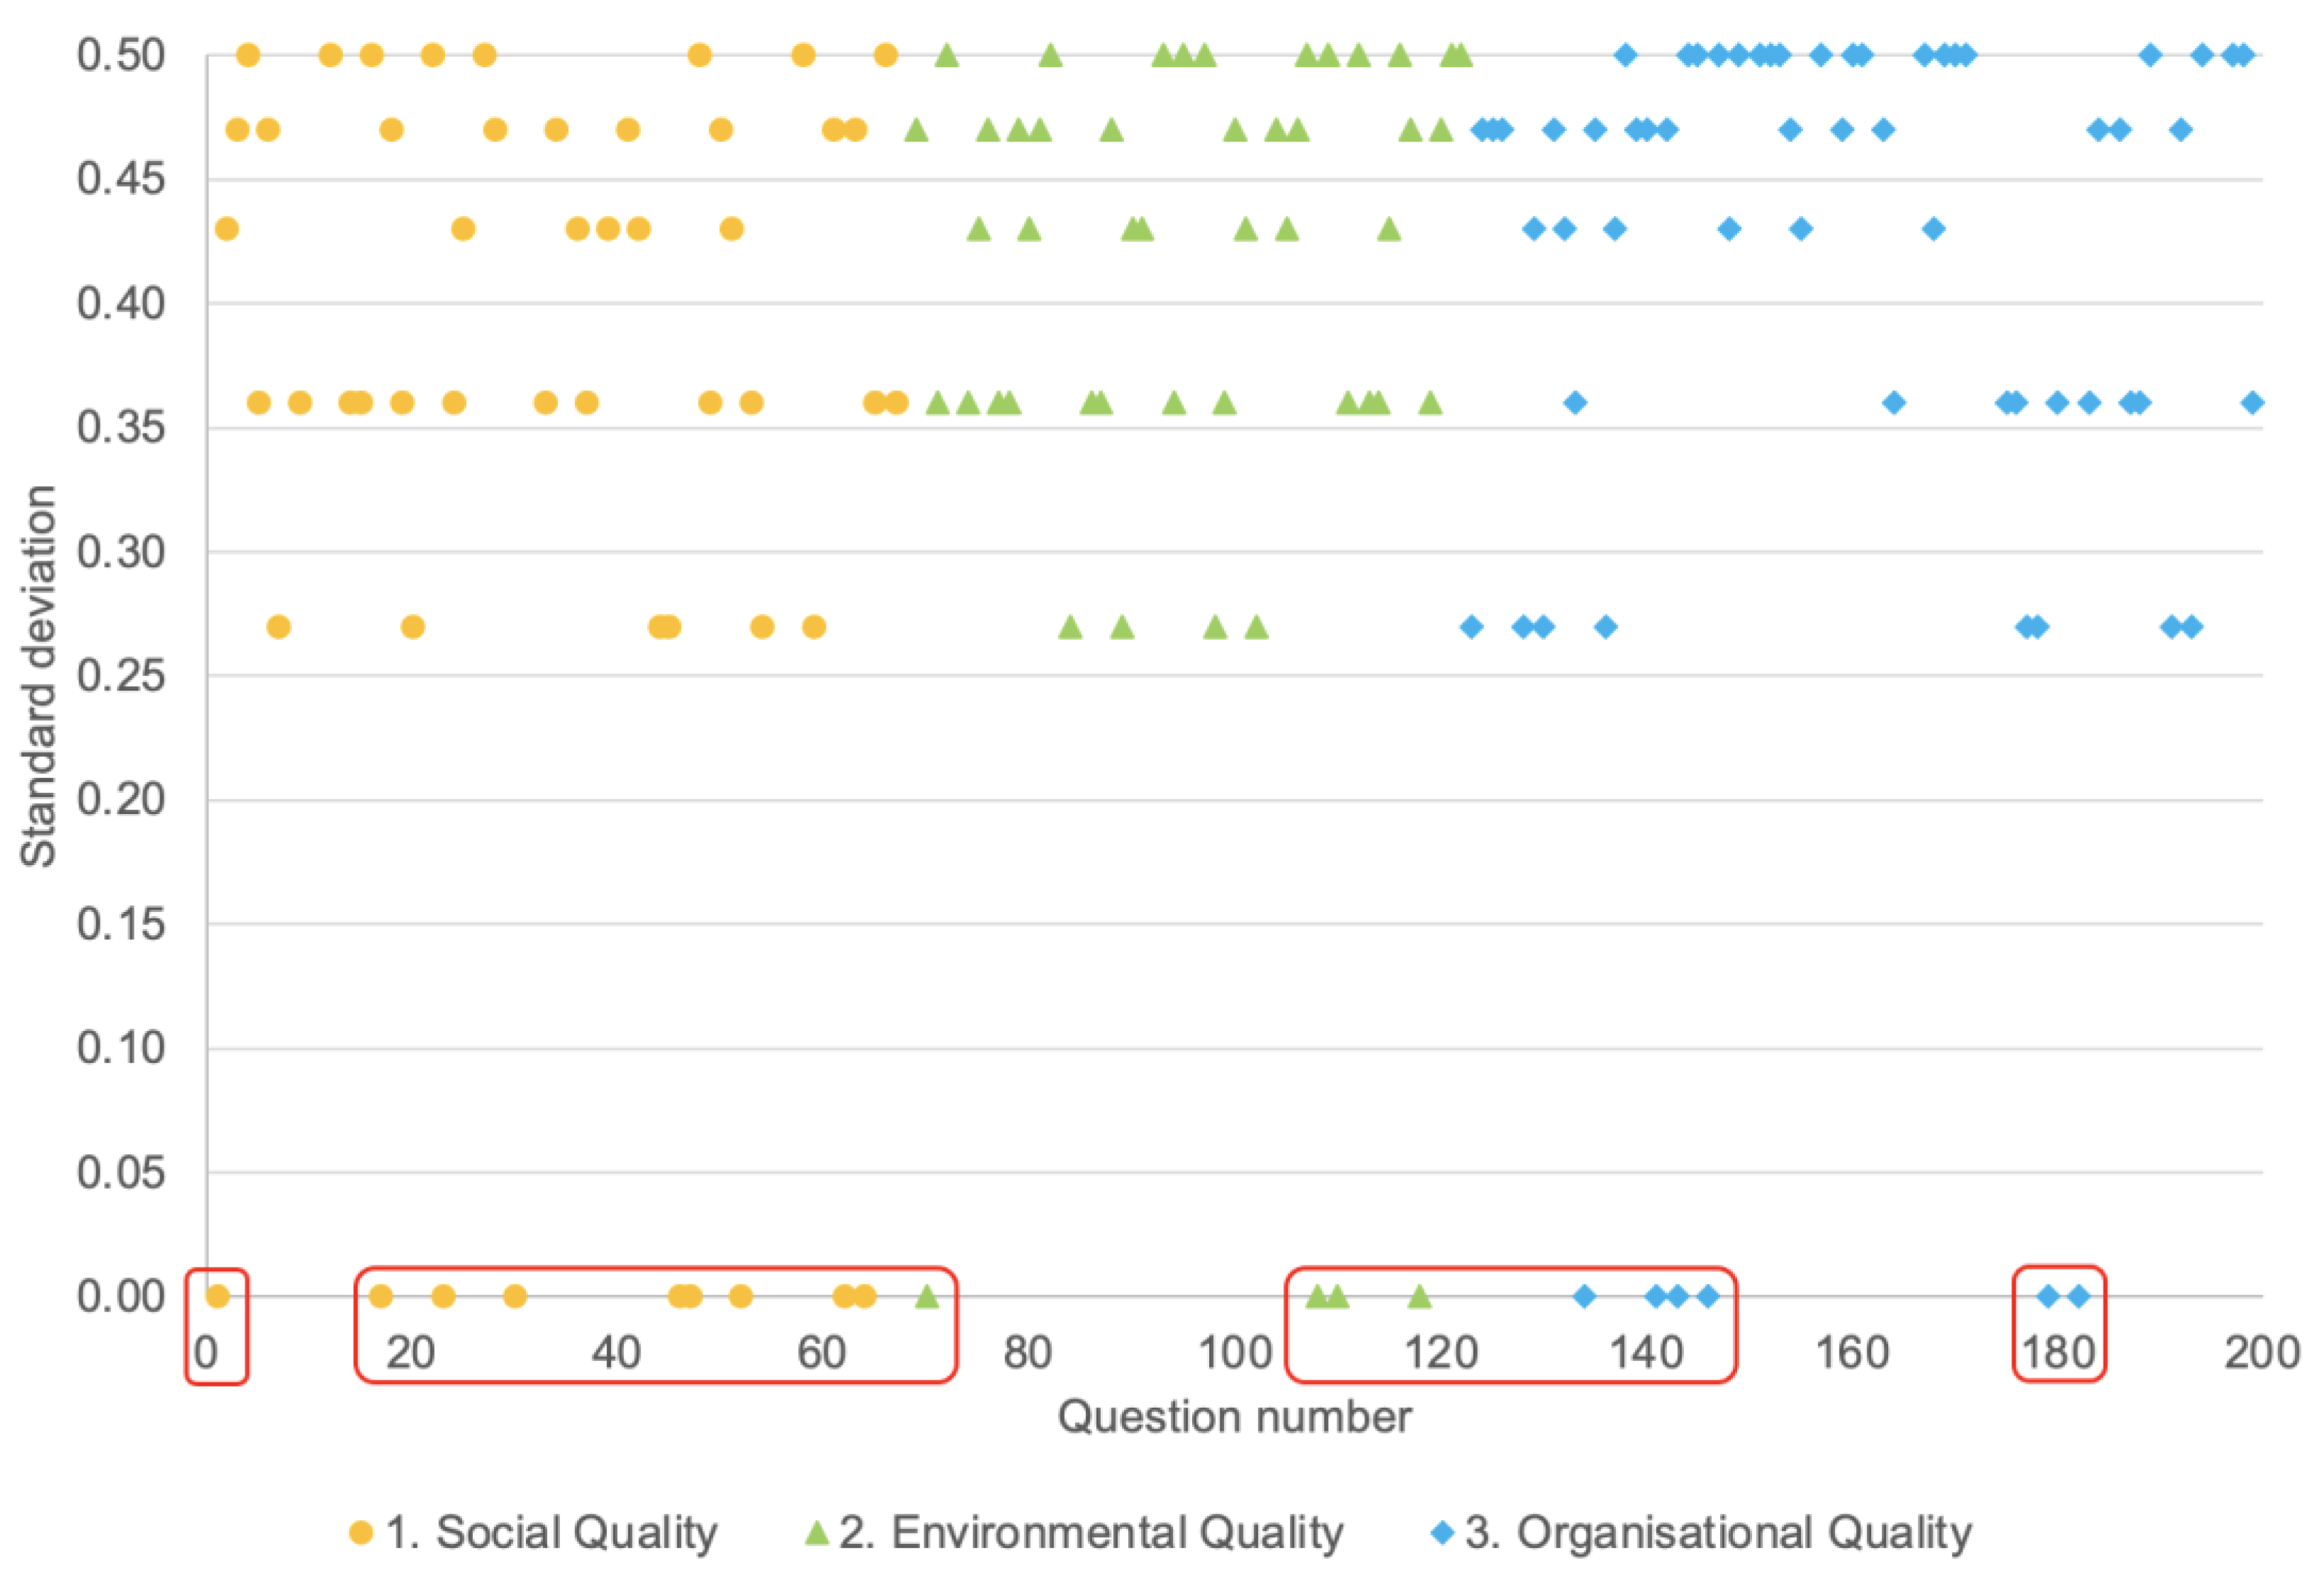
3.2. Functionality of SustHealth v2
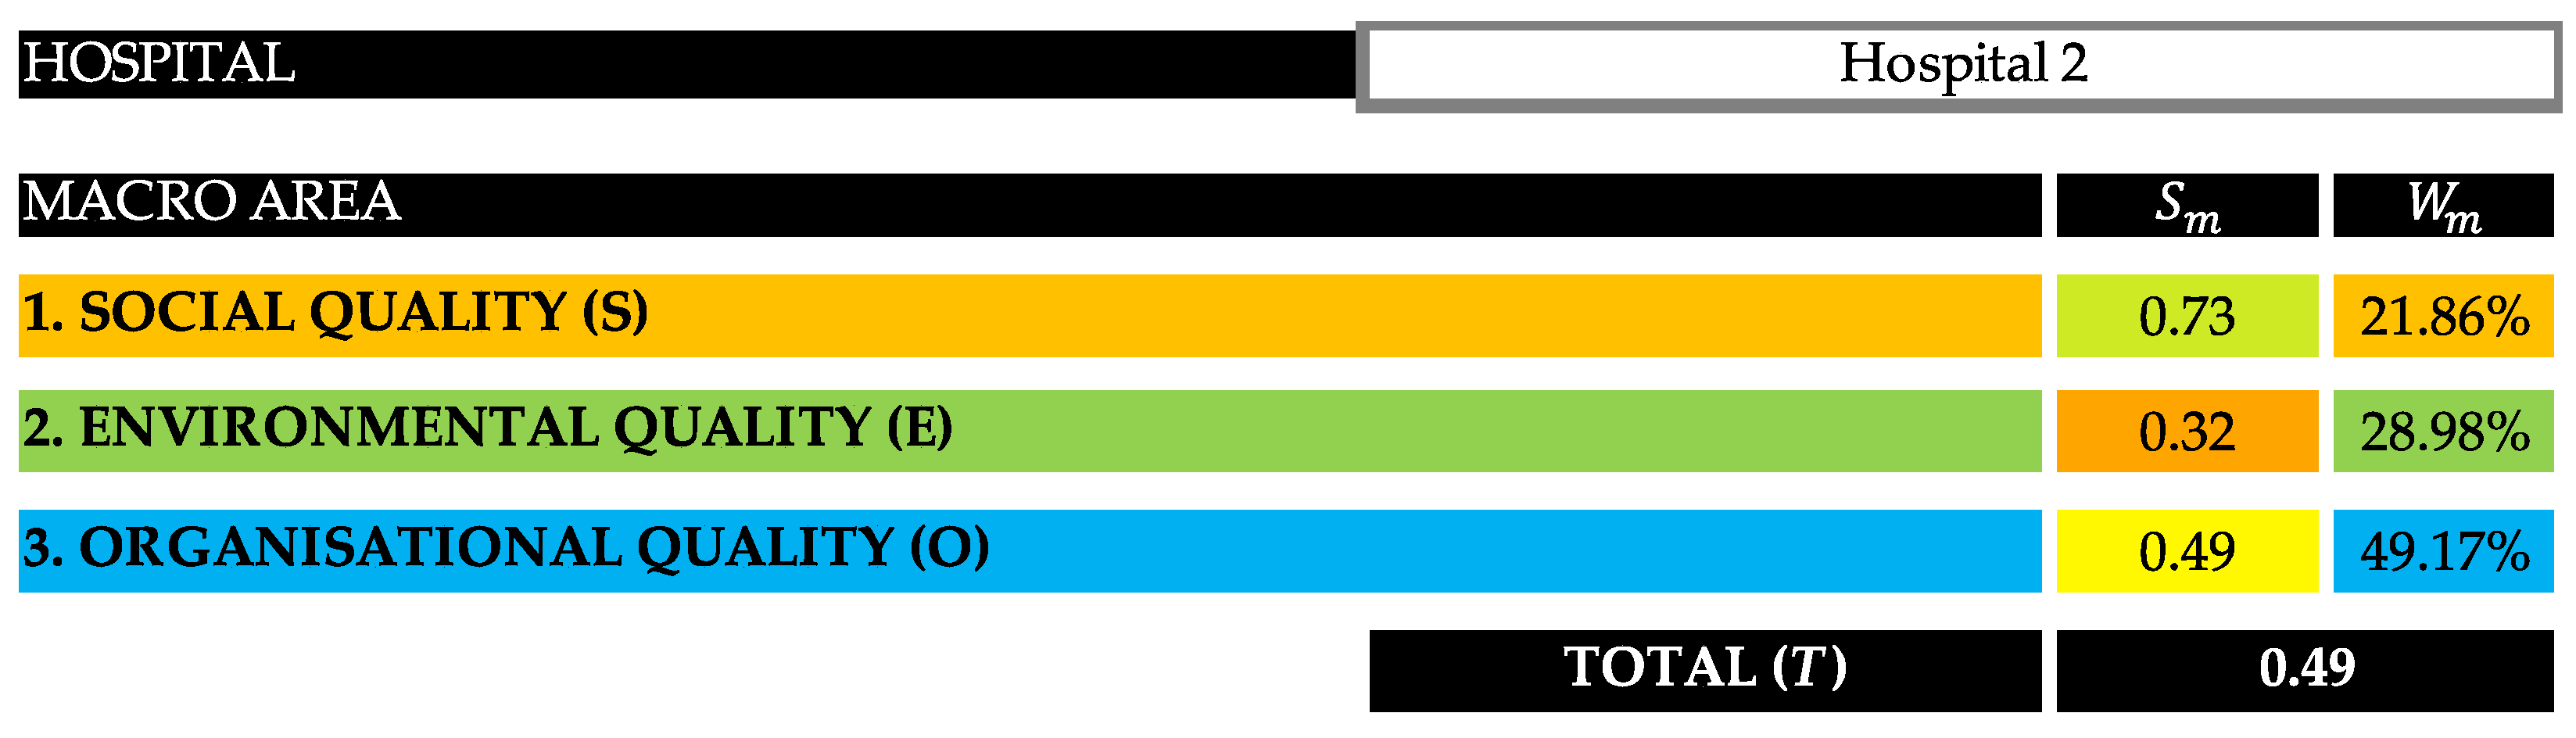
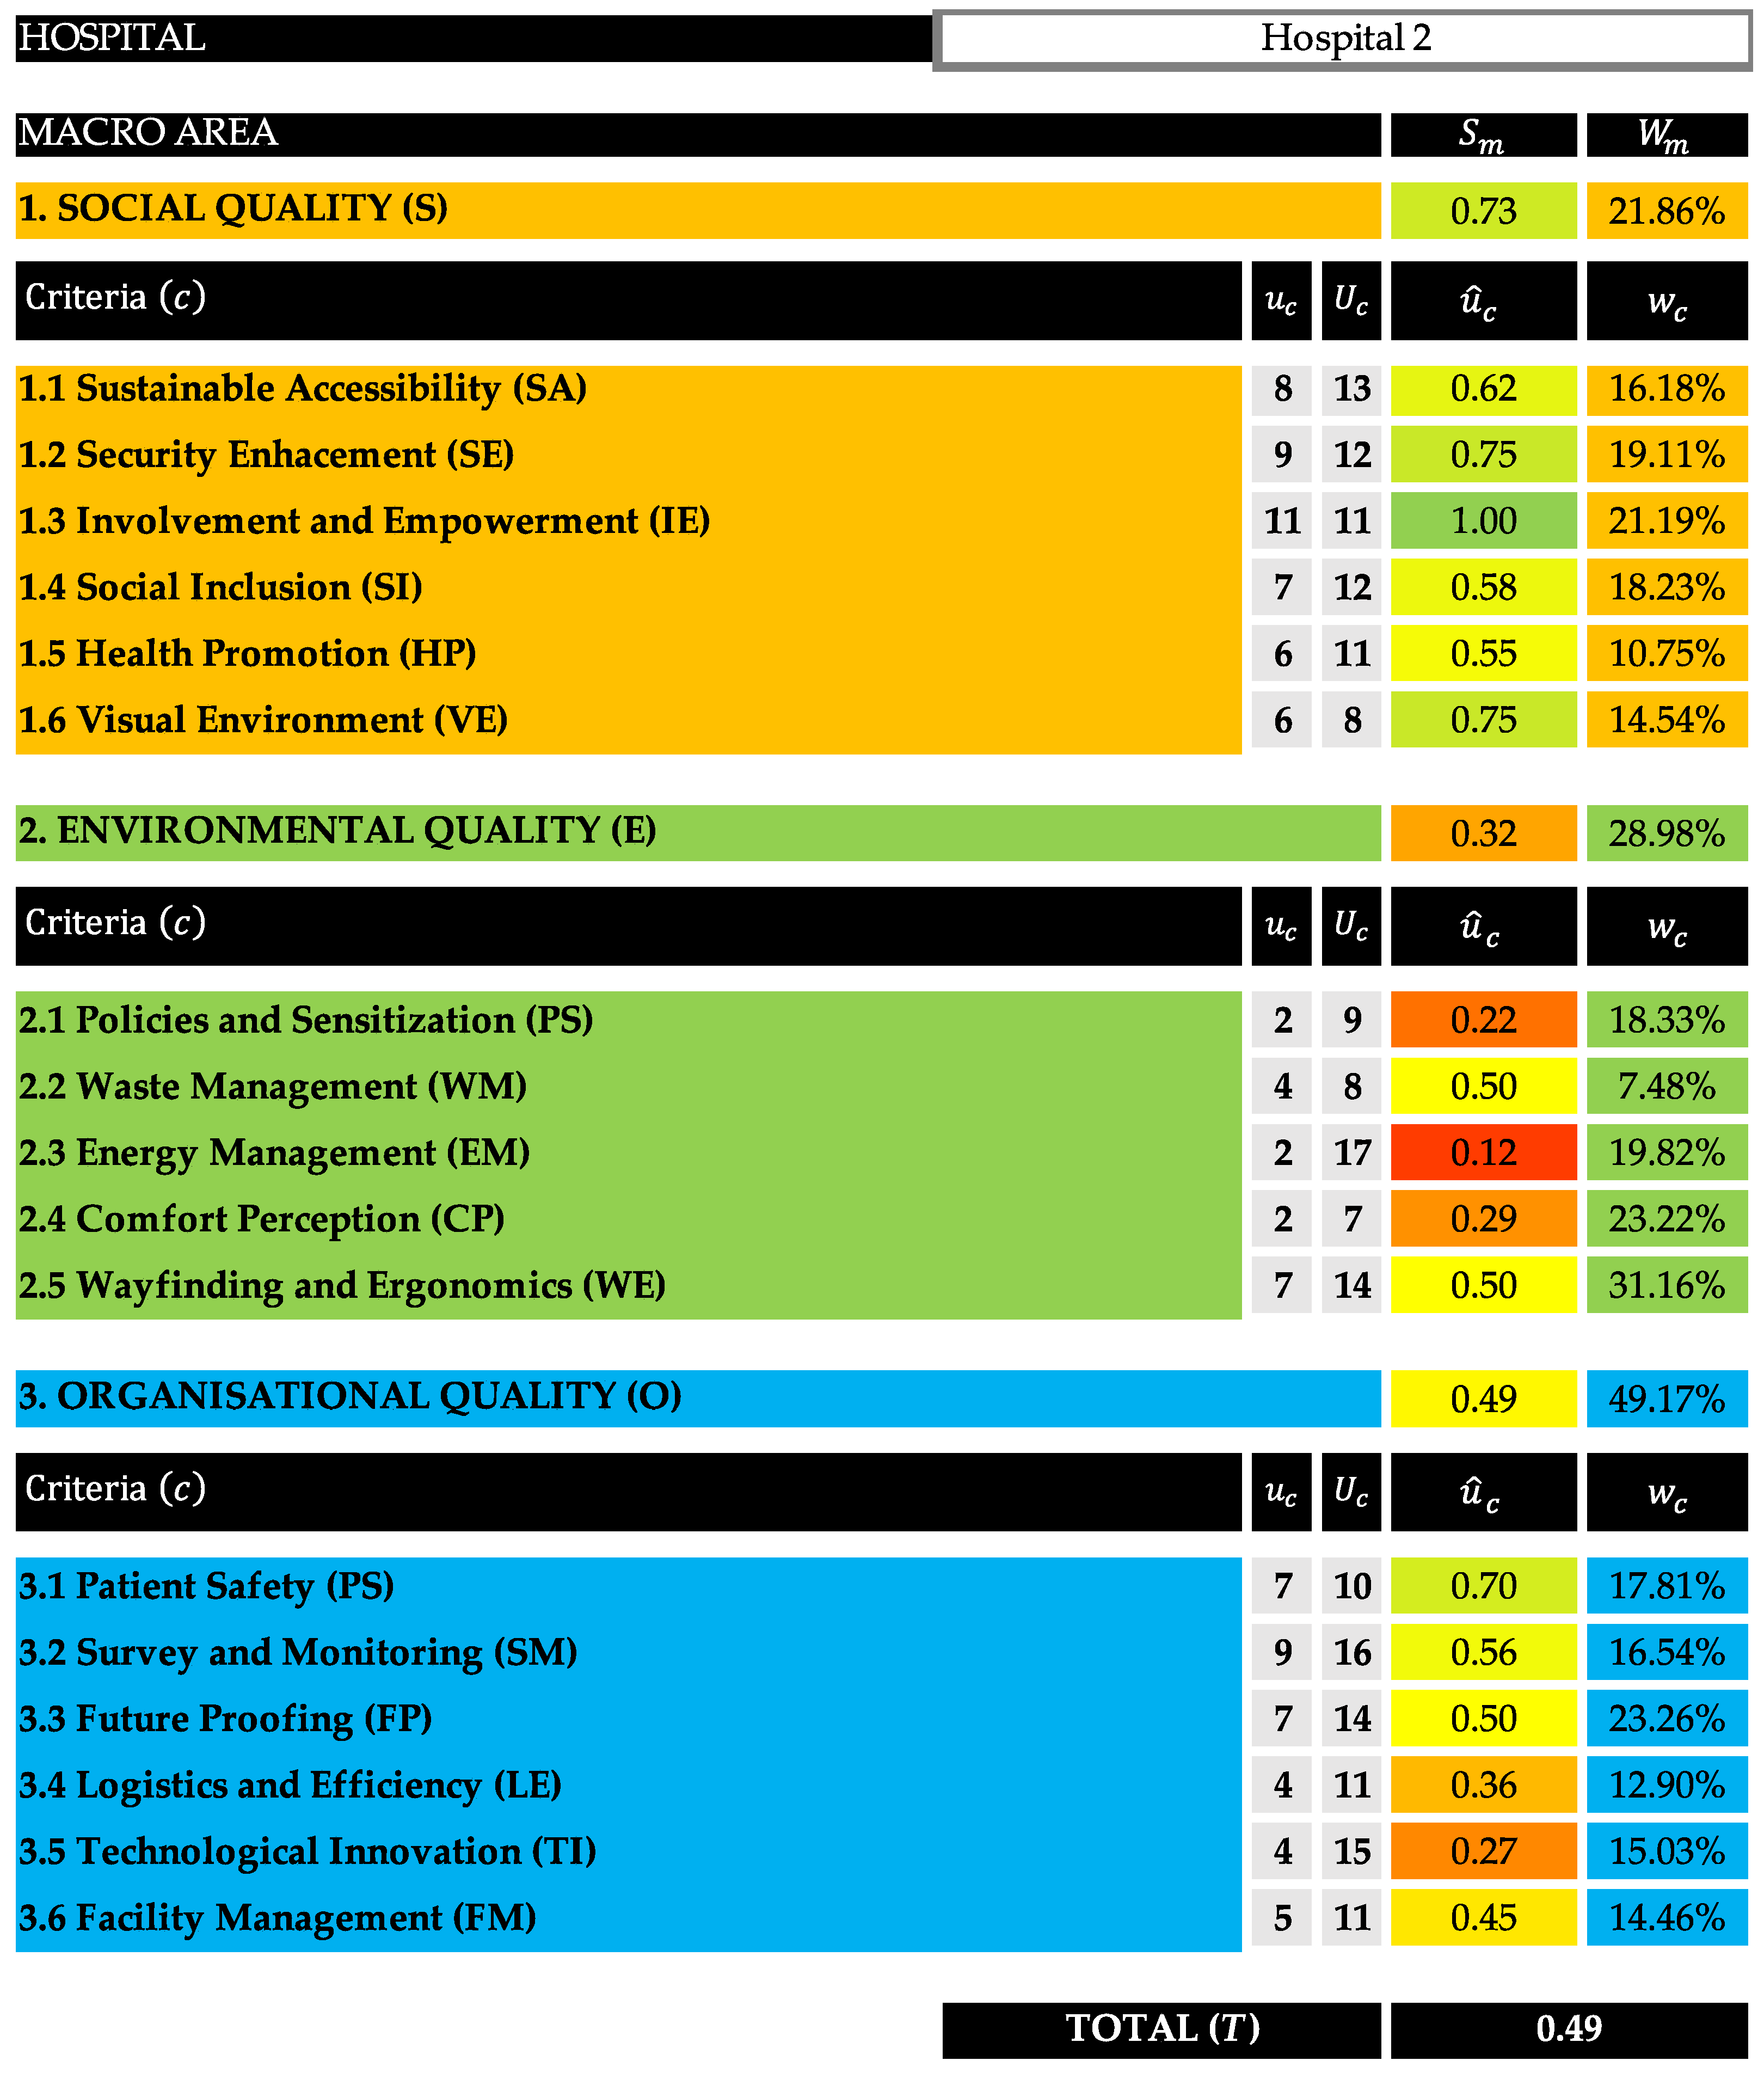
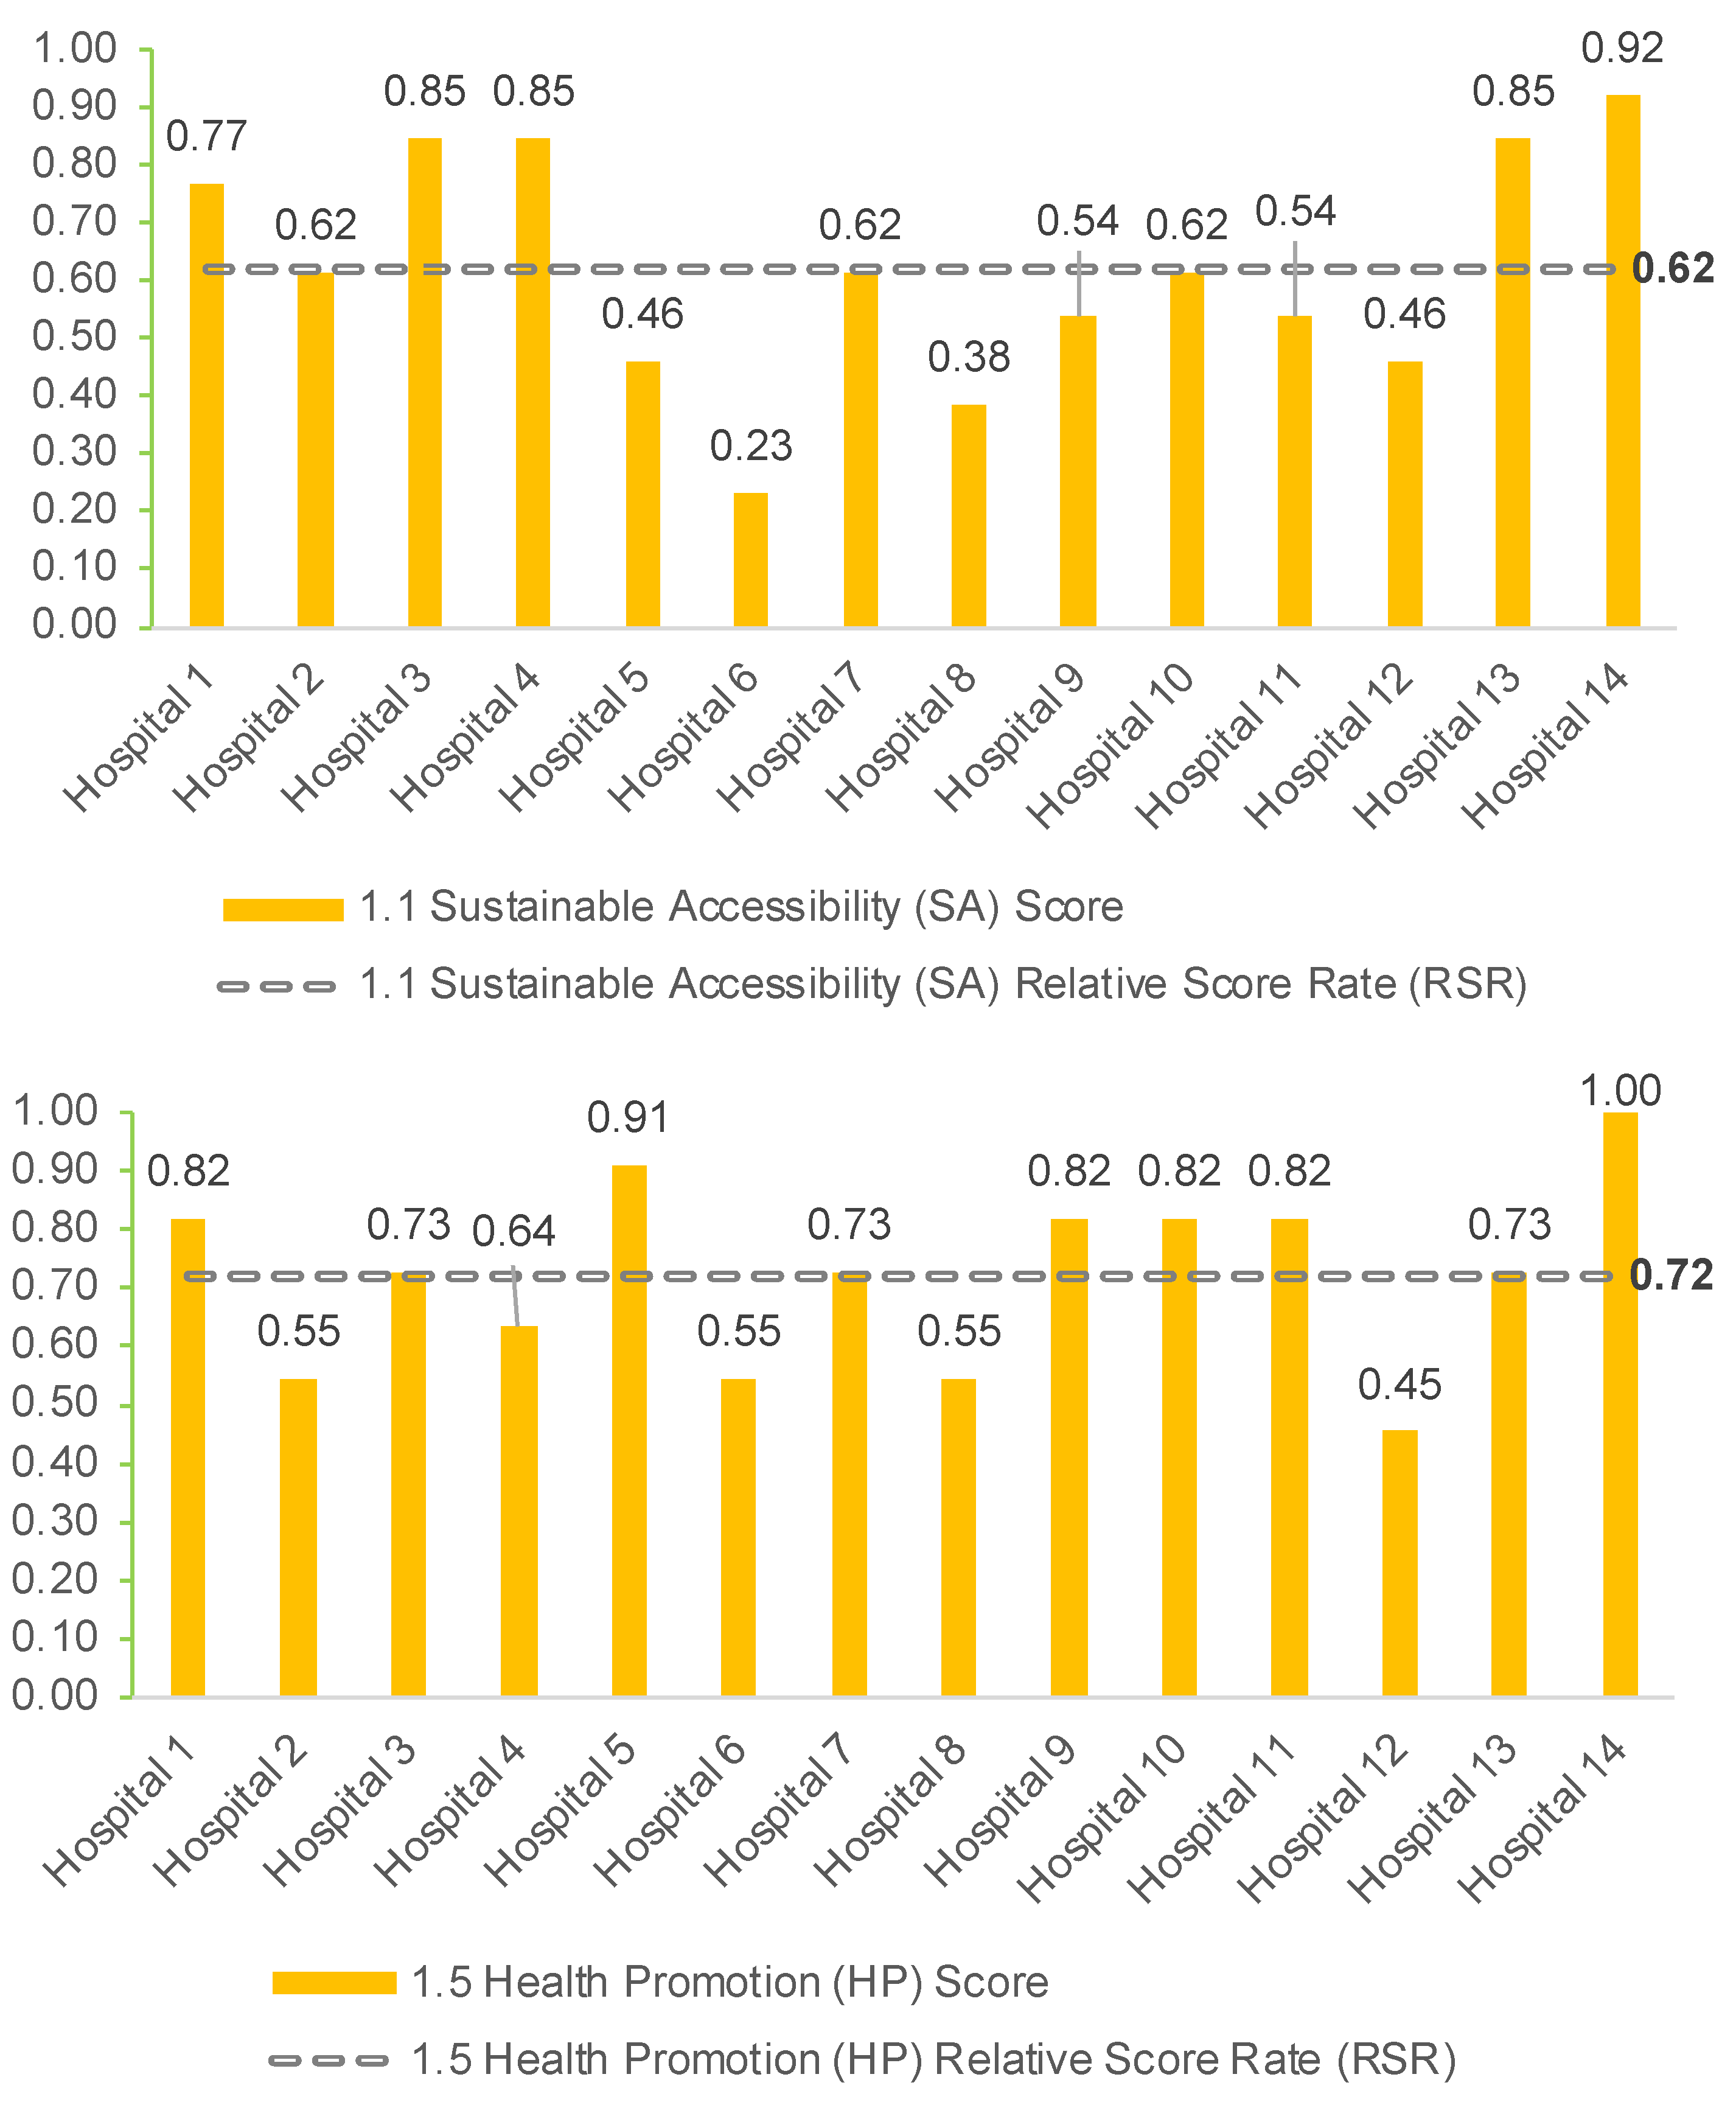
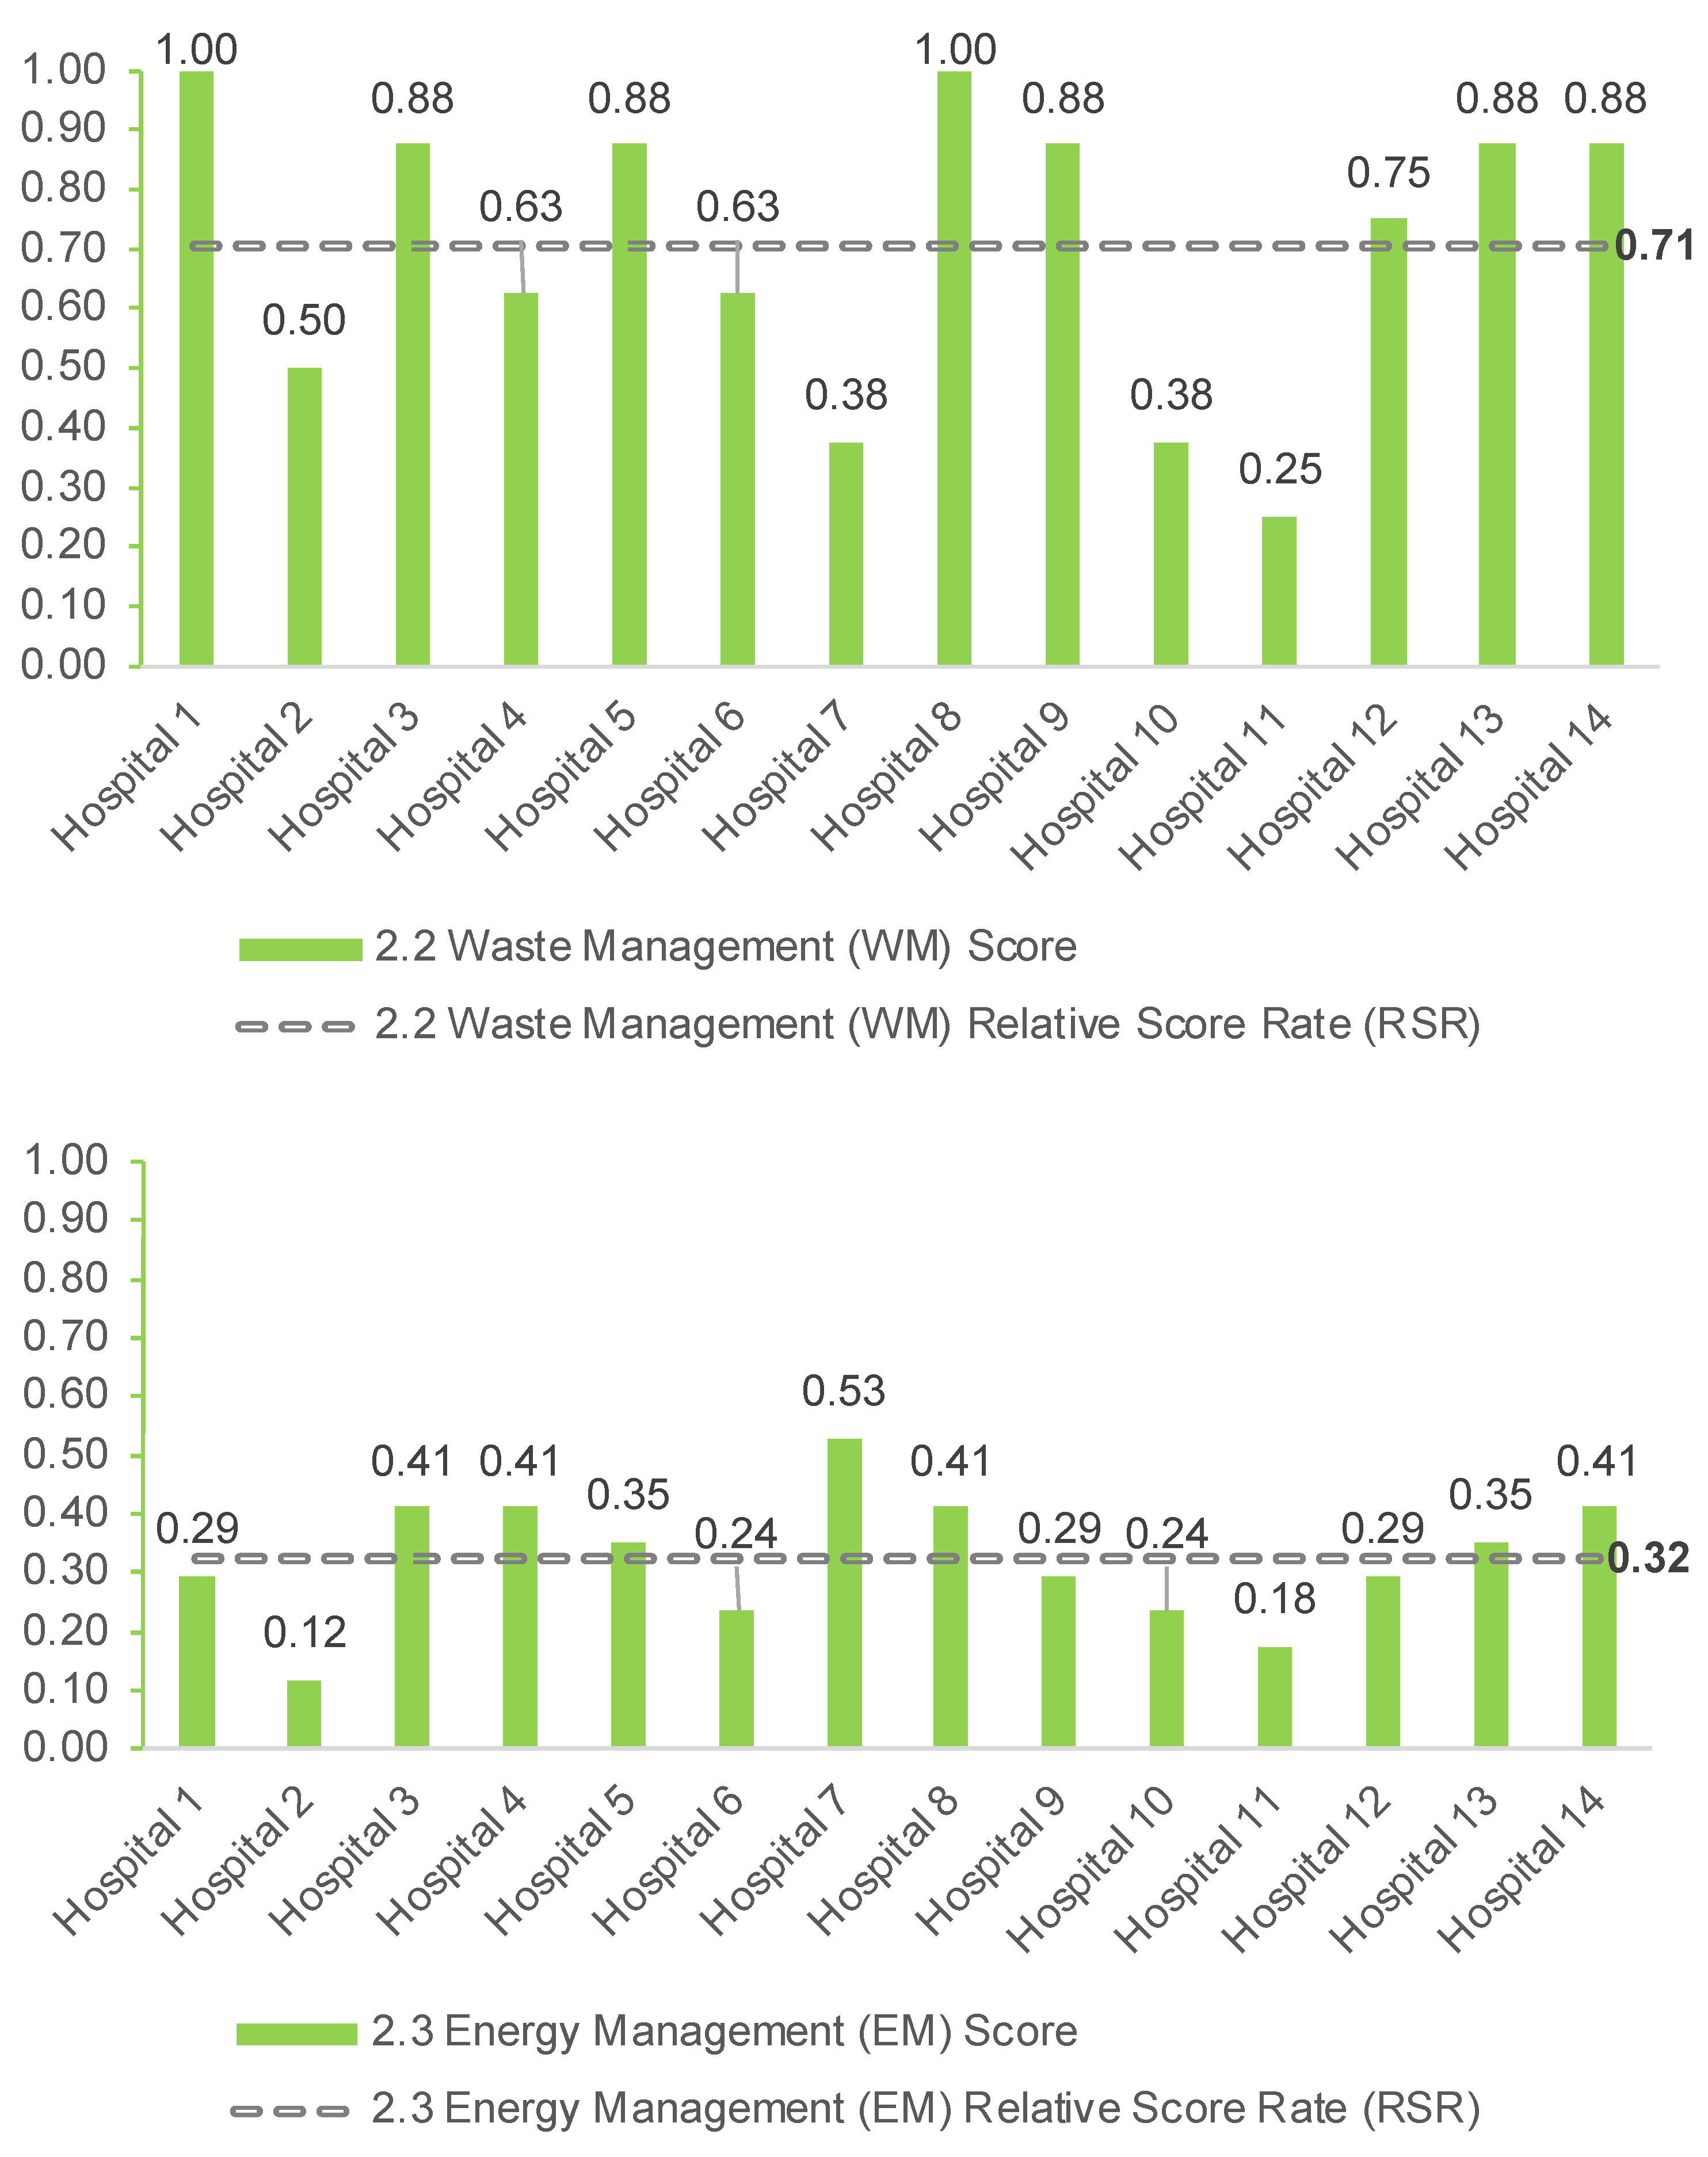
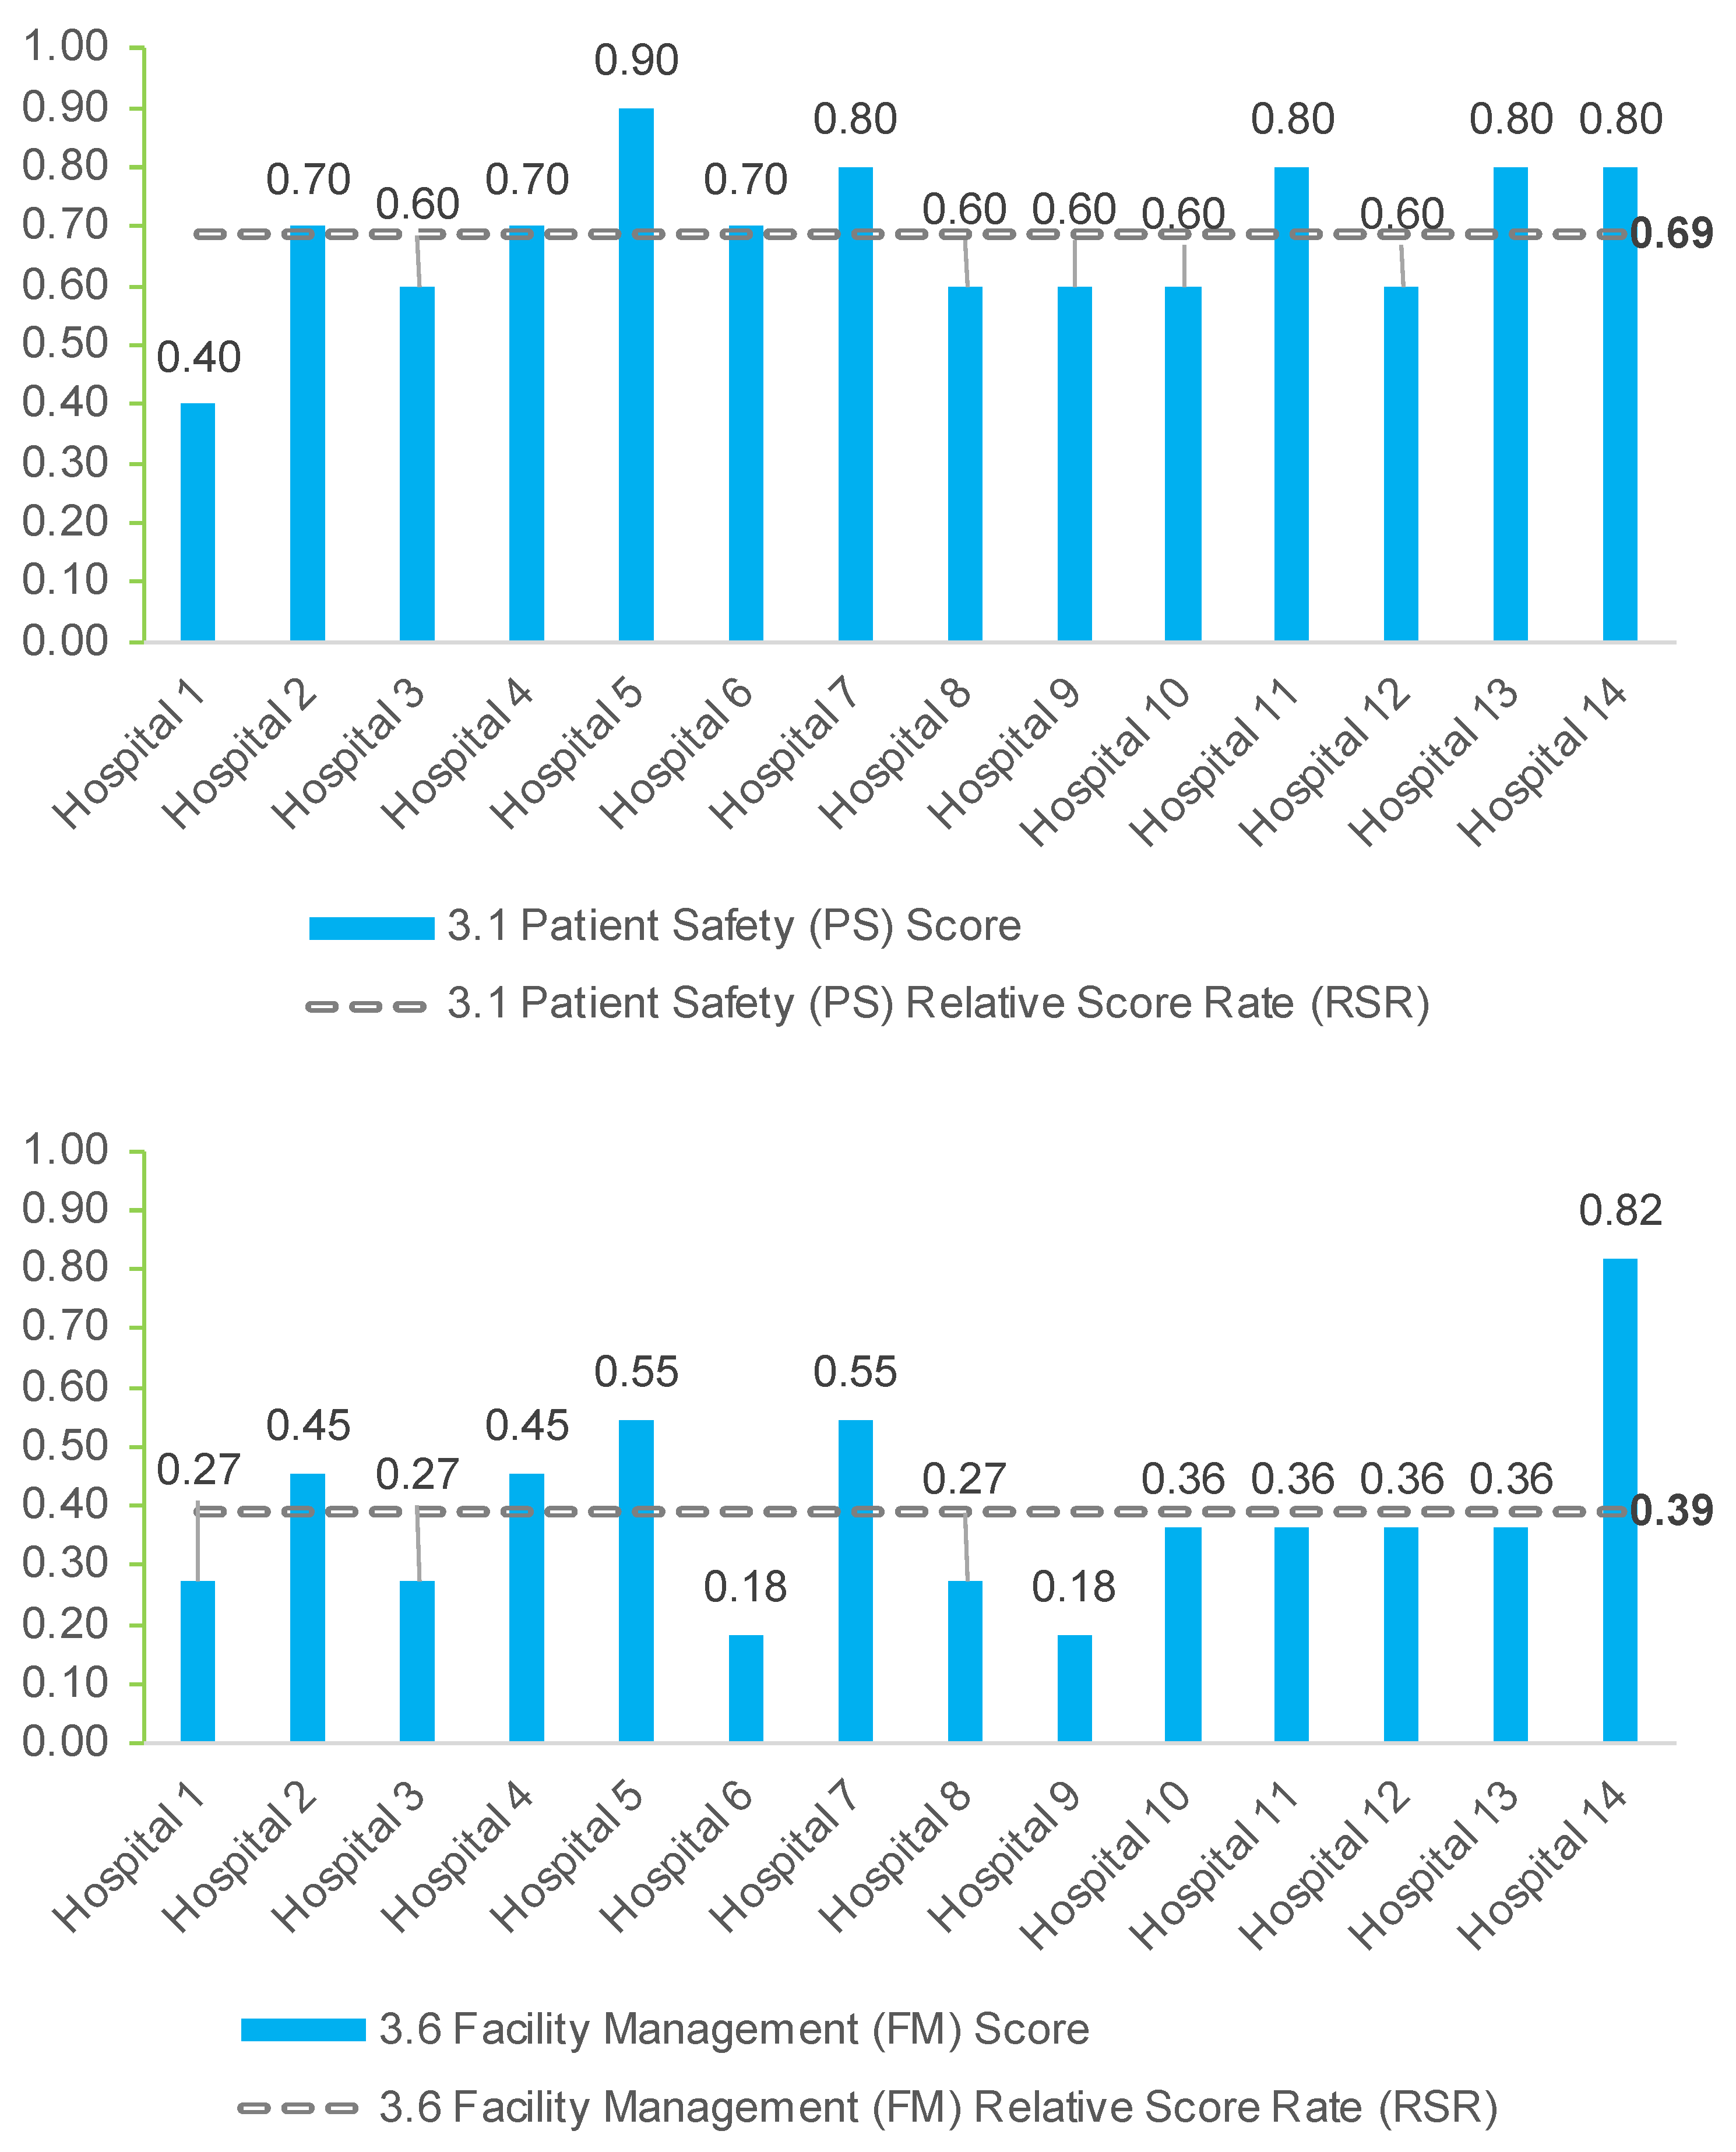
3.3. Evaluation at Macro Area and Criteria Level
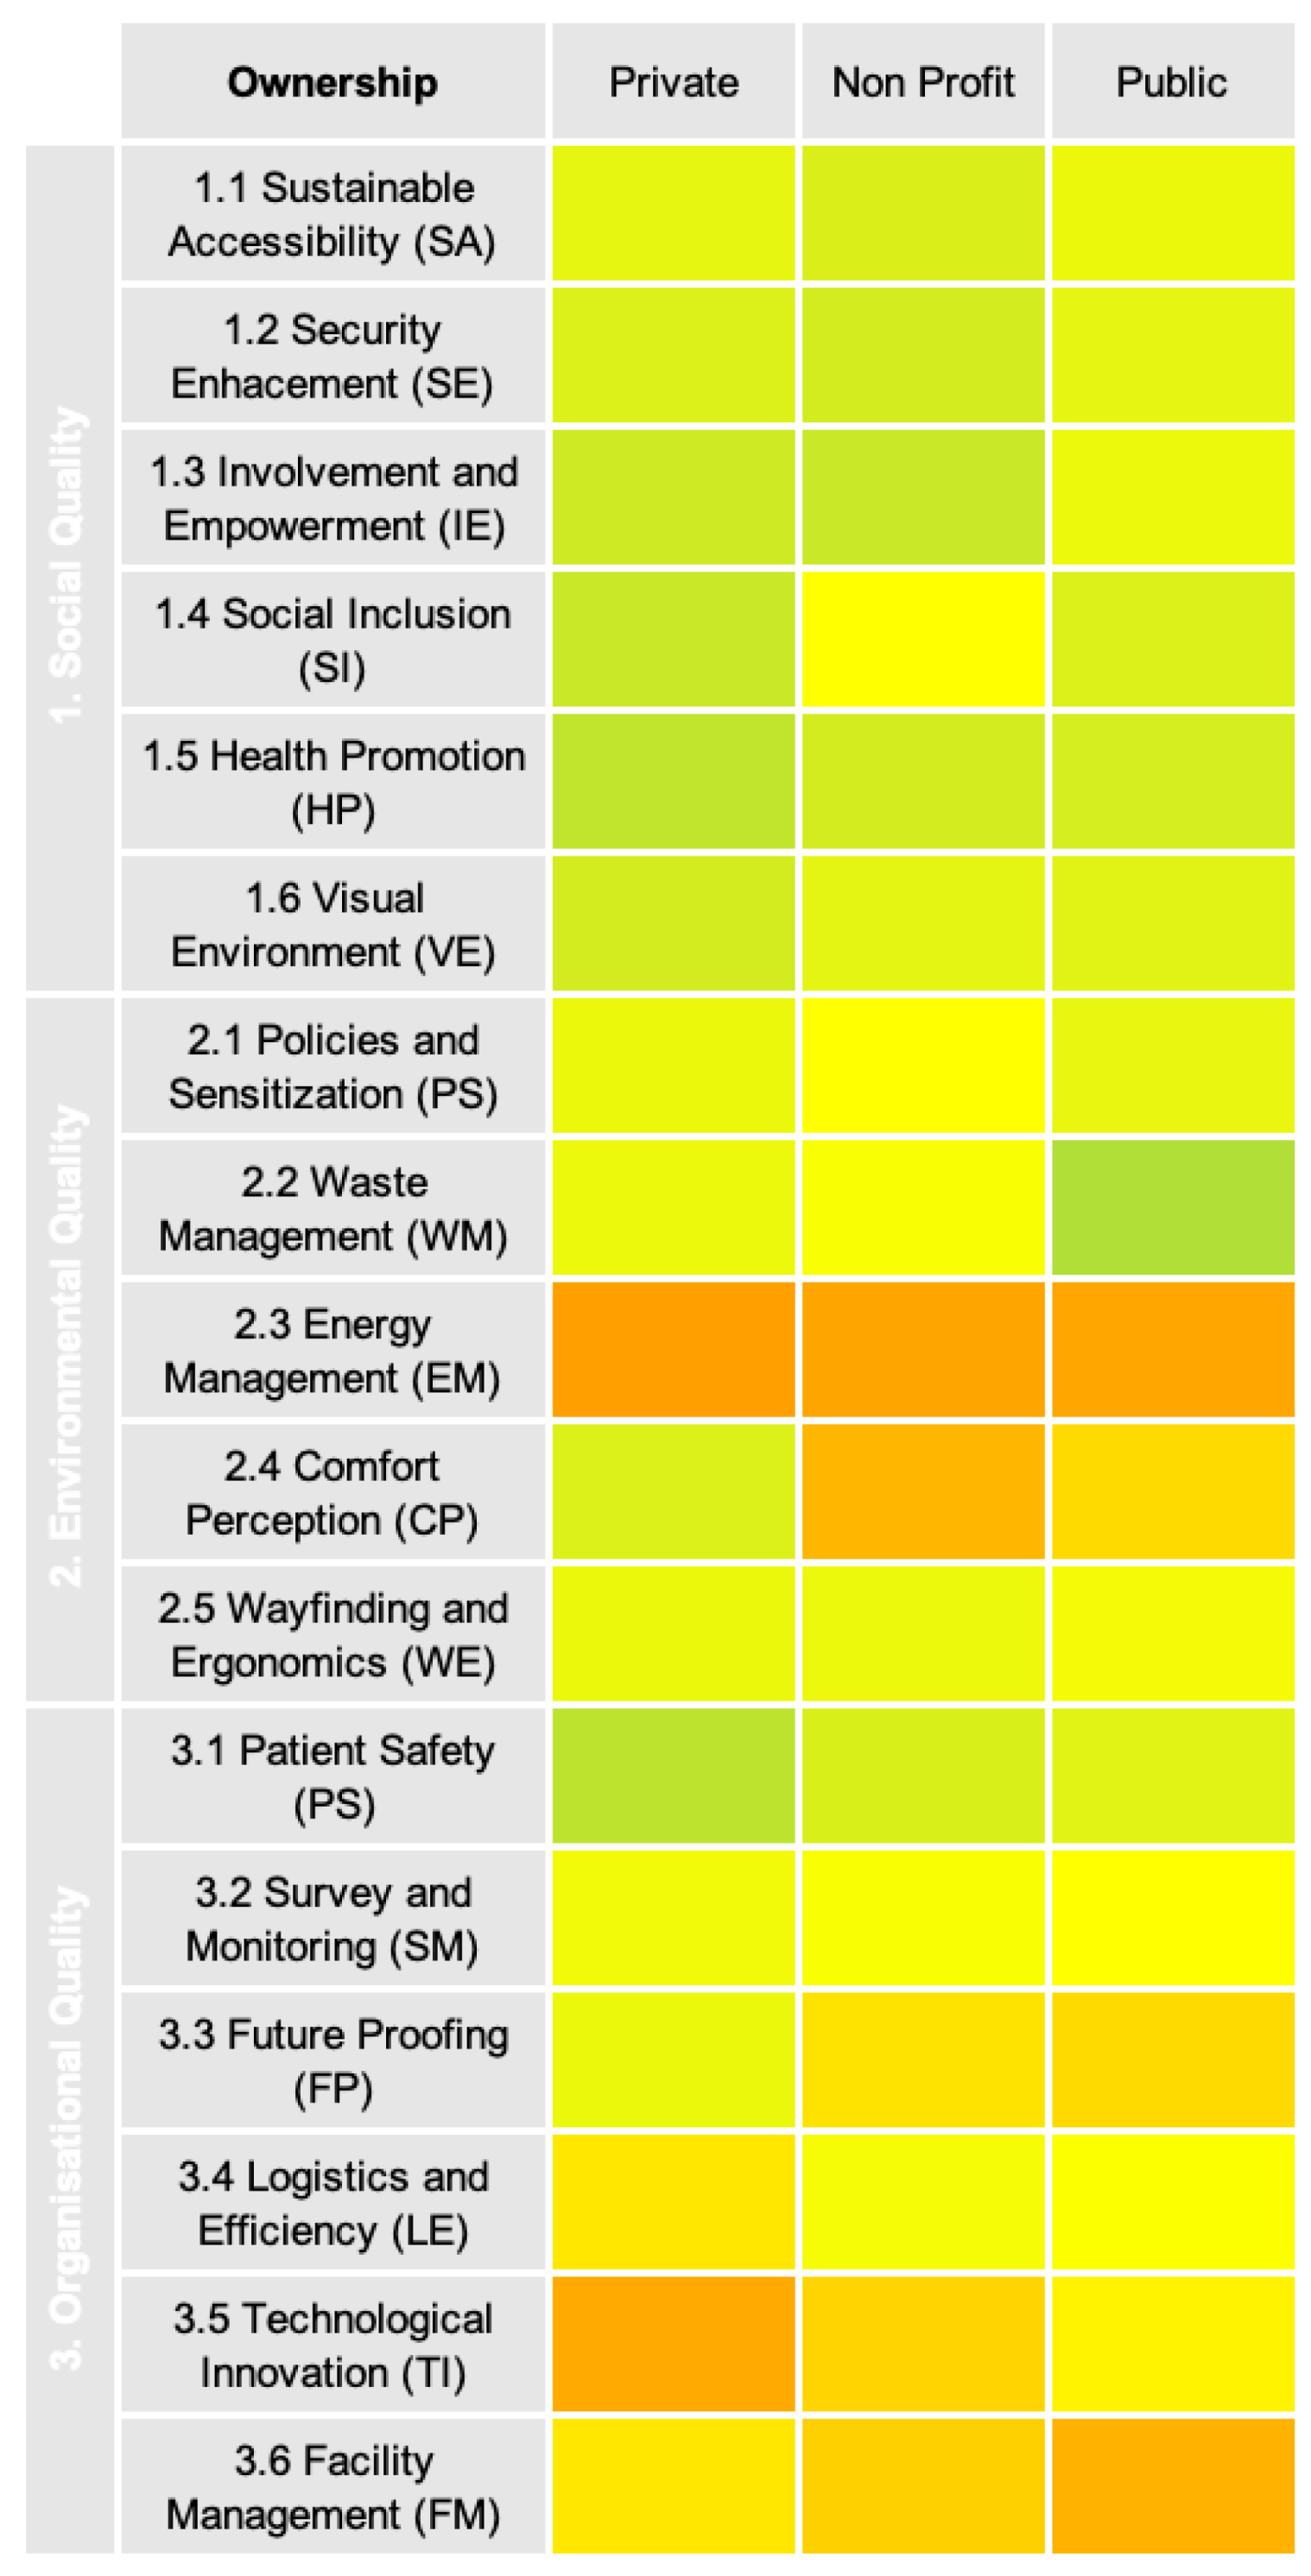
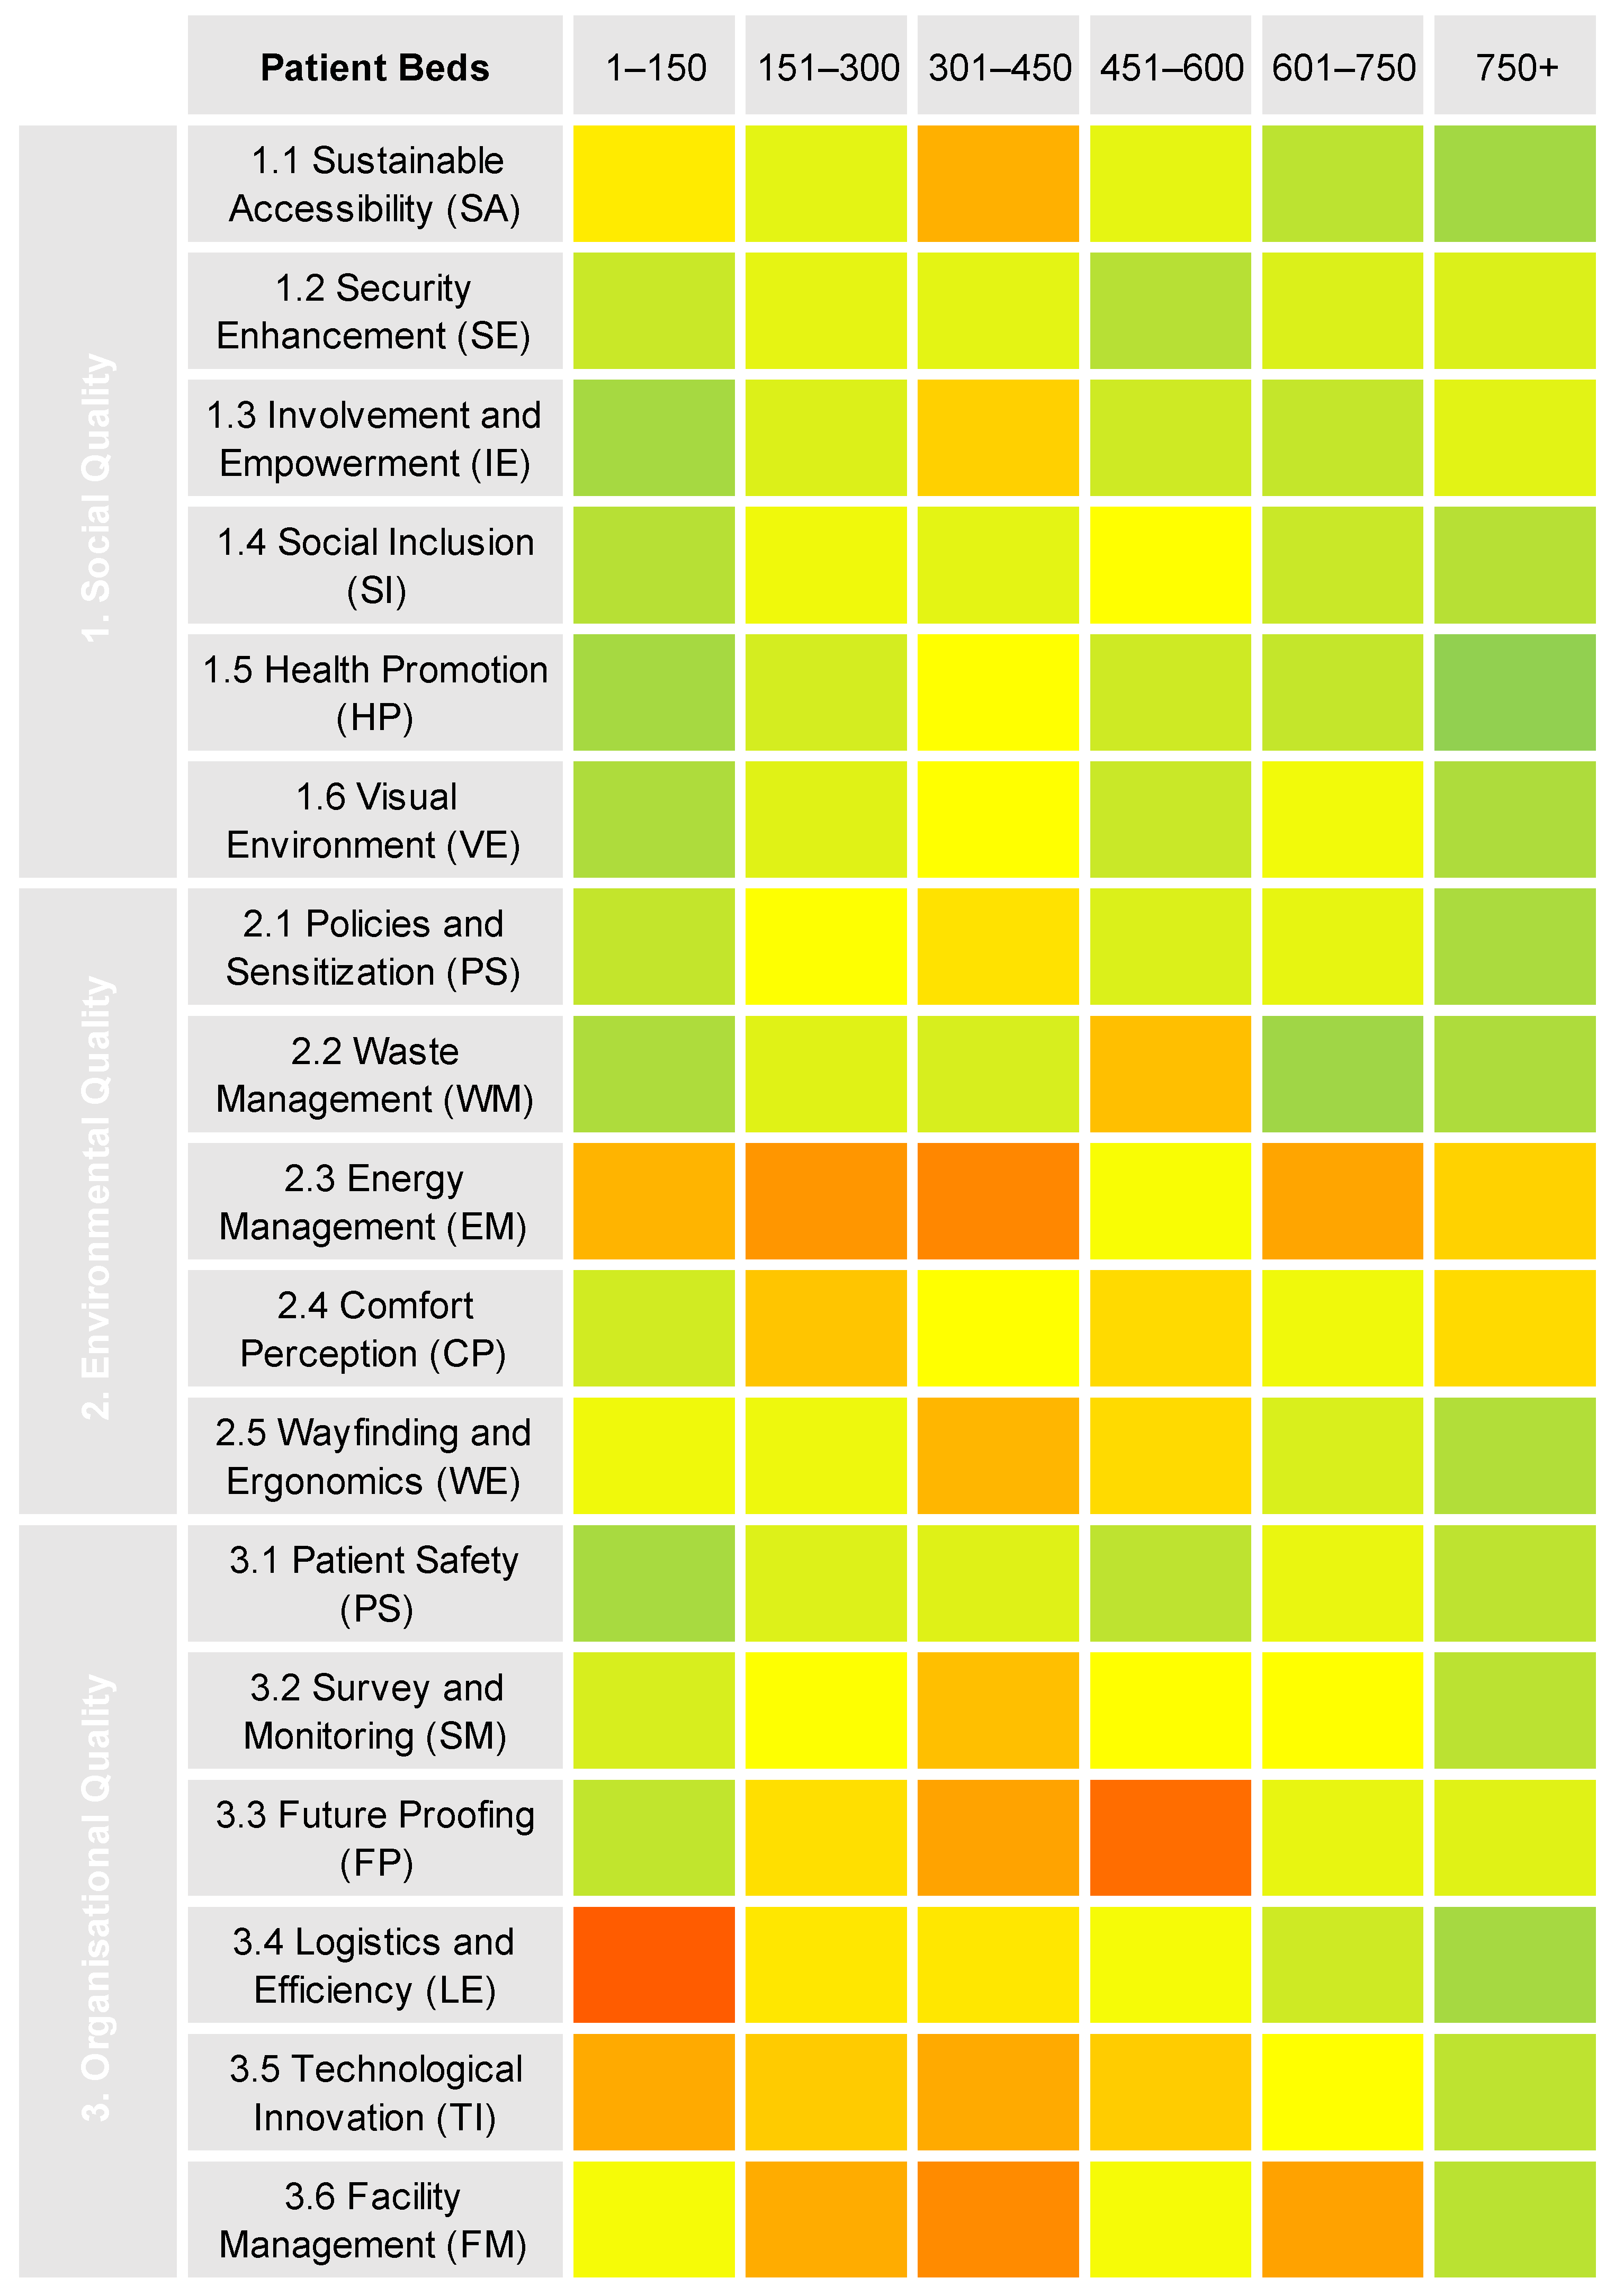
3.4. Evaluation Based on Hospital Size and Ownership
4. Discussion
4.1. Commonalities Based on Ownership and Patient Beds
4.2. Strenghs and Weaknessess within the Sample
4.3. Applicability of SustHealth v2
5. Conclusions
5.1. Research Outlook
5.2. Study Strenghts, Limitations and Future Developments
Author Contributions
Funding
Institutional Review Board Statement
Informed Consent Statement
Data Availability Statement
Acknowledgments
Conflicts of Interest
References
- The Economist. Stabilising the Climate; The Economist Newspaper Limited: London, UK, 2021. [Google Scholar]
- Romero, E.; Ruiz, M.C. Proposal of an agent-based analytical model to convert industrial areas in industrial eco-systems. Sci. Total Environ. 2014, 468–469, 394–405. [Google Scholar] [CrossRef]
- Health Care without Harm. In Health Care’s Climate Footprint; Arup: London, UK, 2019; p. 48.
- Eckelman, M.J.; Huang, K.; Lagasse, R.; Senay, E.; Dubrow, R.; Sherman, J.D. Health care pollution and public health damage in the United States: An update: Study examines health care pollution and public health damage in the United States. Health Aff. 2020, 39, 2071–2079. [Google Scholar] [CrossRef]
- BMG. Ratgeber Krankenhaus-Alles, Was Sie Zum Thema Krankenhaus Wissen Sollten; Bundesministerium für Gesundheit: Berlin, Germany, 2021; pp. 1–108. [Google Scholar]
- Quitmann, C.; Sauerborn, R.; Danquah, I.; Herrmann, A. ‘Climate change mitigation is a hot topic, but not when it comes to hospitals’: A qualitative study on hospital stakeholders’ perception and sense of responsibility for greenhouse gas emissions. J. Med. Ethics 2022, 2021, 107971. [Google Scholar] [CrossRef]
- Cavicchi, C.; Oppi, C.; Vagnoni, E. Back and forth on sustainable development: A focus on healthcare organisations. Sustainability 2022, 14, 4958. [Google Scholar] [CrossRef]
- Lennox, L.; Doyle, C.; Reed, J.E.; Bell, D. What makes a sustainability tool valuable, practical and useful in real-world healthcare practice? A mixed-methods study on the development of the long term success tool in Northwest London. BMJ Open 2017, 7, e014417. [Google Scholar] [CrossRef]
- Punnakitikashem, P.; Hallinger, P. Bibliometric review of the knowledge base on healthcare management for sustainability, 1994–2018. Sustainability 2019, 12, 205. [Google Scholar] [CrossRef] [Green Version]
- Borges de Oliveira, K.; dos Santos, E.F.; Neto, A.F.; de Mello Santos, V.H.; de Oliveira, O.J. Guidelines for efficient and sustainable energy management in hospital buildings. J. Clean. Prod. 2021, 329, 129644. [Google Scholar] [CrossRef]
- Briller, D.L. Patients and urgency: Strategies for designing sustainable and energy-efficient hospitals for the 21st century. Energy Eng. 2014, 111, 22–80. [Google Scholar] [CrossRef]
- Mortimer, F.; Isherwood, J.; Wilkinson, A.; Vaux, E. Sustainability in quality improvement: Redefining value. Future Healthc. J. 2018, 5, 88–93. [Google Scholar] [CrossRef] [Green Version]
- Baumann, A.A.W.; Conway, N.; Doblinger, C.; Steinhauser, S.; Paszko, A.; Lehmann, F.; Schneider, G.; Schulz, C.M.; Schneider, F. Mitigation of climate change in health care: A survey for the evaluation of providers’ attitudes and knowledge, and their view on their organization’s readiness for change. Z. Evidenz Fortbild. Qual. Gesundh. 2022, 173, 108–115. [Google Scholar] [CrossRef]
- Capolongo, S.; Bottero, M.C.; Buffoli, M.; Lettieri, E. (Eds.) Improving Sustainability during Hospital Design and Operation; Green Energy and Technology; Springer International Publishing: Cham, Switzerland, 2015; ISBN 978-3-319-14035-3. [Google Scholar]
- Motevali Haghighi, S.; Torabi, S.A. A novel mixed sustainability-resilience framework for evaluating hospital information systems. Int. J. Med. Inform. 2018, 118, 16–28. [Google Scholar] [CrossRef]
- Nagariya, R.; Kumar, D.; Kumar, I. Sustainability evaluation of service supply chains: A case study of an indian hospital. Int. J. Product. Perform. Manag. 2021; ahead of print. [Google Scholar] [CrossRef]
- Borges de Oliveira, K.; de Oliveira, O.J. Making hospitals sustainable: Towards greener, fairer and more prosperous services. Sustainability 2022, 14, 9730. [Google Scholar] [CrossRef]
- Stevanovic, M.; Allacker, K.; Vermeulen, S. Hospital building sustainability: The experience in using qualitative tools and steps towards the life cycle approach. Procedia Environ. Sci. 2017, 38, 445–451. [Google Scholar] [CrossRef] [Green Version]
- Büttner, L.; Posch, H.; Auer, T.A.; Jonczyk, M.; Fehrenbach, U.; Hamm, B.; Bauknecht, H.C.; Böning, G. Switching off for future—Cost estimate and a simple approach to improving the ecological footprint of radiological departments. Eur. J. Radiol. Open 2021, 8, 1–6. [Google Scholar] [CrossRef]
- Helfrich, C.D.; Li, Y.-F.; Sharp, N.D.; Sales, A.E. Organizational Readiness to Change Assessment (ORCA): Development of an instrument based on the Promoting Action on Research in Health Services (PARIHS) framework. Implement. Sci. 2009, 4, 38. [Google Scholar] [CrossRef] [Green Version]
- Chisholm, J.M.; Zamani, R.; Negm, A.M.; Said, N.; Abdel Daiem, M.M.; Dibaj, M.; Akrami, M. Sustainable waste management of medical waste in african developing countries: A narrative review. Waste Manag. Res. 2021, 39, 1149–1163. [Google Scholar] [CrossRef]
- Ali, M.; Cristiano, S.; Geng, Y.; Gonella, F.; Ulgiati, S. Environmental assessment of healthcare facilities in the Global South—A case study from Pakistan. J. Environ. Account. Manag. 2021, 9, 285–297. [Google Scholar] [CrossRef]
- Alshqaqeeq, F.; Amin Esmaeili, M.; Overcash, M.; Twomey, J. Quantifying hospital services by carbon footprint: A systematic literature review of patient care alternatives. Resour. Conserv. Recycl. 2020, 154, 104560. [Google Scholar] [CrossRef]
- Jiménez-Lacarra, V.; Martínez-Cámara, E.; Santamaría-Peña, J.; Jiménez-Macías, E.; Bruzzone, A.; Blanco-Fernández, J. Environmental efficiency indices in the public hospital sector: A PROPOSAL. Appl. Sci. 2022, 12, 8120. [Google Scholar] [CrossRef]
- Balbus, J.; Berry, P.; Brettle, M.; Jagnarine-Azan, S.; Soares, A.; Ugarte, C.; Varangu, L.; Prats, E.V. Enhancing the sustainability and climate resiliency of health care facilities: A comparison of initiatives and toolkits. Rev. Panam. Salud Publica 2016, 40, 174–180. [Google Scholar]
- Weisz, U.; Haas, W.; Pelikan, J.M.; Schmied, H. Sustainable hospitals: A socio-ecological approach. GAIA Ecol. Perspect. Sci. Soc. 2011, 20, 191–198. [Google Scholar] [CrossRef] [Green Version]
- Moore, J.E.; Mascarenhas, A.; Bain, J.; Straus, S.E. Developing a comprehensive definition of sustainability. Implement. Sci. 2017, 12, 110. [Google Scholar] [CrossRef] [PubMed]
- Johnston, P.; Everard, M.; Santillo, D.; Robèrt, K.-H. Reclaiming the definition of sustainability. Environ. Sci. Pollut. Res. Int. 2007, 14, 60–66. [Google Scholar] [CrossRef] [PubMed]
- UNWCED. Our Common Future; Oxford University Press: New York, NY, USA, 1987; pp. 1–374. [Google Scholar]
- Desa, U.N. Transforming our world: The 2030 agenda for sustainable development. In A New Era in Global Health; Rosa, W., Ed.; Springer Publishing Company: New York, NY, USA, 2017; ISBN 978-0-8261-9011-6. [Google Scholar]
- WHO. World Health Statistics 2018: Monitoring Health for the SDGs: Sustainable Development Goals; World Health Organization: Geneva, Switzerland, 2018; ISBN 978-92-4-156558-5. [Google Scholar]
- Elkington, J. Cannibals with Forks: The Triple Bottom Line of 21st Century Business; Capstone: Oxford, UK, 1997; ISBN 978-1-900961-27-1. [Google Scholar]
- Friedman, M. A Friedman doctrine—The social responsibility of business is to increase its profits. N. Y. Times Mag. 1970, 17, 32–33. [Google Scholar]
- McWilliams, A.; Siegel, D. Corporate social responsibility: A theory of the firm perspective. Acad. Manag. Rev. 2001, 26, 117–127. [Google Scholar] [CrossRef]
- Porter, M.E.; Kramer, M.R. Strategy & society: The link between competitive advantage and corporate social responsibility. Harv. Bus. Rev. 2006, 84, 78–92. [Google Scholar]
- Elkington, J. Towards the sustainable corporation: Win-win-win business strategies for sustainable development. Calif. Manag. Rev. 1994, 36, 90–100. [Google Scholar] [CrossRef]
- Brambilla, A.; Lindahl, G.; Dell’Ovo, M.; Capolongo, S. Validation of a multiple criteria tool for healthcare facilities quality evaluation. Facilities 2020, 39, 434–447. [Google Scholar] [CrossRef]
- Li, Y.; Pan, X.; Han, Y.; Taylor, J.E. Sustainable healthcare facilities: A scoping review. J. Constr. Eng. Manag. 2021, 147, 03121007. [Google Scholar] [CrossRef]
- Brambilla, A. Evidence Informed Hospital Assessment-Implementation, Weight, and Test of a Multiple Criteria Tool for Social, Environmental and Organizational Quality Assessment of Hospital Buildings 2021. Ph.D. Thesis, Politecnico di Milano, Milano, Italy, 2021. [Google Scholar]
- Munn, Z.; Peters, M.D.J.; Stern, C.; Tufanaru, C.; McArthur, A.; Aromataris, E. Systematic review or scoping review? Guidance for authors when choosing between a systematic or scoping review approach. BMC Med. Res. Methodol. 2018, 18, 143. [Google Scholar] [CrossRef]
- Moher, D.; Liberati, A.; Tetzlaff, J.; Altman, D.G. The PRISMA Group preferred reporting items for systematic reviews and meta-analyses: The PRISMA statement. PLoS Med. 2009, 6, e1000097. [Google Scholar] [CrossRef] [PubMed] [Green Version]
- Brambilla, A.; Buffoli, M.; Capolongo, S. Measuring hospital qualities. A preliminary investigation on health impact assessment possibilities for evaluating complex buildings. Acta Bio Med. Atenei Parm. 2019, 90, 54–63. [Google Scholar] [CrossRef]
- Aalto, L.; Lappalainen, S.; Salonen, H.; Reijula, K. Usability evaluation (IEQ survey) in hospital buildings. Int. J. Workplace Health Manag. 2017, 10, 265–282. [Google Scholar] [CrossRef]
- Altizer, Z.; Canar, W.J.; Redemske, D.; Fullam, F.; Lamont, M. Utilization of a standardized post-occupancy evaluation to assess the guiding principles of a major academic medical center. HERD Health Environ. Res. Des. J. 2019, 12, 168–178. [Google Scholar] [CrossRef]
- Elf, M.; Nordin, S.; Wijk, H.; Mckee, K.J. A systematic review of the psychometric properties of instruments for assessing the quality of the physical environment in healthcare. J. Adv. Nurs. 2017, 73, 2796–2816. [Google Scholar] [CrossRef] [Green Version]
- McCusker, J.; Minh Vu, T.T.; Veillette, N.; Cossette, S.; Vadeboncoeur, A.; Ciampi, A.; Cetin-Sahin, D.; Belzile, E. Elder-friendly emergency department: Development and validation of a quality assessment tool. J. Am. Geriatr. Soc. 2018, 66, 394–400. [Google Scholar] [CrossRef]
- Brambilla, A.; Rebecchi, A.; Capolongo, S. Evidence based hospital design. A literature review of the recent publications about the EBD impact of built environment on hospital occupants’ and organizational outcomes. Ann. Ig. Med. Prev. Comunità 2019, 31, 165–180. [Google Scholar] [CrossRef]
- DiGerolamo, K.; Davis, K.F. An integrative review of pediatric fall risk assessment tools. J. Pediatr. Nurs. 2017, 34, 23–28. [Google Scholar] [CrossRef]
- Buffoli, M.; Bellini, E.; Dell’Ovo, M.; Gola, M.; Nachiero, D.; Rebecchi, A.; Capolongo, S. Humanisation and soft qualities in emergency rooms. Ann. Ist. Super. Sanità 2015, 52, 40–47. [Google Scholar] [CrossRef] [Green Version]
- Srivastava, R.R.; Rawal, N. Approach for the Assessment and ranking of hospitals based on waste management practices using RIAM, sustainability, and EPI techniques. J. Hazard. Toxic Radioact. Waste 2021, 25, 26–38. [Google Scholar] [CrossRef]
- AlJaberi, O.A.; Hussain, M.; Drake, P.R. A framework for measuring sustainability in healthcare systems. Int. J. Healthc. Manag. 2020, 13, 276–285. [Google Scholar] [CrossRef]
- Ramadan, N.; Arafeh, M. Healthcare quality maturity assessment model based on quality drivers. Int. J. Health Care Qual. Assur. 2016, 29, 337–350. [Google Scholar] [CrossRef] [PubMed]
- Aleu, F.G. Performance excellence self-assessment tool: A hospital case study. In Proceedings of the International Conference on Industrial Engineering and Operations Management, IEOM Society International, Bandung, Indonesia, 5–7 March 2018. [Google Scholar]
- Hannan-Jones, M.; Capra, S. Developing a valid meal assessment tool for hospital patients. Appetite 2017, 108, 68–73. [Google Scholar] [CrossRef] [PubMed]
- Brambilla, A.; Capolongo, S. Healthy and sustainable hospital evaluation—A review of POE tools for hospital assessment in an evidence-based design framework. Buildings 2019, 9, 76. [Google Scholar] [CrossRef] [Green Version]
- Castellini, G.; Demarchi, A.; Lanzoni, M.; Castaldi, S. Fall prevention: Is the STRATIFY tool the right instrument in italian hospital inpatient? A retrospective observational study. BMC Health Serv. Res. 2017, 17, 656. [Google Scholar] [CrossRef] [Green Version]
- Chang, S.-Y.; Chen, W.-S.; Teng, T.; Yeh, C.-Y.; Yen, H.-C. Fall risk program for oncology inpatients: Addition of the “Traffic Light” fall risk assessment tool. J. Nurs. Care Qual. 2019, 34, 139–144. [Google Scholar] [CrossRef]
- Villiers-Tuthill, A.; Doulougeri, K.; McGee, H.; Montgomery, A.; Panagopoulou, E.; Morgan, K. Development and validation of a cross-country hospital patient quality of care assessment tool in Europe. Patient 2017, 10, 753–761. [Google Scholar] [CrossRef]
- Capolongo, S.; Gola, M.; di Noia, M.; Nickolova, M.; Nachiero, D.; Rebecchi, A.; Settimo, G.; Vittori, G.; Buffoli, M. Social sustainability in healthcare facilities: A rating tool for analysing and improving social aspects in environments of care. Ann. Ist. Super. Sanità 2016, 52, 15–23. [Google Scholar] [CrossRef] [Green Version]
- Stevanovic, M.; Allacker, K.; Vermeulen, S. Development of an approach to assess the life cycle environmental impacts and costs of general hospitals through the analysis of a belgian case. Sustainability 2019, 11, 856. [Google Scholar] [CrossRef] [Green Version]
- Snyder, K.; Paulson, P.; Bergen, S. A website assessment tool for patient engagement: A verification. Int. J. Healthc. Manag. 2020, 13, 58–64. [Google Scholar] [CrossRef]
- Hevner, A.R.; March, S.T.; Park, J.; Ram, S. Design science in information systems research. MIS Q. 2004, 28, 75–105. [Google Scholar] [CrossRef] [Green Version]
- Johannesson, P.; Perjons, E. An Introduction to Design Science; Springer International Publishing: Cham, Switzerland, 2014; ISBN 978-3-319-10631-1. [Google Scholar]
- Van Aken, J.E.; Chandrasekaran, A.; Halman, J. Conducting and publishing design science research: Inaugural essay of the design science department of the journal of operations management. J. Oper. Manag. 2016, 47–48, 1–8. [Google Scholar] [CrossRef]
- March, S.T.; Smith, G.F. Design and natural science research on information technology. Decis. Support Syst. 1995, 15, 251–266. [Google Scholar] [CrossRef]
- Romme, A.G.L. Making a difference: Organization as design. Organ. Sci. 2003, 14, 558–573. [Google Scholar] [CrossRef]
- Simon, H.A. The Sciences of the Artificial, 3rd ed.; MIT Press: Cambridge, MA, USA, 1996. [Google Scholar]
- Van Aken, J.E. Management research based on the paradigm of the design sciences: The quest for field-tested and grounded technological rules: Paradigm of the design sciences. J. Manag. Stud. 2004, 41, 219–246. [Google Scholar] [CrossRef]
- Pettigrew, A.M. The double hurdles for management research. In Advancement in Organizational Behaviour: Essays in Honour of D. S. Pugh; Clarke, T., Ed.; Dartmouth Press: London, UK, 1997; pp. 277–296. [Google Scholar]
- Van Aken, J.E.; Romme, G. Reinventing the future: Adding design science to the repertoire of organization and management studies. Organ. Manag. J. 2009, 6, 5–12. [Google Scholar] [CrossRef]
- Klesel, M.; Henseler, J. Emergence in Design Science Research; University of Siegen: Siegen, Germany, 2020. [Google Scholar] [CrossRef]
- Gregor, S.; Hevner, A.R. Positioning and presenting design science research for maximum impact. MIS Q. 2013, 37, 337–355. [Google Scholar] [CrossRef]
- Bustos, D.; Teixeira, T.; Guedes, J.C.; Santos Baptista, J.; Vaz, M. A short review on the usage of online surveys among health professionals. In Occupational and Environmental Safety and Health III; Arezes, P.M., Baptista, J.S., Carneiro, P., Castelo Branco, J., Costa, N., Duarte, J., Guedes, J.C., Melo, R.B., Miguel, A.S., Perestrelo, G., Eds.; Studies in Systems, Decision and Control; Springer International Publishing: Cham, Switzerland, 2022; Volume 406, pp. 621–633. ISBN 978-3-030-89616-4. [Google Scholar]
- Eurostat Healthcare Resource Statistics—Beds. Available online: https://ec.europa.eu/eurostat/statistics-explained/index.php?title=Healthcare_resource_statistics_beds#:~:text=Among%20the%20EU%20Member%20States,hospital%20beds%20per%20100%20000 (accessed on 8 October 2021).
- KLIK, Green KLIK-Klimamanager für Kliniken. Available online: https://www.klik-krankenhaus.de/startseite (accessed on 24 September 2021).
- Dell’Ovo, M.; Oppio, A.; Capolongo, S. Policy implications. How to support decision-makers in setting and solving complex problems. In Decision Support System for the Location of Healthcare Facilities; SpringerBriefs in Applied Sciences and Technology; Springer International Publishing: Cham, Switzerland, 2020; pp. 113–121. ISBN 978-3-030-50172-3. [Google Scholar]
- Corrente, S.; Figueira, J.R.; Greco, S. A new scaling MCDA procedure putting together pairwise comparison tables and the deck of cards method. arXiv 2019, arXiv:1904.01315. [Google Scholar]
- Figueira, J.; Roy, B. Determining the weights of criteria in the ELECTRE type methods with a revised simos’ procedure. Eur. J. Oper. Res. 2002, 139, 317–326. [Google Scholar] [CrossRef] [Green Version]
- Augurzky, B.; Engel, D.; Schmidt, C.M.; Schwierz, C. Ownership and financial sustainability of german acute care hospitals. Health Econ. 2012, 21, 811–824. [Google Scholar] [CrossRef]
- Pantzartzis, E.; Edum-Fotwe, F.T.; Price, A.D.F. Sustainable healthcare facilities: Reconciling bed capacity and local needs. Int. J. Sustain. Built Environ. 2017, 6, 54–68. [Google Scholar] [CrossRef] [Green Version]
- Coyne, J.S.; Richards, M.T.; Short, R.; Shultz, K.; Singh, S.G. Hospital cost and efficiency: Do hospital size and ownership type really matter? J. Healthc. Manag. 2009, 54, 163–175. [Google Scholar] [CrossRef] [PubMed]
- Küster, F.; Peters, M. Making Buildings Fit for Sustainable Mobility—Comparing Regulations for Off-Street Bicycle and Car Parking in Europe; European Cyclists’ Federation: Brussels, Belgium, 2018. [Google Scholar]
- Vale, D.S.; Saraiva, M.; Pereira, M. Active accessibility: A review of operational measures of walking and cycling accessibility. J. Transp. Land Use 2015, 9, 209–235. [Google Scholar] [CrossRef]
- Da Silva, L.S.P.M.; Costa, A.D.L. Look with the eyes of others: Accessibility in hospital environments. In Proceedings of the 20th Congress of the International Ergonomics Association (IEA 2018); Bagnara, S., Tartaglia, R., Albolino, S., Alexander, T., Fujita, Y., Eds.; Advances in Intelligent Systems and Computing; Springer International Publishing: Cham, Switzerland, 2019; Volume 824, pp. 1705–1711. ISBN 978-3-319-96070-8. [Google Scholar]
- Hashim, M.J.; Alkaabi, M.S.K.M.; Bharwani, S. Interpretation of way-finding healthcare symbols by a multicultural population: Navigation signage design for global health. Appl. Ergon. 2014, 45, 503–509. [Google Scholar] [CrossRef]
- Jiang, S.; Verderber, S. On the planning and design of hospital circulation zones: A review of the evidence-based literature. HERD Health Environ. Res. Des. J. 2017, 10, 124–146. [Google Scholar] [CrossRef]
- Holmström, I.; Röing, M. The relation between patient-centeredness and patient empowerment: A discussion on concepts. Patient Educ. Couns. 2010, 79, 167–172. [Google Scholar] [CrossRef]
- Buonomano, A.; Calise, F.; Ferruzzi, G.; Palombo, A. Dynamic energy performance analysis: Case Study for energy efficiency retrofits of hospital buildings. Energy 2014, 78, 555–572. [Google Scholar] [CrossRef]
- Papadopoulos, A.M. Energy efficiency in hospitals: Historical development, trends and perspectives. In Energy Performance of Buildings; Boemi, S.-N., Irulegi, O., Santamouris, M., Eds.; Springer International Publishing: Cham, Switzerland, 2016; pp. 217–233. ISBN 978-3-319-20830-5. [Google Scholar]
- Gola, M.; Settimo, G.; Capolongo, S. Indoor air quality in inpatient environments: A systematic review on factors that influence chemical pollution in inpatient wards. J. Healthc. Eng. 2019, 2019, 1–20. [Google Scholar] [CrossRef]
- Mourshed, M.; Zhao, Y. Healthcare providers’ perception of design factors related to physical environments in hospitals. J. Environ. Psychol. 2012, 32, 362–370. [Google Scholar] [CrossRef] [Green Version]
- Salonen, H.; Lahtinen, M.; Lappalainen, S.; Nevala, N.; Knibbs, L.D.; Morawska, L.; Reijula, K. Physical characteristics of the indoor environment that affect health and wellbeing in healthcare facilities: A review. Intell. Build. Int. 2013, 5, 3–25. [Google Scholar] [CrossRef] [Green Version]
- EU Commission European Green Deal: Commission Proposes Transformation of EU Economy and Society to Meet Climate Ambitions. Available online: https://ec.europa.eu/commission/presscorner/detail/en/ip_21_3541 (accessed on 12 November 2021).
- Yousefli, Z.; Nasiri, F.; Moselhi, O. Healthcare facilities maintenance management: A literature review. J. Facil. Manag. 2017, 15, 352–375. [Google Scholar] [CrossRef]
- Brambilla, A.; Sun, T.; Elshazly, W.; Ghazy, A.; Barach, P.; Lindahl, G. Flexibility during the COVID-19 pandemic response: Healthcare facility assessment tools for resilient evaluation. Int. J. Environ. Res. Public Health 2021, 18, 11478. [Google Scholar] [CrossRef] [PubMed]
- Henriksen, H.E. Hospital Logistic; Project Report; Healthcare DENMARK: Odense, Denmark, 2019. [Google Scholar]
- Dückers, M.L.; Wagner, C.; Vos, L.; Groenewegen, P.P. Understanding organisational development, sustainability, and diffusion of innovations within hospitals participating in a multilevel quality collaborative. Implement. Sci. 2011, 6, 18. [Google Scholar] [CrossRef] [PubMed] [Green Version]
- Ferrarini, A.; Bodini, A.; Becchi, M. Environmental quality and sustainability in the province of Reggio Emilia (Italy): Using multi-criteria analysis to assess and compare municipal performance. J. Environ. Manag. 2001, 63, 117–131. [Google Scholar] [CrossRef]


| Acronym | Full Name |
|---|---|
| m | Macro area |
| c | Criterion |
| i | Indicator |
| v | Variable of each question, the desired answer according to methodology |
| r | Reply to each question in the questionnaire |
| Total score | |
| Macro-area score | |
| Macro-area weight | |
| Criterion score | |
| Maximum possible criterion score | |
| Standardised criterion score | |
| Criterion weight | |
| Indicator score | |
| Maximum possible indicator score | |
| Standardised indicator score | |
| Variable of each question, the desired answer according to methodology |
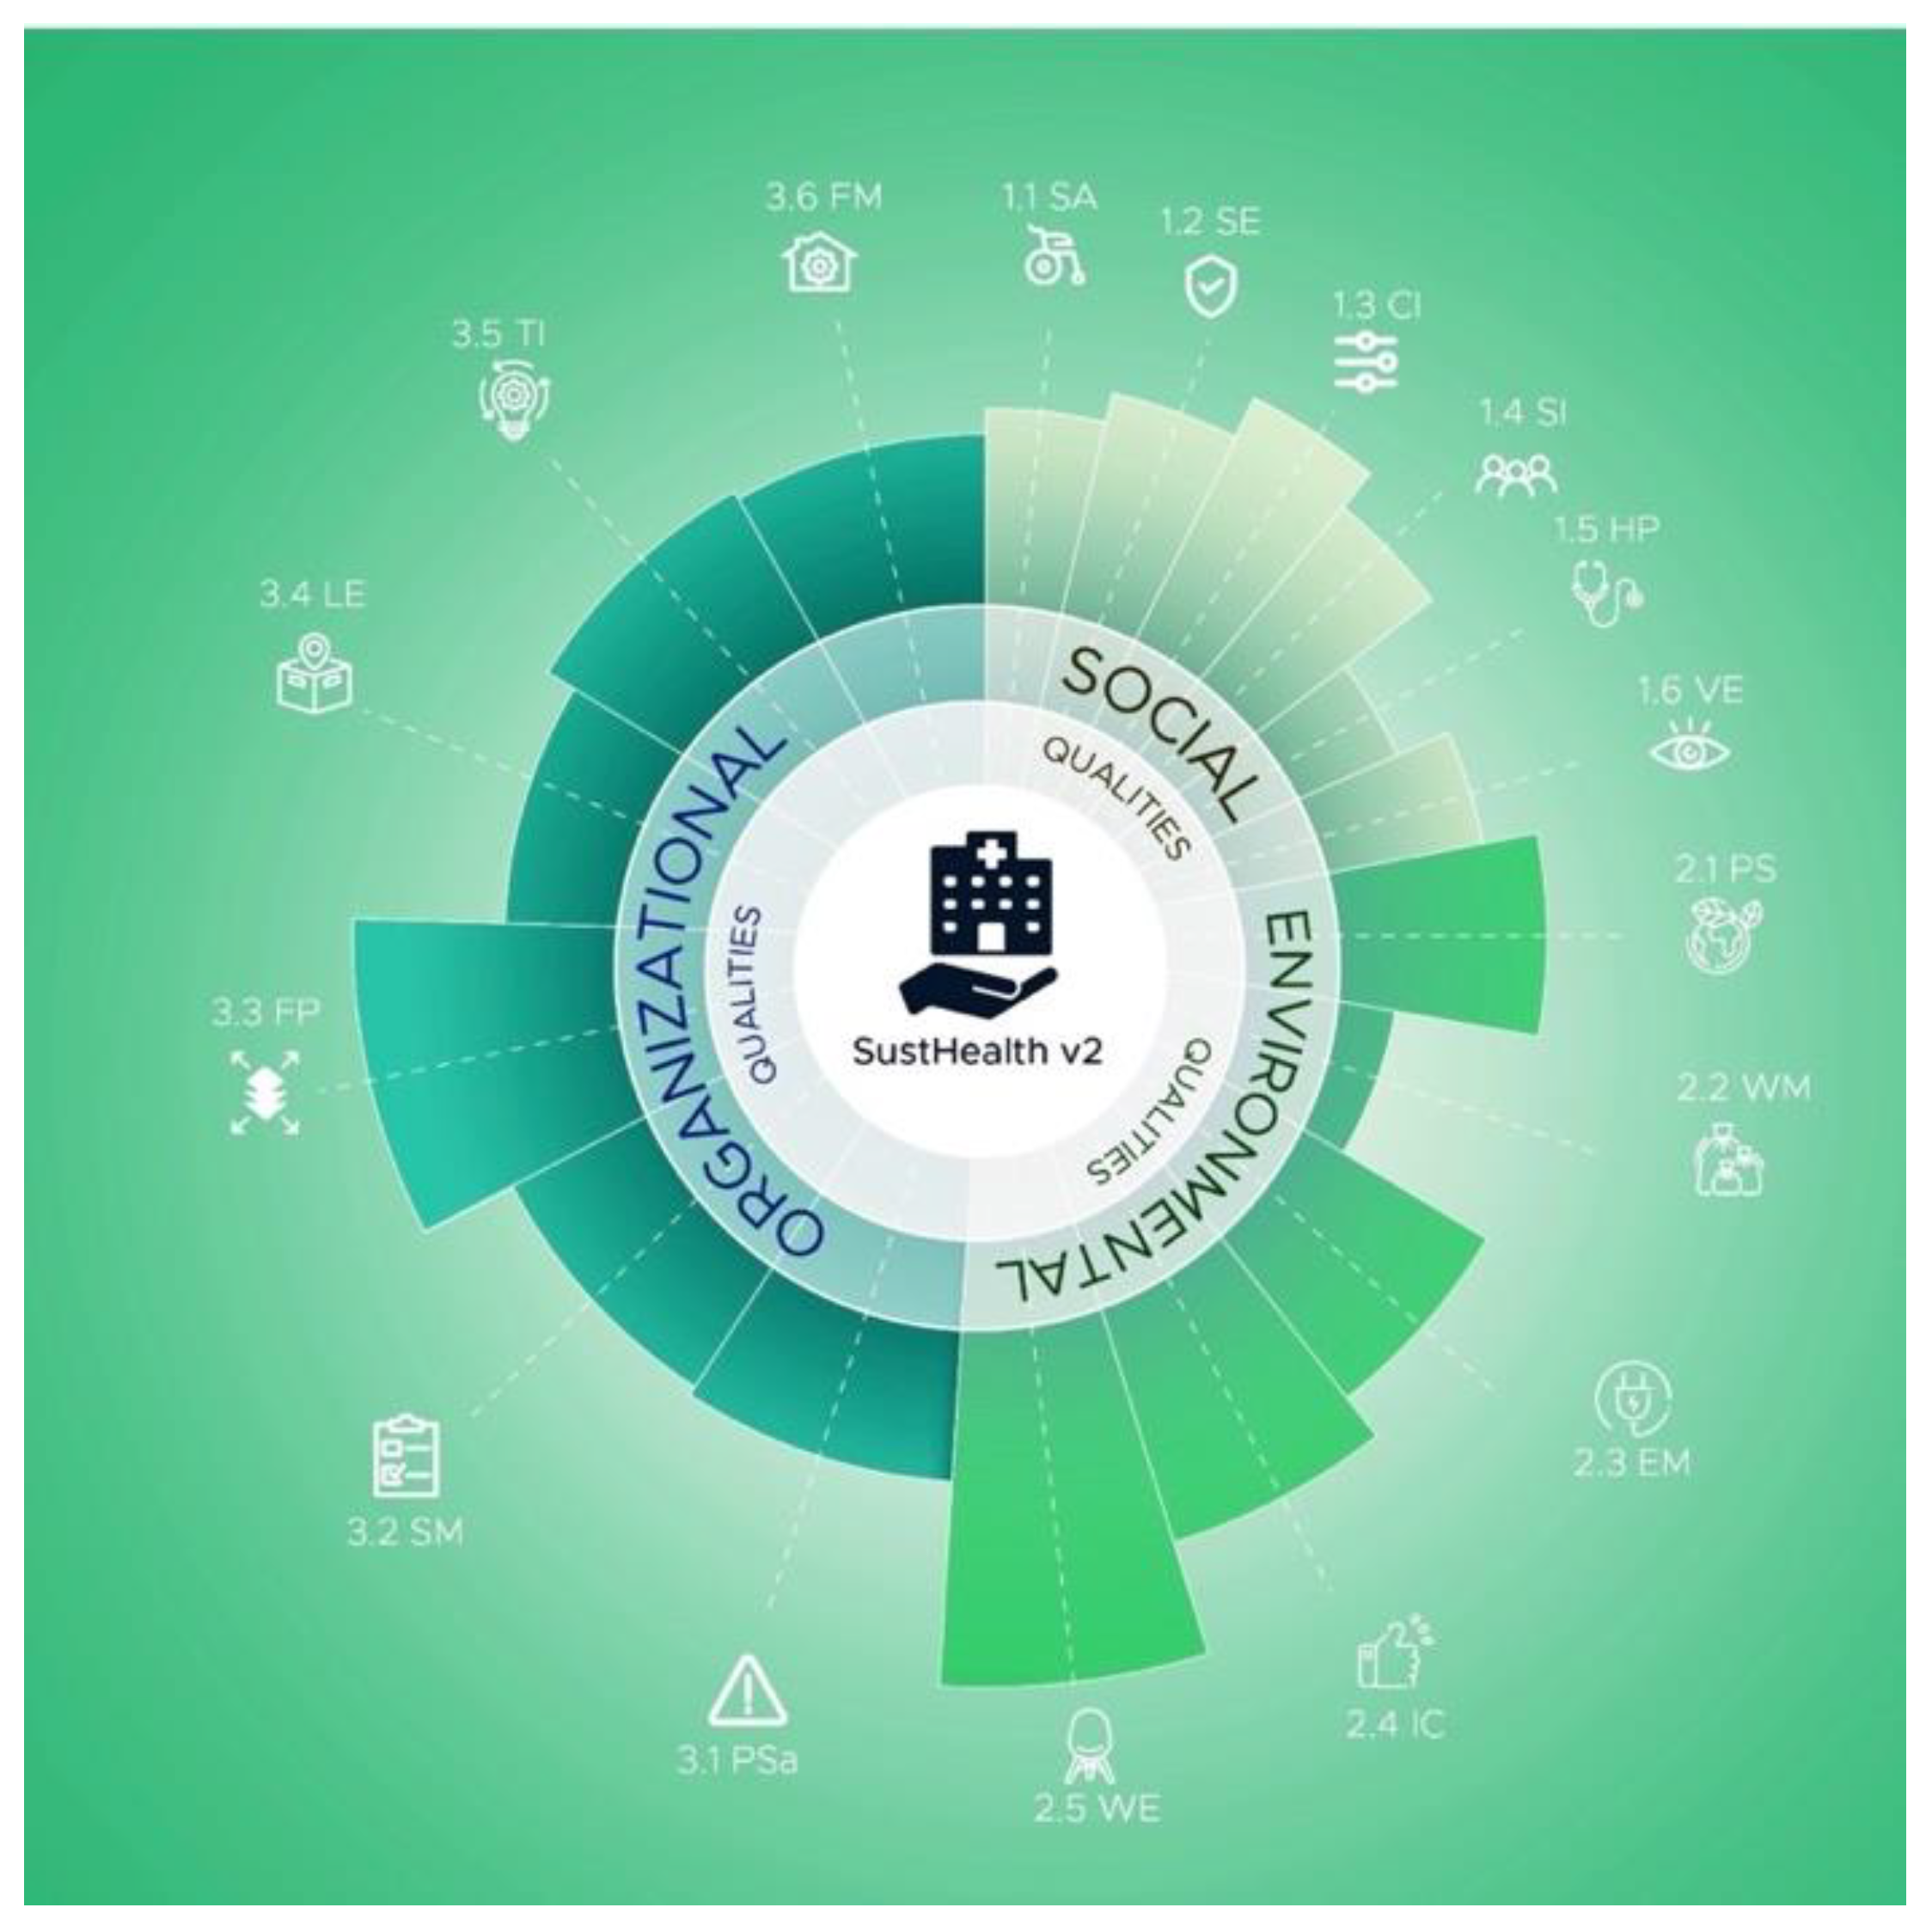
| Macro-Areas | W | Criteria | w |
|---|---|---|---|
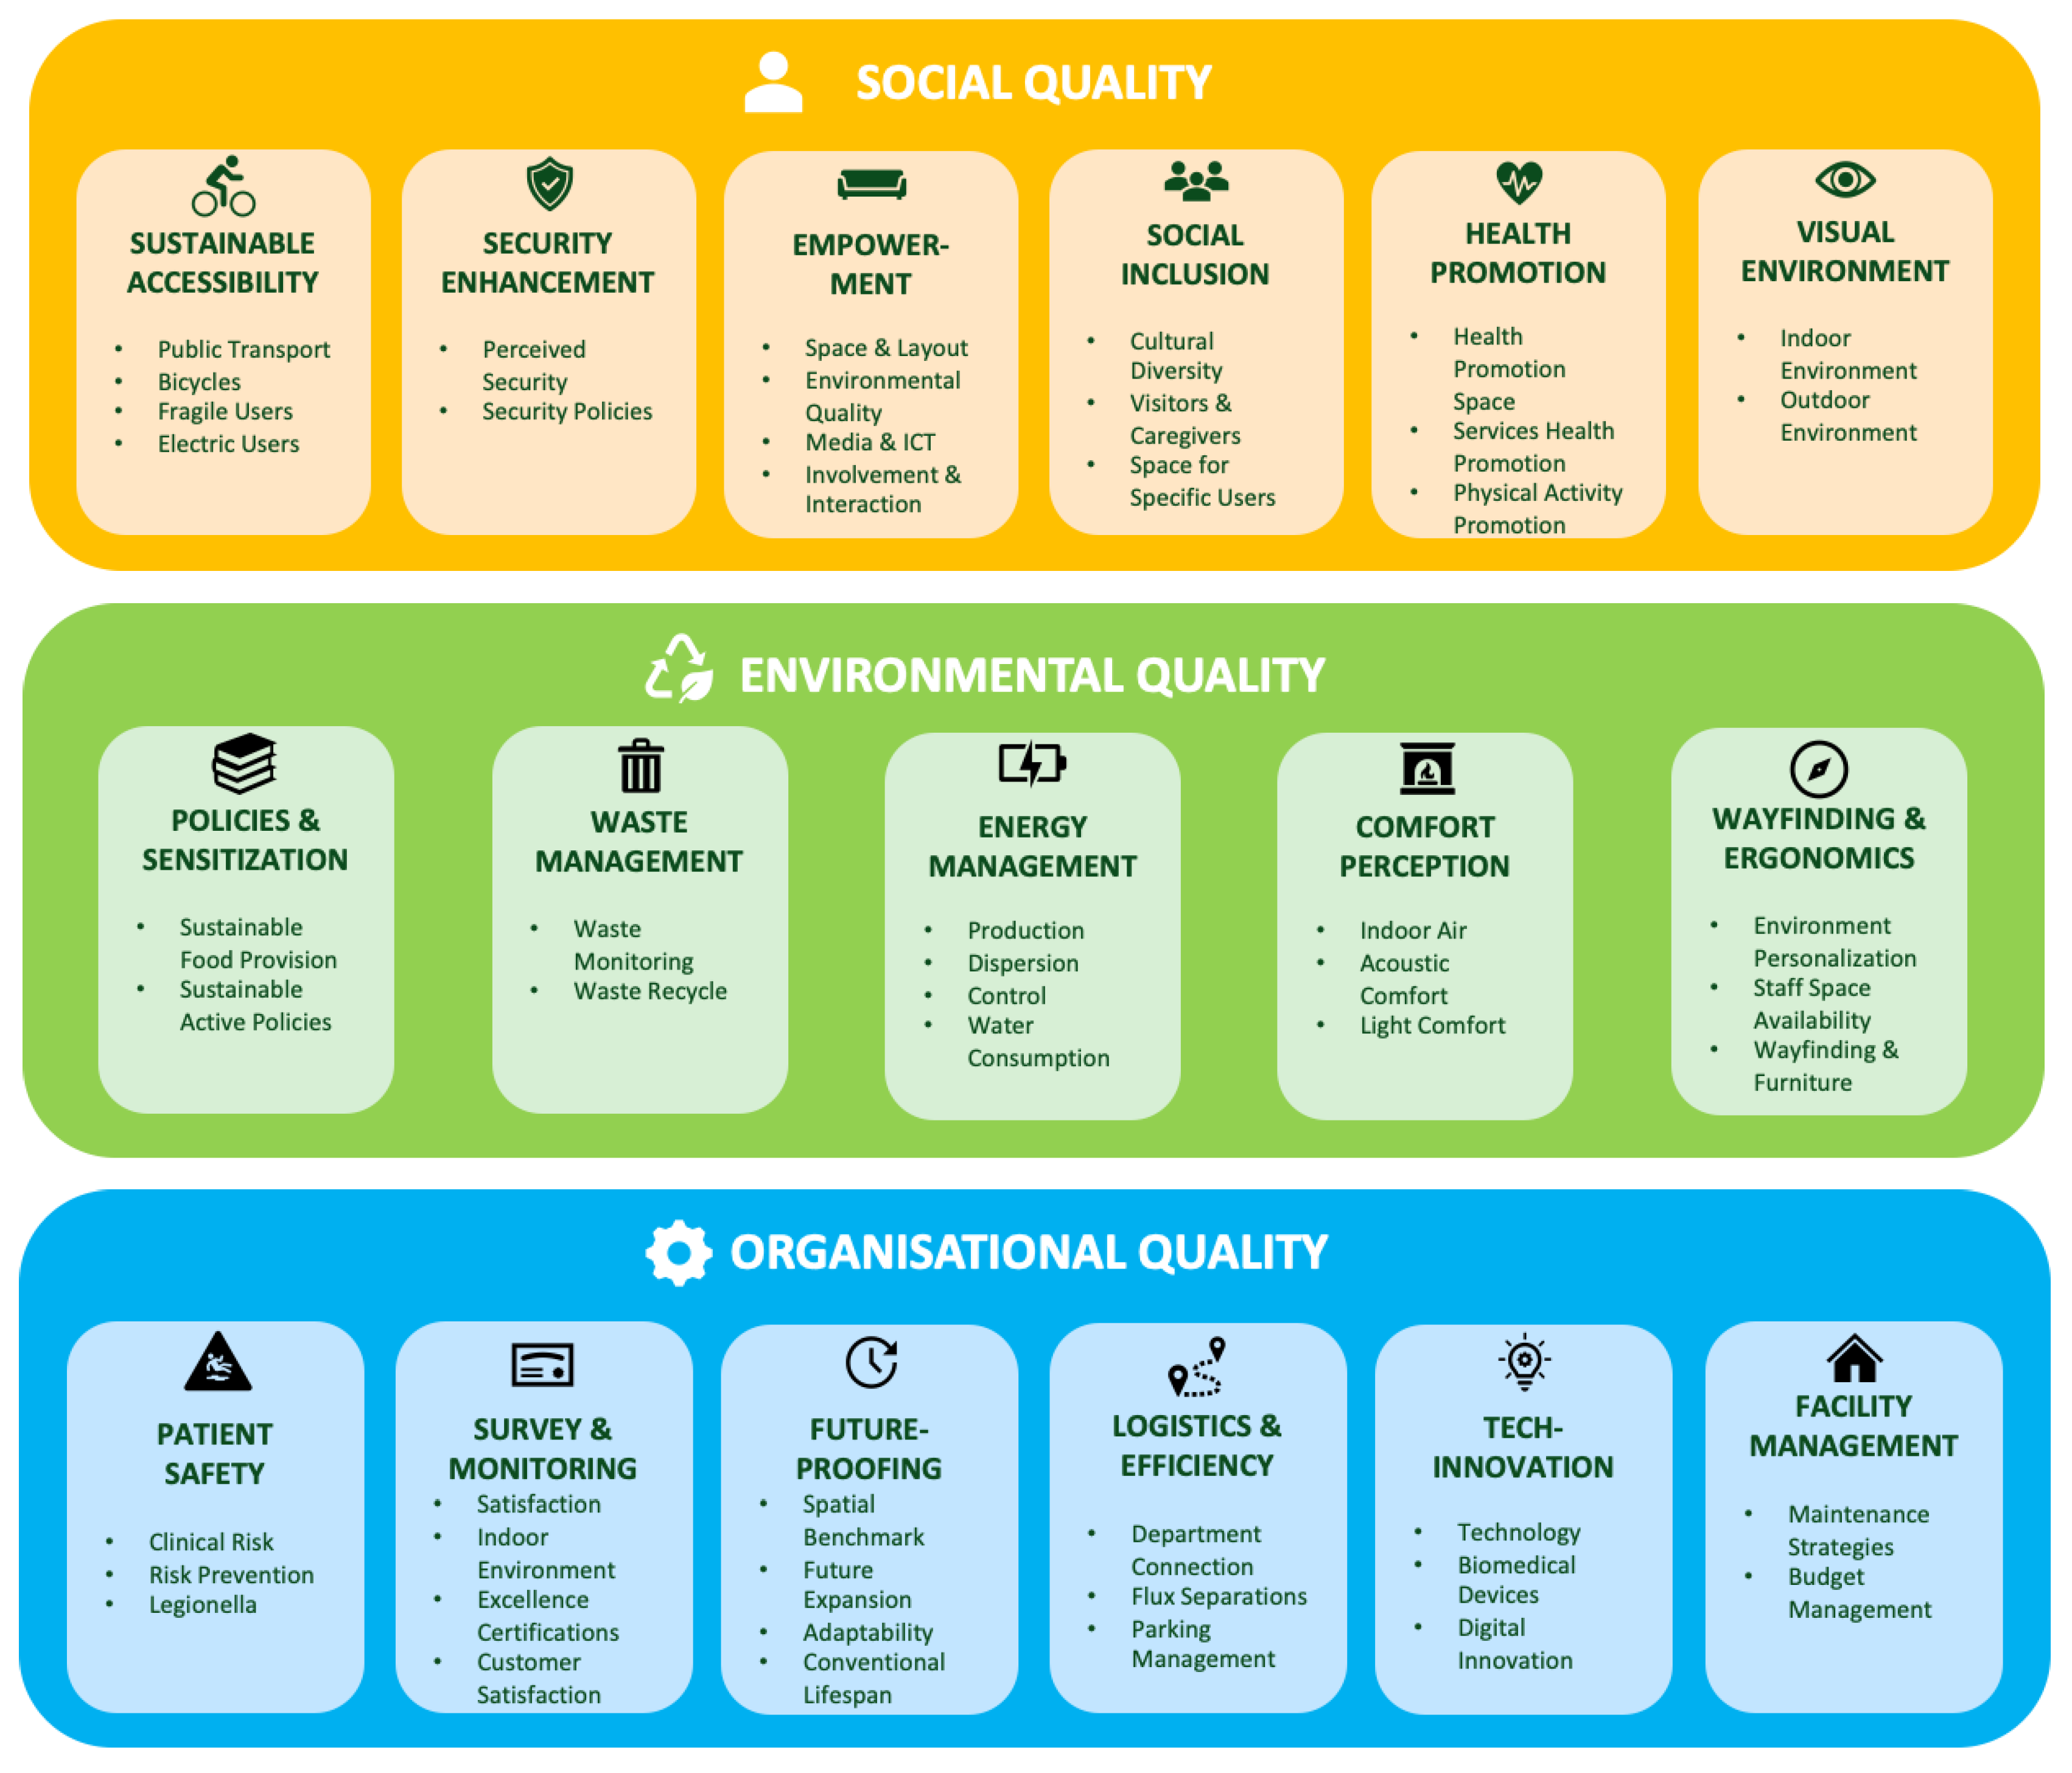
| 1. Social qualities (S) | 22% | 1.1 Sustainable Accessibility (SA) | 16% |
| 1.2 Security Enhancement (SE) | 19% | ||
| 1.3 Involvement and Empowerment (IE) | 21% | ||
| 1.4 Social Inclusion (SI) | 18% | ||
| 1.5 Health Promotion (HP) | 11% | ||
| 1.6 Visual environment (VE) | 15% | ||
| 2. Environmental qualities € | 29% | 2.1 Policies and Sensitization (PS) | 18% |
| 2.2 Waste Management (WM) | 8% | ||
| 2.3 Energy Management (EM) | 20% | ||
| 2.4 Comfort Perception (CP) | 23% | ||
| 2.5 Wayfinding and Ergonomics (WE) | 31% | ||
| 3.Organizational qualities (O) | 49% | 3.1 Patient Safety (PS) | 18% |
| 3.2 Survey and Monitoring (SM) | 17% | ||
| 3.3 Future Proofing (FP) | 23% | ||
| 3.4 Logistics and Efficiency (LE) | 13% | ||
| 3.5 Technological Innovation (TI) | 15% | ||
| 3.6 Facility Management (FM) | 14% |
| Social Quality | Environmental Quality | Organisational Quality | Total (T) | |
|---|---|---|---|---|
| Variable | ms | ms | ms | T |
| Mean | 0.65 | 0.51 | 0.50 | 0.54 |
| Median | 0.68 | 0.49 | 0.49 | 0.51 |
| Range | 0.39 | 0.35 | 0.46 | 0.39 |
| Standard deviation | 0.11 | 0.11 | 0.12 | 0.10 |
Publisher’s Note: MDPI stays neutral with regard to jurisdictional claims in published maps and institutional affiliations. |
© 2022 by the authors. Licensee MDPI, Basel, Switzerland. This article is an open access article distributed under the terms and conditions of the Creative Commons Attribution (CC BY) license (https://creativecommons.org/licenses/by/4.0/).
Share and Cite
Brambilla, A.; Apel, J.M.; Schmidt-Ross, I.; Buffoli, M.; Capolongo, S. Testing of a Multiple Criteria Assessment Tool for Healthcare Facilities Quality and Sustainability: The Case of German Hospitals. Sustainability 2022, 14, 16742. https://doi.org/10.3390/su142416742
Brambilla A, Apel JM, Schmidt-Ross I, Buffoli M, Capolongo S. Testing of a Multiple Criteria Assessment Tool for Healthcare Facilities Quality and Sustainability: The Case of German Hospitals. Sustainability. 2022; 14(24):16742. https://doi.org/10.3390/su142416742
Chicago/Turabian StyleBrambilla, Andrea, Jan Marvin Apel, Inga Schmidt-Ross, Maddalena Buffoli, and Stefano Capolongo. 2022. "Testing of a Multiple Criteria Assessment Tool for Healthcare Facilities Quality and Sustainability: The Case of German Hospitals" Sustainability 14, no. 24: 16742. https://doi.org/10.3390/su142416742