Article

A Simplified Framework for the Equity-Based Spatial Assessment of Alternative Public Transport Networks

DICATECH, Polytechnic University of Bari, 70125 Bari, Italy
*
Author to whom correspondence should be addressed.
Sustainability 2022, 14(24), 16606; https://doi.org/10.3390/su142416606
Submission received: 15 November 2022 / Revised: 6 December 2022 / Accepted: 7 December 2022 / Published: 12 December 2022
(This article belongs to the Special Issue Emerging Technologies for Sustainable Transportation Systems)

Abstract

:
Nowadays, approximately 75% of the European population lives in urban areas, and these figures are expected to grow in future. The consequent expansion of cities means that the population might locate its residence far from daily facilities, generating a so-called transport social need. The possibility to easily reach education, health, recreation, and job opportunities is a key factor in fostering and guaranteeing the social inclusion of people in society. Spatial planning plays a fundamental role in filling the gap between people residing in the center and those living in the suburbs. In particular, public transport planning should ensure access to essential services, providing at least the same opportunities as private vehicles. In this context, this study presents a simplified quantitative method to consider equity in transit network design and assessment, considering horizontal and vertical indicators based on the socio-demographic characteristics of a population and the accessibility to main opportunities. The validity of the indicators is tested by applying them to a case study located in the Apulia region (Italy). The approach could be considered a basis for more complex transport-network design optimization oriented to social inclusion in urban areas.

1. Introduction

The recent policies supported by decision-makers in the transport sector are increasingly oriented towards automation and green vehicles. Obviously, these are technological solutions of great interest and could improve the efficiency and the environmental sustainability of our cities; however, they hardly help to achieve the social inclusion goals set by the United Nations in their SDGs, and indeed risk further segregation due to the higher costs associated with the purchase and ownership of these vehicles. In this respect, efficient public transport planning is one of the most effective solutions to reduce the externalities associated with transport in urban areas. In particular, when it comes to the social exclusion and segregation of people living in the suburbs, public transport is the main solution to bridge the accessibility gap between car users and those who cannot ride private motorized vehicles, cannot afford it or simply do not prefer to use it.
Nevertheless, public transport planning is still based on traditional criteria that aim at efficiency, and even if its public nature tries to employ a certain social inclusion guarantee for access to basic services, planning professionals usually do not consider concepts of equity among their design criteria. In particular, while the basic service coverage approach may somewhat respond to addressing the so-called horizontal equity (i.e., the same supply to all individuals), vertical equity (i.e., different supply to groups with different necessities) is quite always disregarded, or it is simply reflected in a differentiated public transport fare (e.g., for students, elderlies, or the unemployed). This happens because equity is generally conceived by traditional planners only as a parameter to be verified in the aftermath of transit network design. Most of the literature deals with equity assessments ex-post; scholars who analyzed the use of equity among transit network design criteria applied their models only to synthetic case studies. Academic literature generally deals with the equity assessment of public transport network ex-post; an example of a cornerstone article was published by Currie [1,2,3], who was among the first scholars to address the issue. They introduced a transport need index (TNI) [1] to evaluate the spatial gaps in transport accessibility for disadvantaged people and used economic indicators, such as the Lorenz curve and Gini index, to assess the distribution of accessibility among the population [2]. The TNI and its distributions through the Gini index were used in [4], which provided a participatory version of the need index using the analytic hierarchy process to weigh the role of each disadvantage indicator in the comprehensive need index for the case of Palma de Mallorca. Rofé et al. [5] provided a relative accessibility index to compare the performances of private vehicles and public transport, and used the Lorenz curve and Gini index to evaluate the territorial distribution of the transit supply in the case of the city of Tel-Aviv. Similar approaches using the TNI and Gini index were employed in [6,7], who applied the methods to the case of Catania city. Moreover, most of the studies dealt only with the evaluation of horizontal equity using measures such as population shares or threshold accessibility [8].
Some scholars investigated the possibility of considering equity among transit network design criteria. In their study, Fan and Machemehl [9] presented a bi-level optimization model for solving the public transportation network redesign problem; in this model, the spatial equity issue was explicitly considered for the first time. Later on, Camporeale et al. [10,11] and Caggiani et al. [12] developed an optimization model where the objective function considered both horizontal and vertical equity issues. Later, Kim et al. [13] developed similar results based on bi-level optimization and genetic algorithms. These models, however, were applied in synthetic case studies. More recently, Park et al., 2022 [14] developed a multi-objective model based on the nondominated sorting genetic algorithm-II combined with a neighborhood local search for a transit network design and frequency setting problem and was able to apply it to a real case study with a reasonable computational time.
However, tailored optimization models, such as those presented in the literature, could be complex and require considerable computational efforts, which might be considered too burdensome for public administrations, which usually take advantage of already existing tools, especially during the preliminary stages of the transport-network planning process. This is particularly true in the case of small cities and dense areas or when available resources are scarce.
On the basis of these premises, this paper contributes to this gap in the literature by answering this research question: How could planners consider equity in the spatial evaluation of different public transport-network alternatives at a preliminary stage? The study answers this question by proposing a framework providing insights on how to allocate transit stops and evaluate the most equitable routes and frequencies when comparing different options.
The remainder of the paper is organized as follows. Section 2 presents the proposed method. Firstly, we provide some background on transport equity and its relationship with accessibility (Section 2.1). Based on this analysis, in Section 2.2, we propose a simplified framework to assess the equity of alternative transit designs. An application of the framework is provided in Section 3, considering the case study of the small city of Molfetta (Italy). Section 4 includes the results of the application to the case study and the related discussion. Finally, conclusions are drawn, highlighting the shortcomings and potential for future research.

2. Materials and Methods

2.1. Towards an Index to Evaluate Transport Equity

The connection between social exclusion and the lack of adequate transport provisions was demonstrated by several authors in the last decades [15,16,17]. More in detail, Lucas et al. [15] raised awareness of the fact that transport policies mitigating environmental issues should not neglect the conflict with the social inclusion of disadvantaged communities. In [16], Lucas claimed that the failure to address inequalities in the access to adequate transport of low-income households undermined the welfare policies in the US and UK. Martens [17] investigated the distributive approach of accessibility, which, they state, should be considered separate from those of money or power. In [18], Lucas argued that inadequate access to transport services and social disadvantage interact in different ways resulting in what could be called “transport poverty”. In particular, in order to quantify the transport disadvantage, several “need indexes” have been developed by scholars since the early 2000s; Hine and Mitchell [19,20] detected transport-disadvantaged spaces in Scotland. Using socio-demographic data with similar considerations, Hine and Grieco [21] qualitatively highlighted the spatial “scatters” as well as the “clusters” of the socially excluded in the territory. In [22], Currie introduced the transit “needs-gap” approach; this was then applied to different cases in Australia in a collection of papers that discussed the links between transport disadvantage and its impacts [23]. Later, in 2009, Currie et al. [24] analyzed the transit gap using a multi-criteria evaluation approach to examine the influence of transport and mobility variables on social exclusion and quality of life measures. Based on the previous studies focusing on the “needs-gap” approach by the same author [22,23,24], Currie [1] proposed a simple indicator, which was the so-called transport need index (TNI). The index was developed using socio-economic and transport-need-related indicators to quantify the distribution of needs in the community. The indicator is simple to calculate and is based on data which are usually available from the public administration at a detailed territorial scale. The measure is composed of a summation of n social disadvantage indicators (DI) associated with different weighting (w), according to the following equation:
T N I = i n w i D I i
In particular, Currie used seven indicators and estimated the weights through a survey of users’ travel behaviors. However, the nature of the index allows it to be integrated with different indicators based on the availability of the case study. An example set of indicators based on the literature is presented in Table 1 with related references.
It is, therefore, possible to calculate the TNI for each area of the territory and understand which ones have the greatest need for public transport services. In this study, we embraced this approach, using the TNI to evaluate the transport need of each zone in our case study. These would certainly be the zones in which it would be necessary to provide routes and therefore locate public transport stops to create the connection to the main opportunities on the basis of the needs emerging from the TNI. Once the routes are planned, it is necessary to understand how to evaluate the fairness of a proposed transit network.
In this respect, the concept of accessibility plays a fundamental role; there is a close relationship between accessibility and social exclusion indeed. Scholars agree that from an equity perspective, a comparison between accessibility for different transport modes is required [17,27,28,29,30]. Several indexes have been developed, mostly focused only on horizontal or vertical equity. A horizontal index is the one developed by Rofè et al. [5], which considers the so-called relative accessibility (RA) loss, i.e., a measurement based on the ratio between public transport and private car accessibility. A modified version of the measurement was presented in work conducted by Giuffrida et al. [7], which also took into account the vertical equity, including the TNI in the formulation as follows:
R A i = T N I i ( 1 P A i C A i )
where RAi is the relative accessibility for a generic zone i, TNIi is the transport need index for the generic zone i, and PAi and CAi are, respectively, the public transport accessibility and the private car accessibility for the generic zone i. The RA values are either 0 or positive, with R = 0 (i.e., no loss), meaning that there is no transportation social need or there is equal access to public and private transport. Conversely, the RA tends to have higher values if the need is high or the public transport accessibility is low. Therefore, the lower the index, the better the equity. The index is suitable to be estimated at any spatial level, from individual buildings up to an entire metropolitan area.
Several types of accessibility could be used in the equation if they are suitable for discerning between the two different modes of transport (e.g., [31]). In this study, we decided to consider a gravitational model of activity-based accessibility since it provides a continuous measure where the value of the opportunities is weighted by a spatial impedance function. The considered measure is the one developed by Hansen [32] as presented in the following equation, considering the generic zone i and a maximum of n zones:
A i = j n O j f ( C i j )
where:
f ( C i j ) = e β C i j
and Cij is the generalized cost of travel among zones i and j. β is a parameter related to the cost that could be estimated with a gravity model.
f(Cij) reflects the effect of decreasing accessibility due to the increase of distance, travel time, or another factor; in our case study, we consider travel time as an impedance.

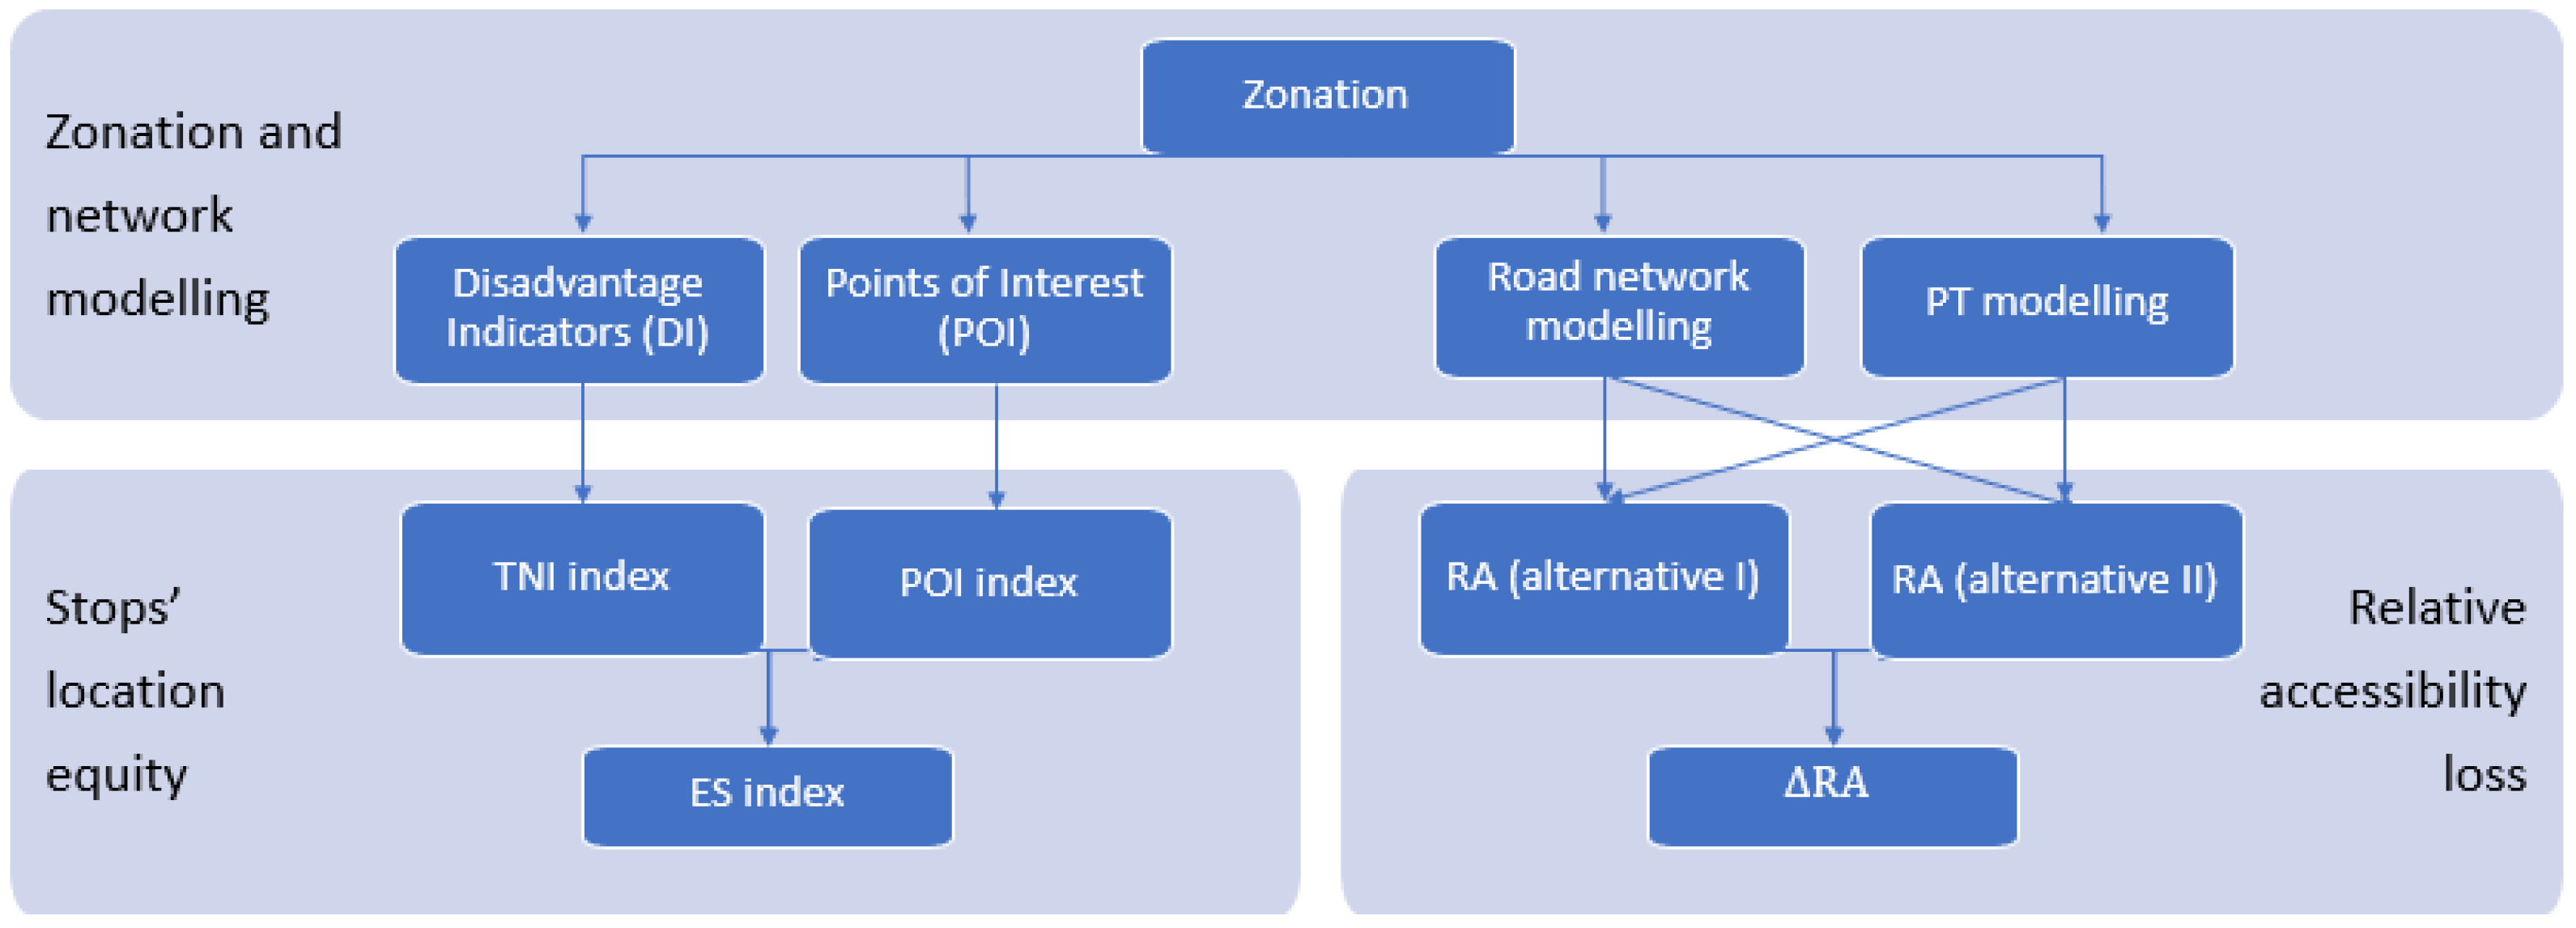
2.2. Building a Simplified Equity-Based Framework for a Public Transport-Network Assessment

Transit network planning is a complex procedure that includes strategical, tactical, and operational decisions [33,34], aiming at designing a set of routes and their operational features; the main parameters that are taken into account during the process could be traced back to the design of the routes, frequencies, time schedules, fleet sizes, and the number of employees. This is a complex problem that, especially in the case of large cities, requires multi-objective approaches that fulfill the interests of the various actors involved in the decision-making process. However, in this paper, which considers the case of small cities with probable scarce resources or an unchanged budget, we mainly focus on the spatial planning of lines and stops. Therefore, considering the case of unchanged resources, in order to be able to design and assess thorough criteria that include equity, the parameters taken into consideration were the following:
  • The equity of the stop locations; the spatial distribution of stops must ensure a good balance of travel speeds and short access distances, which depend on the urban structure and the related pattern of lines [11]. In any case, if equity is to be considered in the process of locating the stops, it is necessary to guarantee the coverage of the areas with the highest TNI and, obviously, of the areas in which the main activities are located, i.e., where the points of interest (POI) generate attraction. Guaranteeing access to a transit network for the whole population is indeed the first step towards horizontal equity; ensuring that the most vulnerable categories are covered is another step towards vertical equity. An indicator of the equity of the areas where the stops can be located is here introduced, namely the Equity of Stops (ES) index, which is calculated using the weighted combination of these two factors, normalized in order to be compared, as shown in the following equation:
E S = T N I n o r m + P O I n o r m
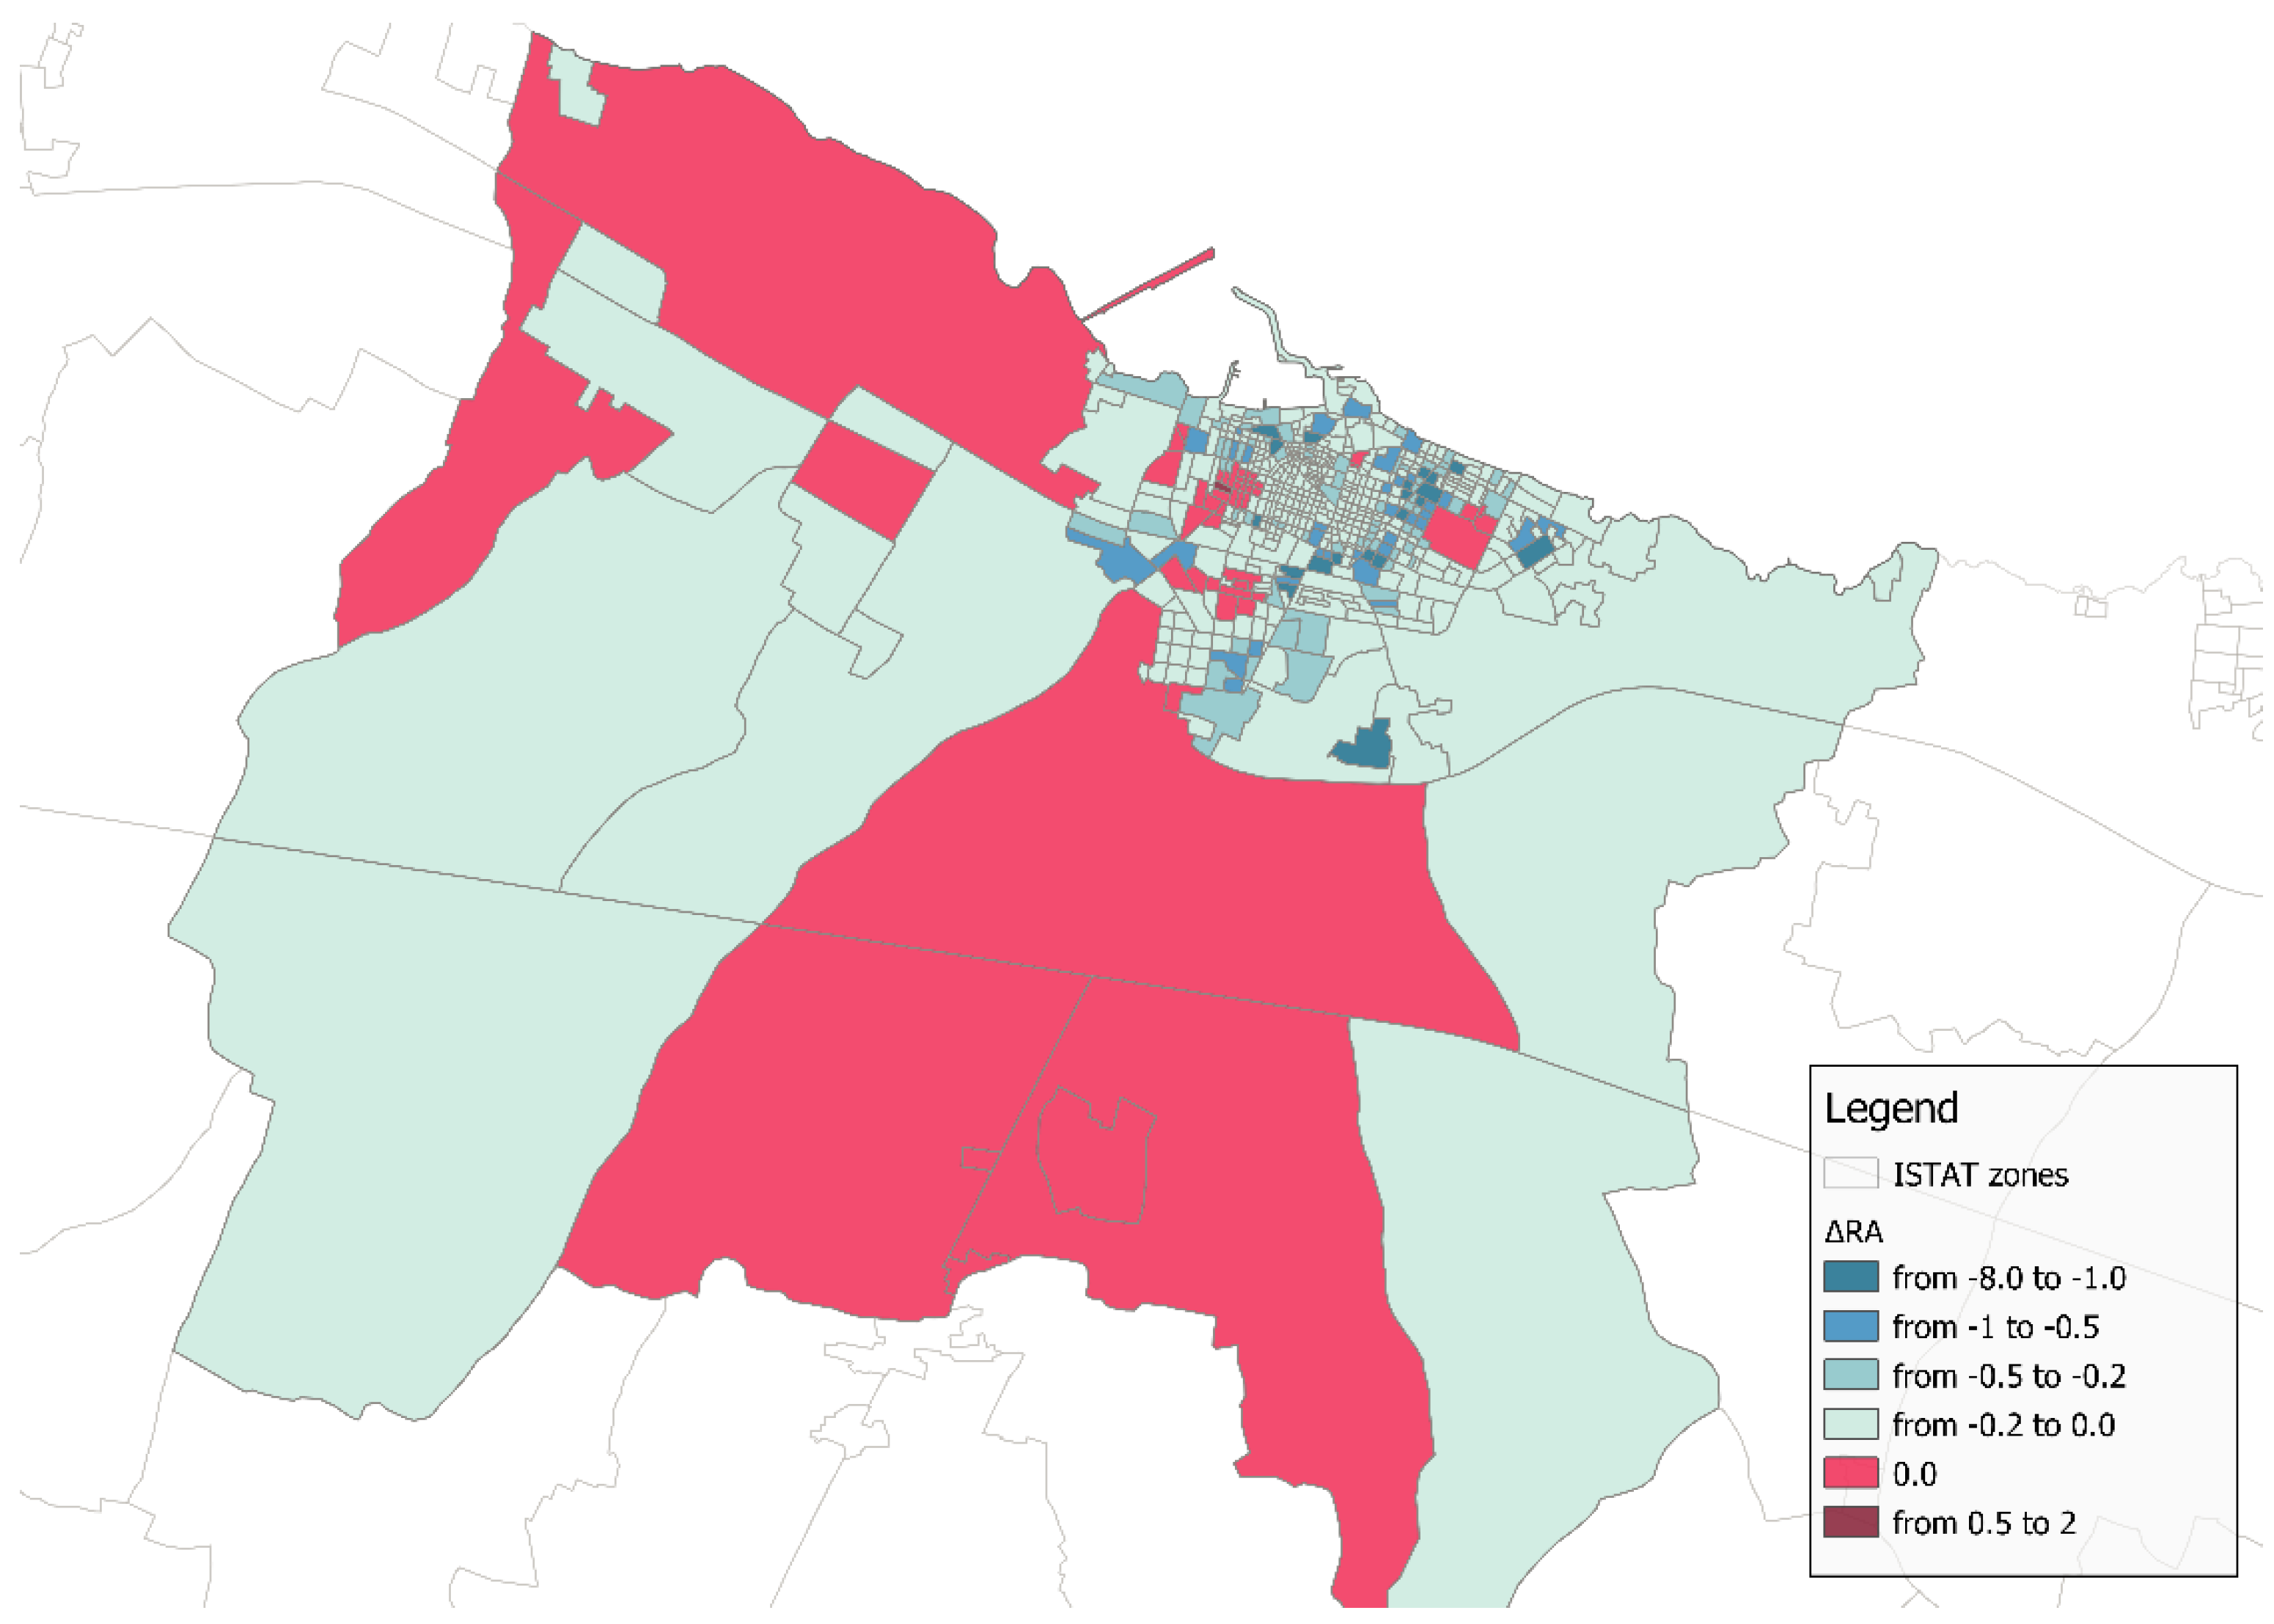
  • The equity of the line routes; the choice of the route of the lines must follow the main trip patterns according to the needs of the various users, guaranteeing coverage of the greatest number of possible destinations with a feasible number of stops. This is to minimize the number of transfers that the user must undertake to reach the final destination. In this case, the directness of the line between the origins and desired destinations ensures greater equity among all users. Of course, in the case of complex networks, this would not result in a single possible combination of lines but in different alternative sets. In this case, the difference in RA index (ΔRA) of two alternative projects I and J could be considered to evaluate the equity of the alternative networks, as follows:
Δ RA = R A J R A I
With this notation, a positive ΔRA means that RAI is lower than RAJ; thus, project I performs better than project J from an equity point of view since the lower the RA index, the better the equity.
Starting with Equations (5) and (6), this paper proposes a framework to assess different transit networks from an equity point of view. The framework is suitable to be applied during the preliminary design of a transit network or to assess transit alternatives ex-post. Figure 1 schematizes the approach and its application to a generic case study.

3. Application to the Case Study

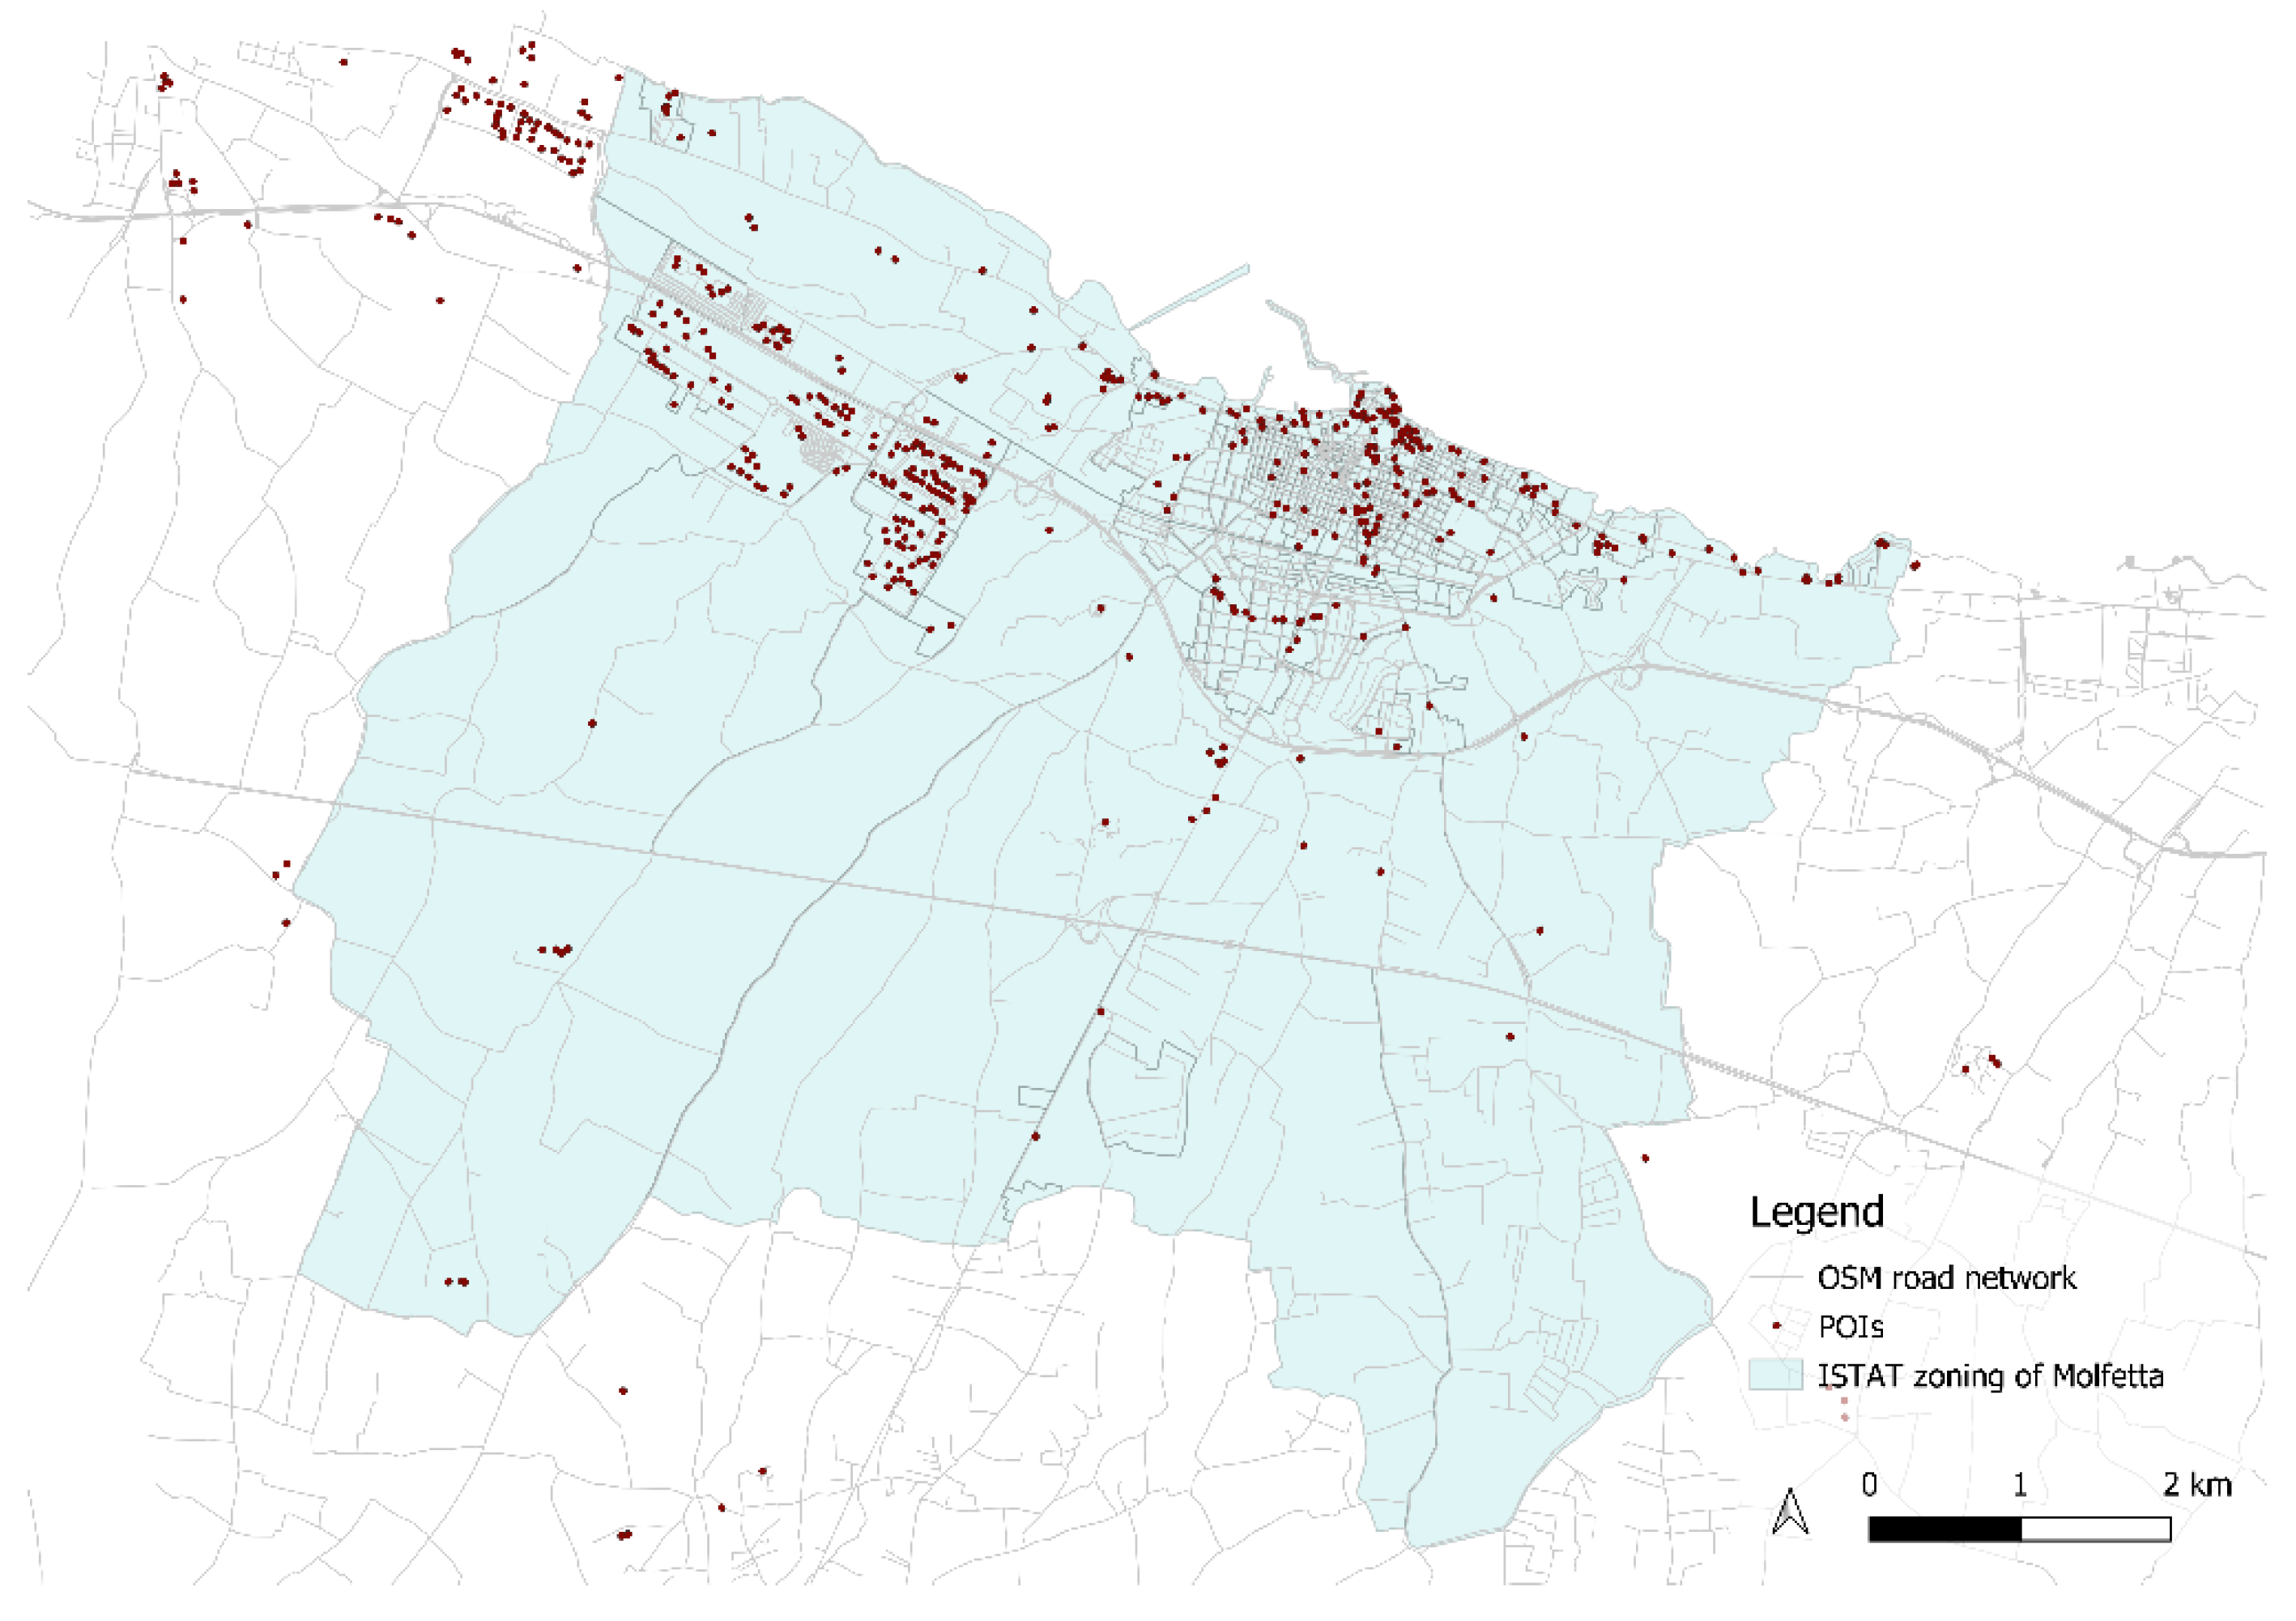
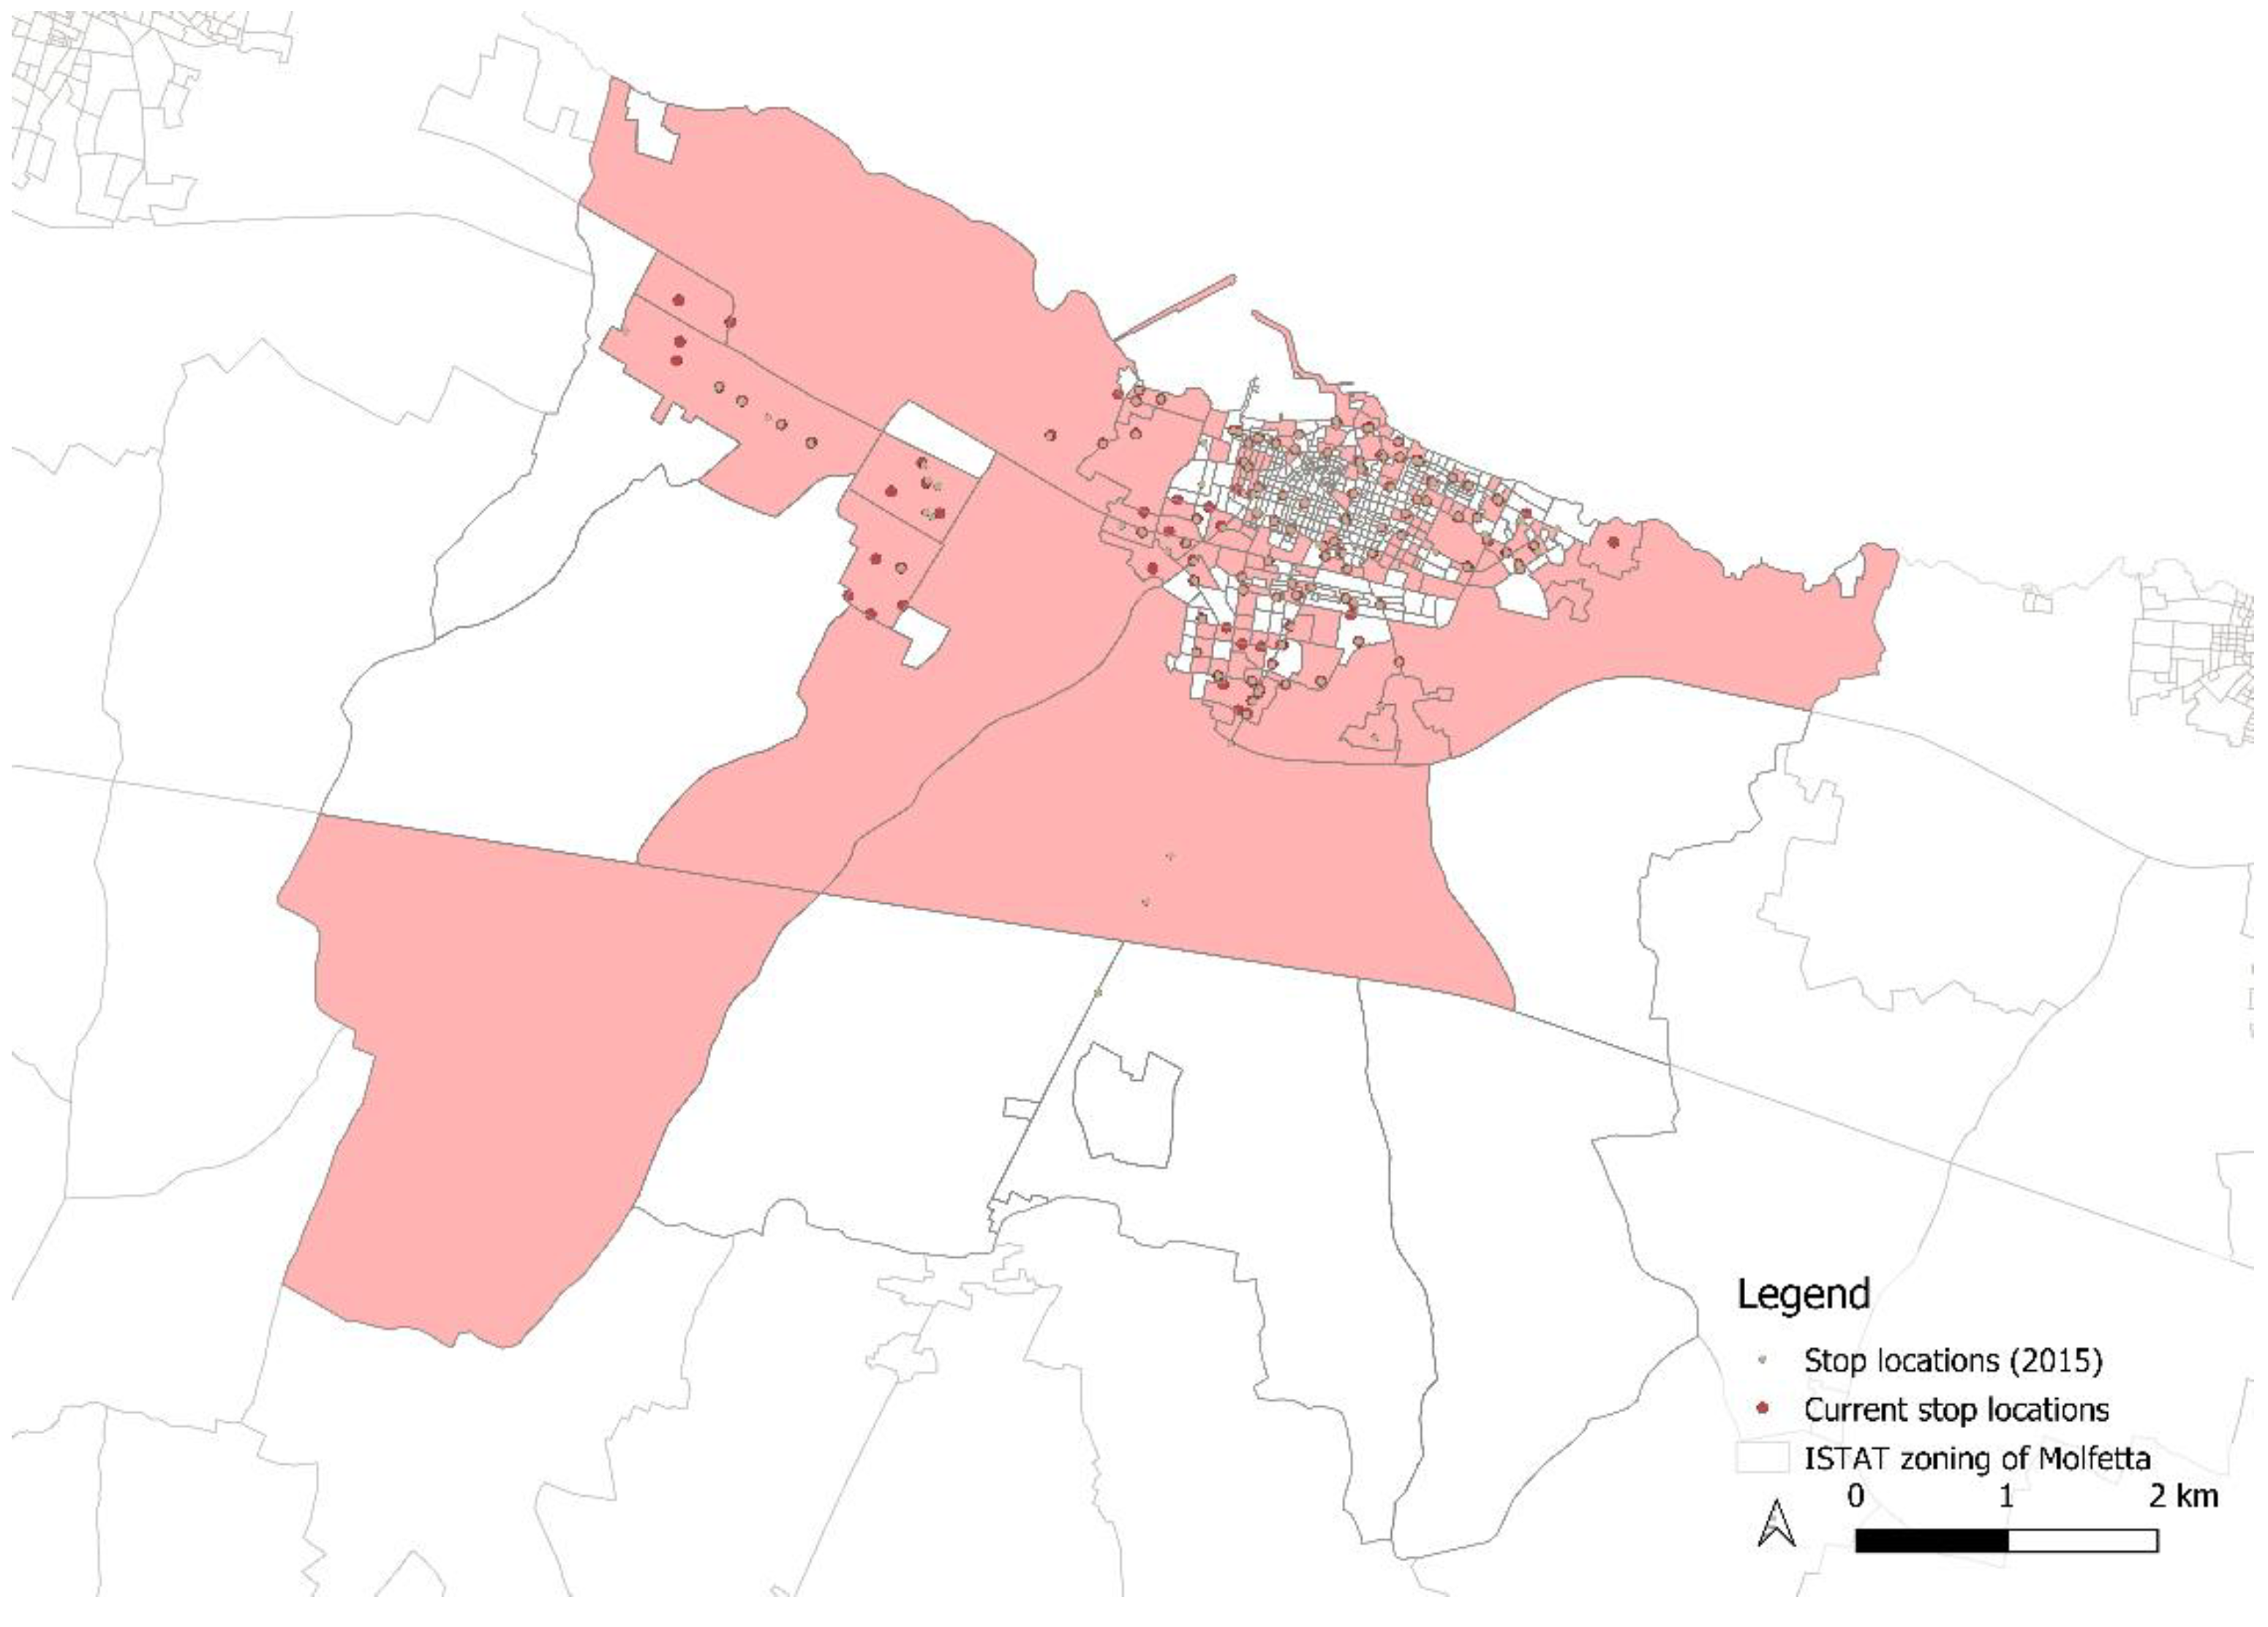
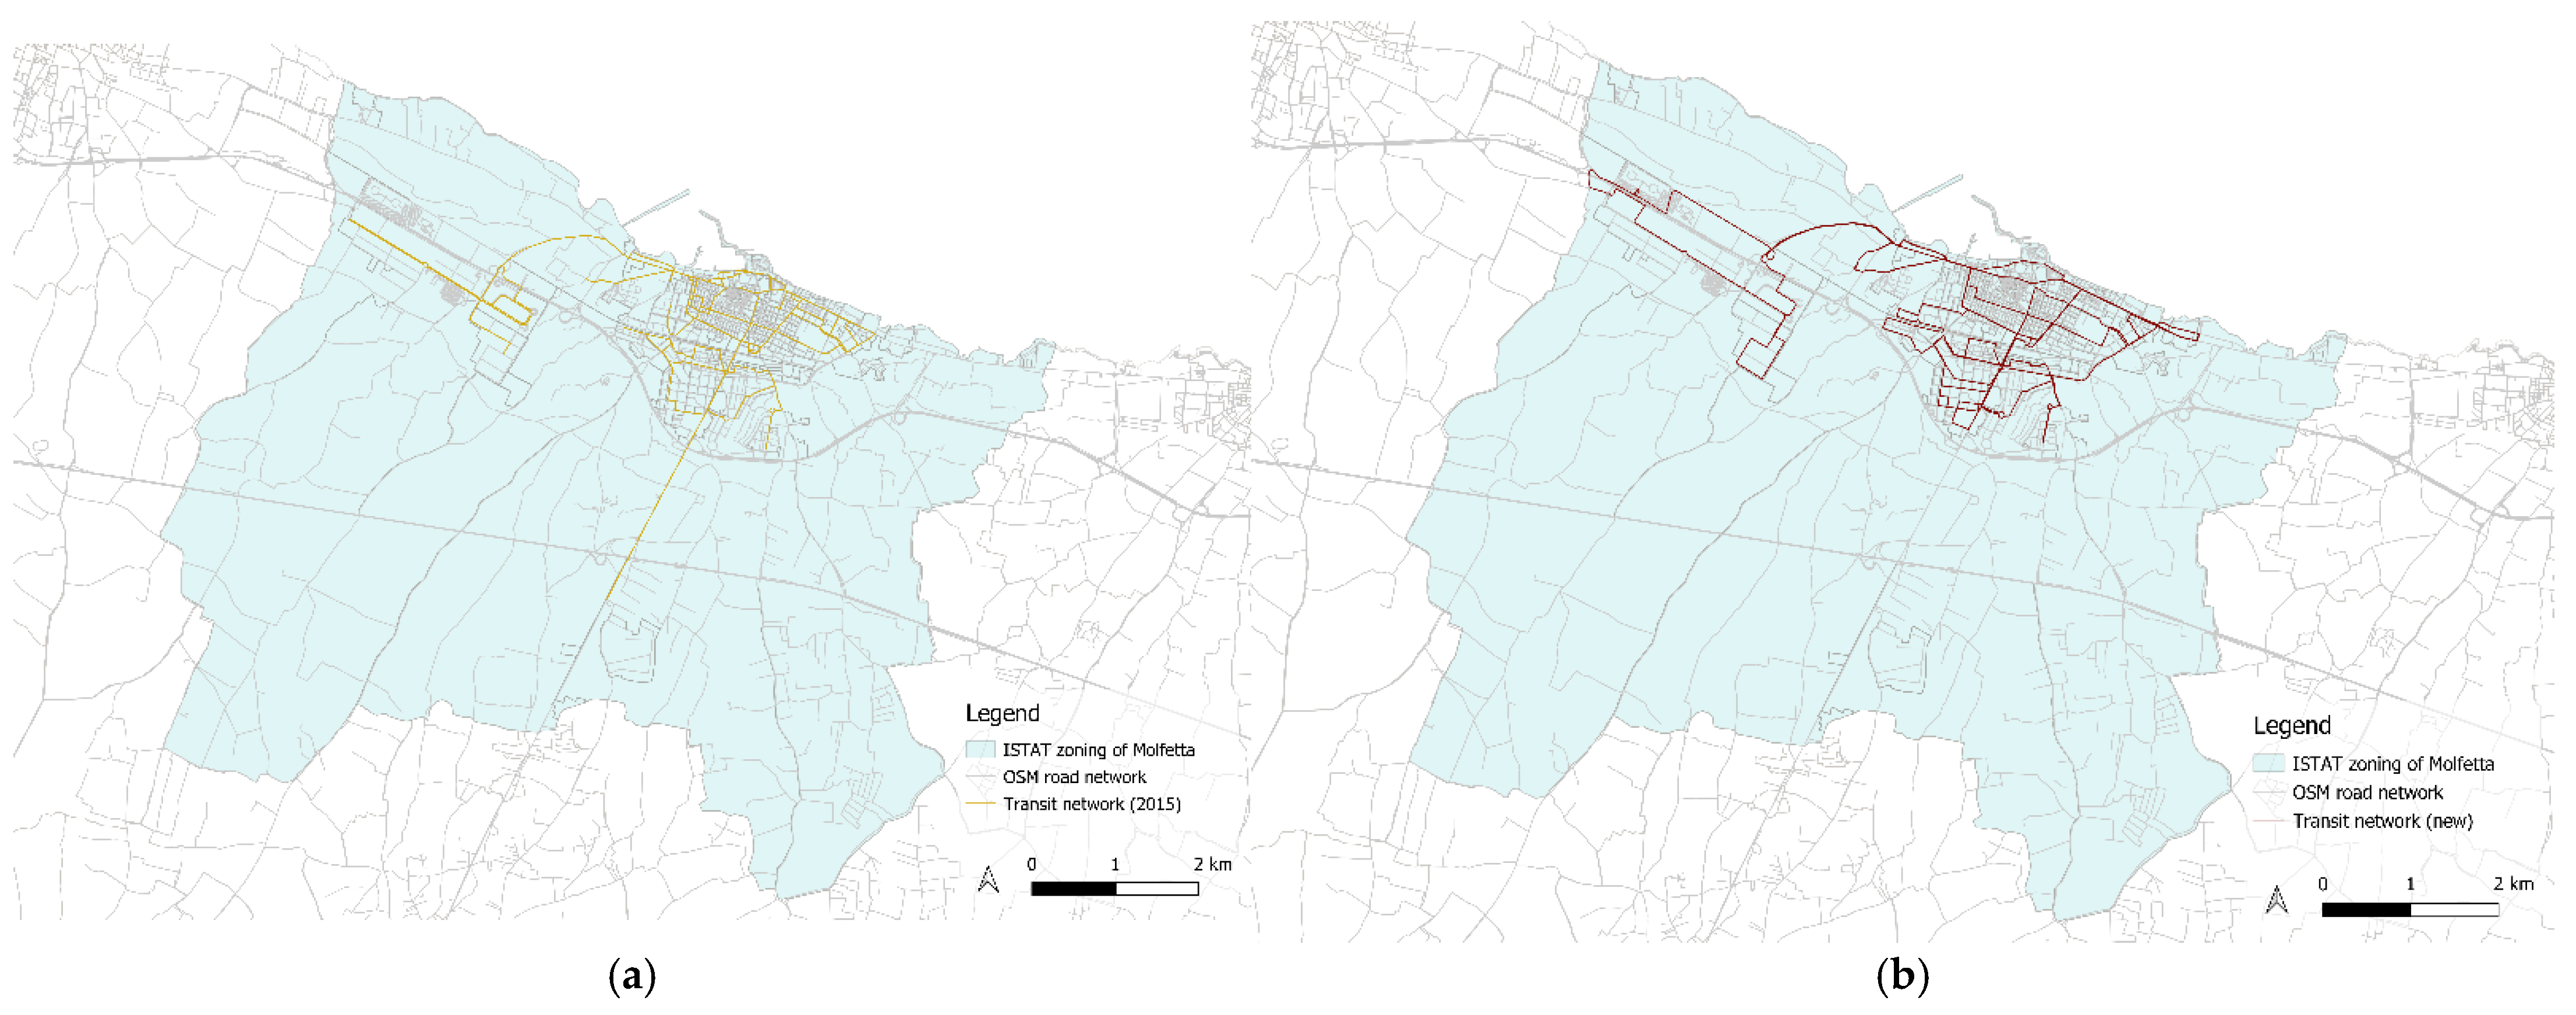
3.1. Territorial Framework and Public Transport Supply

Molfetta is a small to medium town of approximately 58,000 inhabitants located in the south of Italy. It is part of the metropolitan area of the city of Bari, the capital of the Apulian region, which is one of the biggest cities in southern Italy. Molfetta has a traditional agricultural vocation, with large areas in the south of the city with land use devoted to agriculture. However, in recent years, an industrial area developed on the western side, bringing a new economy to the city. This, in turn, contributed to the emergence of new residential settlements in the area located just to the south of the traditional urban area. The city center is of a certain historical and touristic interest, also thanks to the position of the city overlooking the sea.
The city recently reformed its public transport system, increasing the number of lines from five to eight: among the new ones, three lines operate during the working days in the city center (lines one, two and three). Line four operates during the working days and takes its passenegers to the industrial area of the town. Lines five and six operate during the holidays and ride to the city center and the industrial zone. Line seven rides through the main educational facilities of the city. Finally, Line eight is a seasonal line used to link the city center to the main beaches located around the town.
In this paper, we assess the two networks in terms of equity, considering the method presented in Section 2.

3.2. Data and Application

In order to apply the method to our case study, we executed the following steps:
-
Zonation and network modeling, including both private and public transport;
-
The calculation of the ES index and comparing it with the position of the current stops;
-
The calculation of Δ RA for two alternative networks.
Two software packages were used for the analysis: Opensource QGIS (https://qgis.org/en/site/, accessed on 1 December 2022), to edit, visualize and manipulate spatial data, and the commercial VISUM by PTV company (https://company.ptvgroup.com/en/, accessed on 1 December 2022) to compute the time matrix for the two considered transport modes; the choice to use this commercial software was due to the desire also to simulate the scheduling of the services, which is currently not fully available within the opensource options.
A more detailed description of the adopted steps is reported in the following subsections.

3.2.1. Zonation and Network Modeling

We decided to use the zonation of the Italian statistics institute in census tracks [35] in order to guarantee a detailed level of zonation with proper socio-demographic information. This results, for the city of Molfetta, in a division of 578 zones and related O-D pairs (Figure 1). These zoning characteristics and the related socio-demographic data refer to the last census carried out in Italy (in 2011); some changes in the distribution of the population and its characteristics could therefore have occurred in the following years, which could be reflected in the outdated evaluations of the results. However, we decided to use this data anyway, with the aim to focus on the exercise of applying the method to a realistic case study and not on the updated validity of the territorial result.
The road network used in the paper was extracted from OpenStreetMap; this was achieved using the QuickOSM plugin in QGIS software. We chose this network because it is very detailed, including local roads, which could be useful to assess the trip distances in the case of small cities (see Figure 2).
The public transport network was modelled in VISUM software; more in detail, the older transit network was available via the administration in a GTFS format and automatically imported into the software. The novel network was retrieved from the administration website and modelled in the software.

3.2.2. Calculation of the TNI, POI and ES Indexes

For the sake of simplicity, in this case study, we considered the following four socio-demographic indicators (DIs) for the calculation of the TNI according to Equation (1), already included in the data associated with the chosen zonation [35]: people aged under 18 [DI (<18)] and over 70 [DI (>70)]; those who were unemployed [DI (unenmpl.)]; and families with six members or more [DI (+6)]. These data were used in the evaluation of the TNI index as disadvantage indicators, as detailed in Equation (7).
T N I i = w 1 D I ( < 18 ) i + w 2 D I ( > 70 ) I + w 3 D I ( u n e m p l . ) i + w 4 D I ( + 6 ) i
Moreover, at this stage, we used the same weight w (equal to 1) for all the indicators; however, these weights could be calibrated according to the needs of the decision-makers (e.g., in the creation of a service dedicated to the elderly, w2 could assume a greater weight than the others).
The POI index was calculated considering the points of interest related to the following activities: educational facilities, industrial sites, health services, offices, railway stops, and other POIs related to leisure activities (e.g., green areas and entertainment). The POIs were retrieved from the OpenStreetMap database using the QGIS plugin QuickOSM.
A map of the zoning, the road network, and the POIs are shown in Figure 2.

3.2.3. Calculation of the R A for Two Alternative Networks and the Final Δ RA

Once the OSM road network and the transit network were modeled in VISUM, the software allowed for the calculation of travel time matrices between all the zones according to the two transport modes, used as an impedance function according to Equation (4). The results were used to calculate the Hansen accessibility index for both public and private transport modes, according to Equation (3). Using these results and the TNI, the RA for each of the two networks was computed using Equation (2). Finally, the Δ RA was calculated using Equation (6).

4. Results

The transit network currently has approximately 130 stops; considering the case of an unchanged budget, we evaluated the ES index and mapped the most suitable 130 zones. The results are shown in Figure 3; when it comes to the current location of the stops, they are located outside the areas indicated with the highest TNIs more than 50% of the time. A similar result was observed for the former stop locations, although the uncovered zones slightly differed. These data are not very significant in the more central areas, which have a very dense distribution, and therefore the distance from the area to the stop was often reduced to a few hundred meters. On the contrary, the peripheral areas were totally uncovered by the stops, even though these zones showed a certain need according to the SL index.
It could be argued that the exclusion of the missing areas is due to a greater coverage in the more populous central area, probably due to more frequent trips to the origins and destinations. In any case, precisely to consider the equity of the design of the network, decision-makers could consider localizing the stops in these areas and plan ad-hoc demand-responsive services for the necessary categories.
Since the design of a new network is not within the scope of this paper, for the sake of simplicity, we applied this last step to the comparison between the 2015 network and the 2018 network, shown in Figure 4.
Figure 5 maps the ΔRA among the two networks. From the analysis of the results presented in Figure 5, it is possible to obtain some insights. With the introduction of the new network and new frequencies, there certainly was an improvement in the RA index. In particular, 481 out of 578 zones (approximately 80% of the areas) improved their performance, although, in some cases, only slightly. More in detail, only 20 zones improved their RA in the range from −8 to −1 (dark blue on the map), while 35 zones improved their RA in the range from −1 to −0.5 (blue); most of the zones showed a slight decreasing of the RA, with 416 zones in the range from −0.5 to 0 (lighter blues on the map). From a spatial point of view, improvements were observed in the industrial area of the city and the large, poorly populated areas to the southeast and southwest. A slight worsening effect was instead present in some of the peripheral areas to the east and in the south, where the need for the coverage of the service arose (see Figure 1). In these cases, as already mentioned, the administration could choose to include, among the transport services, some on-demand lines that guarantee the social inclusion of the currently excluded areas.

5. Conclusions

Nowadays, vehicle-related technologies play a major role in the transport sector, but it is important not to forget that the modal shift towards collective transport is one of the main keys to reducing the impacts associated with transport. In particular, social inclusion remains one of the great challenges of our society, and inclusive public transport could improve the conditions of segregation in which the most disadvantaged categories often find themselves. In this context, this paper proposes a simple framework for assessing equity in the assessment of different public transport networks. The framework provides an index for assessing the equity in the location-allocation of stops and an overall network index for the equity of the network. The application to the case study of Molfetta demonstrates the validity of the framework. The results from the case study show a slight improvement in the equity of public transport in the city, although some transport needs are still not fulfilled, paricularly in most peripheral zones. This suggests that administrative services need to introduce demand-responsive services to satisfy the needs of the population living in low-demand areas.
The framework could be useful for decision-makers in order to evaluate the equity of different public transport-network designs, especially in the case of small cities or scarce resources when it is not possible to resort to complex models of transit network design. The main limitation of the indexes is that they could be considered valid for a preliminary analysis of the network; the actual location of stops and route planning would definitely benefit from subsequent in situ analysis. Future research might aim at creating indexes able to consider non-spatial criteria (e.g., time schedules and fleet size). Comprehensive indexes might then be taken into account in the traditional methods used for transit design; this could be performed by including this framework in multi-objective models for solving the transport-network design problem, thus guaranteeing issues related to equity are considered at the detailed stages of route planning.

Author Contributions

Conceptualization, N.G., M.O. and M.B.; methodology, N.G., M.O. and M.B.; software, N.G. and S.V.; data curation, N.G. and S.V.; writing—original draft preparation, N.G.; writing—review and editing, N.G., M.O. and M.B. All authors have read and agreed to the published version of the manuscript.

Funding

This research received no external funding.

Institutional Review Board Statement

Not applicable.

Informed Consent Statement

Not applicable.

Data Availability Statement

Data are available from the corresponding author upon reasonable request.

Acknowledgments

This study was developed within the Spoke 8—MaaS and and Innovative services of the National Center for Sustainable Mobility (MOST) set up by the “Piano nazionale di ripresa e resilienza (PNRR)—M4C2, investimento 1.4, “Potenziamento strutture di ricerca e creazione di “campioni nazionali di R&S” su alcune Key Enabling Technologies” funded by the European Union. Project code CN00000023, CUP: D93C22000410001.

Conflicts of Interest

The authors declare no conflict of interest.

References

  1. Currie, G. Quantifying spatial gaps in public transport supply based on social needs. J. Transp. Geogr. 2010, 18, 31–41. [Google Scholar] [CrossRef]
  2. Delbosc, A.; Currie, G. Using Lorenz curves to assess public transport equity. J. Transp. Geogr. 2011, 19, 1252–1259. [Google Scholar] [CrossRef]
  3. Ricciardi, A.M.; Xia, J.; Currie, G. Exploring public transport equity between separate disadvantaged cohorts: A case study in Perth, Australia. J. Transp. Geogr. 2015, 43, 111–122. [Google Scholar] [CrossRef]
  4. Ruiz, M.; Pons, J.M.S.; Lladó, J.M.; Reynés, M.R.M. Improving equity of public transportation planning. The case of Palma de Mallorca (Spain). In Proceedings of the AGILE’2014 International Conference on Geographic Information Science, Castellón, Spain, 3–6 June 2014. [Google Scholar]
  5. Rofé, Y.; Martens, K.; Eran, B.E.; Mednik, N. Accessibility and Social Equity in Tel-Aviv Metropolitan Area—Examination of the current conditions and development scenarios. Tech. Rep. 2015. [Google Scholar] [CrossRef]
  6. Giuffrida, N.; Inturri, G.; Caprì, S.; Spica, S.; Ignaccolo, M. The impact of a bus rapid transit line on spatial accessibility and transport equity: The case of Catania. In Transport Infrastructure and Systems; CRC Press: Boca Raton, FL, USA, 2017; pp. 753–758. [Google Scholar] [CrossRef]
  7. Giuffrida, N.; Ignaccolo, M.; Inturri, G.; Rofè, Y.; Calabrò, G. Investigating the Correlation between Transportation Social Need and Accessibility: The Case of Catania. Transp. Res. Procedia 2017, 27, 816–823. [Google Scholar] [CrossRef]
  8. Karner, A. Assessing public transit service equity using route-level accessibility measures and public data. J. Transp. Geogr. 2018, 67, 24–32. [Google Scholar] [CrossRef]
  9. Fan, W.; Machemehl, R.B. Bi-Level optimization model for public transportation network redesign problem: Accounting for equity issues. Transp. Res. Rec. 2011, 2263, 151–162. [Google Scholar] [CrossRef]
  10. Camporeale, R.; Caggiani, L.; Ottomanelli, M. Modeling horizontal and vertical equity in the public transport design problem: A case study. Transp. Res. Part A Policy Pract. 2019, 125, 184–206. [Google Scholar] [CrossRef]
  11. Camporeale, R.; Caggiani, L.; Fonzone, A.; Ottomanelli, M. Quantifying the impacts of horizontal and vertical equity in transit route planning. Transp. Plan. Technol. 2016, 40, 28–44. [Google Scholar] [CrossRef]
  12. Caggiani, L.; Camporeale, R.; Ottomanelli, M. Facing equity in transportation Network Design Problem: A flexible constraints based model. Transp. Policy 2017, 55, 9–17. [Google Scholar] [CrossRef]
  13. Kim, M.; Kho, S.-Y.; Kim, D.-K. A Transit Route Network Design Problem Considering Equity. Sustainability 2019, 11, 3527. [Google Scholar] [CrossRef] [Green Version]
  14. Park, S.J.; Kang, S.; Byon, Y.-J.; Kho, S.-Y. Multiobjective Approach to the Transit Network Design Problem with Variable Demand considering Transit Equity. J. Adv. Transp. 2022, 2022, 5887985. [Google Scholar] [CrossRef]
  15. Lucas, K.; Grosvenor, T.; Simpson, R. Transport, the Environment and Social Exclusion; Joseph Rowntree Foundation/York Publishing Ltd.: York, UK, 2001. [Google Scholar]
  16. Lucas, K. Running on Emptytransport, Social Exclusion and Environmental Justice; Policy Press: Bristol, UK, 2004. [Google Scholar] [CrossRef]
  17. Martens, K. Justice in Transport: Applying Walzer’s ‘Spheres of Justice’ to the transport sector. In Proceedings of the 88th Annual Meeting of the Transportation Research Board, Washington DC, USA, 11–15 January 2009. [Google Scholar]
  18. Lucas, K. Transport and social exclusion: Where are we now? Transp. Policy 2012, 20, 105–113. [Google Scholar] [CrossRef]
  19. Hine, J.; Mitchell, F. Better for everyone? Travel experiences and transport exclusion. Urban Stud. 2001, 38, 319–332. [Google Scholar] [CrossRef]
  20. Macpherson, S. Julian Hine and Fiona Mitchell. Transport Disadvantage and Social Exclusion: Exclusionary Mechanisms in Transport in Urban Scotland. Soc. Policy 2004, 33, 525–526. [Google Scholar] [CrossRef]
  21. Hine, J.; Grieco, M. Scatters and clusters in time and space: Implications for delivering integrated and inclusive transport. Transp. Policy 2003, 10, 299–306. [Google Scholar] [CrossRef]
  22. Currie, G. Gap Analysis of Public Transport Needs:Measuring Spatial Distribution of Public Transport Needs and Identifying Gaps in the Quality of Public Transport Provision. Transp. Res. Rec. J. Transp. Res. Board 2004, 1895, 137–146. [Google Scholar] [CrossRef]
  23. Currie, G.; Stanley, J.; Stanley, J. No Way To Go: Transport and Social Disadvantage in Australian Communities; Monash University ePress: Melbourne, Australia, 2007. [Google Scholar]
  24. Currie, G.; Richardson, T.; Smyth, P.; Vella-Brodrick, D.; Hine, J.; Lucas, K.; Stanley, J.; Morris, J.; Kinnear, R.; Stanley, J. Investigating links between transport disadvantage, social exclusion and well-being in Melbourne–Preliminary results. Transp. Policy 2009, 16, 97–105. [Google Scholar] [CrossRef]
  25. Mestre, F.X.S. Accessibility and Equity Assessment in Public Transport Services: A Case Study in Palma de Mallorca. Ph.D. Dissertation, KTH Royal Institute of Technology, Stockholm, Sweden, 2021. [Google Scholar]
  26. ISTAT. Esclusione Sociale. 2015. Available online: https://www.istat.it/it/archivio/esclusione+sociale (accessed on 1 December 2022).
  27. Preston, J.; Rajé, F. Accessibility, mobility and transport-related social exclusion. J. Transp. Geogr. 2007, 15, 151–160. [Google Scholar] [CrossRef]
  28. Ignaccolo, M.; Inturri, G.; Giuffrida, N.; Torrisi, V. Public Transport Accessibility and Social Exclusion: Making the Connections. In Proceedings of the International Conference on Traffic and Transport Engineering (ICTTE), Belgrade, Serbia; 2016. [Google Scholar]
  29. Guo, Y.; Chen, Z.; Stuart, A.; Li, X.; Zhang, Y. A systematic overview of transportation equity in terms of accessibility, traffic emissions, and safety outcomes: From conventional to emerging technologies. Transp. Res. Interdiscip. Perspect. 2020, 4, 100091. [Google Scholar] [CrossRef]
  30. Aman, J.J.C.; Smith-Colin, J. Transit Deserts: Equity analysis of public transit accessibility. J. Transp. Geogr. 2020, 89, 102869. [Google Scholar] [CrossRef]
  31. Ciommo, F.D. How the Inaccessibility Index Can Improve Transport Planning and Investment. Discussion Paper, International Transport Forum, Paris, France. 2018. Available online: https://www.itf-oecd.org/sites/default/files/docs/inaccessibility-index-transport-planning-investment_0.pdf (accessed on 1 December 2022).
  32. Hansen, W.G. How accessibility shapes land use. J. Am. Inst. Plan. 1959, 25, 73–76. [Google Scholar] [CrossRef]
  33. Ceder, A. Public Transit Planning and Operation: Theory Modeling and Practice; Butterworth-Heinemann: Oxford, UK; Elsevier: Oxford, UK, 2007. [Google Scholar]
  34. Desaulniers, G.; Hickman, M. Public Transit. In Handbooks in Operations Research and Management Science; Barnhart, C., Laporte, G., Eds.; Transportation: Amsterdam, The Netherlands, 2007; Volume 14, pp. 69–128. [Google Scholar]
  35. ISTAT. Basi Territoriali E Variabili Censuarie. 2011. Available online: https://www.istat.it/it/archivio/104317 (accessed on 1 December 2022).
Figure 1. Framework for the application of the approach.
Sustainability 14 16606 g001
Figure 2. Zoning, road network, and POIs.
Sustainability 14 16606 g002
Figure 3. Map of the ES index and the current and former stop positions.
Sustainability 14 16606 g003
Figure 4. (a) Transit network in 2015 in Molfetta. (b) Current transit network in Molfetta.
Sustainability 14 16606 g004
Figure 5. Map of the ΔRAs among the two networks.
Sustainability 14 16606 g005
Table 1. Social disadvantage indicators to be used in the TNI.
IndicatorSource
Forced car ownership/zero car ownership[1]
Age (elderly people)[1,19]
People with disabilities[1,19]
Low-income households[1,19]
People over 15 without a job[1]
Students[1]
Age (youngsters)[1,21,25]
Young people abandoning education and training[26]
Population living in rural areas[26]
Overcrowding[26]
Gender (women)[21,25]
Nationality (foreigners)[25]
Publisher’s Note: MDPI stays neutral with regard to jurisdictional claims in published maps and institutional affiliations.

