Article

Modelling Erosion and Floods in Volcanic Environment: The Case Study of the Island of Vulcano (Aeolian Archipelago, Italy)

1
Consejo Nacional de Ciencia y Tecnología (CONACYT)-Instituto Politécnico Nacional, ESIA, UZ, Miguel Bernard, S/N, Edificio de Posgrado, Mexico City 07738, Mexico
2
PLINIVS-LUPT Study Centre, University of Naples Federico II, Via Toledo 402, 80134 Napoli, Italy
3
Istituto Nazionale di Geofisica e Vulcanologia, Osservatorio Etneo—Sezione di Catania, Piazza Roma 2, 95125 Catania, Italy
4
Istituto Nazionale di Geofisica e Vulcanologia, Sezione di Pisa, Via Cesare Battisti 53, 56125 Pisa, Italy
5
Politecnico di Bari, Dipartimento di Ingegneria Civile, Ambientale, del Territorio, Edile e di Chimica, Via Edoardo Orabona, 4, 70125 Bari, Italy
6
Istituto Nazionale di Geofisica e Vulcanologia, Osservatorio Vesuviano—Sezione di Napoli, Via Diocleziano 328, 80124 Napoli, Italy
*
Author to whom correspondence should be addressed.
Sustainability 2022, 14(24), 16549; https://doi.org/10.3390/su142416549
Submission received: 17 October 2022 / Revised: 1 December 2022 / Accepted: 6 December 2022 / Published: 9 December 2022
(This article belongs to the Topic Natural Hazards and Disaster Risks Reduction)

Abstract

:
The re-mobilization of volcaniclastic material poses a hazard factor which, although it decreases with time since the last eruption, remains present in the hydrographic basins of volcanic areas. Herein, we present the results of the numerical modelling of erosive phenomena of volcanic deposits, as well as of flooding in the volcanic area. The proposed approach includes runoff estimation, land use analysis, and the application of hydraulic and erosion modelling. It exploits the Iber software, a widely used and validated model for rainfall-runoff, river flooding, and erosion and sediment transport modelling. The methodology was applied to the Island of Vulcano (Italy), known for the erosion phenomena that affect the slopes of one of its volcanic cones (La Fossa cone). The rainfall excess was calculated using a 19-year dataset of hourly precipitations, and the curve number expressed by the information on soil cover in the area, derived from the land cover and land use analysis. The erosion and flow models were performed considering different rainfall scenarios. Results show a particularly strong erosion, with thicknesses greater than 0.4 m. This is consistent with field observations, in particular with some detailed data collected both after intense events and by long-term observation. Results of the hydraulic simulations show that moderate and torrential rainfall scenarios can lead to flood levels between 0.2 and 0.6 m, which mostly affect the harbours located in the island’s inhabited area.

1. Introduction

Erosion, transport, and re-deposition of volcaniclastic deposits depend on the persistence of non-equilibrium slope conditions after environmental disturbance due to volcanic eruption [1,2,3]. Volcanic activity, and in particular explosive eruptions, modifies boundary conditions of fluvial systems by depositing large volumes of erodible fragmental material, thus increasing erosion rate and drainage mass (water and sediment) flux [4,5,6,7,8]. Volcaniclastic remobilization depends on different factors, including topography, land cover, and rainfall conditions, as well as grain size and thickness of the deposits, stratigraphic architecture, and spatial distribution of source material [9,10,11,12].
Herein, we present the results of the numerical modelling of erosive phenomena of volcanic deposits, as well as of flooding in the volcanic area. The approach includes the analysis of land use, in order to define the characteristics of water infiltration and runoff; a hydrological study for the analysis of precipitation data and the generation of rain intensity scenarios; and the implementation of 2D hydrodynamic and erosion simulations with the Iber software [13]. This model consists of five modules, among which the hydrodynamic and the sediment-transport ones were used in the present work. The hydrodynamic module solves the two-dimensional depth-averaged Shallow Water Equations, and is applied for unsteady flow computations. The sediment-transport module, which solves the 2D Exner equation, is used here to compute the bed elevation evolution due to the erosion process.
With the aim of modelling erosive processes and flooding phenomena in volcanic areas, the proposed methodology was applied to the Island of Vulcano, in the Aeolian Archipelago (Italy; Figure 1), where erosion and transport of volcaniclastic material have been both described as an ongoing process [14,15,16] and identified in the geological record [17]. The island, in fact, is prone to recurrent flooding phenomena that occur mainly at the end of summer and in early autumn, which determine the erosion and redeposition on the alluvial plain of volcanic material coming from the cone. These floods affect the inhabited area of the island, generating particular inconveniences to tourist activity. The hypothesis of this work is that a comprehensive methodological approach, which combines the analysis of land use, the geological characteristics of the material, and the hydrological and hydraulic study, allows us to calculate the erosion rates and the flow rates in order to provide concrete information on the most critical points of the volcanic building, and then to plan adequate hydraulic works to minimise the damage caused by moderate and intense weather events.
Field constraints to the numerical simulations were derived from remote and field observations, and in particular soon after the 14 September 2008 erosion event, when a mud and debris flow from the NW flank of the La Fossa cone invaded the Vulcano Porto village (located immediately downstream of the cone).

2. Study Area

The Island of Vulcano (38°24′ N, 14°58′ E), together with Stromboli and Lipari, is one of the active volcanic islands of the Aeolian Archipelago (southern Italy), and it is composed of several volcanic edifices that have overlapped in time and space since 120 ka [18]. The most recent volcano, the La Fossa cone (Figure 1), is a 391 m high active composite cone located within the La Fossa Caldera, whose initial activity is dated at 5.5 ka [19]. The last eruption took place in 1888–1890 [20], and this is commonly taken as the prototype of Vulcanian-type eruptions [21]. The summit area includes the present-day crater and the older crater structures, whereas the cone flanks are dominated by sheet or in-channel erosion, with the exception of the western and northern sectors, which are characterised by rotational sliding [16,22]. The northern sector is characterised by steep slopes, fracturing, intense fumarolic activity and hydrothermal rock alteration in the proximity of two eccentric vents [18,23,24]. The Vulcano Porto plain is a flat area (slope < 5°) just north of La Fossa cone, bounded by the La Fossa Caldera rim to the west. The area was filled with debris resulting from recent eruptions (11th century—1890 AD, [25]), both as a primary transport and an erosion-transport-redeposition phenomenon [17,26]. The debris supply to the Vulcano Porto plain derived directly from the N side of the cone, but also from the Palizzi valley, which drains the southern and western slopes of the La Fossa cone. After observing the erosive processes following the 1888–90 eruption, De Fiore [27] reported that about 50 m of the slope were eroded between 1916 and 1921 [17]. The isthmus between Vulcanello and the Vulcano Porto plain (Figure 1) began to develop after the post-12th century emplacement of the Vulcanello lava platform [28,29]; it emerged from the sea due to both coastal processes and volcaniclastic sediment inputs from the La Fossa cone through the Vulcano Porto plain and the Palizzi Valley [30].
The lithology of the northern part of the Island of Vulcano comprises fine-grained ashes, coarse-grained ashes and sands, lava flows, and minor coarse-grained lapilli and bomb deposits, mainly related to proximal sedimentation or sporadic sub-Plinian fall deposits (Figure 2; [17,26,31]). Among the primary deposits, the La Fossa cone emitted the Tufi Varicolori (Varicoloured Tuffs) after the so-called eruption of the Breccia di Commenda (1243–1304 AD; [32,33]). These are very fine ash layers, rich in alteration minerals [34], which have a very low permeability [16]. These deposits are tens of metres thick in the summit area of the La Fossa cone, while they are a few tens of centimetres thick in the plains surrounding the cone [17,32]. Above these deposits, alternations of loose fine and coarse ashes were deposited, attributed to the explosive activity that took place between the 15th and 19th centuries [17,25]. These deposits have a higher permeability than the underlying ones, making them more erodible and, therefore, involved in the phenomenon of material remobilization by rainwater [14,17,34]. Transport events of volcaniclastic material from the cone flanks to the surrounding plains are observed every year in correspondence with the most intense/lasting rain events. These events have been described by Ferrucci et al. [14] as erosion-dominated events, with the generation of small volume debris flows that transfer loose material downslope, producing a denudation of the substratum upslope (made up of Varicoloured Tuffs), on which a stable rill network develops. Recently, the works of Baumann et al. [35] and Gattuso et al. [36] have focused on the characterization of materials and on hazard assessment related to syn- and post-eruptive debris flows. These works take into consideration the triggering and transport of material deriving from future eruptions, taking into account short and long-lasting eruptive scenarios deriving from Biass et al. [37], but do not consider the phenomena of erosion and flooding that occur during inter-eruptive periods, such as that post-1890.
Typical semi-arid Mediterranean conditions characterise the climate of the Island of Vulcano. Mean annual precipitation reaches 602 mm, mostly concentrated in autumn and winter. On average, 69 rainy days per year are recorded on the island. During late spring and summer seasons, dry conditions prevail, although rare and short-lived thunderstorms can occur. The mean yearly temperature is 18.3 °C, with the lowest and the highest temperatures in January (mean 12.2 °C) and August (mean 27.2 °C), respectively (Lo Cascio and Navarra 1997). The vegetation cover of the studied sector of the La Fossa cone decreases up-slope, and above 100–120 m a.s.l., a bare surface prevails [38].
The effect of climate change on the rainfall trend and its impact on the environment has been under study for several decades now. Signals that extreme events have had an important influence on the modification of rainfall properties in Sicily over the last century were investigated by Arnone et al. [39]. These authors found that, in accordance with the trends recognised in the Mediterranean ecosystem, a significant increase in short duration precipitation is affecting Sicily. Their results show an increase in the number of events per year that can be classified as heavy-torrential rainfall, in spite of light precipitation, which is decreasing in annual occurrence. These results have very important implications on the hydraulic structure of small basins and small areas, not only in terms of the repercussions they can have on flood phenomena, but also on the erosion processes of particularly unstable areas covered by loose material.

3. Materials and Methods

The methodology proposed for the analysis involves several phases:
  • The analysis of the land cover and land use of the northern sector of the Island of Vulcano to identify areas with different coverage, which correspond to different flow/infiltration coefficients;
  • Analysis of bibliographic data regarding the characterization of the material, which is useful for defining the erosion parameters of the deposits;
  • Analysis of rainfall data, collected at the nearest available meteorological station, located at Leni (Salina Island, 15 km NW of Vulcano), by the Agrometeorological Information Service of Sicily (SIAS) [40];
  • Hydrological study for rainfall excess calculation and definition of rainfall scenarios;
  • Numerical simulations of runoff and erosion scenarios with the Iber 3.2.0 software (Figure 3).

3.1. Land Use Analysis

PLÉIADES-1 high-resolution optical imagery (multispectral data with a resolution of 1 m × 1 m) and Digital Surface Model (DSM, with a resolution of 1 × 1 pixel), which was derived from stereoscopic reconstruction (tri-stereo mode; see Bagnardi et al. [41]), was collected on 12 June 2020 and used to constrain the land use map. The optical image is 100% cloud-free, with a coverage of 20.8 ca. km2. Classes have been mainly derived from the second level classes of the 2018 CORINE Land Cover project (CLC, ISPRA-Istituto Superiore per la Protezione e la Ricerca Ambientale database), with a general overview of the third and fourth level classes, also taking into account the pre-existent Carta Tecnica Numerica 1:2000 (CTN CART2000, Sicilia Region database) and the updated 2021 Open Street Maps database. The land use mapping procedure was carried out manually, using the 1:2000 scale.
The Island of Vulcano is characterised by different land uses, divided into five macro categories based on the degree of anthropisation and type of land management: artificial areas, agricultural areas, wooded and semi-natural vegetated areas, semi-natural not vegetated areas, and wet areas. Artificial areas include buildings, public and private adjacent areas, and roads (i.e., primary and secondary roads, helipads, and harbours). Agricultural areas consist of arable crops (i.e., arable crops in irrigated or non-irrigated areas, set-aside lands in irrigated or non-irrigated areas), agricultural woody crops (i.e., olive groves, vineyards, and orchards) mainly non-terraced, heterogeneous agricultural areas (i.e., annual crops associated with permanent crops, vegetable gardens, agricultural areas with large natural spaces), and permanent lawns (i.e., surfaces with herbaceous vegetation, characterised by spontaneous grassing and commonly not worked). Wooded and semi-natural vegetated areas include woods (i.e., eucalyptus and pine, for recent reforestation; holm oak, heather, honeysuckle, manna ash, and strawberry trees for native forests), and areas with herbaceous and shrubby vegetation (i.e., natural pastures and grasslands, herbaceous and shrubby vegetation evolving, Mediterranean bushes). Semi-natural non-vegetated areas include areas with poor or absent vegetation (i.e., cliffs and rocks with poor or absent vegetation, dunes, sands). Finally, wet areas consist of wetlands (i.e., vegetation dominated by reeds/rushes).

3.2. Hydrological Study for Rainfall Scenarios Definition

The hydrological study was conducted to calculate the rainfall excess on the island, and, thus, to estimate surface runoff, based on a dataset populated by 19 years of hourly total rainfall data provided by the Agrometeorological Information Service of Sicily (SIAS). The methodology adopted follows the Soil Conservation Service—Curve Number (SCS-CN) approach. This method was proposed for the first time in 1956 by the U.S. Department of Agriculture in the National Engineering Handbook of Soil Conservation Service (see [42]); it is a conceptual method widely used in many hydrologic applications for runoff evaluation. The Curve Number value plays a fundamental role in the runoff evaluation, since it accounts for infiltration losses. The SCS-CN method, originally elaborated to predict runoff volumes in small agricultural watersheds [43], was developed well beyond its original scope and was adopted for different river basins’ characteristics and climate conditions [44,45,46,47]. This approach has been taken as a procedure by many users in numerous hydrological applications for design flood estimation, and/or for runoff evaluation for a particular storm event [48]. More details about the theoretical background are given in Pilgrim et al. [49].
Rainfall excess Q (Equation (1)) is computed as a function of the total rainfall p; initial abstraction Ia, commonly assumed as in Equation (2), which includes the interception storage, the early infiltration and the surface depression storage; and sorptivity S, which is the maximum potential retention of the soil, given by Equation (3):
Q = ( p I a ) 2 p I a + S
I a = 0.2   S
S = S 0 100 C N 1
where S 0 is a scale factor fixed to the value 254 mm, while CN depends on land use, hydrological soil type, and antecedent soil moisture condition (AMC). Generally, the AMC class is evaluated using the rainfall amount in the five days preceding the storm [50]; in this study, a normal condition of AMC was adopted, which, together with the predominant soil characteristics on the island (see Section 4.1. Land use), have provided an average CN value of 80.
Figure 4 shows the maximum annual rainfall intensities extracted from the 19-year (from 1 January 2003 to 28 August 2021) precipitation dataset.
Arnone et al. [39], in their statistical analysis of changes in rainfall characteristics in Sicily, classify daily rainfall into three categories on the basis of annual rainfall intensities and their frequencies, i.e., light precipitation (0.1/4 mm d−1), moderate precipitation (4/20 mm d−1), and heavy-torrential precipitation (>20 mm d−1). Their observations suggest that light precipitation has a greater annual occurrence, with an average frequency of 60% over the entire time window; moderate and heavy-torrential rainfall have an average frequency of 30% and 10%, respectively. The analysis of the data set used in this study confirms the trend identified by Arnone et al. [39], with the average frequency of rainfall annual occurrence distributed as follows: 55% for light precipitation, 35% for moderate precipitation, and 10% for heavy-torrential precipitation.
To analyse the effects of precipitation on the erosion mechanism and runoff acting on the island, moderate and heavy-torrential precipitation were simulated. The hydrological inputs for the two scenarios correspond to the average precipitation values, extracted from our rainfall dataset for each of the two categories, and these are: moderate, 13.8 mm d−1, and heavy-torrential, 32.4 mm d−1. In the study of extreme rainfall carried out by Arnone et al. [39], historical series exhibit increasing trends for short durations. In particular, a positive trend is observed for durations between 1 and 6 h. To account for these observations on historical data, an average duration of 3 h was chosen in this work for the simulations of the moderate and torrential scenarios.

3.3. Hydraulic and Erosion Modelling with the Iber Software

The erosion process that intervenes on the northwestern sector of the La Fossa cone has been simulated with the Iber software [51]. This model has been widely used and validated in previous studies on rainfall-runoff modelling [52], numerical modelling of river flooding [49], and calibration of estuarine hydrodynamic models [53]. It has also been calibrated for the formulation of sediment transport processes [54], and has recently been applied in the analysis of erosion and sediment transport on the Island of Stromboli, located ~50 km NE from the Island of Vulcano [55], as a consequence of the wildfires induced by the 3 July 2019 explosion [56]. This critical sector of the La Fossa cone is not only involved in strong erosion processes and downstream material transport [14], but it is also crossed by a trail towards the top of the cone, which is a fundamental infrastructure for field observation and the maintenance of the monitoring stations located in the crater area [57].
The sediment-transport module, applied here for erosion calculation, solves the non-cohesive sediment non-stationary transport equations that include the bedload transport and the suspended sediment transport.
The bed level variation is calculated by applying the Exner sediment conservation equation:
1 p δ Z b δ t + δ q s b , x δ x + δ q s b , y δ y = D E
where p is the porosity of the sediment’s bed layer, Zb is the bed elevation, qsb,x and qsb,y are the two sediment flux components, and DE is the difference between the bedload discharge and the suspended load discharge. In the first part of this work, we focused on simulations of the bed erosion, so that the sediment-rise term of the equation was not considered, and the term E in Equation (4) was discarded.
The bedload is calculated using the correction to the original Meyer–Peter and Müller [58] empirical formula, proposed by Wong [59] and Wong and Parker [60]:
q s b * = 3.97 · τ b s * τ c * 3 2
where q s b * is the solid flow rate, τ b s * is the dimensionless grain stress, and τ c * is the dimensionless critical bed stress. In this work, to take into account that the bed is not flat, another correction is included to consider the effect of gravity in the case of a high slope bed. To this end, Equation (5) is used, substituting the critical and bed stress by effective stresses and calculating the sediment discharge as a function of the fluid’s stress and the bed slope.
In order to solve the sediment conservation equation, the Iber’s sediment-transport module uses the velocity and depth fields calculated by the hydrodynamic module which numerically simulates the non-steady, turbulent-free surface flow, and then solves the depth-averaged shallow water equation (SWE) using an explicit unstructured finite-volume solver. The principal assumption of this module is the hypothesis that a hydrostatic pressure distribution and a uniform depth-velocity profile will allow us to neglect the dispersion terms in the SWE equation, since they are difficult to calculate in a depth-averaged model. The first hypothesis is reasonably fulfilled in open channel flows, and the second one complies in rivers and open channels, providing that there are no stratification processes. This module is also used here for the second part of this work, to compute flood levels in the downstream area of the volcano, generated as a consequence of different precipitation scenarios. Within this module, the bottom friction plays a fundamental role, since it produces a double effect on the resolution of shallow water equations: it generates a friction force that opposes the average velocity of the flow and affects the generation of turbulence. For this reason, the fundamental parameter to be calibrated for the application of this module is the Manning coefficient. The assignment of the appropriate Manning coefficients was made on the basis of the soil cover analysis described above. More details on the methodology applied for the realisation of the hydraulic simulations can be found in the article by Bonasia et al. [61].
In order to study the effects of erosion on the northern flank of the volcano cone, the computational domain (shown in the supplementary material) was constructed using the digital surface-type elevation model with 5 m resolution, derived from airborne LIDAR data which were provided by Ministry of Environment and Protection of Land and Sea (MATTM; [62] accessed on 22 November 2019).
The domain was discretised with an unstructured triangular mesh of 351,252 elements, with a 2 m mesh size, assigned to the surface. Various iterative tests were implemented to meet the optimal cell size dimension, in order to return, at the convergence of the simulation, the lowest number of residuals, i.e., a lower deviation of the equation’s numerical solution from its exact value.
The surface roughness was characterised by the attribution of two Manning’s coefficients, corresponding to rocks (0.015) and volcanic ashes (0.023). The distribution of these coefficients, shown in a map in the supplementary materials, was chosen mainly on the basis of the lithological characteristics of the area, in order to make a more precise distinction between less and more erodible areas. An initial condition of water depth equal to zero was imposed to the domain, since there are no rivers on the island.
First of all, the intense precipitation event that occurred on 14 September 2008 was simulated, the hyetograph of which, used as hydrological input, is shown in Figure 5. Numerical parameters and grain properties for the bed shear stress and erosion calculation are shown in Table 1. Since the rainfall during this event lasted 22 h, a simulation time of 24 h (86,400 s) was chosen in order to drain all the rain from the study area. The coarse-grained ashes and sands correspond to the volcaniclastic deposits from eruptions between the 15th and 19th centuries [17] (Figure 5), characterised by Baumann et al. [35] and Tommasi et al. [22].
Once the model was validated on the study area by comparing calculated and observed erosion levels for the 2008 event (see Section 4.2), the rainfall scenarios, described in Section 3.2, were simulated.
For these simulations, the hydrological input is represented by rainfall intensities corresponding to the moderate and heavy-torrential scenarios, uniformly distributed over 3 h, so that the maximum simulation time is assumed to be 10,800 s.
Finally, the inundation scenarios were modelled using the computational domain shown in the supplementary materials, which was defined in order to analyse the effects of surface runoff due to the rainfall scenarios in the inhabited area downstream of the volcano. For these simulations, in order to obtain different levels of spatial resolution, the domain was discretised with an unstructured triangular mesh of 1,515,785 elements, with the following elements dimensions: 1 m for infrastructure, 2 m for the residential area, and 5 m for the rest of the domain. Five Manning’s coefficients have been chosen for these simulations: 0.023 for volcanic ash, 0.015 for rock, 0.15 for the urban area, 0.020 for infrastructure, and 0.05 for areas with poor vegetation. The distribution of these coefficients in the computation domain reflects the presence of the main land uses identified in this work, whose area distributions and relative percentages are shown in the following paragraph. The areas with shrub vegetation or uncovered soil of the cone were characterised on the basis of the geological characteristics of the area, in order to attribute more specific Manning’s coefficients for the presence of rock and volcanic ash.

4. Results

4.1. Land Use

The land use analysis shows that artificial areas represent 9.2% of the Island of Vulcano: the most anthropised areas, characterised by recent buildings (1.4%) and mainly intended for summer tourist activity, large public and private adjacent areas (5.1%), and minor roads for the access to properties (2.7%), are located in the Vulcano Porto area (Figure 6). The Vulcanello and Piano areas are also considerably anthropised, but not as much as Vulcano Porto.
Agricultural areas represent 5.7%: arable crops (1.1%), which include both arable lands and set-aside lands, either irrigated or non-irrigated, are distributed near the flat (slope < 5°). Inhabited areas of Vulcano Porto and Piano, with agricultural woody crops (2.4%) such as olive groves, vineyards, and orchards, are distributed not only in Vulcano Porto and Piano areas, but also on the southeastern side of the island, where the slopes are more steep and terraces are needed. Permanent lawns (2.0%), characterised by large patches with herbaceous vegetation as a consequence of land management changes (e.g., from pastoralism and/or agriculture to abandonment and subsequent re-naturalization) over time, are homogeneously distributed both in the Vulcano Porto and Piano areas. Together with heterogeneous agricultural areas (0.2%), which mainly include vegetable gardens and/or agricultural areas with large natural spaces, the distribution of the agricultural land uses previously described generates very peculiar landscape patterns, which are common to the entire Aeolian Archipelago.
Wooded and semi-natural vegetated areas represent 50.5% of the Island of Vulcano: allochthonous eucalyptus and pine woods (10.0%) are distributed in the Vulcanello area and below the La Fossa cone in the north-eastern and western side of Piano area, while native species, such as holm oak, heather, honeysuckle, manna ash, and strawberry trees, are disseminated mainly near Gelso village, in the south (Table 2). Herbaceous and shrubby vegetation (40.5%) consists of natural pastures and grasslands; this type of vegetation is evolving, in addition to, of course, Mediterranean bushes, and these are homogeneously distributed on the entire island.
Semi-natural non-vegetated areas represent 34.6% of the island, and consist of cliffs and rock with poor or absent vegetation, dunes, and sands. They are mainly located along the coasts and in the proximity of the La Fossa cone. Finally, between the Vulcanello and Vulcano Porto areas, wetlands that are characterised by reeds/rushes represent less than 0.1% of the whole island (Figure 7).

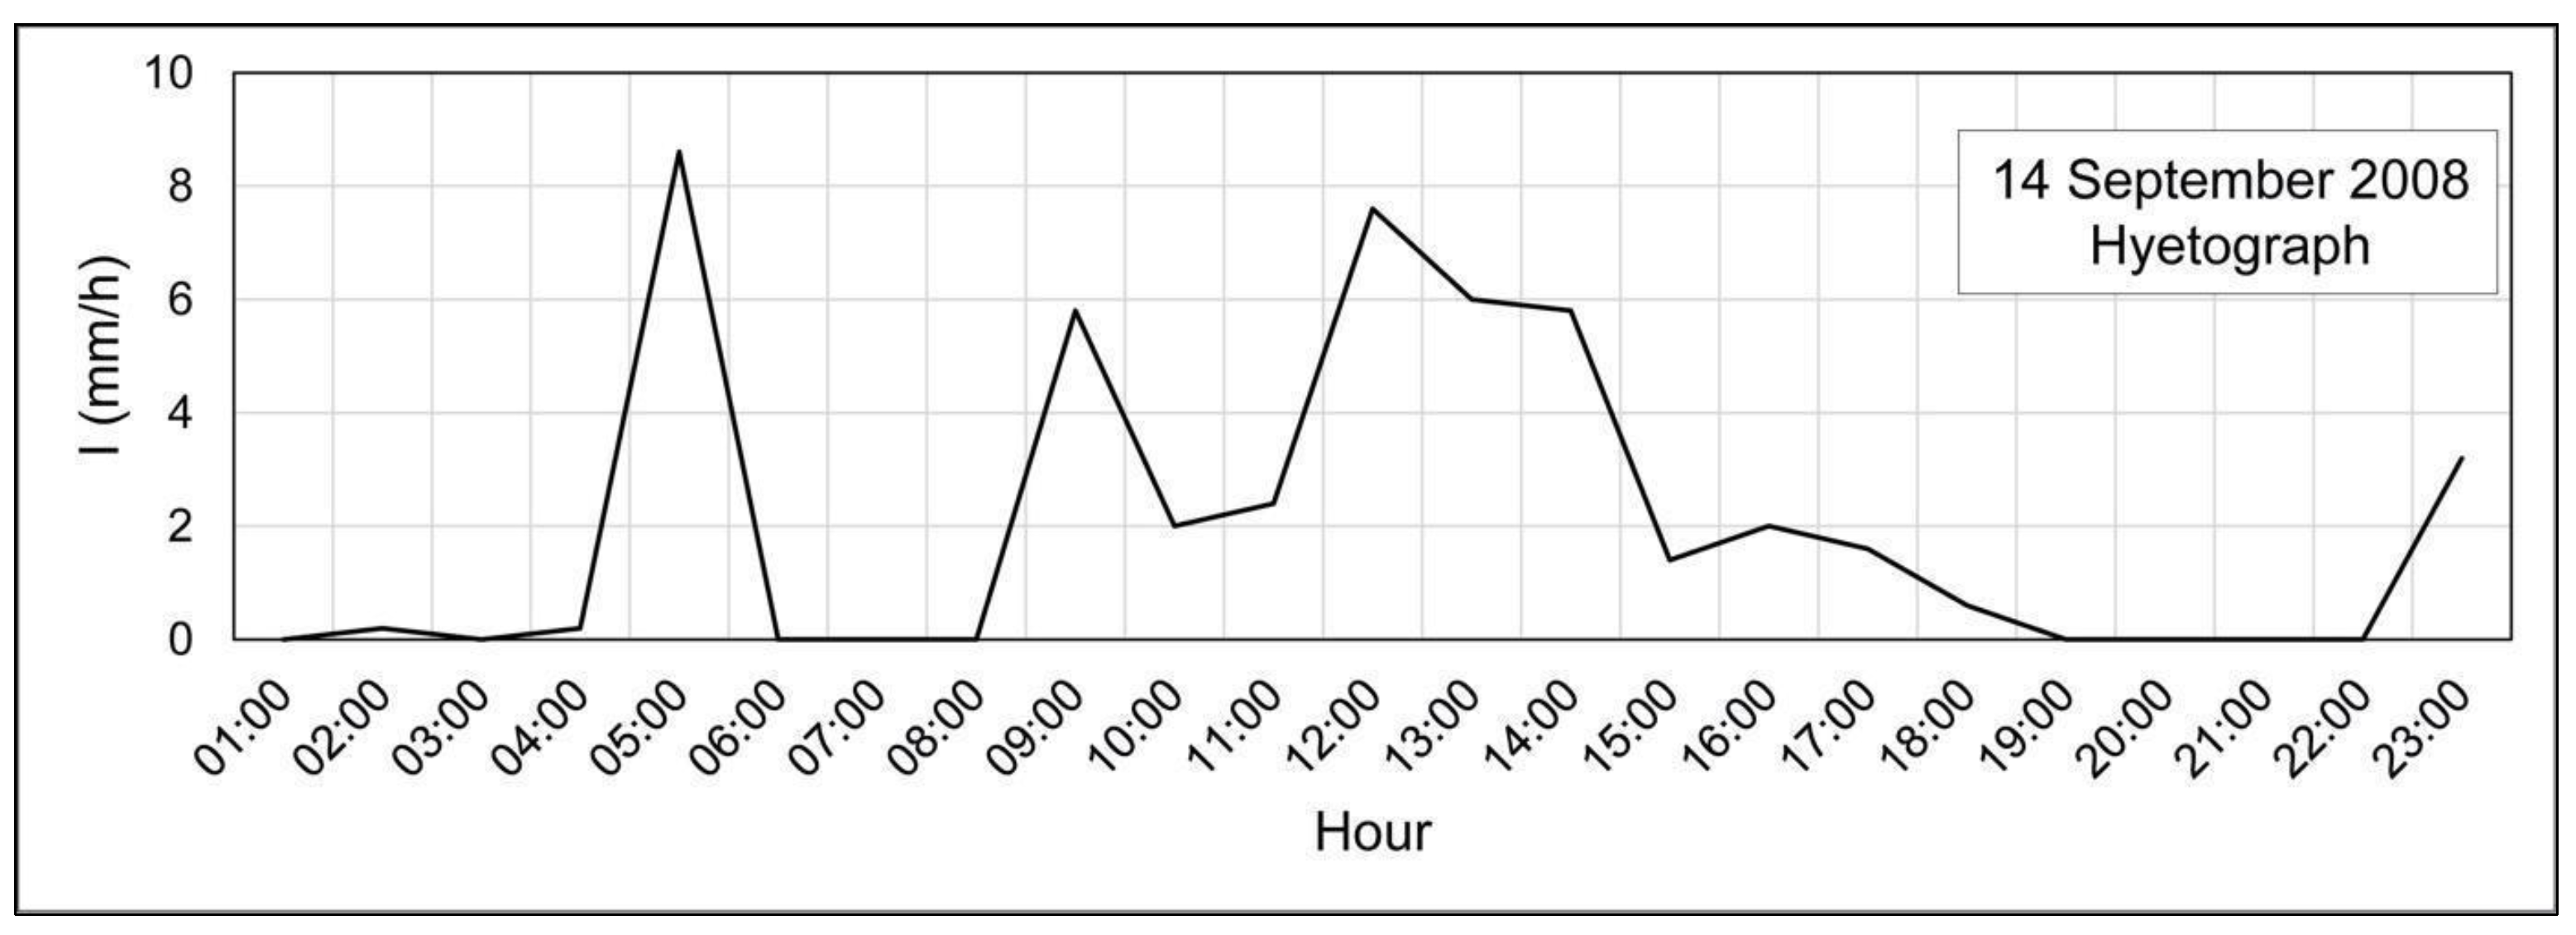
4.2. Model Validation: The 14 September 2008 Event

A sudden thunderstorm hit the Island of Vulcano at ~22:00 UTC on 13 September 2008, and it continued for the following hours. During the event, a total rain sheet of 47.4 mm fell over 22 h, with a rainfall intensity distribution that can be seen in Figure 5, producing erosion up to one meter in channels located on the northern flank of the La Fossa cone (Figure 8). According to a witness report, at about 04:30 UTC, shortly after the first peak of precipitation intensity was reached, water and debris began descending from the northern flank of the La Fossa cone, and covered the main road connecting Vulcano Porto village to the Piano area (Figure 9a). A significant amount of uprooted shrubbery and branches have been observed, mainly deposited on the upstream side of cars (Figure 9b). At the same hour, another witness reported the occurrence of mud and water inside a guest house located just at the base of the La Fossa cone, at the toe of the Pietre Cotte lava flow (Figure 9c). At 07:00 UTC, the Vulcano Porto-Piano road was completely flooded by at least 10 cm-deep water and mud. The road that connects Vulcano Porto to the Piano inhabited area rapidly became the major collector of water and sediments, running down the northern flank of the La Fossa cone.
The deposits found along the northern sector of the Vulcano Porto-Piano road and at Porto di Levante wharf were fine-graded and thin, with rare boulders (Figure 9d). At the end of the Vulcano Porto-Piano road, at the harbour, the wharf was totally covered by a 5–10 cm thick deposit of sand and mud, with scattered boulders and pebbles (Figure 9d). Seawater in the harbour (at least 20 m from the wharf edge) was dirty, due to the continuous supply of muddy water from the Vulcano Porto-Piano road (Figure 9d).
Results of the simulation, for erosion on the cone flank, are shown in Figure 10. Erosion is particularly strong within the channels, with depths greater than 0.4 m. In particular, the observations made immediately after the erosive event showed strong evidence of erosion in the channels located to the east of the Pietre Cotte lava flow (Figure 8). Signs of erosion were observed, which ranged between 0.5 and 1 m, decreasing towards the valley. Up to 1 m of erosion can be observed in one channel (Figure 8c). In the channel where the major erosion has been observed in the field, the models predicted ~1 m of erosion, in good agreement with the field observation.

4.3. La Fossa Cone Erosion and Floods Scenario

Erosion maps for (a) the moderate and (b) the heavy-torrential rainfall scenarios are reported in Figure 11. The erosion induced by precipitation of moderate intensity, which has a high frequency of occurrence on the island, is more evident in the channels adjacent to the Pietre Cotte lava flow. A scenario of more intense precipitation determines an increase in erodible areas, affecting other channels east of Pietre Cotte, with depths of erosion levels exceeding 0.4 m.
To analyse the extent and degree of flooding, the moderate and heavy-torrential precipitation scenarios were simulated again, considering only the excess rainfall flowing to the surface and the net of rain absorbed by infiltration. From the flood maps shown in Figure 12, it can be seen that the main water collection basin is the Palizzi valley, from which the water is distributed mainly in the western harbour area (Porto di Ponente). Minor flow channels are located on the north side of the volcano flank, from which runoff reaches the eastern harbour area (Porto di Levante). It is worth noting that the main asphalted infrastructures of the island, particularly the road running along the volcanic edifice upstream of the inhabited centre, as well as the one leading to Porto di Ponente, constitute important passages in which the discharge rate increases and, therefore, the flood levels do as well.
While the moderate rainfall scenario leads to ephemeral floods on the inhabited centre, which do not exceed 0.2 m (Figure 12a), the torrential rainfall scenario can lead to flood levels that exceed 0.6 m (Figure 12b). In the most unfavourable scenario, the harbours appear to be the most affected by the flooding, as occurred on 14 September 2008 in the Vulcano Porto wharf (Figure 9d).

5. Discussion

5.1. Limits of the Erosion and Flooding Models

When modelling the erosion and sediment transport processes at the mesoscale (<100 km2), the main factors affecting the simulation are a good knowledge of both the spatiotemporal characteristics and the dynamics of precipitation. Of course, in-depth knowledge of the geomorphological and sedimentological characteristics of the basin, as well as of the change in land cover and the effect of human intervention, plays a very important role. Therefore, the modelling depends on knowledge of the correct structural and functional connectivity of all the catchment sources. Physically based models already capture the connection between the erosion process and the sediment fingerprint data [63,64]. However, these models focus on the long-term source contribution, and hardly work with a high temporal resolution to capture the flow dynamics at the scale of the flood event.
On the other hand, numerical modelling allows for the analysis of the source effects at the catchment scale, as well as understanding of travel times on the basis of the characteristics of the rainy event. Modelling of soil erosion suffers from the absence of algorithms which include all the factors related to the combined effects of the erosion and hydrological processes [65]. Although there is no standard protocol, it is evident that results from hydrological–sedimentary models are very sensitive to their initialization parameters, namely spatial implementation (e.g., the selection of the DEM) discretization (attribution of the mesh sizes), and initial input parameters [66].
Regarding spatial discretization, the definition of the flux, and, consequently, of the erosion sources, strongly depends on the threshold and, therefore, on the DEM resolution. In the present work, we limited the simulation area to an extent of 0.520 km2, and we used a DEM with a resolution of 5 m, discretised with a computational mesh size of 2 m. Although these choices allowed us to obtain an estimation of the erosion rate in correspondence with specific alluvial events, they did not provide the erosion depths in greater detail. More precise results would be obtained with a higher resolution DEM, corresponding to the current morphological situation of the study area. A higher resolution of the DEM, as well as a higher resolution of the computational mesh, would also eliminate the unrealistic erosion that is observed on the high slope areas present at the base of the “Pietre Cotte” casting (Figure 11). On the other hand, higher resolutions would cause excessively high calculation times. Otherwise, the discretization of the computational domain provided satisfactory results.
As for the flow and erosion parameterization, the Iber model uses the Shallow Water Equations integrated in depth (St. Venant equations in 2D), which are very sensitive to the roughness parameters [67,68]. In this work, the roughness values used for the erosion scenarios simulations were derived from the analysis of the lithological characteristics described in Figure 2. For the hydraulic simulations of flood levels, the attribution of Manning’s coefficients derives from the land cover analysis described in Section 4.1. Both choices represent a good approximation for the purpose of this work, with major limits related to the precise updating and location of the different land uses.
In the simulation of the erosion process, the choice of the model for the formulation of the bottom load plays a fundamental role. In this work the Meyer–Peter and Müller [57] approximation was chosen, making the necessary corrections for the effect of gravity due to the high slope gradients in the area. The main limitation is that the Iber version used here only considers a uniform granulometry, with grain sizes characterised by their average diameter. Another limitation is the vertical and horizontal positioning of rock layers (non-erodibility condition). As for discretization of the computational domain geometry, a high resolution and precision level is required for correctly calculating bed erosion. The presence, in our results, of eroded levels in areas where erosive phenomena have not been observed is due to these limitations.

5.2. Risk Implication of Erosion and Floods Models

The Island of Vulcano is known for the erosion phenomena affecting the La Fossa cone, visible as gullies and deeper bedrock channels developing along its NW flank, facing the Vulcano Porto area (Figure 13a). Sheet erosion is progressively dismantling and re-depositing on the alluvial plain, and the products of the 1888–1890 eruption (grey terrains in Figure 13a), often flood the inhabited area. These floodings do not generate serious problems for human lives, but they can lead to inconveniences and economic damages. This is particularly remarkable for events occurring in late summer−early autumn, where the presence of tourists on the island is still significant. Phenomena such as the one that occurred on 14 September 2008 can lead to the early closure of tourist accommodation facilities, the impossibility of docking hydrofoils in the small Porto di Levante harbour, and accumulation of debris on roads and docks.
The results of the erosion simulations, induced by moderate and heavy rainfall scenarios, provide important information on the rate of erosion that can affect the volcanic cone. In the case of moderate rainfall (Figure 11a), for precipitation lasting 3 h, the erosion rate is generally between 20 and 30 cm, with higher levels west of the Pietre Cotte lava flow. During heavy-torrential rainfall (Figure 11b), erosion increases, exceeding 40 cm within multiple channels of the volcano cone. In the specific case of the erosion process triggered by the 14 September 2008 rainfall, it is evident that there are circumscribed areas of the volcanic cone where particularly intense precipitation phenomena can cause the excavation of the channels, up to depths greater than 0.4 m, due to specific bed conditions and granular material characteristics. By observing the map of flood levels for a torrential rainfall scenario (Figure 12b), it can be seen that the eroded material can be taken over by both the bedrock channel runoff and the one flowing along the road, running alongside the volcanic edifice.
In general, the results of the simulations of flood scenarios (Figure 12) indicate that the asphalted road network is the main factor responsible for increases in runoff speed and water accumulation in the inhabited centre, as well as on the two ports. This occurs with both heavy and moderate rainfall. The main collector is the road that leads to the eastern port, which carries the water from the basin of the Palizzi valley. In a moderate rainfall scenario, this road leads to water accumulation up to 40 cm. In the case of torrential rainfall, runoff also flows along the other roads and from the bedrock channels of the north flank of the volcano. The result is an accumulation of water in the inhabited areas, in some areas exceeding 60 cm, and in the two ports, where it can exceed 1 m.
The fast erosion rates mentioned above are mostly controlled by the huge contrast of hydraulic conductivity between the incoherent deposits of the 1888–1890 eruption and the underlying, compacted and altered (hydrothermal argillic alteration) horizons, put in place during older volcanic cycles [16]. These authors reported values of hydraulic conductivity down to 5.4 mm h−1, constantly exceeded by the most intense yearly rainfalls (Figure 4) in general, and during the 14 September 2008 event in particular. During intense rainfalls, water infiltrating through the 1888–1890 deposits generated a shallow subsurface runoff at the contact with the underlying, less permeable volcanic products. Once the shallower deposits are saturated, water starts to flow over the ground (Figure 13b), also triggering mudflows. This process creates a kind of “muddy conveyor belt”, which is able to move coarser particles and volcanic bombs downhill, generating the mixed mud−debris flows that, from the flanks of the La Fossa cone, invade the downslope areas. It is worth noting that once the mud flow is transformed into a debris flow, its erosional force is considerably incremented.
Erosional phenomena have experienced a significant increase since the 1980s, due to the anthropogenic modifications of the northwestern flank of the La Fossa cone. The first intervention consisted of the cutting of a zigzagging rough road leading to the crater rim, visible in Figure 13a. This was originally intended to replace the old footpath, made unsafe by erosion and landslides, and to be large enough to be travelled by off-road vehicles [15]. The new road collected the runoff from the gullies uphill and caused its diversion along a diagonal descending the slope (Figure 13a–c). The runoff flowing along the road, due to continuous changes of the micro-topography of its surface, was newly intercepted (every time) by different gullies. This restored the original flow direction along maximum slope lines, but shifted downhill with respect to the pristine. In other words, the road triggered a process of fluvial capture, concentrating, in single channels, the runoff first distributed in different ones, as illustrated by Di Trapani et al. [15], and incrementing the flow (and consequently the erosion) rate inside them.
The road has been progressively incised by new gullies (Figure 13c), making it difficult to be travelled by tourists, and fostering new and erroneous interventions such as a new rigid and impermeable pavement. This has boosted erosion after its termination, both along its uphill side and downhill, due to the increased velocity of the runoff driven by the reduced roughness of the artificial pavement (Figure 13d).
The attempts at regulating the new hydraulic regime, based on the construction of diggings downhill of the road, which collected the runoff that crossed the rough road along buried pipes (Figure 13e), failed because the diggings were rapidly filled by sediments transported by the runoff. This is evidenced in Figure 13f, where it is visible that the lower pipe is completely buried. Once the diggings were filled, the crossing pipes became inactive, and the runoff, diverted on the sides of the dams, created new erosional channels that progressively exhumed the hydraulic works (Figure 13g).
In simpler words, the intervention intended for the hydraulic regulation of the northwest flank of La Fossa Cone had the opposite effect of boosting its erosion.

6. Conclusions

A model-based methodology for re-mobilization of volcaniclastic material and floods analysis in the volcanic environment is proposed here. The study was applied to the Island of Vulcano, and in particular to its northern part, where the main village (Vulcano Porto) is located. The methodology made it possible to calculate the excess rainfall, considering both the available rainfall data and the land use data purposely derived from high-resolution satellite images. The available rainfall data consisted of 19-year datasets of hourly total rainfall, which did not allow us to define rain scenarios with local significance. For this reason, scenarios deriving from works of literature and values were used in the northern area of the Sicily Region, where the Island of Vulcano is located.
The scenarios made it possible to define the response of the material deposited on the cone of La Fossa, the last active eruptive centre on the Island of Vulcano, to phenomena of “moderate” or “heavy-torrential” rain. The same scenarios have been applied to the flooding phenomena of the inhabited areas.
General considerations may be derived from this study. In particular, it is clear that:
  • Although the rainfall scenarios have regional and non-local significance, they are able to reproduce erosion phenomena observed in the field, confirming the general validity of the approach of calculating excess rainfall and, therefore, of choosing the rainfall scenarios;
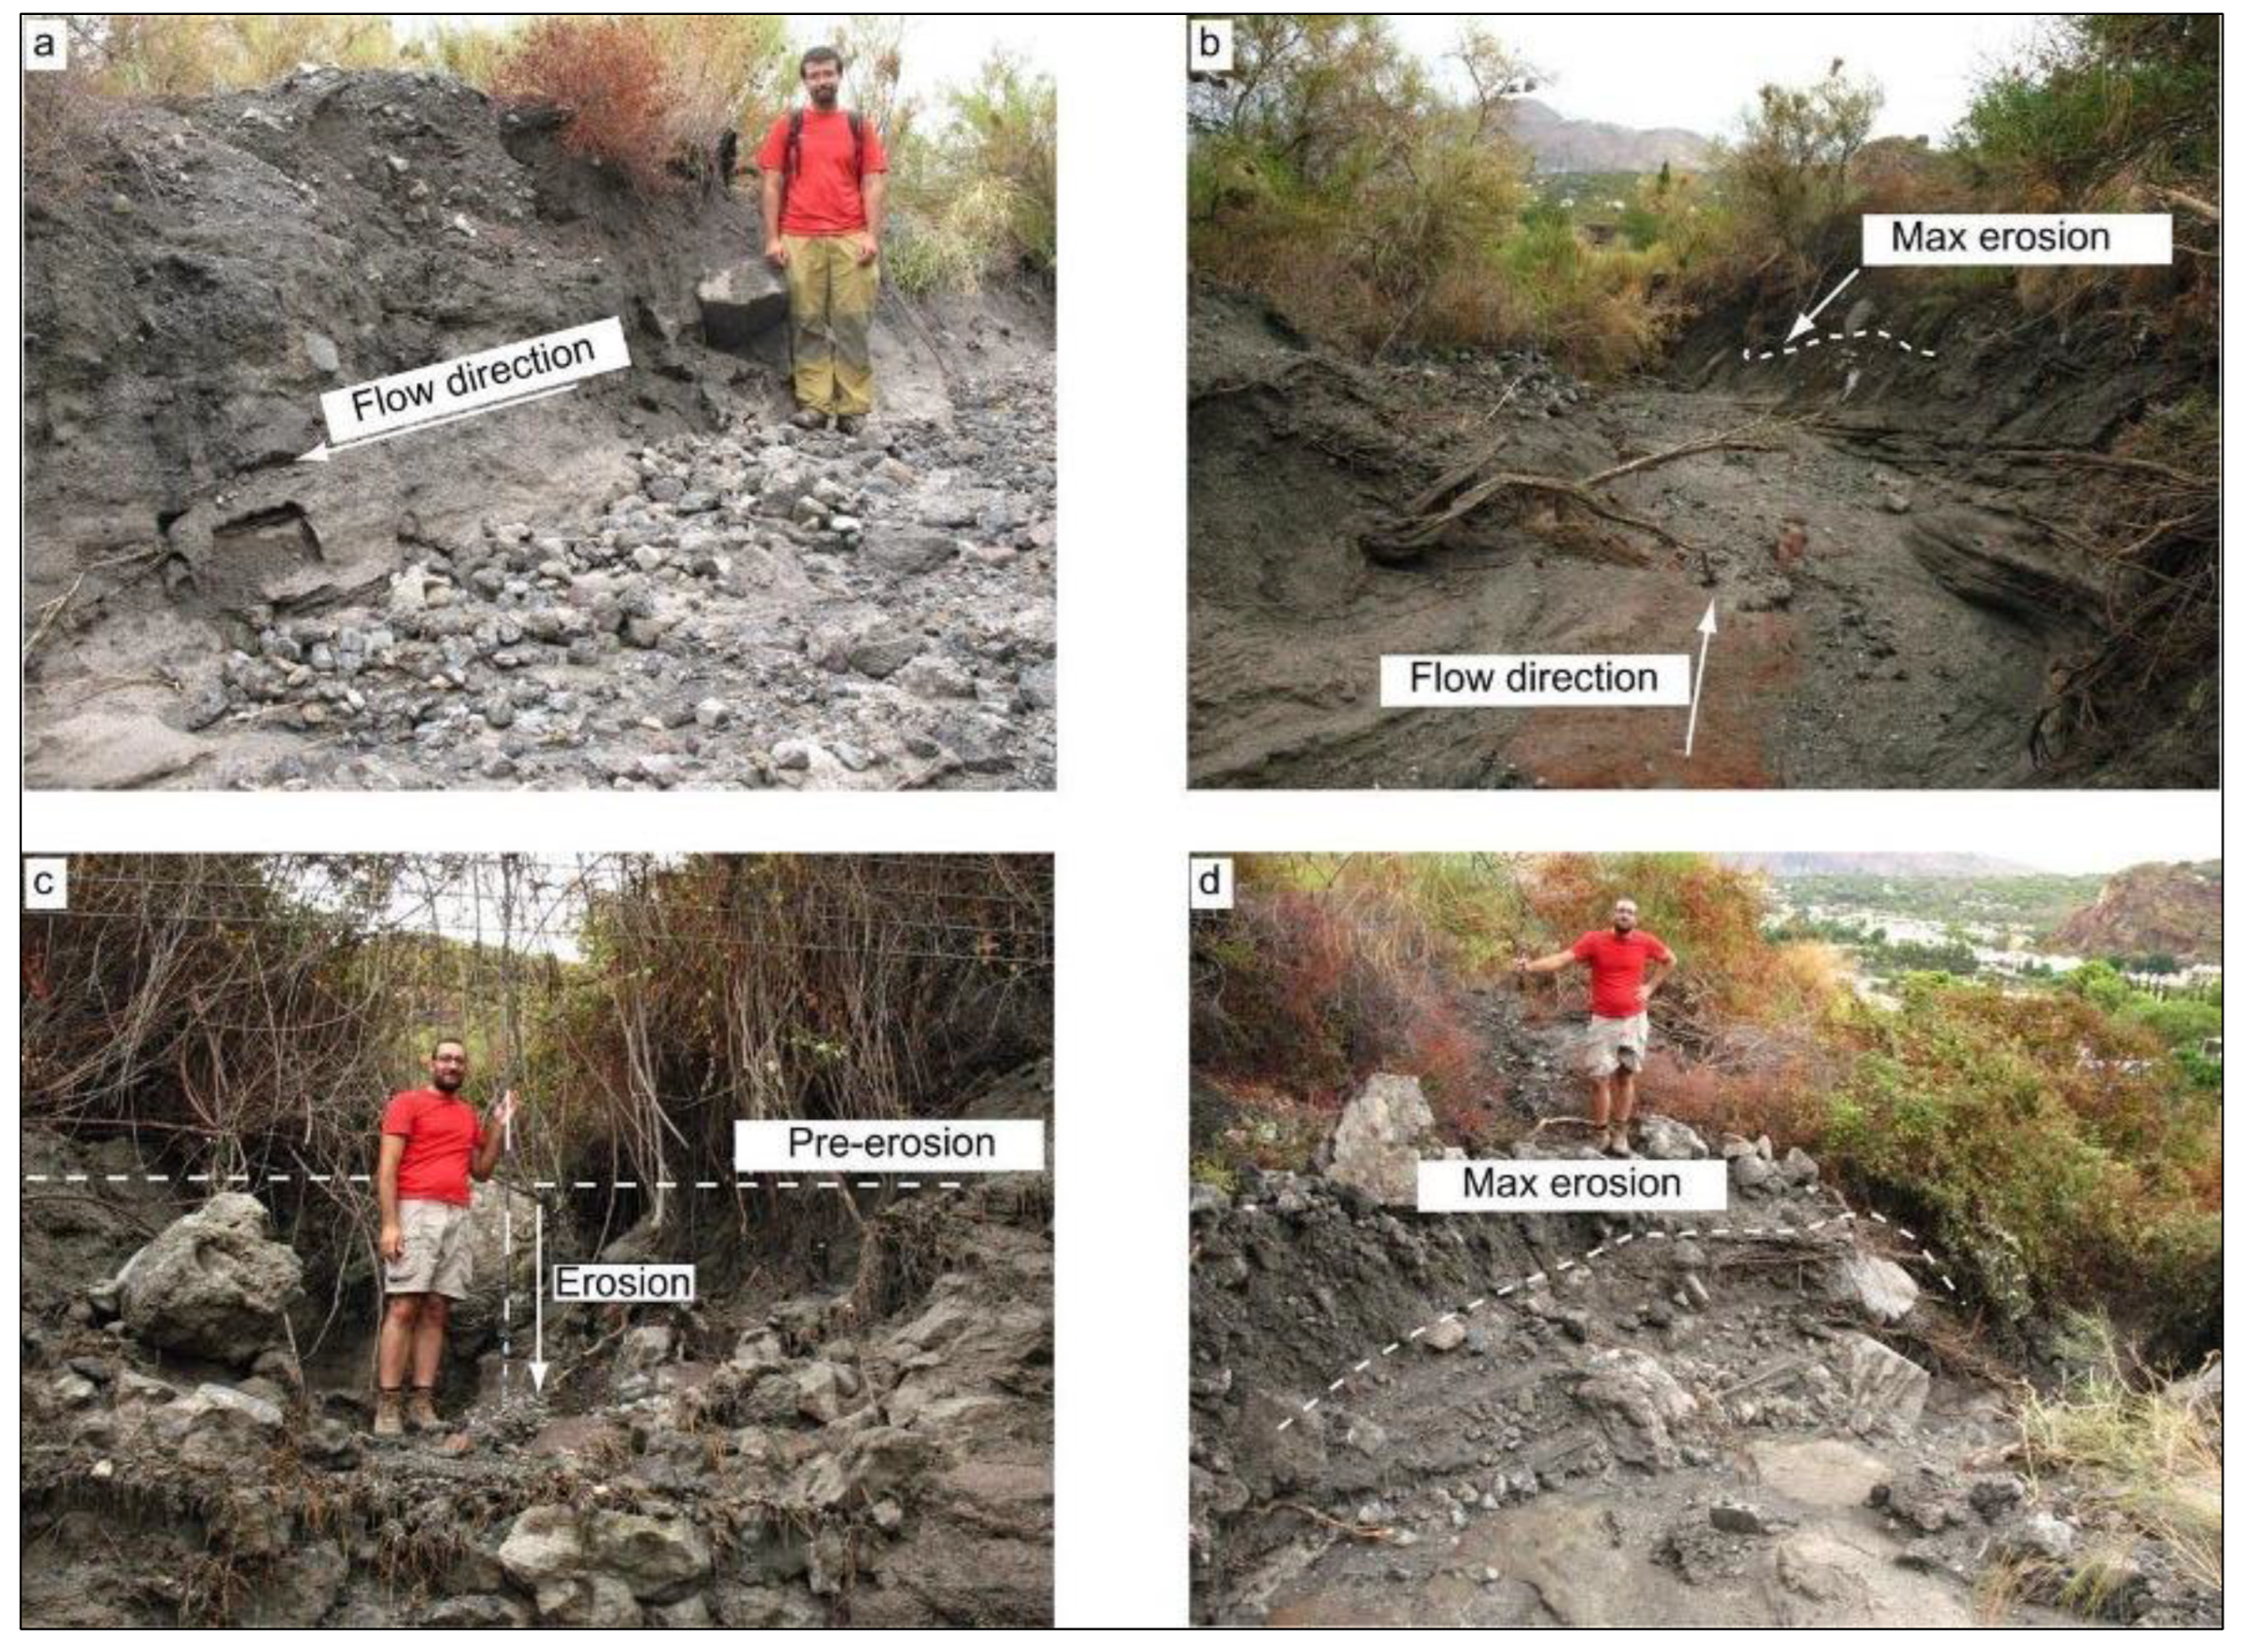
  • The characteristics of the material, which, therefore, depend on the stratigraphic and sedimentological architecture (in this case, coarse-grained permeable ash layers covering a fine-grained impermeable ash layer) are a very important factor for erosive phenomena;
  • Land use is fundamental for both erosion and runoff/flooding phenomena. In this case, the presence of areas with vegetation vs artificial areas determines the flow of water and, therefore, the erosive and flooding capacity;
  • By reproducing the phenomena observed during erosion/flooding events or the long-term erosion effects, what has already been seen from other studies is confirmed; the method proposed here is valid for the definition of accelerated erosion and /or flooding scenarios, even in volcanic and small areas.

Supplementary Materials

The following are available online at https://www.mdpi.com/article/10.3390/su142416549/s1, Figure S1: Computational domain for the erosion simulation on the northern flank of the volcano cone. Figure S2: Soil type distribution. Areas in red, marked by the label “rock”, also delimit the less erodible areas of the computing domain. Figure S3: Computational domain for the hydraulic simulations of floods scenarios..

Author Contributions

Conceptualization, R.B., F.D.T. and A.T.; methodology, R.B. and A.T.; software, R.B.; validation, F.D.T. and P.M.; formal analysis, R.B., A.T. and A.G.; data curation, R.B., A.T., A.F. and M.F.; writing—original draft preparation, R.B., F.D.T. and A.T.; writing—review and editing, P.M., A.F., M.F. and A.G.; project administration, A.F. and F.D.T.; funding acquisition, A.F. and F.D.T. All authors have read and agreed to the published version of the manuscript.

Funding

This project was partially funded by the “Fondi di Ateneo 2022 (ex 60%)” by the Università degli Studi di Firenze (project “VOLFLANK—Use of remote sensing data for the stability analysis of active volcanoes”; P.I.: F.D.T.). A.F. and M.F. carried out this work in the frame of INGV Progetti Ricerca Libera 2022 (project “VOLF—VOlcaniclastic debris flows at La Fossa cone (Volcano Island): evolution and hazard implication”).

Institutional Review Board Statement

Not applicable.

Informed Consent Statement

Not applicable.

Data Availability Statement

Not applicable.

Acknowledgments

F.D.T. is very grateful to Corrado Cimarelli for his support during the survey conducted in Vulcano during the 14 September 2008 event.

Conflicts of Interest

The authors declare no conflict of interest.

References

  1. Pierson, T.C.; Scott, K.M. Downstream dilution of a lahar: Transition from debris flow to hyperconcentrated streamflow. Water Resour. Res. 1985, 21, 1511–1524. [Google Scholar] [CrossRef]
  2. Bisson, M.; Pareschi, M.T.; Zanchetta, G.; Sulpizio, R.; Santacroce, R. Volcaniclastic debris-flow occurrences in the Campania region (Southern Italy) and their relation to Holocene–Late Pleistocene pyroclastic fall deposits: Implications for large-scale hazard mapping. Bull. Volcanol. 2007, 70, 157–167. [Google Scholar] [CrossRef] [Green Version]
  3. Pierson, T.C.; Major, J.J. Hydrogeomorphic effects of explosive volcanic eruptions on drainage basins. Ann. Rev. Earth Planet Sci. 2014, 42, 469–507. [Google Scholar] [CrossRef]
  4. Lavigne, F.; Thouret, J.-C. Sediment transportation and deposition by rain-triggered lahars at Merapi Volcano, Central Java, Indonesia. Geomorphology 2003, 49, 45–69. [Google Scholar] [CrossRef]
  5. Gran, K.B.; Montgomery, D.R. Spatial and temporal patterns in fluvial recovery following volcanic eruptions: Channel response to basin-wide sediment loading at Mount Pinatubo, Philippines. Geol. Soc. Am. Bull. 2005, 117, 195–211. [Google Scholar] [CrossRef] [Green Version]
  6. Major, J.J.; Mark, L.E. Peak flow responses to landscape disturbances caused by the cataclysmic 1980 eruption of Mount St. Helens, Washington. Geol. Soc. Am. Bull. 2006, 118, 938–958. [Google Scholar] [CrossRef]
  7. Kassouk, Z.; Thouret, J.-C.; Gupta, A.; Solikhin, A.; Liew, S.C. Object-oriented classification of a high-spatial resolution SPOT5 image for mapping geology and landforms of active volcanoes: Semeru case study, Indonesia. Geomorphology 2014, 221, 18–33. [Google Scholar] [CrossRef]
  8. Thouret, J.-C.; Antoine, S.; Magill, C.; Ollier, C. Lahars and debris flows: Characteristics and impacts. Earth-Sci. Rev. 2020, 201, 103003. [Google Scholar] [CrossRef]
  9. White, J.D.L.; Houghton, B.F.; Hodgson, K.A.; Wilson, C.J.N. Delayed sedimentary response to the AD 1886 eruption of Tarawera, New Zealand. Geology 1997, 25, 459–462. [Google Scholar] [CrossRef]
  10. Jones, R.; Thomas, R.E.; Peakall, J.; Manville, V. Rainfall-runoff properties of tephra: Simulated effects of grain-size and antecedent rainfall. Geomorphology 2017, 282, 39–51. [Google Scholar] [CrossRef]
  11. Di Traglia, F. Hydrogeomorphic and sedimentary response to the Late Pleistocene violent Strombolian eruption of the Croscat volcano (Garrotxa Volcanic Field, Spain). Med. Geosci. Rev. 2020, 2, 217–231. [Google Scholar] [CrossRef]
  12. Major, J.J. Subaerial volcaniclastic deposits-influences of initiation mechanisms and transport behavior on characteristics and distributions. Geol. Soc. Lond. Sp. Pub. 2022, 520, 142. [Google Scholar]
  13. Bladé, E.; Cea, L.; Corestein, G.; Escolano, E.; Puertas, J.; Vázquez-Cendón, J.; Dolz, J.; Coll, A. IBER: Herramienta de simulación numérica de flujo en ríos. Rev. Int. Métodos Numéricos Cálculo Disen. Ing. 2014, 30, 1–10. [Google Scholar]
  14. Ferrucci, M.; Pertusati, S.; Sulpizio, R.; Zanchetta, G.; Pareschi, M.; Santacroce, R. Volcaniclastic debris flows at La Fossa Volcano (Vulcano Island, southern Italy): Insights for erosion behaviour of loose pyroclastic material on steep slopes. J. Volcanol. Geotherm. Res. 2005, 145, 173–191. [Google Scholar] [CrossRef]
  15. Di Trapani, F.P.; Di Maggio, C.; Madonia, P. The role of volcanic and anthropogenic activities in controlling the erosional processes at Vulcano Island (Italy). Geogr. Fis. Din. Quat. 2011, 34, 89–94. [Google Scholar]
  16. Madonia, P.; Cangemi, M.; Olivares, L.; Oliveri, Y.; Speziale, S.; Tommasi, P. Shallow landslide generation at La Fossa cone, Vulcano island (Italy): A multidisciplinary perspective. Landslides 2019, 16, 921–935. [Google Scholar] [CrossRef]
  17. Di Traglia, F.; Pistolesi, M.; Rosi, M.; Bonadonna, C.; Fusillo, R.; Roverato, M. Growth and erosion: The volcanic geology and morphological evolution of La Fossa (Island of Vulcano, Southern Italy) in the last 1000 years. Geomorphology 2013, 194, 94–107. [Google Scholar] [CrossRef]
  18. Keller, J. The Island of Vulcano. Rend. Soc. Ital. Mineral. Petrol. 1980, 36, 369–414. [Google Scholar]
  19. Frazzetta, G.; Gillot, P.Y.; La Volpe, L.; Sheridan, M.F. Volcanic hazards at Fossa of Vulcano: Data from the last 6000 years. Bull. Volcanol. 1984, 47, 105–124. [Google Scholar] [CrossRef]
  20. Mercalli, G.; Silvestri, O. Le eruzioni dell’Isola di Vulcano incominciate il 3 agosto 1888 e terminate il 22 marzo 1890, relazione scientifica. Ann. Uff. Cent. Metereol. Geodin. Ital. 1891, 10, 1–213. (In Italian) [Google Scholar]
  21. Clarke, A.B.; Esposti Ongaro, T.; Belousov, A. Vulcanian eruptions. In The Encyclopedia of Volcanoes, 3rd ed.; Academic Press: Cambridge, MA, USA, 2015; pp. 505–518. [Google Scholar]
  22. Tommasi, P.; Graziani, A.; Rotonda, T.; Bevivino, C. Preliminary analysis of instability phenomena at Vulcano Island, Italy. In Volcanic Rocks; Malheiro, A.M., Nunes, J.C., Eds.; Taylor & Francis Group: London, UK, 2019. [Google Scholar]
  23. Bonaccorso, A.; Bonforte, A.; Gambino, S. Thermal expansion-contraction and slope instability of a fumarole field inferred from geodetic measurements at Vulcano. Bull. Volcanol. 2010, 72, 791–801. [Google Scholar] [CrossRef]
  24. Revil, A.; Johnson, T.C.; Finizola, A. Three-dimensional resistivity tomography of Vulcan’s forge, Vulcano Island, southern Italy. Geophys. Res. Lett. 2010, 37, 43983. [Google Scholar] [CrossRef] [Green Version]
  25. Malaguti, A.B.; Rosi, M.; Pistolesi, M.; Speranza, F.; Menzies, M. The contribution of palaeomagnetism, tephrochronology and radiocarbon dating to refine the last 1100 years of eruptive activity at Vulcano (Italy). Bull. Volcanol. 2022, 84, 12. [Google Scholar] [CrossRef]
  26. Dellino, P.; De Astis, G.; La Volpe, L.; Mele, D.; Sulpizio, R. Quantitative hazard assessment of phreatomagmatic eruptions at Vulcano (Aeolian Islands, Southern Italy) as obtained by combining stratigraphy, event statistics and physical modelling. J. Volcanol. Geotherm. Res. 2011, 201, 364–384. [Google Scholar] [CrossRef]
  27. De Fiore, O. Vulcano (Isole Eolie); Supplemento III alla Rivista Vulcanologica di Immanuel Friedlaender; Cozzolin: Napoli, Italy, 1922. (In Italian) [Google Scholar]
  28. Arrighi, S.; Tanguy, J.C.; Rosi, M. Eruptions of the last 2200 years at Vulcano and Vulcanello (Aeolian Islands, Italy) dated by high-accuracy archeomagnetism. Phys. Earth Planet Inter. 2006, 159, 225–233. [Google Scholar] [CrossRef]
  29. Fusillo, R.; Di Traglia, F.; Gioncada, A.; Pistolesi, M.; Wallace, P.J.; Rosi, M. Deciphering post-caldera volcanism: Insight into the Vulcanello (Island of Vulcano, Southern Italy) eruptive activity based on geological and petrological constraints. Bull. Volcanol. 2015, 77, 76. [Google Scholar] [CrossRef]
  30. Manni, M.; Rosi, M. Origins of Vulcanello based on the re-examination of historical sources (Vulcano, Aeolian Islands). Ann. Geophys. 2021, 64, VO548. [Google Scholar]
  31. De Astis, G.; Lucchi, F.; Dellino, P.; La Volpe, L.; Tranne, C.A.; Frezzotti, M.L.; Peccerillo, A. Geology, volcanic history and petrology of Vulcano (central Aeolian archipelago). Geol. Soc. London Mem. 2013, 37, 281–349. [Google Scholar] [CrossRef]
  32. Rosi, M.; Di Traglia, F.; Pistolesi, M.; Esposti Ongaro, T.; Bonadonna, C. Dynamics of shallow hydrothermal eruptions: New insights from Vulcano’s Breccia di Commenda eruption. Bull. Volcanol. 2018, 80, 83. [Google Scholar] [CrossRef]
  33. Pistolesi, M.; Rosi, M.; Malaguti, A.B.; Lucchi, F.; Tranne, C.A.; Speranza, F.; Albert, P.G.; Smith, V.C.; Di Roberto, A.; Billotta, E. Chrono-stratigraphy of the youngest (last 1500 years) rhyolitic eruptions of Lipari (Aeolian Islands, Southern Italy) and implications for distal tephra correlations. J. Volcanol. Geotherm. Res. 2021, 420, 107397. [Google Scholar] [CrossRef]
  34. Capaccioni, B.; Coniglio, S. Varicolored and vesiculated tuffs from La Fossa volcano, Vulcano Island (Aeolian Archipelago, Italy): Evidence of syndepositional alteration processes. Bull. Volcanol. 1995, 57, 61–70. [Google Scholar] [CrossRef]
  35. Baumann, V.; Bonadonna, C.; Cuomo, S.; Moscariello, M.; Biass, S.; Pistolesi, M.; Gattuso, A. Mapping the susceptibility of rain-triggered lahars at Vulcano island (Italy) combining field characterization, geotechnical analysis, and numerical modelling. Nat. Hazards Earth Syst. Sci. 2019, 19, 2421–2449. [Google Scholar] [CrossRef] [Green Version]
  36. Gattuso, A.; Bonadonna, C.; Frischknecht, C.; Cuomo, S.; Baumann, V.; Pistolesi, M.; Biass, S.; Arrowsmith, J.R.; Moscariello, M.; Rosi, M. Lahar risk assessment from source identification to potential impact analysis: The case of Vulcano Island, Italy. J. App. Volcanol. 2021, 10, 9. [Google Scholar] [CrossRef]
  37. Biass, S.; Bonadonna, C.; Di Traglia, F.; Pistolesi, M.; Rosi, M.; Lestuzzi, P. Probabilistic evaluation of the physical impact of future tephra fallout events for the Island of Vulcano, Italy. Bull. Volcanol. 2016, 78, 37. [Google Scholar] [CrossRef] [Green Version]
  38. Madonia, P.; Liotta, M. Chemical composition of precipitation at Mt. Vesuvius and Vulcano Island, Italy: Volcanological and environmental implications. Environ. Earth Sci. 2010, 61, 159–171. [Google Scholar] [CrossRef]
  39. Arnone, E.; Pumo, D.; Viola, F.; Noto, I.V.; La Loggia, G. Rainfall statistics changes in Sicily. Hydrol. Earth Syst. Sci. 2013, 17, 2449–2458. [Google Scholar] [CrossRef]
  40. Agrometeorological Information Service of Sicily (SIAS). Available online: http://www.sias.regione.sicilia.it (accessed on 13 October 2022).
  41. Bagnardi, M.; González, P.J.; Hooper, A. High-resolution digital elevation model from tri-stereo Pleiades-1 satellite imagery for lava flow volume estimates at Fogo Volcano. Geophys. Res. Lett. 2016, 43, 6267–6275. [Google Scholar] [CrossRef] [Green Version]
  42. SCS. Section 4: Hydrology. In National Engineering Handbook; Soil Conservation Service, USDA: Washington, DC, USA, 1956. [Google Scholar]
  43. Soulis, K.X. Soil Conservation Service Curve Number (SCS-CN) Method: Current Applications, Remaining Challenges, and Future Perspectives. Water 2021, 13, 192. [Google Scholar] [CrossRef]
  44. Cunha, Z.A.D.; Beskow, S.; Moura, M.M.D.; Beskow, T.L.C.; Mello, C.R.D. Adequacy of methodologies for determining SCS/CN in a watershed with characteristics of the Pampa biome. Rev. Ambiente Água 2021, 16, e2715. [Google Scholar] [CrossRef]
  45. Romero, P.; Castro, G.; Gòmez, J.A.; Fereres, E. Curve number values for olive orchards under different soil management. Soil Sci. Soc. Am. J. 2007, 71, 1758–1769. [Google Scholar] [CrossRef]
  46. Lewis, M.J.; Singer, M.J.; Tate, K.W. Applicability of SCS curve number method for a California Oak Woodlands Watershed. J. Soil Water Conserv. 2000, 55, 226–230. [Google Scholar]
  47. Soulis, K.X.; Valiantzas, J.D. SCS-CN parameter determination using rainfall-runoff data in heterogeneous watersheds—The two-CN system approach. Hydrol. Earth Syst. Sci. 2012, 16, 1001–1015. [Google Scholar] [CrossRef] [Green Version]
  48. Hoesein, A.A.; Pilgrim, D.H.; Titmarsh, G.W.; Cordery, I. Assessment of the US Conservation Service method for estimating design floods. In New Directions for Surface Water Modeling; IAHS International Commission on Surface Water: Bochum, Germany, 1989. [Google Scholar]
  49. Pilgrim, D.H.; Cordery, I. Flood runoff. In Handbook of Hydrology; Maidment, D.R., Ed.; McGraw-Hill: New York, NY, USA, 1992. [Google Scholar]
  50. USDA-SCS. National Engineering Handbook, Section 4: Hydrology; Soil Conservation Service, Department of Agriculture: Washington, DC, USA, 1972; p. 762.
  51. Bladé, E.; Cea, L.; Corestein, G. Modelización numérica de inundaciones fluviales. Ing. Agua 2014, 18, 68. [Google Scholar]
  52. Fraga, I.; Cea, L.; Puertas, J. Effect of rainfall uncertainty on the performance of physically based rainfall–runoff models. Hydrol. Process. 2018, 33, 160–173. [Google Scholar] [CrossRef] [Green Version]
  53. Cea, L.; French, J.R. Bathymetric error estimation for calibration and validation of estuarine hydrodynamic models. Estuar. Coast Shelf Sci. 2012, 100, 3317–3339. [Google Scholar] [CrossRef]
  54. Cea, L.; Bladé, E.; Coristein, G.; Fraga, I.; Espinal, M.; Puertas, J. Comparative analysis of several sediment transport formulations applied to dam-break flows over erodible beds. In Proceedings of the EGU General Assembly 2014, Vienna, Austria, 27 April–2 May 2014. [Google Scholar]
  55. Areu-Rangel, O.S.; Bonasia, R.; Di Traglia, F.; Del Soldato, M.; Casagli, N. Flood Susceptibility and Sediment Transport Analysis of Stromboli Island after the 3 July 2019 Paroxysmal Explosion. Sustainability 2020, 12, 3268. [Google Scholar] [CrossRef] [Green Version]
  56. Turchi, A.; Di Traglia, F.; Luti, T.; Olori, D.; Zetti, I.; Fanti, R. Environmental aftermath of the 2019 Stromboli eruption. Remote Sens. 2020, 12, 994. [Google Scholar] [CrossRef] [Green Version]
  57. Inguaggiato, S.; Vita, F.; Diliberto, I.S.; Mazot, A.; Calderone, L.; Mastrolia, A.; Corrao, M. The extensive parameters as a tool to monitoring the volcanic activity: The case study of Vulcano Island (Italy). Remote Sens. 2022, 14, 1283. [Google Scholar] [CrossRef]
  58. Meyer-Peter, E.; Müller, R. Formulas for bedload transport. In Proceedings of the 2nd Congress IAHR, Stockholm, Sweden, 7–9 June 1948; pp. 39–64. [Google Scholar]
  59. Wong, M. Does the Bedload Equation of Meyer-Peter and Müller Fit Its Own Data; International Association of Hydraulic Research: Thessaloniki, Greece, 2003; pp. 73–80. [Google Scholar]
  60. Wong, M.; Parker, G. Reanalysis and Correction of Bed-Load Relation of Meyer-Peter and Müller Using Their Own Database. J. Hydraul. Eng. 2006, 132, 1159–1168. [Google Scholar] [CrossRef] [Green Version]
  61. Bonasia, R.; Areu-Rangel, O.S.; Tolentino, D.; Mendoza-Sanchez, I.; González-Cao, J.; Klapp, J. Flooding hazard assessment at Tulancingo (Hidalgo, Mexico). J. Flood Risk Manag. 2018, 11, S1116–S1124. [Google Scholar] [CrossRef] [Green Version]
  62. Ministry of Environment and Protection of Land and Sea (MATTM). Available online: http://www.pcn.minambiente.it/mattm/progetto-pst-dati-lidar/ (accessed on 13 October 2022).
  63. Mukundan, R.; Radcliffe, D.E.; Ritchie, J.C.; Risse, L.M.; McKinley, R.A. Sediment fingerprinting to determine the source of suspended sediment in a southern piedmont stream. J. Environ. Qual. 2010, 39, 1328. [Google Scholar] [CrossRef] [PubMed] [Green Version]
  64. Mukundan, R.B.; Radcliffe, D.; Risse, L. Spatial resolution of soil data and channel erosion effects on swat model predictions of flow and sediment. J. Soil Water Conserv. 2010, 65, 92–104. [Google Scholar] [CrossRef] [Green Version]
  65. Wainwright, J.; Parsons, A.J.; Müller, E.N.; Brazier, R.E.; Powell, D.M.; Fenti, B. A transport-distance approach to scaling erosion rates: 1. Background and model development. Earth Surf. Process. Landforms 2008, 33, 813–826. [Google Scholar] [CrossRef]
  66. Merritt, W.; Letcher, R.; Jakeman, A. A review of erosion and sediment transport models. Environ. Model. Softw. 2003, 18, 761–799. [Google Scholar] [CrossRef]
  67. Cea, L.; Legout, C.; Grangeon, T.; Nord, G. Impact of model simplifications on soil erosion predictions: Application of the GLUE methodology to a distributed event-based model at the hillslope scale. Hydrol. Process 2016, 30, 1096–1113. [Google Scholar] [CrossRef]
  68. Fraga, I.; Cea, L.; Puertas, J. Experimental study of the water depth and rainfall intensity effects on the bed roughness coefficient used in distributed urban drainage models. J. Hydrol. 2013, 505, 266–275. [Google Scholar] [CrossRef]
Figure 1. Orthophotograph superimposed on the shadow model of the Island of Vulcano (data derived from PLÉIADES-1 constellation). The main geographic and geological features of the island are reported. In the inset, the location of the Island of Vulcano is reported, as well as the main geographic feature cited in the text.
Sustainability 14 16549 g001
Figure 2. Litho-technical map of the northern side of the Island of Vulcano. Lithology description and boundaries are derived from the geological map of De Astis et al. [31], Di Traglia et al. [17], and Fusillo et al. [29], while litho-technical characterization is derived from Madonia et al. [16] and Tommasi et al. [22].
Sustainability 14 16549 g002
Figure 3. Flow chart of the adopted method.
Sustainability 14 16549 g003
Figure 4. Maximum annual values of rainfall intensity.
Sustainability 14 16549 g004
Figure 5. Rainfall intensity distribution on 14 September 2008.
Sustainability 14 16549 g005
Figure 6. Land use in 2021 of the northern part of the Island of Vulcano: (a) a view of artificial areas in Vulcano Porto from the summit of La Fossa cone; (b) a detail of recent buildings and roads in Vulcano Porto; (c) a view of wooded, semi-natural vegetated and semi-natural not vegetate areas of La Fossa cone from the Vulcano Porto-Il Piano road; (d) a detail of areas with herbaceous and shrubby vegetation in Palizzi Valley.
Sustainability 14 16549 g006
Figure 7. 2021 land use map of the northern part of the Island of Vulcano.
Sustainability 14 16549 g007
Figure 8. Evidence of erosion in the NW sector of the La Fossa cone during the 14 September 2008 event. The location is indicated by a black box in Figure 10. (ad) are in increasing elevation. In (c) it is possible to see the erosion under the rockfall net positioned inside the channel.
Sustainability 14 16549 g008
Figure 9. Effects of the 14 September 2008 event: (ac) are located at the base of the cone, whereas (d) is located on the Vulcano Porto wharf.
Sustainability 14 16549 g009
Figure 10. Map of the simulated erosion, considering an event characterised by the same rainfall which occurred on the 14 September 2008 on the Island of Vulcano. Stronger erosion characterised the main channel in the area. The rectangle shows the area of Figure 8, where the greatest erosion was observed during the field survey carried out a few hours after the event. The subdivision into classes derives from the standard deviation of the data (σ = 0.05 m).
Sustainability 14 16549 g010
Figure 11. Erosion maps for the (a) moderate and (b) heavy-torrential rainfall scenarios.
Sustainability 14 16549 g011
Figure 12. Inundation maps for the (a) moderate and (b) heavy-torrential rainfall scenarios.
Sustainability 14 16549 g012
Figure 13. Erosional features in the mixed natural/anthropic environment of La Fossa cone (see main text for the explanation of the panels). (a) sector of the La Fossa cone where most of the accelerated erosion phenomena of the slope occur; (b) rill erosion on the ascent path to the crater, to the detriment of the more erodible deposits (deposits referable to the Great Crater Eruptive Cluster [17]); (c) rill erosion on less erodible deposits (Varicoloured Ash); (d) gully erosion on less erodible deposits (Varicoloured Ash); (eg) damage to the water management systems on the side of the La Fossa cone.
Sustainability 14 16549 g013
Table 1. Numerical and sediment parameters for sediment transport simulations.
ParameterValue
Maximum simulation time (s)86,400
Numerical schemeFirst order
Courant–Friedrichs–Lewy number0.45
Wet–dry limit0.01 m
Grain diameter d50 (m)0.002
Friction angle40°
Bed porosity0.47
Table 2. Summary of the 2021 land use of the northern part of the Island of Vulcano.
Land UseArea (ha)%
Artificial areasBuildings29.71.4
Public and private
adjacent areas
105.35.1
Roads56.42.7
Agricultural areasArable crops22.11.1
Agricultural woody crops49.92.4
Heterogeneous
agricultural areas
3.80.2
Permanent lawns41.22.0
Wooded and semi-natural, vegetated areasWoods208.910.0
Areas with herbaceous and shrubby vegetation843.940.5
Semi-natural, not vegetated areasAreas with poor or
absent vegetation
719.834.6
Wet areasWetlands0.50.0
Total areas2081.6100
Publisher’s Note: MDPI stays neutral with regard to jurisdictional claims in published maps and institutional affiliations.

