
Growth Mechanism and Synchronization Effect of China’s New Energy Vehicle Enterprises: An Empirical Analysis Based on Moving Logistic and Kuramoto Model


Abstract
:1. Introduction
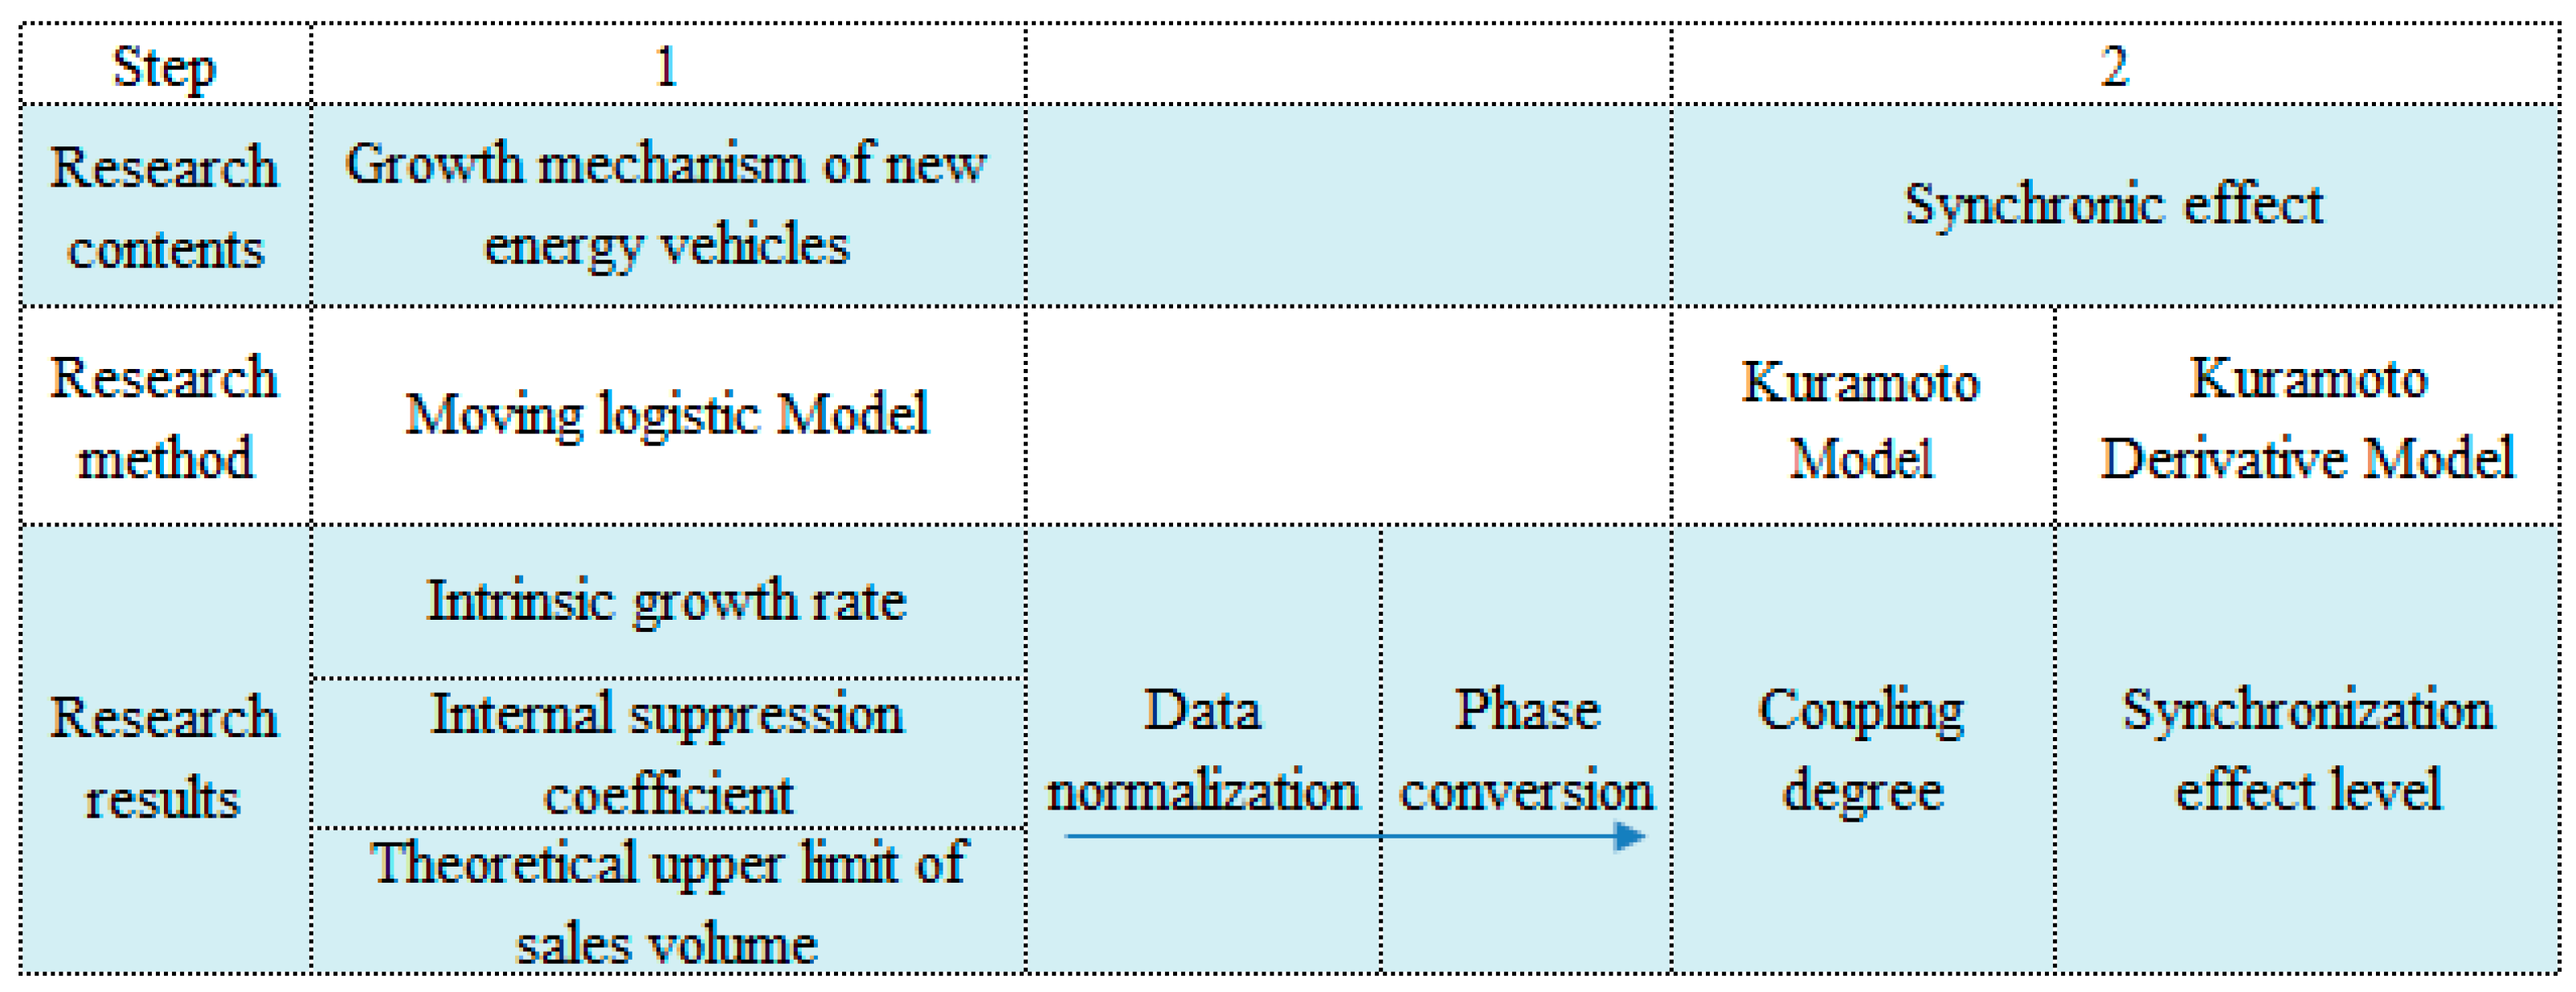
2. Methods and Data
2.1. Ecological System View
2.2. Population Dynamics
2.3. Synchronous Effect Model
3. Empirical Analysis
- (1)
- Moving logistic regression model results of sample enterprises
- (2)
- Synchronization Effect Coupling value
- (3)
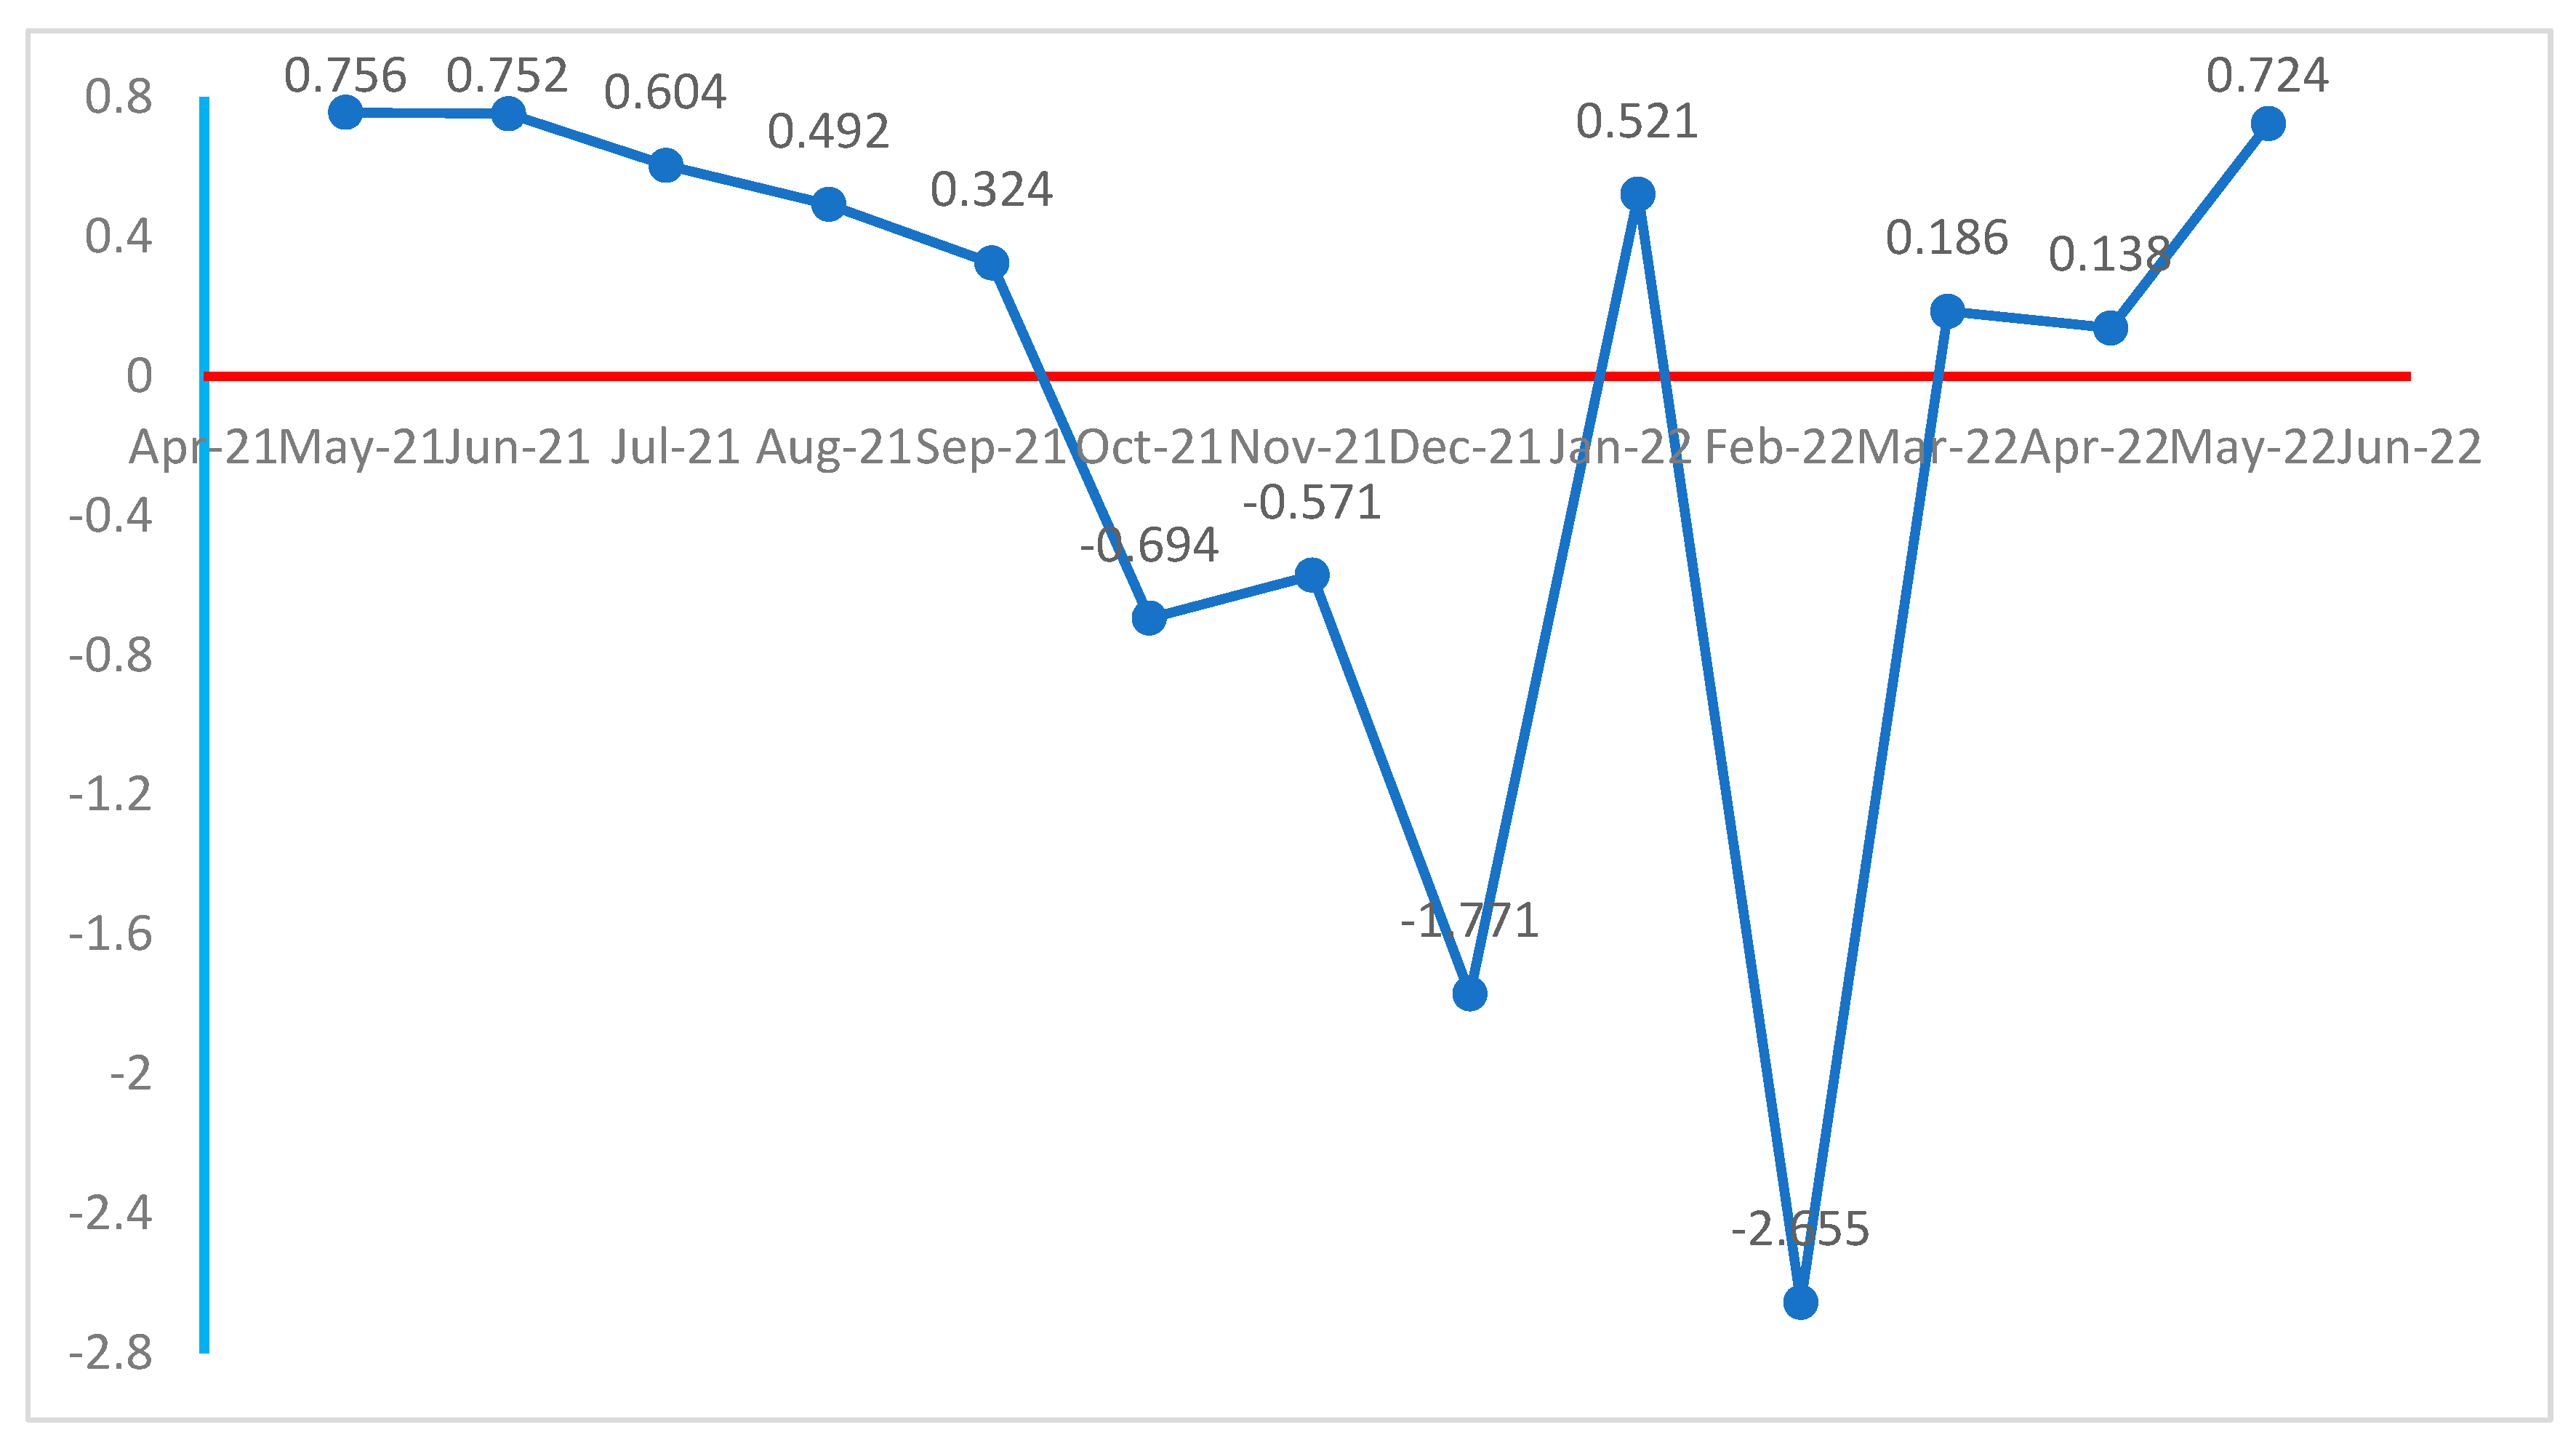
- Calculation of the R value of the population synchronization effect
- (4)
- Robustness test of the logistic regression model
4. Results and Discussion
4.1. Results
4.2. Discussion
4.3. Management Inspiration
4.4. Limitations and Future Research
5. Conclusions
Author Contributions
Funding
Institutional Review Board Statement
Informed Consent Statement
Data Availability Statement
Conflicts of Interest
References
- Kendall, M. Fuel cell development for New Energy Vehicles (NEVs) and clean air in China. Prog. Nat. Sci. Mater. Int. 2018, 28, 113–120. [Google Scholar] [CrossRef]
- Tang, B.W.; Tang, J.; Liu, Y.L.; Zeng, F.P. Comprehensive Evaluation and Application of GIS Insulation Condition Part 1: Selection and Optimization of Insulation Condition Comprehensive Evaluation Index Based on Multi-Source Information Fusion. IEEE Access 2019, 7, 88254–88263. [Google Scholar] [CrossRef]
- Ma, Y.; Shi, T.Y.; Zhang, W.; Hao, Y.; Huang, J.B.; Lin, Y.A. Comprehensive policy evaluation of NEV development in China, Japan, the United States, and Germany based on the AHP-EW model. J. Clean. Prod. 2019, 214, 389–402. [Google Scholar] [CrossRef]
- Qiu, S.; Wang, W.; Wang, K.C.P. A comprehensive system for AASHTO PP67-10 based asphalt surfaced pavement cracking evaluation. Can. J. Civ. Eng. 2016, 43, 260–269. [Google Scholar] [CrossRef]
- Ren, J.Z. New energy vehicle in China for sustainable development: Analysis of success factors and strategic implications. Transp. Res. Part D 2018, 59, 268–288. [Google Scholar] [CrossRef]
- Huang, P.; Li, P. Politics of urban energy transitions: New energy vehicle (NEV) development in Shenzhen, China. Environ. Politics 2020, 29, 524–545. [Google Scholar] [CrossRef]
- Liu, L.J.; Zhang, T.; Avrin, A.P.; Wang, X.W. Is China’s industrial policy effective? An empirical study of the new energy vehicles industry. Technol. Soc. 2020, 63, 101356. [Google Scholar] [CrossRef]
- Dillman, K.J.; Arnadottir, A.; Heinonen, J.; Czepkiewicz, M.; Daviosdottir, B. Review and Meta-Analysis of EVs: Embodied Emissions and Environmental Breakeven. Sustainability 2020, 12, 9390. [Google Scholar] [CrossRef]
- Onat, N.C.; Aboushaqrah, N.N.M.; Kucukvar, M.; Tarlochan, F.; Hamouda, A.M. From sustainability assessment to sustainability management for policy development: The case for electric vehicles. Energy Conv. Manag. 2020, 216, 16. [Google Scholar]
- Ahmadi, P. Environmental impacts and behavioral drivers of deep decarbonization for transportation through electric vehicles. J. Clean. Prod. 2019, 225, 1209–1219. [Google Scholar] [CrossRef]
- Dranka, G.G.; Ferreira, P. Electric Vehicles and Biofuels Synergies in the Brazilian Energy System. Energies 2020, 13, 4423. [Google Scholar] [CrossRef]
- Gan, Y.; Lu, Z.; He, X.; Hao, C.; Wang, Y.; Cai, H.; Wang, M.; Elgowainy, A.; Przesmitzki, S.; Bouchard, J. Provincial Greenhouse Gas Emissions of Gasoline and Plug-in Electric Vehicles in China: Comparison from the Consumption-Based Electricity Perspective. Environ. Sci. Technol. 2021, 55, 6944–6956. [Google Scholar] [CrossRef] [PubMed]
- Hou, F.; Chen, X.; Chen, X.; Yang, F.; Ma, Z.; Zhang, S.; Liu, C.; Zhao, Y.; Guo, F. Comprehensive analysis method of determining global long-term GHG mitigation potential of passenger battery electric vehicles. J. Clean Prod. 2021, 289, 125137. [Google Scholar] [CrossRef]
- Petrovic, D.T.; Pesic, D.R.; Petrovic, M.M.; Mijailovic, R.M. ELECTRIC CARS Are They Solution to Reduce CO2 Emission? Therm. Sci. 2020, 24, 2879–2889. [Google Scholar] [CrossRef] [Green Version]
- Wang, D.; Li, Y.M. Measuring the Policy Effectiveness of China’s New-Energy Vehicle Industry and Its Differential Impact on Supply and Demand Markets. Sustainability 2022, 14, 8215. [Google Scholar] [CrossRef]
- Trencher, G.; Edianto, A. Drivers and Barriers to the Adoption of Fuel Cell Passenger Vehicles and Buses in Germany. Energies 2021, 14, 833. [Google Scholar] [CrossRef]
- Lashari, Z.; Ko, J.; Jang, J. Consumers’ Intention to Purchase Electric Vehicles: Influences of User Attitude and Perception. Sustainability 2021, 13, 6778. [Google Scholar] [CrossRef]
- Tan, R.P.; Lin, B.Q. Are people willing to support the construction of charging facilities in China? Energy Policy 2020, 143, 111604. [Google Scholar] [CrossRef]
- Jahangir, H.; Gougheri, S.S.; Vatandoust, B.; Golkar, M.A.; Golkar, M.A.; Ahmadian, A.; Hajizadeh, A. A Novel Cross-Case Electric Vehicle Demand Modeling Based on 3D Convolutional Generative Adversarial Networks. IEEE Trans. Power Syst. 2022, 37, 1173–1183. [Google Scholar] [CrossRef]
- Yan, Q.Y.; Zhang, M.J.; Li, W.; Qin, G.Y. Risk Assessment of New Energy Vehicle Supply Chain Based on Variable Weight Theory and Cloud Model: A Case Study in China. Sustainability 2020, 12, 3150. [Google Scholar] [CrossRef] [Green Version]
- Bastolla, U.; Fortuna, M.A.; Pascual-García, A.; Ferrera, A.; Luque, B.; Bascompte, J. The architecture of mutualistic networks minimizes competition and increases biodiversity. Nature 2009, 458, 1018–1020. [Google Scholar] [CrossRef]
- Rohr, R.P.; Saavedra, S.; Bascompte, J. On the structural stability of mutualistic systems. Science 2014, 345, 416. [Google Scholar] [CrossRef] [PubMed] [Green Version]
- Kivela, M.; Arenas, A.; Barthelemy, M.; Gleeson, J.P.; Moreno, Y.; Porter, M. Multilayer networks. J. Complex Netw. 2014, 2, 203–271. [Google Scholar] [CrossRef] [Green Version]
- Adner, R. Ecosystem as structure: An actionable construct for strategy. J. Manag. 2017, 43, 39–58. [Google Scholar] [CrossRef]
- Davis, J.P. The group dynamics of interorganizational relationships: Collaborating with multiple partners in innovation ecosystems. Adm. Sci. Q 2016, 61, 621–661. [Google Scholar] [CrossRef] [Green Version]
- Kapoor, R. Ecosystems broadening the locus of value creation. J. Organ Dysfunct. 2018, 7, 1–16. [Google Scholar] [CrossRef] [Green Version]
- Ritala, P.; Almpanopoulou, A. Defense of ‘eco’ in Innovation Ecosystem. Technovation 2017, 60–61, 39–42. [Google Scholar] [CrossRef]
- Chandler, J.D.; Lusch, R.F. Service systems: A broadened framework and research agenda on value propositions, engagement, and service experience. J. Serv. Res. 2015, 18, 6–22. [Google Scholar] [CrossRef] [Green Version]
- Gawer, A.; Cusumano, M.A. Industry platforms and ecosystem innovation. J. Prod. Innovat. Manag. 2014, 31, 417–433. [Google Scholar] [CrossRef] [Green Version]
- Rong, K.; Hu, G.; Lin, Y.; Shi, Y.; Guo, L. Understanding business ecosystem using a 6C framework in Internet-of-Things-based sectors. Int. J. Prod. Econ 2015, 159, 41–55. [Google Scholar] [CrossRef] [Green Version]
- Bayman, E.O.; Dexter, F. Multicollinearity in Logistic Regression Models. Anesth. Analg. 2021, 133, 362–365. [Google Scholar] [CrossRef]
- Petroni, N.C.; De Martino, S.; De Siena, S. Logistic and theta-logistic models in population dynamics: General analysis and exact results. J. Phys. A Math. Theor. 2020, 53, 5005. [Google Scholar]
- Verhulst, P.F. Notice sur la loi que la population suit dans son accroissement. Corresp. Math. Et Phys. 1838, 10, 113–121. [Google Scholar]
- Cox, D.R. The Regression Analysis of Binary Sequences. J. R. Stat. Soc. 1958, 20, 215–242. [Google Scholar] [CrossRef]
- Wang, S.Y.; Chen, W.M.; Liu, Y. Collaborative Product Portfolio Design Based on the Approach of Multi choice Goal Programming. Math. Probl. Eng. 2021, 2021, 6678533. [Google Scholar]
- Wang, S.Y.; Chen, W.M.; Wu, X.L. Competition Analysis on Industry Populations Based on a Three-Dimensional Lotka–Volterra Model. Discret. Dyn. Nat. Soc. 2021, 2021, 9935127. [Google Scholar] [CrossRef]
- Wang, S.Y.; Chen, W.M.; Wang, R.; Wu, X.L. Multi-objective Evaluation of Co-evolution among Innovation Populations based on Lotka-Volterra Equilibrium. Discret. Dyn. Nat. Soc. 2021, 2021, 5569108. [Google Scholar]
- Abu-Rqayiq, A.; Barany, E. Singularity of Lotka-Volterra models under unfoldings. Math. Methods Appl. Sci. 2019, 42, 1759–1771. [Google Scholar] [CrossRef]
- Slavik, A. Lotka-Volterra Competition Model on Graphs. SIAM J. Appl. Dyn. Syst. 2020, 19, 725–762. [Google Scholar] [CrossRef]
- Lam, K.Y.; Salako, R.B.; Wu, Q.L. Entire solutions of diffusive Lotka-Volterra system. J. Differ. Equ. 2020, 269, 10758–10791. [Google Scholar] [CrossRef]
- Gokul, P.M.; Chandrasekar, V.K.; Kapitaniak, T. Synchronization in Kuramoto oscillators under single external oscillator. In Nonlinear Dynamical Systems with Self-Excited and Hidden Attractors; Springer: Cham, Switzerland, 2018. [Google Scholar]
- Medvedev, G.S. The continuum limit of the Kuramoto model on sparse random graphs. arXiv 2018, arXiv:1802.03787. [Google Scholar] [CrossRef]
- Pikovsky, A.; Rosenblum, M.; Kurths, J. Synchronization, A Universal Concept in Nonlinear Sciences; Cambridge University Press: New York, NY, USA, 2001. [Google Scholar]
- Strogatz, S. Sync: The Emerging Science of Spontaneous Order; Pengiun Press Science: London, UK, 2003. [Google Scholar]
- Agudze, K.M.; Billio, M.; Casarin, R.; Ravazzolo, F. Markov switching panel with endogenous synchronization effects. J. Econom. 2022, 230, 281–298. [Google Scholar] [CrossRef]
- Anderson, T.L.; Sheppard, L.W.; Walter, J.A.; Rolley, R.E.; Reuman, D.C. Synchronous effects produce cycles in deer populations and deer-vehicle collisions. Ecol. Lett. 2021, 24, 337–347. [Google Scholar] [CrossRef]
- Rohen, M.; Sorge, A.; Timme, M.; Witthaut, D. Self-organized synchronization in decentralized power grids. Phys. Rev. Lett. 2012, 109, 064101. [Google Scholar] [CrossRef] [Green Version]
- Mikhailov, A.S.; Calenbuhr, V. From Cells to Societies: Models of Complex Coherent Action; Springer: Berlin/Heidelberg, Germany, 2002. [Google Scholar]
- Montbrió, E.; Pazó, D. Exact Mean-Field Theory Explains the Dual Role of Electrical Synapses in Collective Synchronization. Phys. Rev. Lett. 2020, 125, 248101. [Google Scholar] [CrossRef]
- Xu, C.; Gao, J.; Sun, Y.; Huang, X.; Zheng, Z.G. Explosive or Continuous: Incoherent state determines the route to synchronization. Sci. Rep. 2015, 5, 12039. [Google Scholar] [CrossRef] [Green Version]
- Winfree, A.T. Biological rhythms and the behavior of populations of coupled oscillators. J. Theor. Biol. 1967, 16, 15–42. [Google Scholar] [CrossRef] [PubMed]
- Kuramoto, Y. Self-entrainment of a population of non-linear oscillators. Lect. Notes Phys. 1975, 39, 420–422. [Google Scholar]
- Pluchino, A.; Latora, V.; Rapisarda, A. Changing opinions in a changing world: A new perspective in sociophysics. Int. J. Mod. Phys. C 2004, 16, 515–531. [Google Scholar] [CrossRef] [Green Version]
- Wang, S. Exploring the Sustainability of China’s New Energy Vehicle Development: Fresh Evidence from Population Symbiosis. Sustainability 2022, 14, 10796. [Google Scholar] [CrossRef]
- Dong, P.; Zhao, J.; Liu, X.; Wu, J.; Xu, X.; Liu, Y.; Wang, S.; Guo, W. Practical application of energy management strategy for hybrid electric vehicles based on intelligent and connected technologies: Development stages, challenges, and future trends. Renew. Sustain. Energy Rev. 2022, 170, 112947. [Google Scholar] [CrossRef]


| Year-Month | BYD | Tesla | Xiaopeng | Hozon | WM | Lixiang | Nio | Leap |
|---|---|---|---|---|---|---|---|---|
| 2022-May | 0.417 (2.280) ** | 1.587 (1.895) * | 0.956 (2.022) * | 1.120 (3.460) *** | 0.743 (1.225) | 0.841 (1.511) | 1.564 (2.789) ** | 0.659 (1.331) |
| 2022-Apr | 0.443 (2.945) *** | 1.184 (1.756) * | 0.892 (1.881) * | 0.948 (3.163) *** | 0.623 (0.980) | 0.510 (1.063) | 1.728 (2.806) ** | 0.663 (1.454) |
| 2022-Mar | 0.397 (2.684) ** | 0.537 (2.138) * | 0.755 (1.727) * | 0.815 (2.452) ** | 0.932 (1.784) * | 0.687 (2.042) | 1.588 (2.867) ** | −0.629 (−2.069) * |
| 2022-Feb | 0.322 (2.761) ** | 0.530 (2.468) ** | 0.402 (1.199) | 0.542 (2.427) ** | 0.629 (1.282) | 0.482 (1.391) | 1.373 (2.249) ** | 0.665 (2.150) * |
| 2022-Jan | 0.300 (3.074) *** | 0.361 (1.442) | 0.443 (2.096) * | 0.259 (2.910) ** | 0.843 (1.856) * | 0.425 (1.447) | 1.294 (2.254) ** | 0.059 (0.315) |
| 2021-Dec | 0.320 (2.623) ** | 0.330 (0.968) | 0.332 (1.694) * | 0.324 (3.107) ** | 0.692 (1.814) * | 0.421 (1.269) | 1.462 (2.761) ** | −0.223 (−0.555) |
| 2021-Nov | 0.043 (0.178) | 0.422 (1.566) | −0.120 (−0.340) | 0.173 (1.329) | 0.509 (1.140) | 0.500 (0.796) | 2.330 (6.368) *** | 0.192 (0.263) |
| 2021-Oct | −0.083 (−0.248) | 0.258 (0.840) | 0.134 (0.455) | 0.156 (1.020) | 0.678 (1.161) | 0.382 (0.871) | 2.041 (5.555) *** | −0.073 (−0.112) |
| 2021-Sep | −0.046 (−0.088) | −0.084 (−0.190) | 0.199 (0.412) | 0.182 (1.390) | 0.235 (0.517) | 0.434 (1.053) | 1.828 (4.488) *** | 0.176 (0.294) |
| 2021-Aug | 0.448 (0.792) | 0.811 (1.742) * | 0.718 (1.335) | 0.153 (0.792) | 0.188 (0.446) | 0.296 (0.670) | 1.190 (2.912) *** | 0.137 (0.235) |
| 2021-Jul | 0.750 (1.329) | 0.799 (2.139) * | 0.820 (1.371) | 0.092 (0.413) | 0.288 (0.626) | 0.501 (0.994) | 0.614 (1.962) * | 0.290 (0.468) |
| 2021-Jun | 0.865 (1.833) ** | 0.719 (1.970) * | 1.204 (1.842) * | 0.228 (0.853) | 0.421 (0.663) | 1.368 (2.493) | 0.764 (2.723) ** | 0.527 (0.672) |
| 2021-May | 0.725 (1.697) * | 0.719 (2.023) * | 1.295 (2.134) * | 0.315 (1.040) | 0.593 (1.083) | 0.974 (2.325) ** | 0.609 (2.562) ** | 0.697 (0.992) |
| 2021-Apr | 0.579 (1.388) | 0.561 (1.671) * | 1.190 (1.996) * | 0.389 (0.989) | 0.634 (1.170) | 0.901 (2.270) ** | 0.396 (1.519) | 0.690 (1.060) |
| Year-Month | BYD | Tesla | Xiaopeng | Hozon | WM | Lixiang | Nio | Leap |
|---|---|---|---|---|---|---|---|---|
| 2022-May | −3.90 × 10⁻⁶ (−1.988) * | −2.89 × 10⁻⁵ (−2.045) * | −7.77 × 10⁻⁵ (−2.221) * | −1.16 × 10⁻⁴ (−3.476) *** | −2.02 × 10⁻⁴ (−1.470) | −7.96 × 10⁻⁵ (−1.648) | −1.86 × 10⁻⁴ (−3.066) ** | −8.42 × 10⁻⁵ (−1.358) |
| 2022-Apr | −4.36 × 10⁻⁶ (−2.608) ** | −2.24 × 10⁻⁵ (−1.939) * | −7.33 × 10⁻⁵ (−2.094) * | −1.01 × 10⁻⁴ (−3.324) *** | −1.75 × 10⁻⁴ (−1.207) | −5.23 × 10⁻⁵ (−1.246) | −2.02 × 10⁻⁴ (−3.052) ** | −9.39 × 10⁻⁵ (−1.555) |
| 2022-Mar | −3.93 × 10⁻⁶ (−2.286) * | −8.91 × 10⁻⁶ (−1.993) * | −5.99 × 10⁻⁵ (−1.771) | −8.64 × 10⁻⁵ (−2.321) ** | −2.31 × 10⁻⁴ (−1.937) * | −6.11 × 10⁻⁵ (−2.065) * | −1.84 × 10⁻⁴ (−3.001) ** | 1.21 × 10⁻⁴ (3.012) |
| 2022-Feb | −3.33 × 10⁻⁶ (−2.416) ** | −9.11 × 10⁻⁶ (−2.356) ** | −3.55 × 10⁻⁵ (−1.370) | −6.10 × 10⁻⁵ (−2.450) ** | −1.66 × 10⁻⁴ (−1.468) | −4.52 × 10⁻⁵ (−1.492) | −1.64 × 10⁻⁴ (−2.436) ** | −1.22 × 10⁻⁴ (−2.427) |
| 2022-Jan | −2.90 × 10⁻⁶ (−2.436) ** | −6.29 × 10⁻⁶ (−1.349) | −3.21 × 10⁻⁵ (−1.953) * | −1.91 × 10⁻⁵ (−1.773) | −2.12 × 10⁻⁴ (−2.024) * | −3.59 × 10⁻⁵ (−1.358) | −1.53 × 10⁻⁴ (−3.066) ** | 1.42 × 10⁻⁵ (0.390) |
| 2021-Dec | −2.88 × 10⁻⁶ (−1.818) * | −4.82 × 10⁻⁶ (−0.661) | −1.76 × 10⁻⁵ (−1.020) | −2.80 × 10⁻⁵ (−2.061) * | −1.57 × 10⁻⁴ (−1.710) | −3.30 × 10⁻⁵ (−0.982) | −1.79 × 10⁻⁴ (−3.052) ** | 7.35 × 10⁻⁵ (0.776) |
| 2021-Nov | 8.61 × 10⁻⁷ (0.243) | −8.17 × 10⁻⁶ (−1.368) | 3.69 × 10⁻⁵ (0.858) | −3.48 × 10⁻⁶ (−0.177) | −1.24 × 10⁻⁴ (−1.069) | −5.46 × 10⁻⁵ (−0.663) | −3.05 × 10⁻⁴ (−3.001) ** | −2.979 × 10⁻⁵ (−0.154) |
| 2021-Oct | 2.54 × 10⁻⁶ (0.449) | −4.72 × 10⁻⁶ (−0.639) | −1.16 × 10⁻⁵ (−0.296) | −8.08 × 10⁻⁶ (−0.316) | −1.93 × 10⁻⁴ (−1.117) | −5.50 × 10⁻⁵ (−0.941) | −2.71 × 10⁻⁴ (−2.436) ** | 1.32 × 10⁻⁵ (0.075) |
| 2021-Sep | 1.77 × 10⁻⁶ (0.174) | 9.54 × 10⁻⁶ (0.634) | −1.80 × 10⁻⁵ (−0.237) | −1.20 × 10⁻⁵ (−0.542) | −8.42 × 10⁻⁵ (−0.628) | −6.23 × 10⁻⁵ (−1.123) | −2.46 × 10⁻⁴ (−2.361) ** | −5.23 × 10⁻⁵ (−0.315) |
| 2021-Aug | −8.92 × 10⁻⁶ (−0.775) | −2.48 × 10⁻⁵ (−1.614) | −1.12 × 10⁻⁴ (−1.284) | −6.44 × 10⁻⁶ (−0.154) | −5.95 × 10⁻⁵ (−0.468) | −3.62 × 10⁻⁵ (−0.542) | −1.65 × 10⁻⁴ (−2.845) ** | −3.47 × 10⁻⁵ (−0.201) |
| 2021-Jul | −1.59 × 10⁻⁵ (−1.325) | −2.70 × 10⁻⁵ (−2.126) * | −1.33 × 10⁻⁴ (−1.302) | 9.68 × 10⁻⁶ (0.172) | −8.21 × 10⁻⁵ (−0.550) | −7.94 × 10⁻⁵ (−0.914) | −8.07 × 10⁻⁵ (−6.576) *** | −8.50 × 10⁻⁵ (−0.428) |
| 2021-Jun | −1.88 × 10⁻⁵ (−1.840) * | −2.52 × 10⁻⁵ (−1.955) * | −2.13 × 10⁻⁴ (−1.786) | −3.05 × 10⁻⁵ (−0.397) | −1.38 × 10⁻⁴ (−0.596) | −2.70 × 10⁻⁴ (−2.459) ** | −1.06 × 10⁻⁴ (−5.832) *** | −1.85 × 10⁻⁴ (−0.641) |
| 2021-May | −1.62 × 10⁻⁵ (−1.727) * | −2.70 × 10⁻⁵ (−1.993) * | −2.43 × 10⁻⁴ (−2.135) * | −6.64 × 10⁻⁵ (−0.663) | −2.27 × 10⁻⁴ (−1.093) | −2.05 × 10⁻⁴ (−2.447) ** | −8.80 × 10⁻⁵ (−2.496) ** | −2.91 × 10⁻⁴ (−1.068) |
| 2021-Apr | −1.34 × 10⁻⁵ (−1.442) | −2.40 × 10⁻⁵ (−1.842) * | −2.30 × 10⁻⁴ (−2.027) * | −1.14 × 10⁻⁴ (−0.737) | −2.55 × 10⁻⁴ (−1.187) | −1.88 × 10⁻⁴ (−2.298) ** | −5.44 × 10⁻⁵ (−1.311) | −3.19 × 10⁻⁴ (−1.207) |
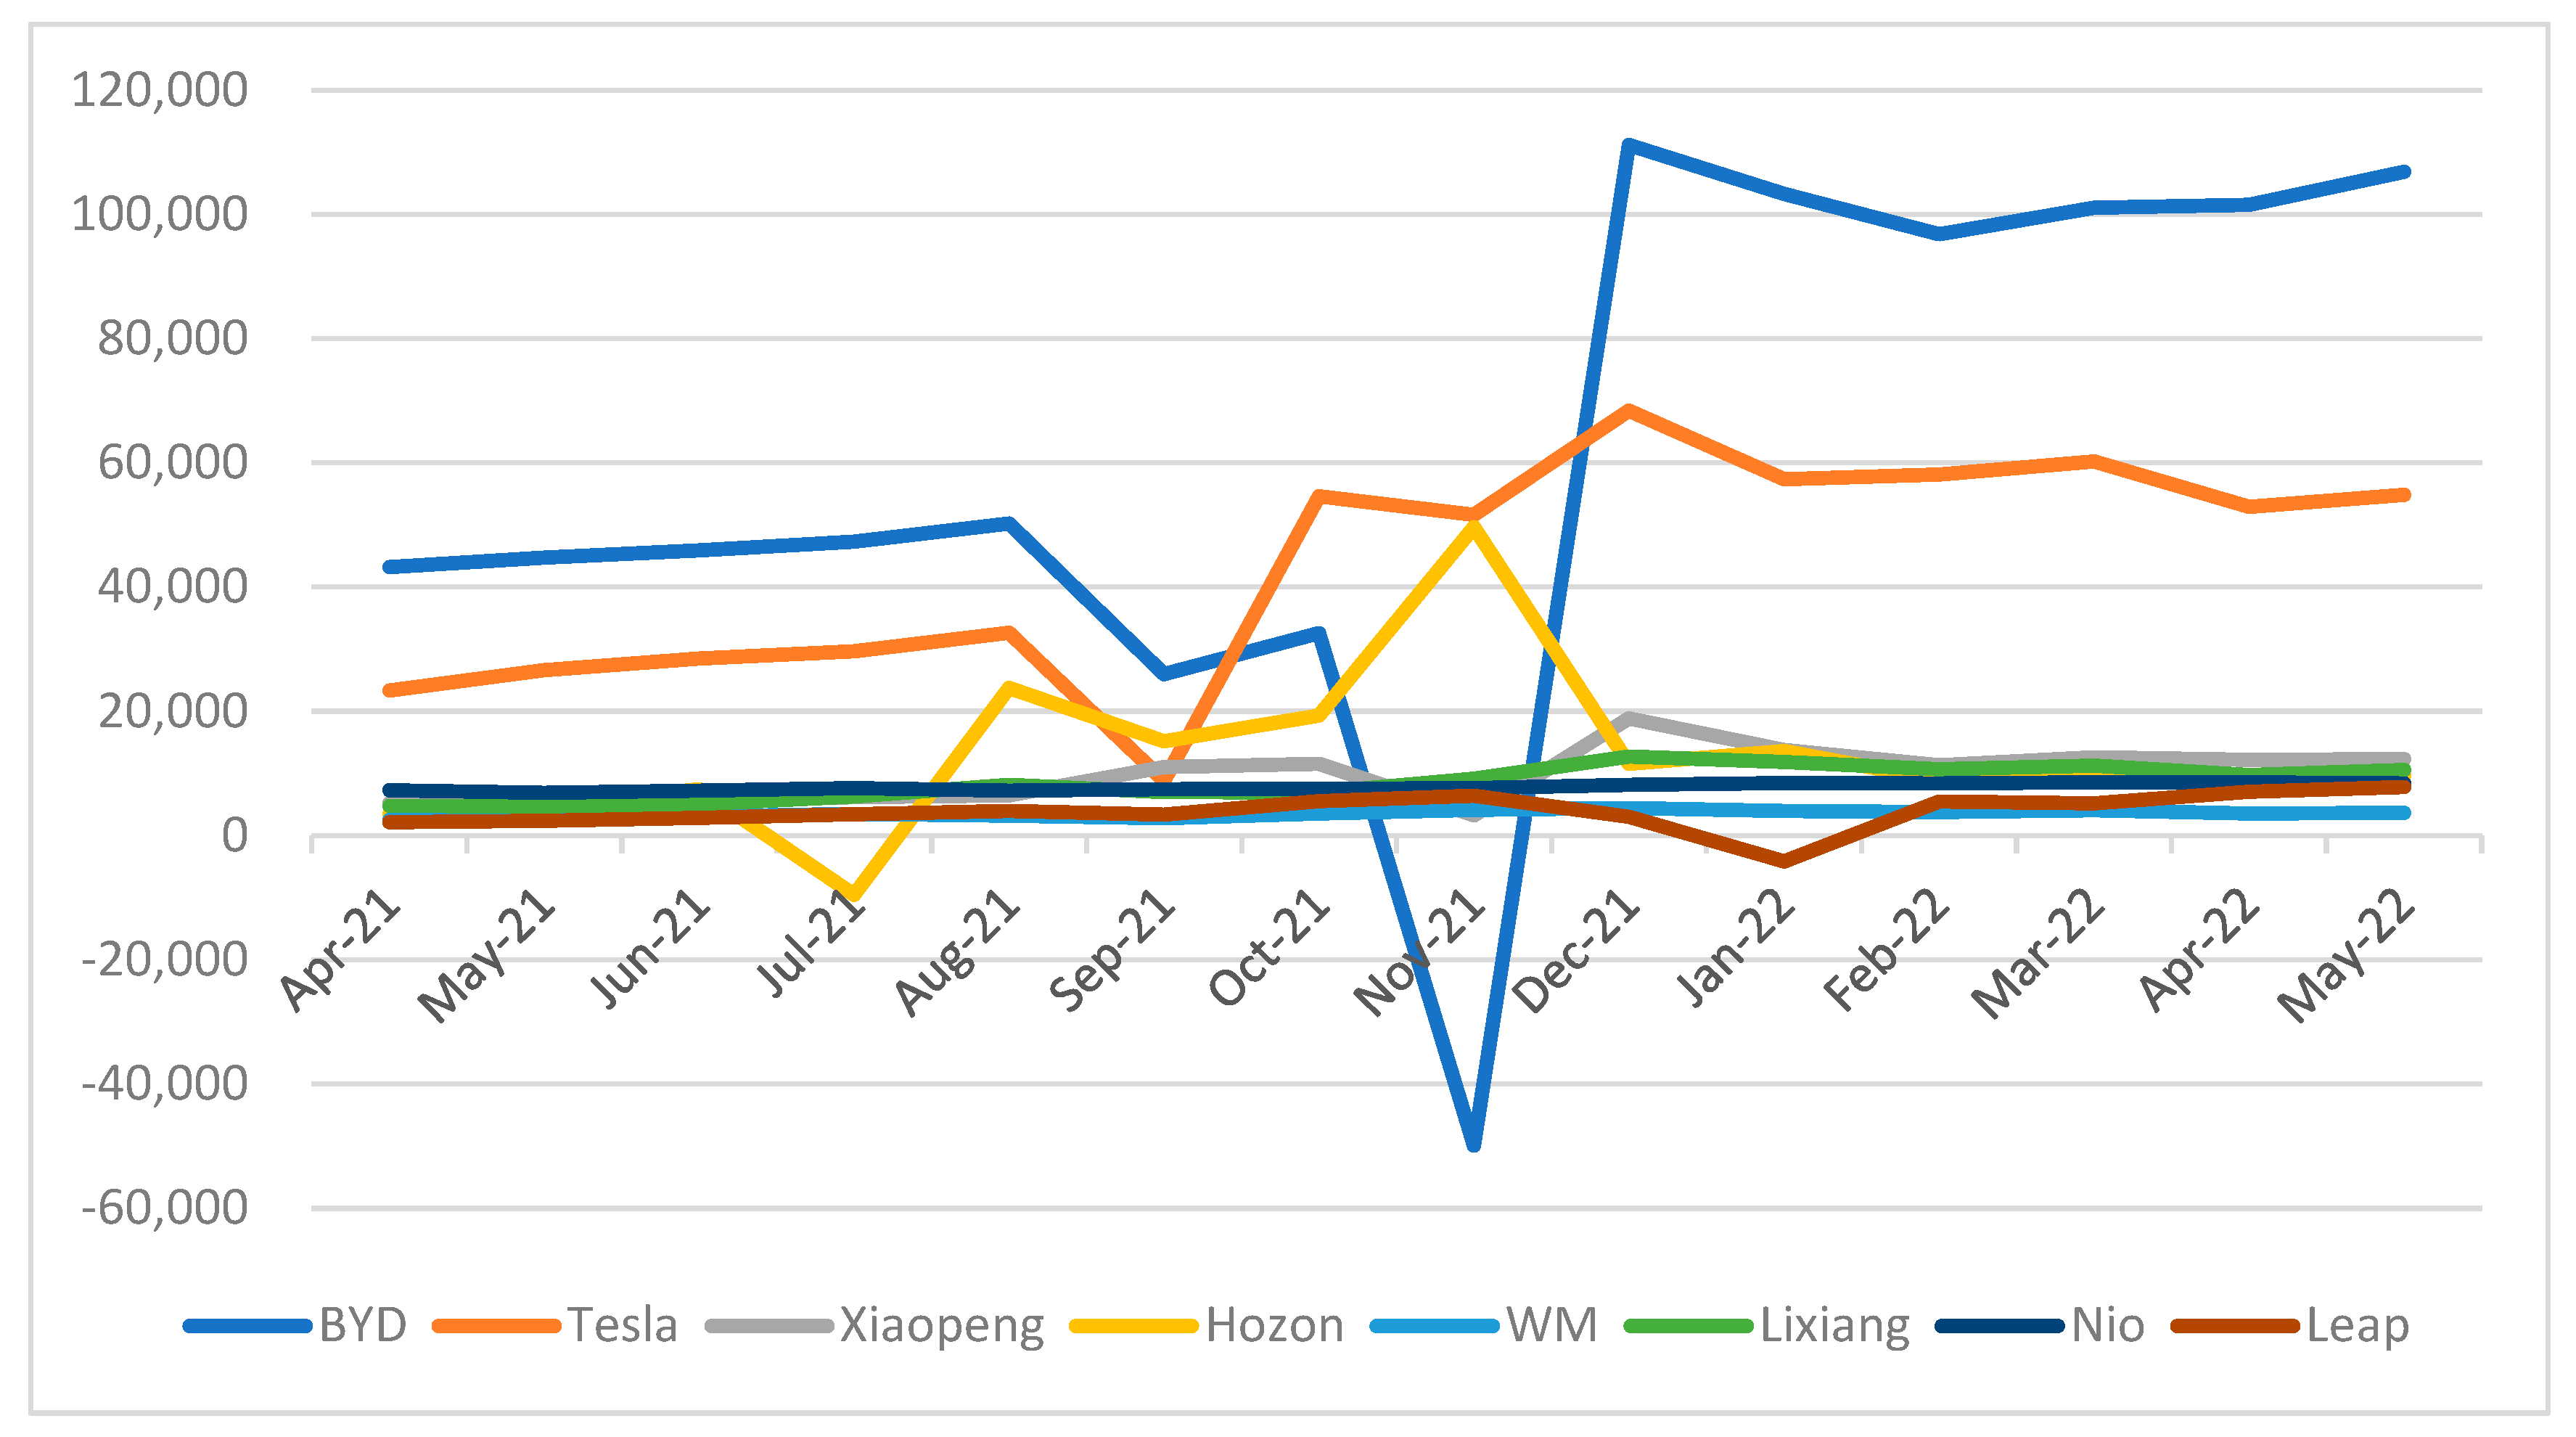
| Year-Month | BYD | Tesla | Xiaopeng | Hozon | WM | Lixiang | Nio | Leap |
|---|---|---|---|---|---|---|---|---|
| 2022-May | 106,859 | 54,862 | 12,297 | 9681 | 3674 | 10561 | 8414 | 7829 |
| 2022-Apr | 101,555 | 52,920 | 12,172 | 9432 | 3567 | 9743 | 8540 | 7061 |
| 2022-Mar | 101,083 | 60,264 | 12,609 | 9436 | 4037 | 11,248 | 8621 | 5186 |
| 2022-Feb | 96,841 | 58,152 | 11,335 | 8887 | 3794 | 10,656 | 8378 | 5439 |
| 2022-Jan | 103,310 | 57,392 | 13,788 | 13,568 | 3975 | 11,834 | 8466 | −4153 |
| 2021-Dec | 111,254 | 68,469 | 18,901 | 11,559 | 4418 | 12,756 | 8176 | 3036 |
| 2021-Nov | −49,942 | 51,627 | 3256 | 49,706 | 4119 | 9157 | 7648 | 6415 |
| 2021-Oct | 32,615 | 54,623 | 11,571 | 19,317 | 3511 | 6945 | 7538 | 5528 |
| 2021-Sep | 26,010 | 8806 | 11,042 | 15,168 | 2791 | 6961 | 7443 | 3363 |
| 2021-Aug | 50,241 | 32,637 | 6435 | 23,749 | 3160 | 8166 | 7205 | 3953 |
| 2021-Jul | 47,312 | 29,645 | 6156 | −9504 | 3507 | 6311 | 7605 | 3412 |
| 2021-Jun | 45,921 | 28,490 | 5641 | 7471 | 3049 | 5066 | 7223 | 2845 |
| 2021-May | 44,733 | 26,649 | 5340 | 4745 | 2613 | 4746 | 6918 | 2391 |
| 2021-Apr | 43,229 | 23,381 | 5179 | 3408 | 2485 | 4785 | 7284 | 2163 |
| Year-Month | BYD | Tesla | Xiaopeng | Hozon | WM | Lixiang | Nio | Leap |
|---|---|---|---|---|---|---|---|---|
| 2022-May | 0.527 | 1.000 | 0.760 | 1.000 | 0.746 | 0.508 | 0.604 | 0.971 |
| 2022-Apr | 0.555 | 0.759 | 0.715 | 0.833 | 0.585 | 0.200 | 0.689 | 0.974 |
| 2022-Mar | 0.506 | 0.372 | 0.618 | 0.703 | 1.000 | 0.365 | 0.616 | 0.000 |
| 2022-Feb | 0.427 | 0.367 | 0.369 | 0.438 | 0.593 | 0.174 | 0.505 | 0.976 |
| 2022-Jan | 0.404 | 0.266 | 0.398 | 0.162 | 0.880 | 0.120 | 0.464 | 0.519 |
| 2021-Dec | 0.425 | 0.248 | 0.319 | 0.226 | 0.677 | 0.117 | 0.551 | 0.306 |
| 2021-Nov | 0.133 | 0.303 | 0.000 | 0.079 | 0.431 | 0.190 | 1.000 | 0.619 |
| 2021-Oct | 0.000 | 0.205 | 0.180 | 0.062 | 0.659 | 0.080 | 0.851 | 0.419 |
| 2021-Sep | 0.039 | 0.000 | 0.225 | 0.088 | 0.063 | 0.129 | 0.740 | 0.607 |
| 2021-Aug | 0.560 | 0.536 | 0.592 | 0.059 | 0.000 | 0.000 | 0.411 | 0.578 |
| 2021-Jul | 0.879 | 0.528 | 0.664 | 0.000 | 0.134 | 0.191 | 0.113 | 0.693 |
| 2021-Jun | 1.000 | 0.481 | 0.936 | 0.132 | 0.313 | 1.000 | 0.190 | 0.872 |
| 2021-May | 0.852 | 0.481 | 1.000 | 0.217 | 0.544 | 0.632 | 0.110 | 1.000 |
| 2021-Apr | 0.698 | 0.386 | 0.926 | 0.289 | 0.599 | 0.564 | 0.000 | 0.995 |
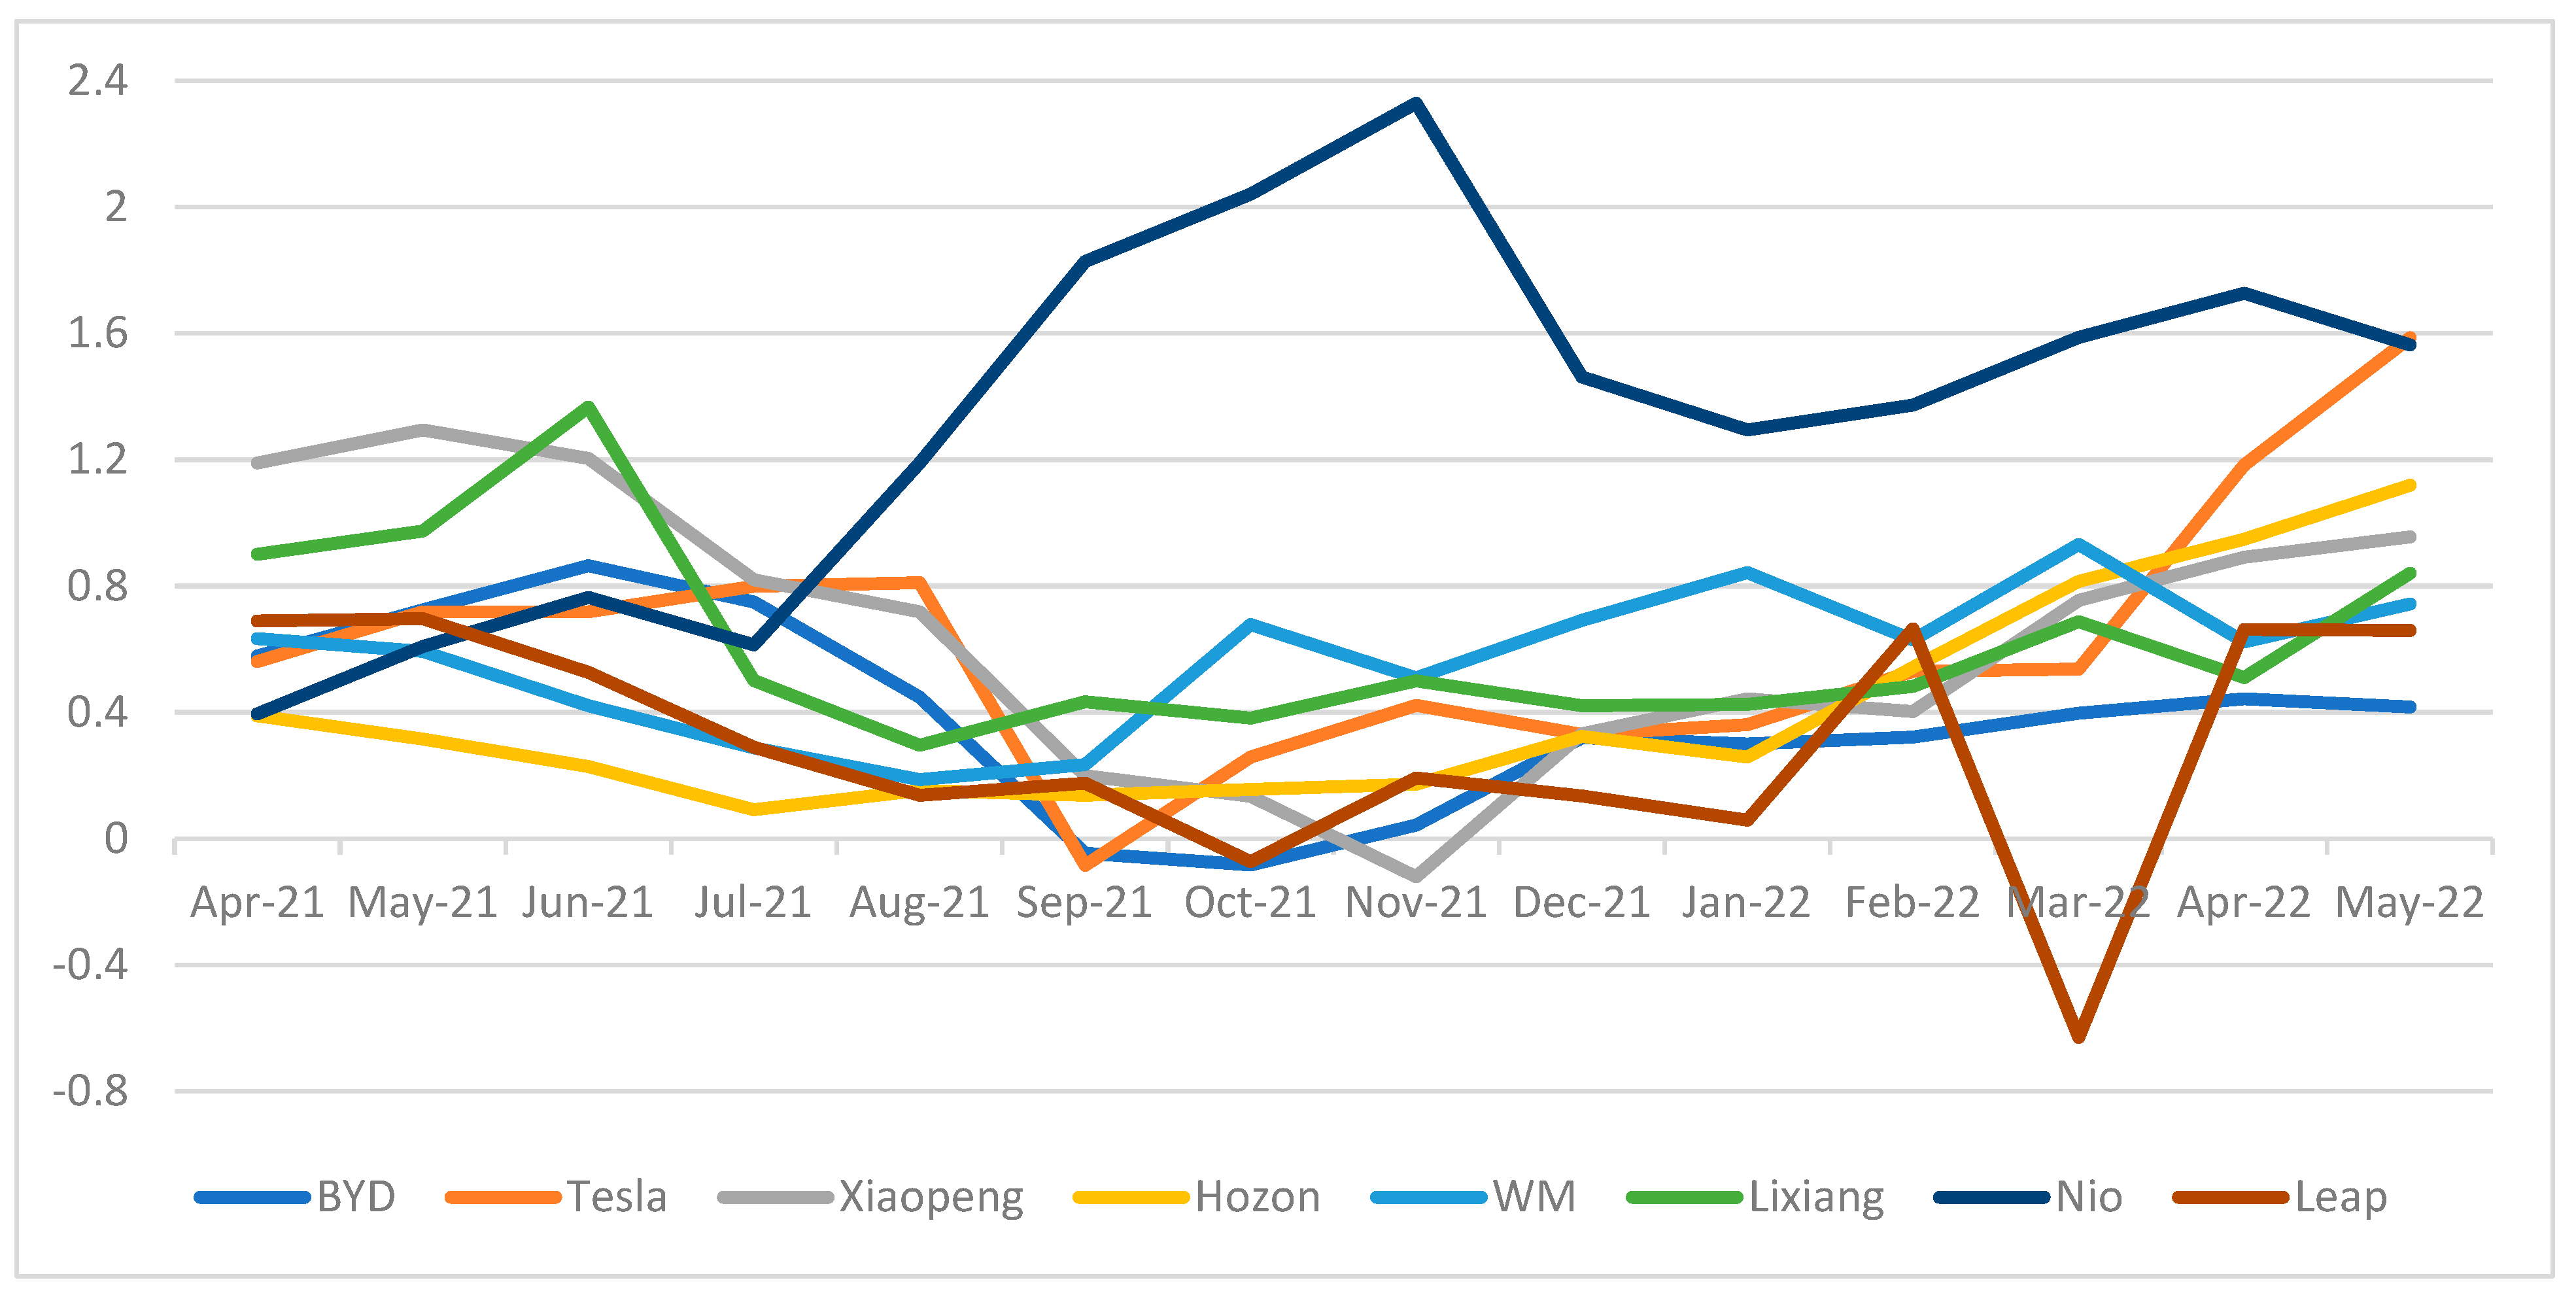
| Year-Month | BYD | Tesla | Xiaopeng | Hozon | WM | Lixiang | Nio | Leap |
|---|---|---|---|---|---|---|---|---|
| 2022-May | 0.556 | 1.571 | 0.864 | 1.571 | 0.842 | 0.533 | 0.648 | 1.331 |
| 2022-Apr | 0.588 | 0.862 | 0.797 | 0.984 | 0.624 | 0.201 | 0.760 | 1.344 |
| 2022-Mar | 0.531 | 0.381 | 0.667 | 0.780 | 1.571 | 0.373 | 0.664 | 0.000 |
| 2022-Feb | 0.441 | 0.376 | 0.378 | 0.453 | 0.634 | 0.174 | 0.530 | 1.351 |
| 2022-Jan | 0.416 | 0.270 | 0.409 | 0.163 | 1.077 | 0.121 | 0.483 | 0.546 |
| 2021-Dec | 0.439 | 0.250 | 0.325 | 0.228 | 0.744 | 0.117 | 0.584 | 0.311 |
| 2021-Nov | 0.133 | 0.308 | 0.000 | 0.079 | 0.446 | 0.191 | 1.571 | 0.668 |
| 2021-Oct | 0.000 | 0.206 | 0.180 | 0.062 | 0.719 | 0.080 | 1.017 | 0.433 |
| 2021-Sep | 0.039 | 0.000 | 0.227 | 0.088 | 0.063 | 0.129 | 0.834 | 0.652 |
| 2021-Aug | 0.595 | 0.565 | 0.634 | 0.059 | 0.000 | 0.000 | 0.423 | 0.616 |
| 2021-Jul | 1.073 | 0.557 | 0.727 | 0.000 | 0.135 | 0.192 | 0.113 | 0.766 |
| 2021-Jun | 1.571 | 0.501 | 1.210 | 0.133 | 0.319 | 1.571 | 0.191 | 1.059 |
| 2021-May | 1.020 | 0.501 | 1.571 | 0.219 | 0.576 | 0.685 | 0.110 | 1.571 |
| 2021-Apr | 0.773 | 0.396 | 1.183 | 0.293 | 0.643 | 0.600 | 0.000 | 1.468 |
| ωi | −0.017 | 0.090 | −0.025 | 0.098 | 0.015 | −0.005 | 0.050 | −0.011 |
| Year-Month | BYD | Tesla | Xiaopeng | Hozon | WM | Lixiang | Nio | Leap |
|---|---|---|---|---|---|---|---|---|
| 2022-May | −0.042 | 1.852 | −2.522 | 1.867 | −2.280 | 0.068 | −0.471 | 2.214 |
| 2022-Apr | 0.430 | 4.127 | 7.072 | 2.388 | −0.374 | 0.745 | −22.953 | 1.304 |
| 2022-Mar | 1.507 | 0.287 | 2.069 | 2.203 | 1.169 | 0.762 | 3.568 | 0.989 |
| 2022-Feb | 0.491 | −0.171 | 0.604 | −1.466 | 2.143 | 0.810 | −53.986 | 1.125 |
| 2022-Jan | −0.444 | 0.359 | 1.489 | 0.596 | 1.087 | 1.008 | 2.343 | 1.080 |
| 2021-Dec | −5.052 | 0.803 | 2.883 | 0.779 | 0.889 | 1.289 | 0.949 | 2.241 |
| 2021-Nov | 0.648 | −3.380 | 0.457 | −0.158 | 7.057 | −0.293 | 1.260 | 2.068 |
| 2021-Oct | −0.073 | −2.508 | −1.094 | −0.640 | 1.887 | −0.321 | 1.505 | 4.266 |
| 2021-Sep | −2.694 | −0.217 | −7.720 | −0.952 | −0.223 | −0.738 | 1.445 | 1.504 |
| 2021-Aug | 2.088 | 0.315 | 0.057 | 1.430 | 1.593 | 1.653 | −2.084 | 0.045 |
| 2021-Jul | 0.872 | −3.781 | −1.389 | 1.949 | 2.795 | 3.355 | 2.543 | −1.054 |
| 2021-Jun | −0.977 | 3.015 | −1.158 | 1.674 | 2.320 | −0.009 | 1.887 | −2.448 |
| 2021-May | −1.230 | 1.758 | 0.800 | 1.363 | 2.469 | 4.501 | 1.390 | 0.823 |
| Year-Month | R | Year-Month | R | Year-Month | R |
|---|---|---|---|---|---|
| 2022-May | 0.724 | 21-Dec | −1.771 | 21-Aug | 0.492 |
| 2022-Apr | 0.138 | 21-Nov | −0.571 | 21-Jul | 0.604 |
| 2022-Mar | 0.186 | 21-Oct | −0.694 | 21-Jun | 0.752 |
| 2022-Feb | −2.655 | 21-Sep | 0.324 | 21-May | 0.756 |
| 2022-Jan | 0.521 |
| Year | Volkswagen | Honda | Toyota | Nissan | Buick | |||||
|---|---|---|---|---|---|---|---|---|---|---|
| α | γ | α | γ | α | γ | α | γ | α | γ | |
| 2021–2022 | 0.810 (5.549) *** | −4.090 × 10⁻⁶ (−2.731) ** | 0.858 (6.385) *** | −6.564 × 10⁻⁶ (−3.272) *** | 0.840 (6.841) *** | −5.457 × 10⁻⁶ (−3.299) *** | 0.540 (8.237) *** | −6.859 × 10⁻⁶ (−3.302) *** | 0.427 (7.348) *** | −6.577 × 10⁻⁶ (−2.853) *** |
| 2019–2020 | 0.466 (4.524) *** | −1.873 × 10⁻⁶ (−1.563) * | 0.455 (3.280) *** | −3.280 × 10⁻⁶ (−1.099) | 1.258 (6.086) *** | −9.779 × 10⁻⁶ (−3.555) *** | 0.824 (5.161) *** | −8.197 × 10⁻⁶ (−2.468) ** | 0.113 (3.378) *** | −1.416 × 10⁻⁶ (−0.360) |
| 2017–2018 | 1.191 (10.316) *** | −4.536 × 10⁻⁶ (−1.563) *** | 0.724 (6.813)*** | −5.927 × 10⁻⁶ (−2.937) *** | 1.514 (11.272) *** | −1.504 × 10⁻⁵ (−6.998) *** | 0.537 (5.650) *** | −5.471 × 10⁻⁶ (−2.044) * | 0.657 (7.626) *** | −6.605 × 10⁻⁶(−3.243) *** |
Publisher’s Note: MDPI stays neutral with regard to jurisdictional claims in published maps and institutional affiliations. |
© 2022 by the authors. Licensee MDPI, Basel, Switzerland. This article is an open access article distributed under the terms and conditions of the Creative Commons Attribution (CC BY) license (https://creativecommons.org/licenses/by/4.0/).
Share and Cite
Chen, W.; Wang, S.; Wu, X. Growth Mechanism and Synchronization Effect of China’s New Energy Vehicle Enterprises: An Empirical Analysis Based on Moving Logistic and Kuramoto Model. Sustainability 2022, 14, 16497. https://doi.org/10.3390/su142416497
Chen W, Wang S, Wu X. Growth Mechanism and Synchronization Effect of China’s New Energy Vehicle Enterprises: An Empirical Analysis Based on Moving Logistic and Kuramoto Model. Sustainability. 2022; 14(24):16497. https://doi.org/10.3390/su142416497
Chicago/Turabian StyleChen, Wanming, Shengyuan Wang, and Xiaolan Wu. 2022. "Growth Mechanism and Synchronization Effect of China’s New Energy Vehicle Enterprises: An Empirical Analysis Based on Moving Logistic and Kuramoto Model" Sustainability 14, no. 24: 16497. https://doi.org/10.3390/su142416497