Article

Spatiotemporal Variations of Air Pollution during the COVID-19 Pandemic across Tehran, Iran: Commonalities with and Differences from Global Trends

1
School of Environment, College of Engineering, University of Tehran, Tehran 1417853111, Iran
2
Civil Engineering Department, Antalya Bilim University, Antalya 07190, Turkey
3
Centre of Excellence in Hydroinformatics, Faculty of Civil Engineering, University of Tabriz, Tabriz 51666, Iran
4
Department of Civil Engineering, Faculty of Engineering, Ferdowsi University of Mashhad, Mashhad 9177948974, Iran
5
Civil Engineering Department, Boise State University, Boise, ID 83725, USA
6
Civil Engineering Department, University of Bojnord, Bojnord 9453155111, Iran
7
Faculty of Civil and Environmental Engineering, Near East University, Nicosia 99010, Cyprus
*
Authors to whom correspondence should be addressed.
Sustainability 2022, 14(23), 16313; https://doi.org/10.3390/su142316313
Submission received: 14 October 2022 / Revised: 2 December 2022 / Accepted: 4 December 2022 / Published: 6 December 2022
(This article belongs to the Special Issue Air Quality Characterisation and Modelling)

Abstract

:
The COVID-19 pandemic has induced changes in global air quality, mostly short-term improvements, through worldwide lockdowns and restrictions on human mobility and industrial enterprises. In this study, we explored the air pollution status in Tehran metropolitan, the capital city of Iran, during the COVID-19 outbreak. To this end, ambient air quality data (CO, NO2, O3, PM10, SO2, and AQI) from 14 monitoring stations across the city, together with global COVID-19-related records, were utilized. The results showed that only the annual mean concentration of SO2 increased during the COVID-19 pandemic, mainly due to burning fuel oil in power plants. The findings also demonstrated that the number of days with a good AQI has significantly decreased during the pandemic, despite the positive trend in the global AQI. Based on the spatial variation of the air quality data across the city, the results revealed that increasing pollution levels were more pronounced in low-income regions.

1. Introduction

Urban air pollution is known as a major human health challenge [1,2]. According to the World Health Organization (WHO), approximately seven million premature deaths occur annually across the globe due to air pollution [3]. While air quality has improved substantially in the US and many developed countries, unhealthy levels of air pollution remain a daunting challenge in many developing countries and are expected to worsen in some regions owing to a variety of natural and anthropogenic sources [4,5,6,7]. The lack of a comprehensive decision-making system, old public transportation fleets, inefficient planning and management in urban environments in the face of high population density, and inadequate financial means are the main barriers to achieving or maintaining clean air in developing countries [8,9,10]. Iran, rich in oil and gas resources, suffers greatly from the complex challenges caused by air pollution [4,11,12] and endures more than 49,000 air pollution-related deaths annually [13]. The air pollution status in densely populated areas, especially the capital city of Tehran, is at a critically concerning level. The main driving factors for the excessive air pollution in this metropolitan city are (i) special topography that allows the confinement of pollutants over the city: Tehran is engulfed from three sides by mountains i.e., Shemiran hills in the north, Damavand hills in the east, and Karaj hills in the west [14]; (ii) dry climatic and stagnant air conditions: there is no noticeable rainfall during half of a year, and winds usually do not have the necessary power to move pollution out of the urban area, with 70% of the winds having a speed of less than 3 m/s [15]; (iii) high population density: the population density in Tehran, 11,969 people per square kilometer, is more than 180 times higher than Iran’s average [16]; (iv) excessive daily trip frequency: more than 20 million daily trips occur in the city and there are currently more than 4 million vehicles and 3 million motorcycles in use, twice of its ecological capacity [17]; and (v) old and inefficient vehicles: 71% of Tehran’s pollution is due to mobile pollution sources. This undesirable air condition is the main cause of 4800 annual deaths and health costs exceeding 2 billion U.S. dollars per year [1,4].
The extreme outbreak of COVID-19 occurred in the presence of significant air quality challenges in Tehran. Lockdown policy and urban activity restrictions have the potential to reduce urban transportation and ultimately help improve air quality [18,19,20,21,22]. Different nations, however, with different economic and social conditions responded differently to the COVID-19 pandemic, which translated to various levels of change in the urban air quality status, with significant implications for environmental justice issues [23,24,25,26,27,28]. Therefore, despite the national stay-at-home orders during the COVID-19 outbreak, albeit infrequent, some residents of Tehran had to continue their daily activities to survive. To understand how different factors affected Tehran’s air quality during the COVID-19 pandemic, this study investigates Tehran’s air pollution status using daily records from 14 monitoring stations across this metropolitan area and compares it with global COVID-19-related records. The results are of paramount importance to show how different socioeconomic factors affect urban air quality.

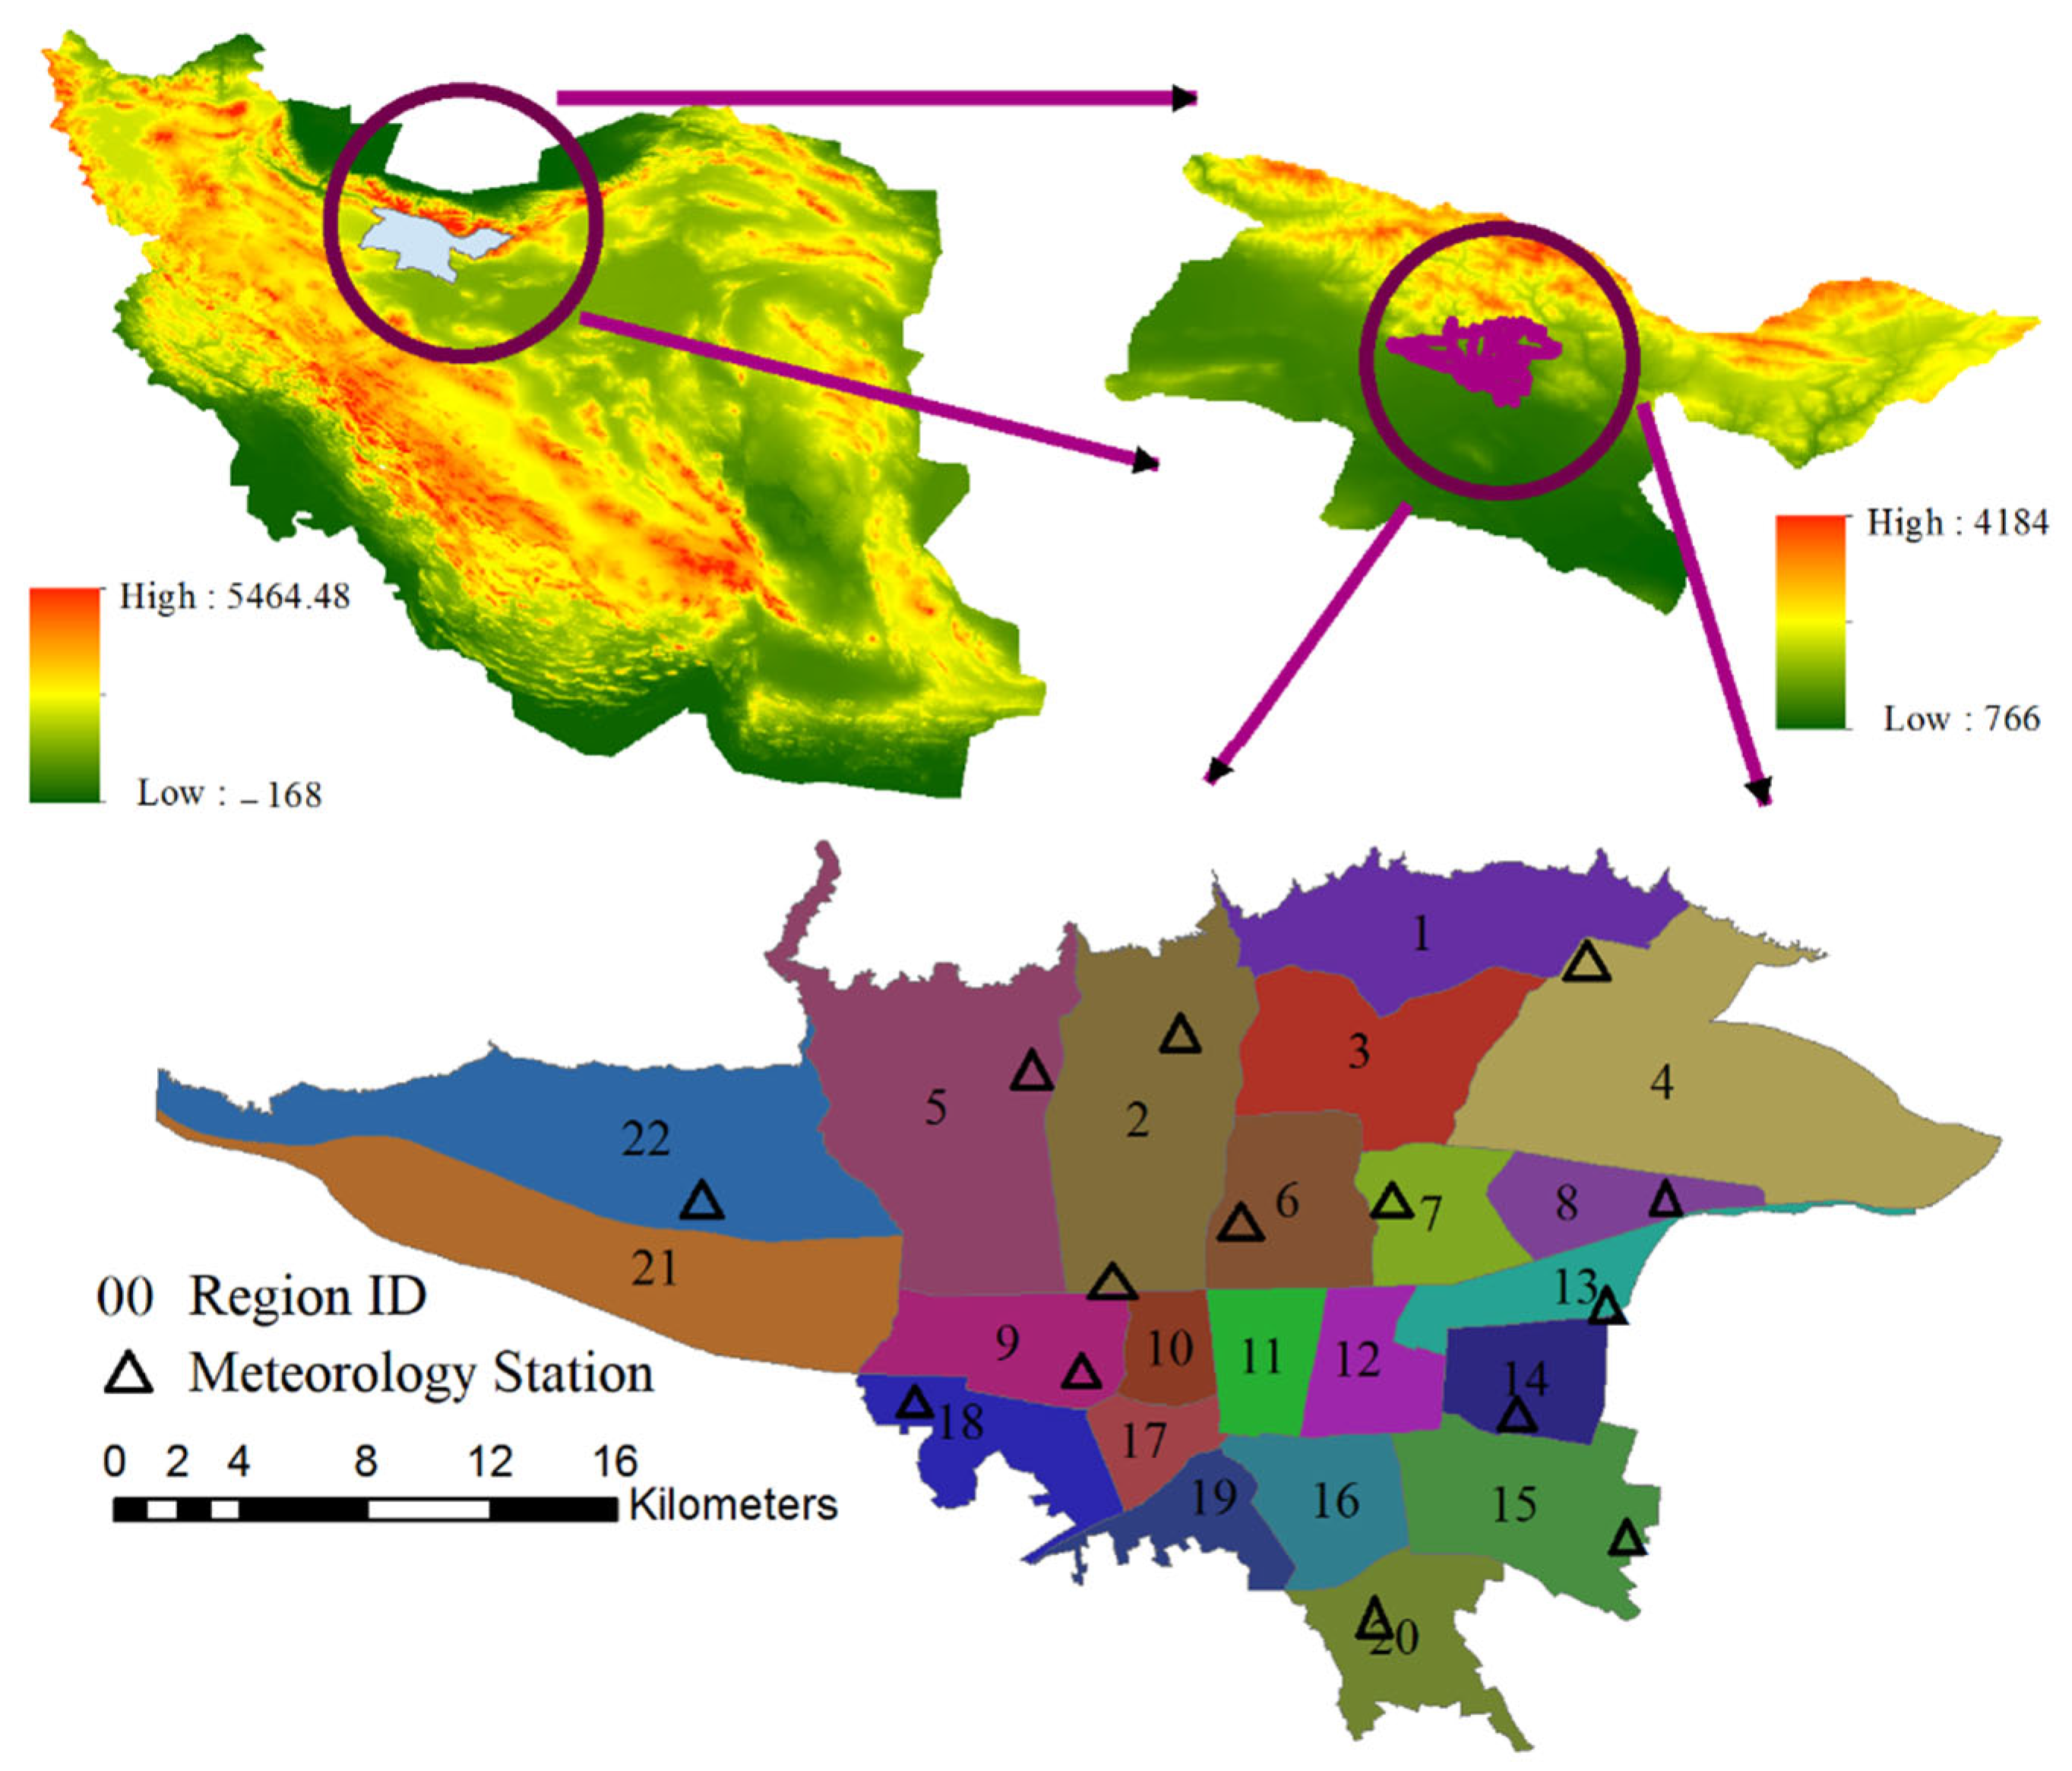
2. Materials and Methods

Tehran, the capital of Iran, is located at 35°40′ North and 51°19′ East with an average altitude of 1190 m above sea level. Figure 1 demonstrates the 22 municipal regions of Tehran and the location of meteorological stations distributed across the city. This city has a length of approximately 27 km from north to south and 50 km from east to west. Figure 2 illustrates the main meteorological features of the city during the COVID-19 pandemic. This vibrant metropolitan area is home to more than 8.5 million people (10% of Iran’s total population and 30% of Iran’s urban population). Tehran’s population increases by almost three million during the day as residents from surrounding communities move to Tehran for work and personal business [16]. This mega city alone accounts for more than 20% of total energy consumption in Iran [29]. One of the most important features of this city is its self-purification capacity due to its vast green space, a capacity that is overpowered by the city’s power plants and the immense number of vehicles. Tehran has 2277 orchards with a total area of 5949 hectares (Figure S1). In addition, green space along Tehran’s urban roads accumulates to 8253 hectares and the green belt around the city has an area of 42,855 hectares. Around Tehran, there are five fossil fuel power plants, including the Montazer Ghaem and Tarasht power plants in the west, and the Rey, Besat, and Parand power plants in the south of the city, with a capacity of 3000 megawatts (MW). The main power generation capacity is mainly located in the south of the city [30].

Air Quality Indices

Ambient air quality data for critical pollutants used in this study include carbon monoxide (CO), nitrogen dioxide (NO2), coarse particulate matter (PM10), ozone (O3), sulfur dioxide (SO2), as well the as air quality index (AQI). CO is an odorless toxic pollutant in the air that is largely produced from fossil fuel combustion [31]. Long-term exposure to CO can reduce blood oxygen-carrying capacity and cause neurological and cardiovascular diseases in humans [32]. NO is a gaseous air pollutant that is formed when fossil fuels such as oil or coal are burned at high temperatures. In the atmosphere, it turns into NO2 through a reaction with O3. Public and private cars are the largest source of this pollutant, followed by power plants, heavy equipment, and other mobile engines and industrial boilers [33,34]. Long exposure to NO2 can cause bronchitis, asthma attacks, and phlegm [35]. Tehran’s NO2 usual concentration is 85 ppb [1]. PM10 can cause serious environmental problems and certain types of cancer [36,37]. O3 is produced by chemical reactions between nitrogen oxides and volatile organic compounds in the presence of sunlight and heat. Therefore, the possibility of increasing the O3 levels to unhealthy levels on sunny and hot days is high. Ground-level O3 is a grave environmental hazard [38]. People with asthma, children, older adults, and people with reduced intake of certain nutrients, such as vitamins C and E, are at greater risk from O3 exposure. SO2 is a colorless, bad-smelling, toxic gas that is emitted by the burning of fossils. Diesel vehicles and equipment (i.e., power plants) have long been a major source of SO2 [39]. SO2 can harm the human respiratory system and make breathing difficult [40]. At high concentrations, gaseous SO2 can harm trees and plants by damaging foliage and decreasing growth. The AQI is a unitless measure of air quality that runs from 0 to 500. An AQI of 100 is usually associated with the regulatory pollutant level. The higher the AQI value, the greater the health threat from air pollution and the higher the environmental hazards [41]. To attain the AQI at each air quality monitoring station, first, the pollutant index (Ip) is calculated individually for each ambient pollutant using Equation (1) [42]. Then, the maximum acquired Ip is considered as the station’s AQI.
I p = I H i I L o BP H i BP L o C p B P L o + I L o
where Cp is the truncated concentration of pollutant p (μg/m3), BPHi is the concentration breakpoint that is greater than or equal to Cp, BPLo is the concentration breakpoint that is less than or equal to Cp, IHi is the AQI value corresponding to BPHi, and ILo is the AQI value corresponding to BPLo. It is required to mention that O3 should be truncated to three decimal places, CO should be truncated to one decimal place, and SO2, PM10, and NO2 should be truncated to an integer number. For details on pollutant-specific breakpoints/truncations and examples of the AQI calculation/classification procedure, the interested reader is referred to technical assistance on the AQI [42].
All the data were collected from 14 atmospheric monitoring stations in Tehran between 1 January 2019, and 30 December 2020, provided by the Air Quality Control Center of the Tehran municipality. COVID-19-related data was acquired from the “Our World in Data” website (https://ourworldindata.org/coronavirus/country/iran?country=~IRN, accessed on 21 April 2021). It should be noted that COVID-19 national cumulative data is published daily, and spatial classification of these data did not exist at the time of this study. To spatially interpret the data and estimate the values between measurements, the deterministic reverse distance weighting interpolation method was used. In this method, the effect of a known data point is inversely related to the distance from the location being estimated [9,42]. In this study, the most recent published values of the ambient air quality indices have been used as the baseline (usual) concentration. Finally, the well-known t-test was implemented to discover how significant the differences between the indices before and during COVID-19 are.

3. Results and Discussion

In Iran, the official onset date of COVID-19 was announced as February 19, 2020 (in the city of Qom near Tehran). On the same day, the Iranian government raised the COVID-19 alert to yellow [43]. The number of confirmed cases increased slightly from mid-March to early July followed by a slight decrease in August; since September, with the arrival of rapid diagnosis kits from South Korea, the number of confirmed cases escalated. To reduce the propagation of the illness, some of the restrictions imposed on daily life and social activities, such as the travel ban policy and prevention of intercity transportation, positively affected the air quality of big cities in Iran [44]. Referring to Tehran, the air pollution related to the travel ban policy was reduced significantly in 2020 [45]. A pioneering study on the effect of changes in traffic flow patterns across Iran has demonstrated that each one million intercity traffic was associated with a 3% increase in COVID-relevant mortality with a time lag of five weeks [46].

3.1. Carbon Monoxide (CO)

The concentration of CO in 2015 was considered here as a usual concentration in different districts of Tehran, which varied between 26.6 to 32.6 ppm [9]. The mean annual CO concentration in 2020 decreased to 25.2 ppm from 27.7 ppm in 2019, which is not significant (the significancy of variation is discussed later in Section 3.7), both of which are lower than the usual concentration. In 2020, the range of change in CO concentration was lower than its preceding at all stations (Figure S2). The highest inter-annual range of change in CO concentration in 2020 was 91 ppm (station 14), which was lower than that in 2019 at 157 ppm (station 13). The minimum and maximum CO concentrations in 2020 were also lower than in 2019. Minimum CO concentrations of 3 ppm and 4 ppm were measured at stations 5 and 6 in April 2020 and September 2019, respectively, whereas its maximum concentration levels were 99 ppm and 163 ppm in October 2020 and November 2019 at stations 14 and 13, respectively. The CO concentration only changed significantly in November and December (p-value < 0.05), and we cannot prove any significant trends in other months. Traditionally, the CO concentration is higher in winter and cold weather than in the rest of the year [47], a phenomenon that was observed in both years. The main reason for this is the confinement of pollution due to the special topography of Tehran, and temperature. Despite the 2020 average CO concentration levels across all stations being lower than that of 2019, there was significant heterogeneity among stations without a clear trend that holds for all (Figure 3). Only in November 2020 did Tehran witness a steady reduction in CO concentration at all stations, compared to the same month in 2019, which is attributed to the enforcement of strict traffic restrictions as the confirmed deaths due to COVID-19 soared. The southwestern part of the city had a higher concentration of CO from March to September 2020 compared to the previous year. A similar pattern was observed in the center and northwest of Tehran but during October and December. We highlight a decrease in CO concentration in the west and southwest of Tehran after the outbreak of COVID-19 compared to previous months.

3.2. Nitrogen Dixide (NO2)

The mean annual NO2 concentrations in 2020 and 2019 were 71.7 ppb and 71.8 ppb, respectively (Figure S3), which although being lower than the usual concentration level, are about 1.7 times higher than the standard threshold recommended by the World Health Organization (WHO). The mean monthly concentration decreased significantly only in March, April, and December (p-value < 0.05). The maximum NO2 level in 2020 (2019) was 114 ppb (142 ppb), which was observed at station 8 (6) in December (November). The minimum NO2 concentration in 2020 (2019) was 13 ppb (5 ppb), which was observed at station 12 (3) in August (March). The average NO2 concentration was 85.9 ppb in 2020 as compared to 88.1 ppb in 2019 (Figure 4). While other studies show a sharp decrease in NO2 concentrations globally due to the COVID-19 outbreak [48,49,50,51], a significant decrease in NO2 was not observed in Tehran. Furthermore, changes in NO2 concentrations follow a non–uniform pattern. Most increases in NO2 concentrations from 2019 to 2020 were seen in the west, south, and southwest of Tehran, where the main out-of-town passenger centers and main city terminals are located. The highest monthly increase was observed in August and September when the highest intercity travels traditionally occur. The maximum increase in NO2 levels occurring in these months could be a sign of a change in travel patterns and a higher rate of intercity public transport use—such as buses—in the shadow of the COVID-19 outbreak when the government prohibited the entrance of cars with out-of-province license plates into Tehran.

3.3. Coarse Particulate Matter (PM10)
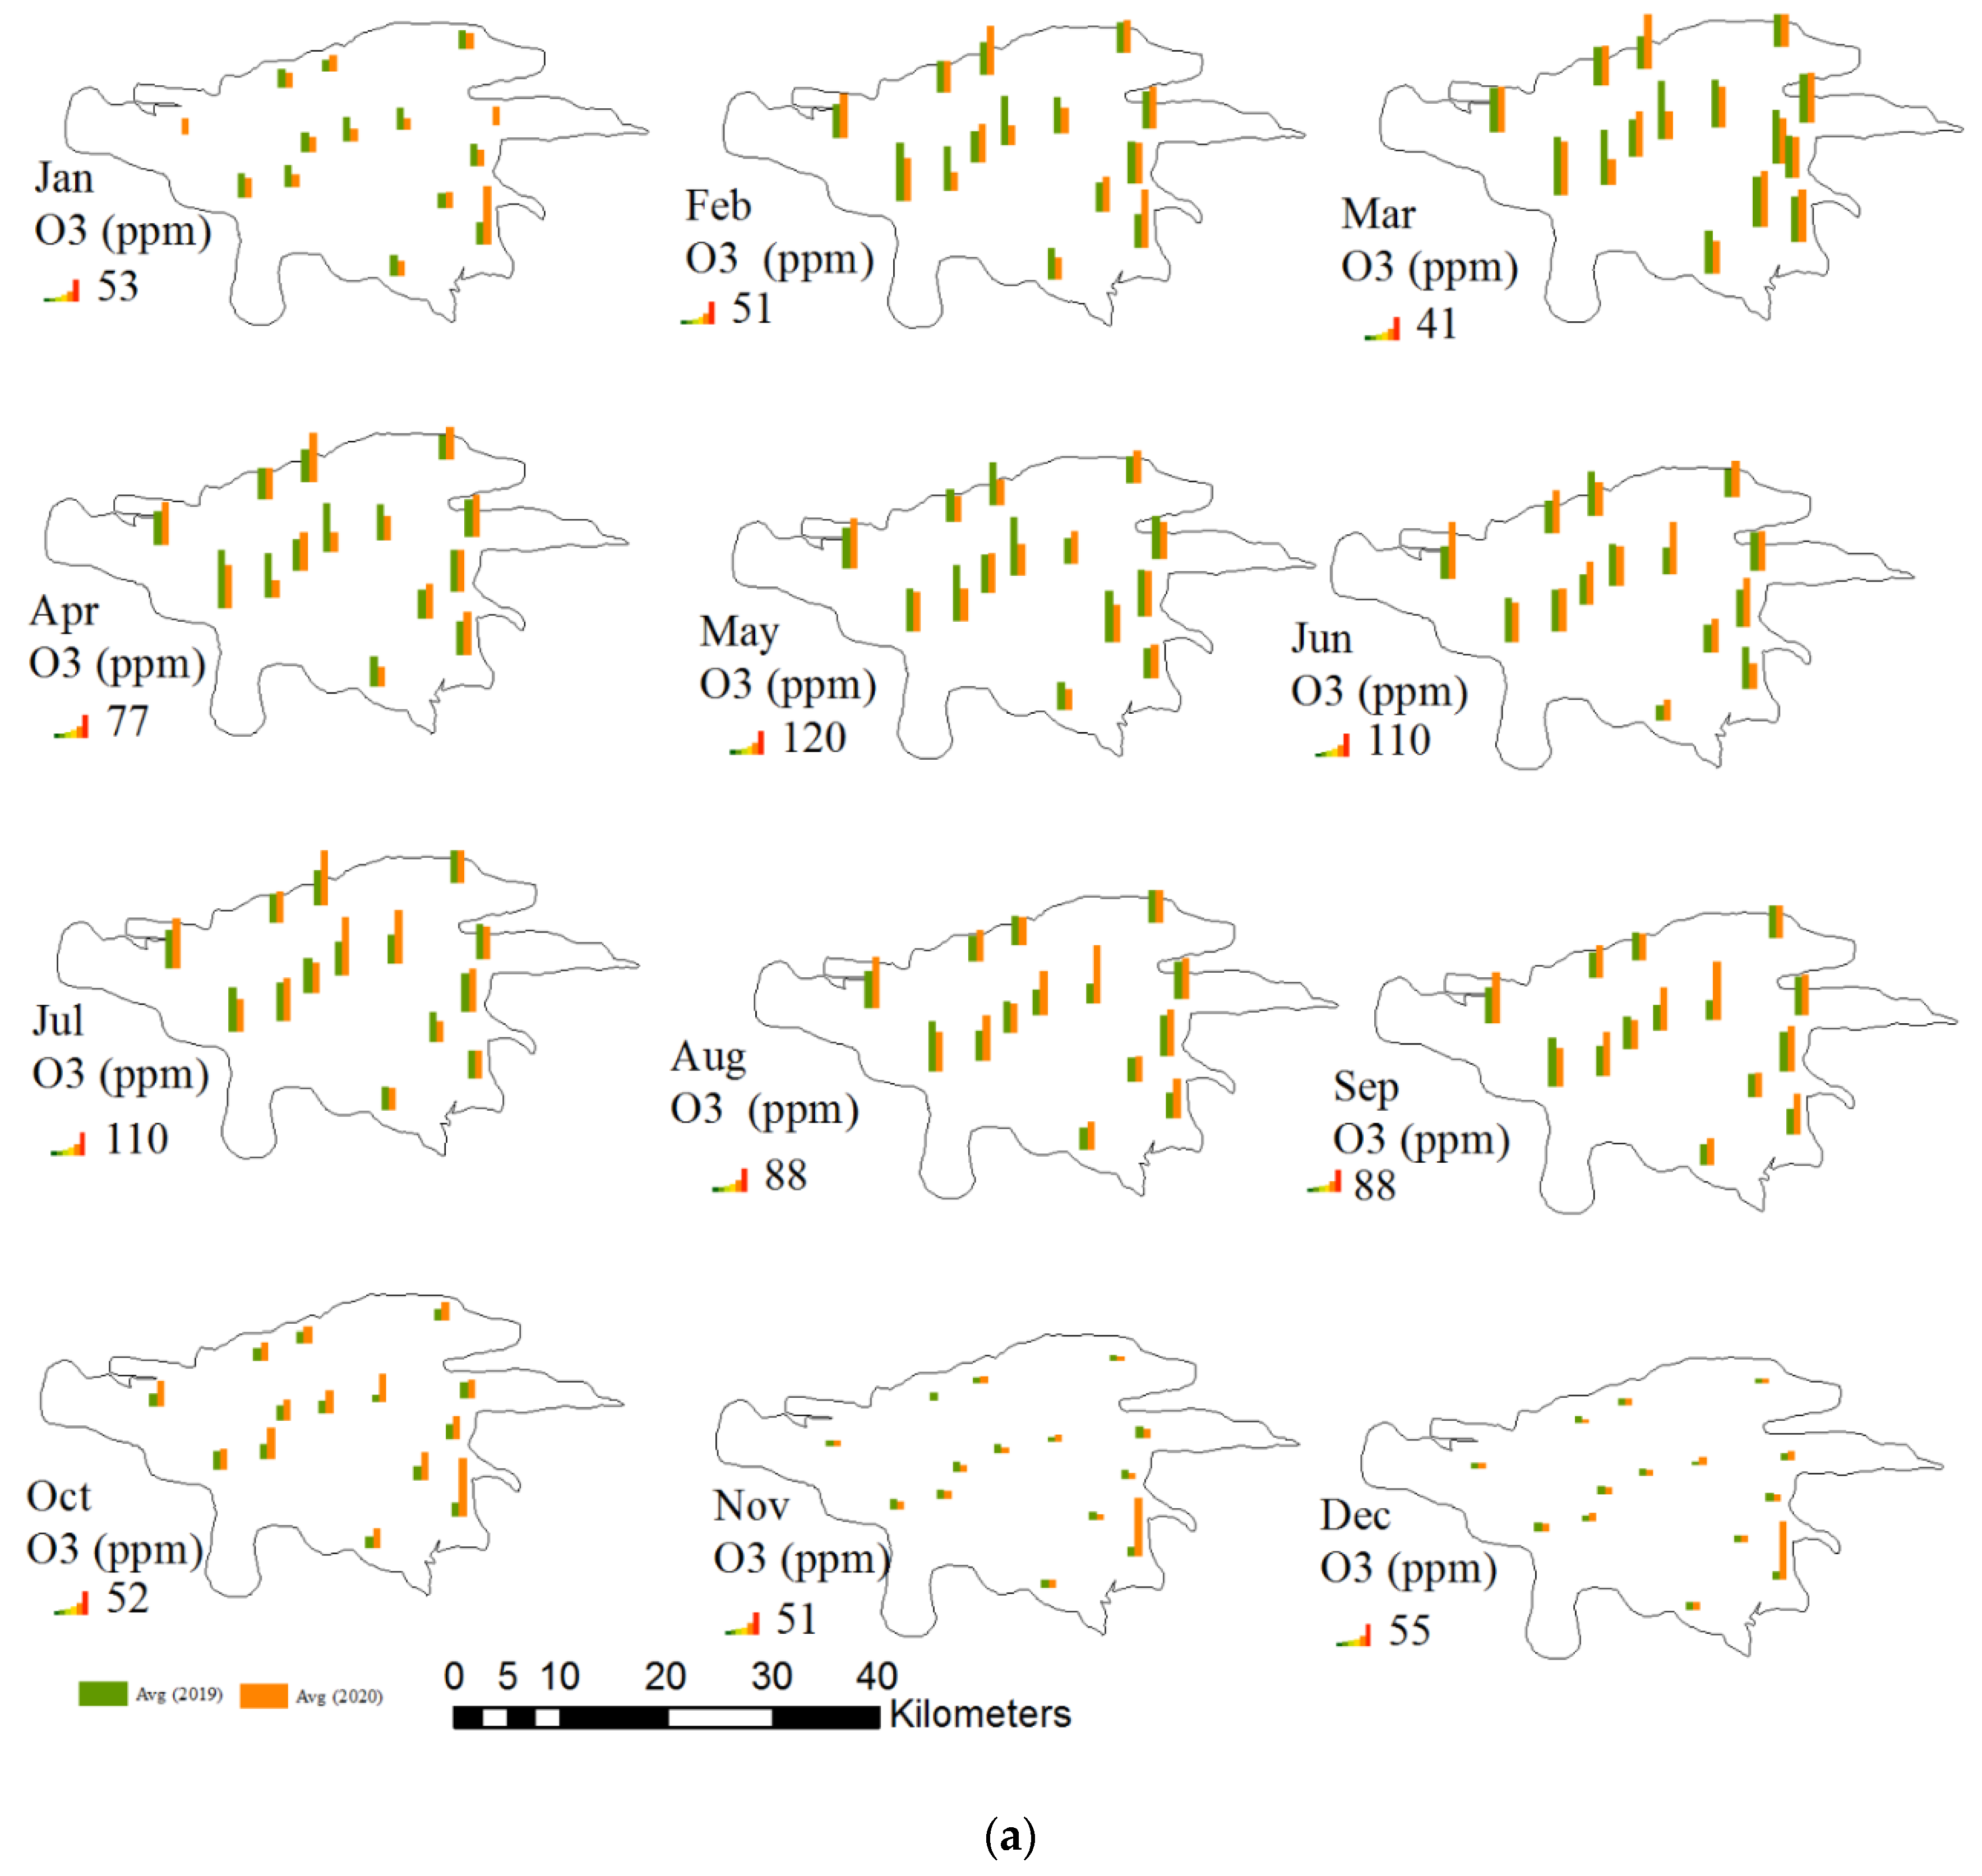
PM10 is one of the leading driving factors of air pollution-caused deaths in Tehran. The contribution of traffic flow emissions to particular matter concentrations and their negative impact on human health has been explored in many studies [52,53,54]. In Tehran, PM10’s usual concentration is 90.6 μg/m3 [1]. The mean annual PM10 concentration in 2020 decreased from 56.7 μg/m3 to 55.8 μg/m3 in 2019, which is not a significant reduction (p-value > 0.05) (Figure S4). This indicates that PM10 in Tehran was approximately three times higher than the standard threshold recommended by WHO (annual mean of 15 μg/m3) [55]. In 2020 (2019), the highest concentration of PM10 was 139 μg/m3 (204 μg/m3) at station 7 (4) and in December (August). In addition, in 2020 (2019), the minimum concentration of PM10 was 5 μg/m3 (8 μg/m3) at station 2 (2), and it was observed in February (March). The results showed an increase in the mean PM10 concentration in six stations (Stations 5, 7, 8, 9, 11, and 13) in 2020 compared to 2019, especially in March, June, July, and November (p-value < 0.05). In general, the lowest PM10 concentrations were observed in February and March, whereas the highest levels were observed in September and October. This pattern may be a sign of stability in the atmospheric boundary condition and is consistent with the behavior presented by other researchers [56] (Figure 5).

3.4. Ozone (O3)

Tehran’s usual O3 concentration is 68.8 ppb [1]. The mean O3 concentration in 2020 compared to 2019 has increased from 42.4 ppb to 45.7 ppb, which is not a significant change (p-value > 0.05). The maximum O3 concentration in 2020 (2019) was 235 ppb (204 ppb) and seen at station 2 (7) in July (June) (Figure 6). The minimum O3 level is 2 ppb in both 2019 and 2020 and can be seen in several stations during November and December. Maximum and minimum O3 concentrations are expected to occur in summer and winter due to temperature and solar radiation levels in these seasons (Figure S5). Therefore, it can be concluded that O3 concentration changed significantly in June, August, September, and October (p-value < 0.05).

3.5. Sulfur Dioxide (SO2)

Tehran’s usual SO2 concentration is 8.9 ppb, and its highest levels are usually seen in winter [1]. The mean annual SO2 concentration increased from 7.4 ppb to 17.5 ppb from 2019 to 2020 (p-value < 0.05). The maximum SO2 concentration in 2020 (2019) was 143 ppb (34 ppb) at station 7 (7) and in November (January) (Figure 7). The minimum SO2 level ranges between 2 ppb to 3 ppb in 2019 and 2020 between January and March. In all stations, the maximum and mean monthly concentration increased in 2020 compared to 2019 (Figure 7). A major change in the source of fuel in Tehran’s power plants is the main culprit of this pollution increase. In the cold winter of 2020, due to the need to maintain natural gas in home networks, the fuel of power plants was changed from natural gas to fuel oil. This decision, which made its way to the press a few months later, became a source of public controversy, and the media called it a wrong decision and a threat to public health. It is noteworthy that, in the northern region of the city, the SO2 concentration decreased in all months after the COVID-19 outbreak. The wealthiest population of Tehran inhabits this region and it is not close to any power plants. In parts of the west and south of Tehran—where the power plants are located—we see an increase in SO2 concentration (Figure S6). These regions house working-class and low-income communities, which suffered increasing air pollution during the pandemic when most of the global population benefited from cleaner air due to stay-at-home orders.

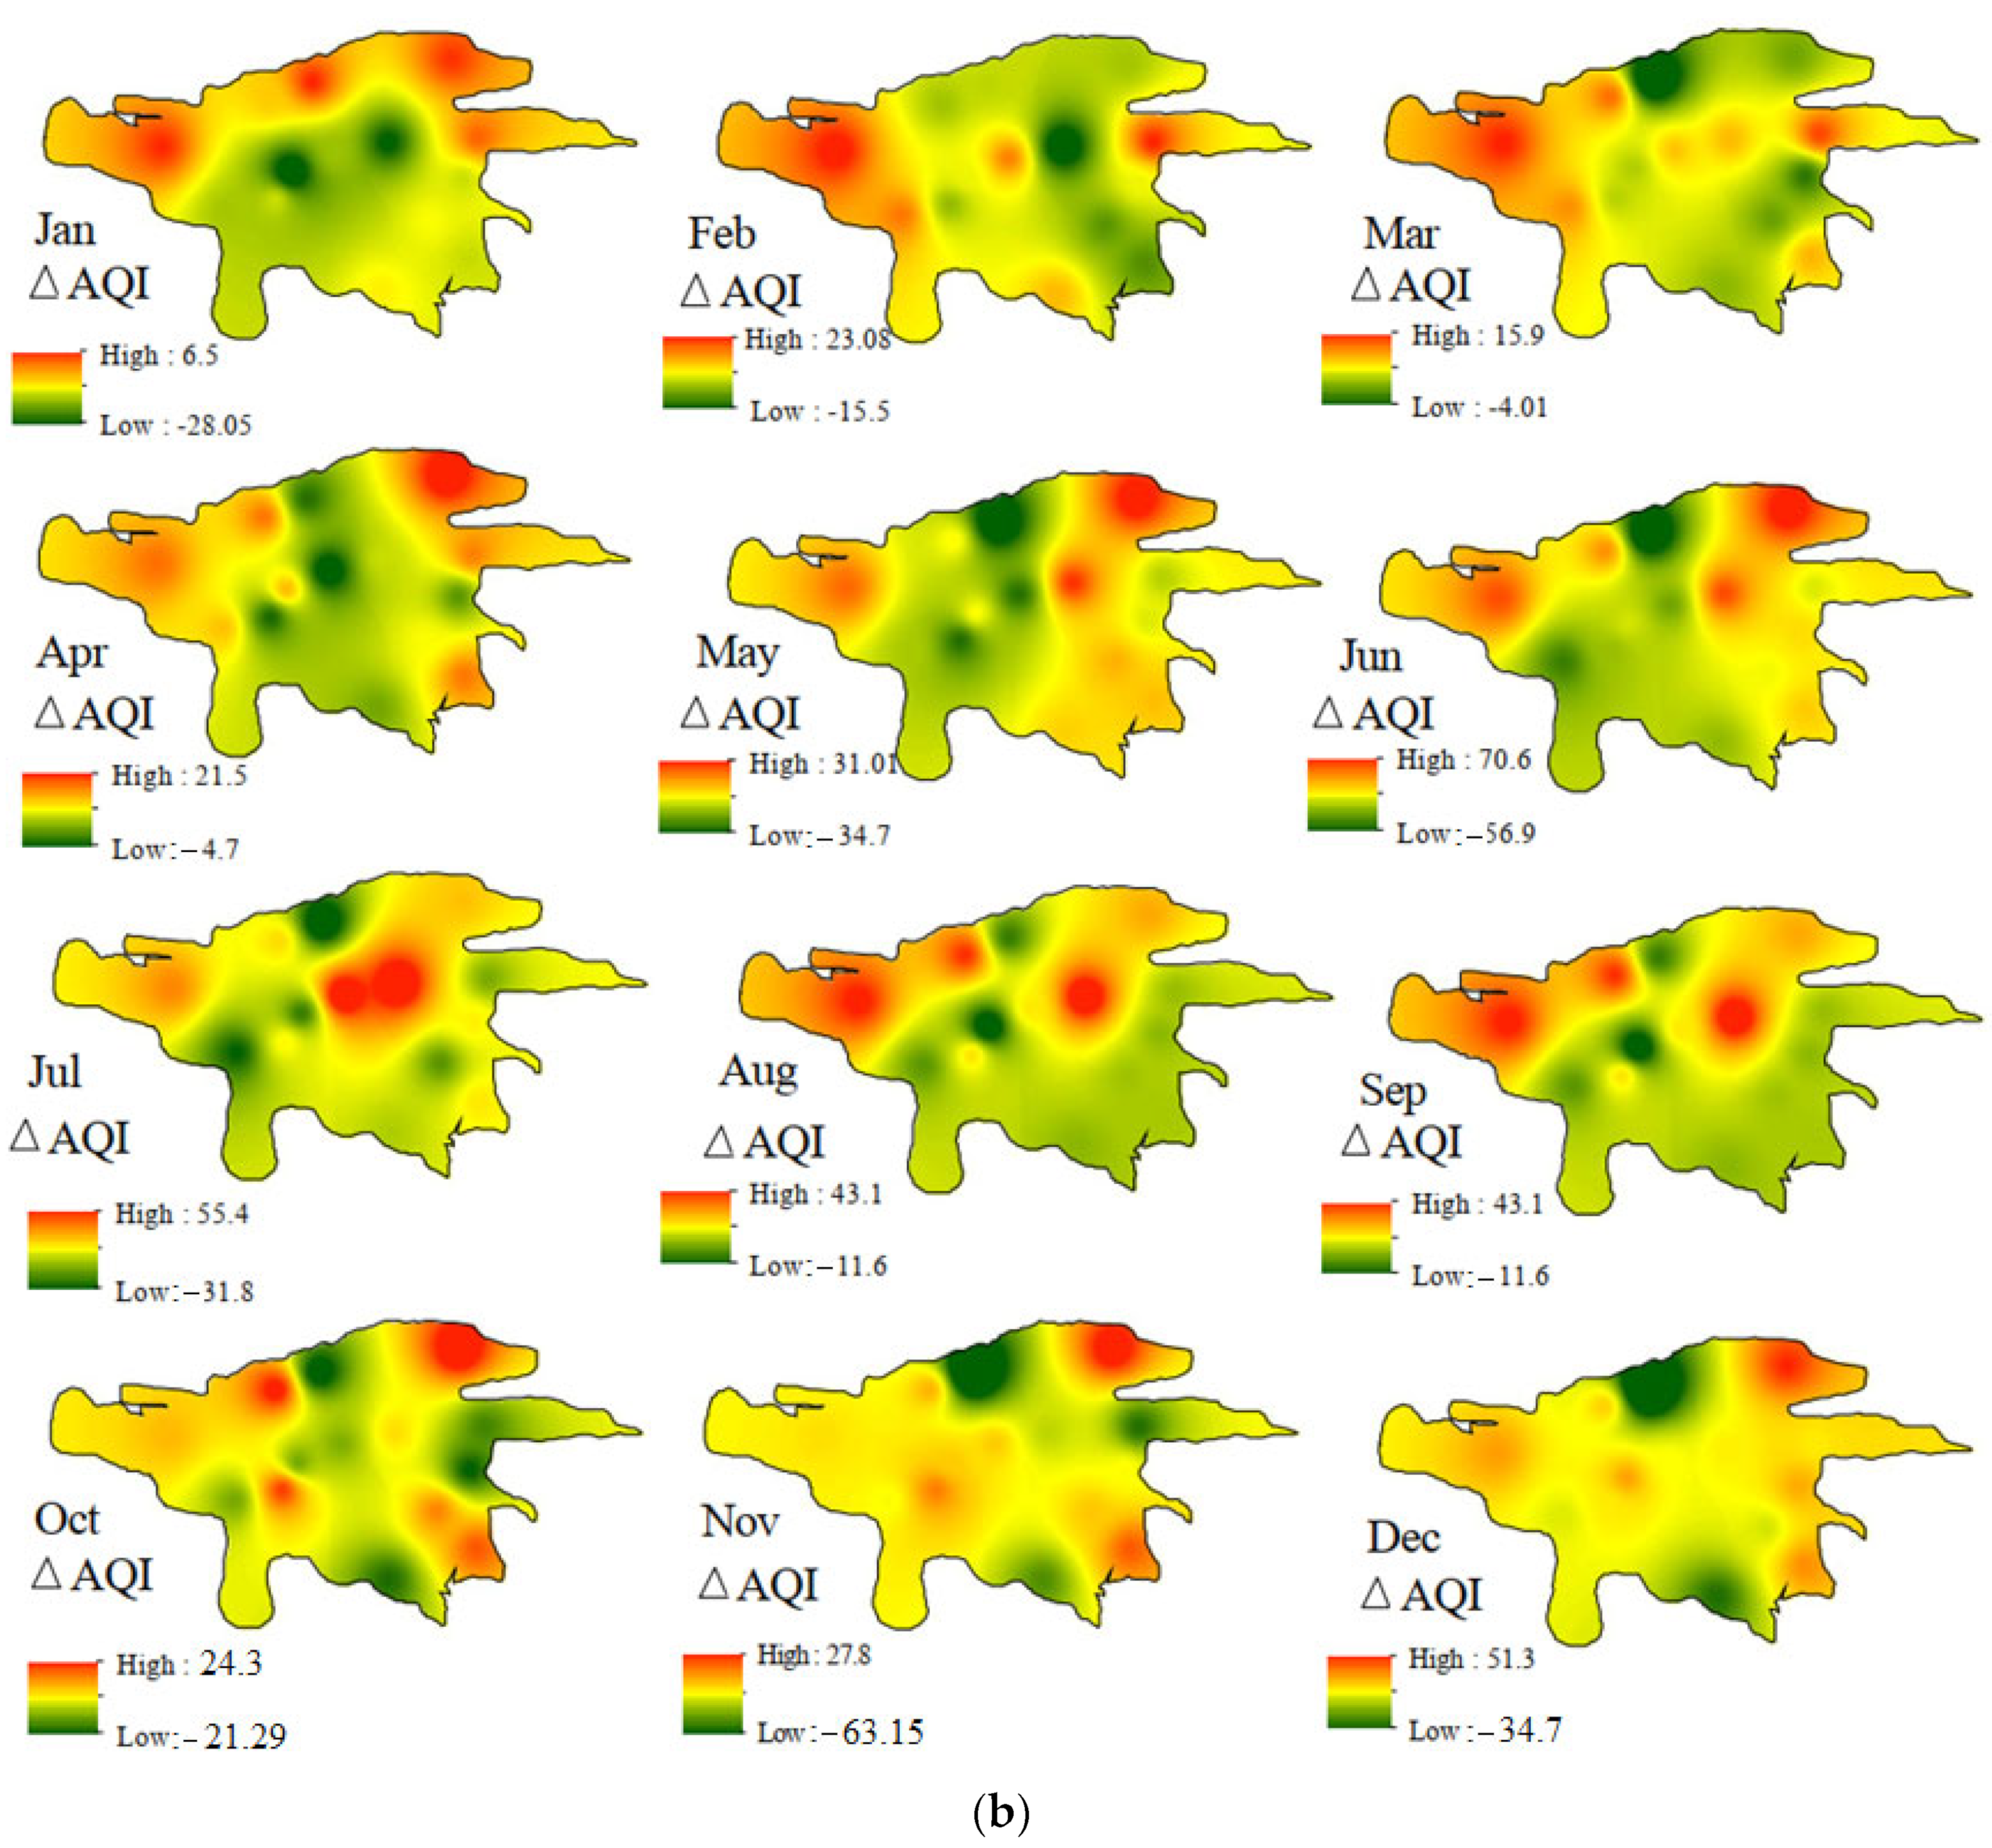
3.6. Air Quality Index—AQI

Figure 8 compares Tehran’s AQI among 14 stations in 2019 and 2020. For example, station 1 witnessed 60 days of good AQI in both years. In 2020 (2019), the maximum AQI index was 235 (204), which occurred at station 2 (12) and was observed in May (June). In addition, its minimum was equal to 15 (6) and was observed at station 4 (11) and in February (January) (Figure S6). In all stations, the mean and maximum AQI significantly increased in 2020 compared to 2019 (p-value < 0.05) (except for stations 7, 9, 12, and 13, whose maximum decreased in 2020). This trend is contrary to the globally observed trends that showed improved air quality in 2020 [57]. In the rich northern region of Tehran, in all months the AQI decreased, and the air condition improved, a trend that is comparable to the rest of the globe. In the northeastern parts, however, the AQI increased and the air quality deteriorated. In almost all stations, we see an increase in the AQI in the intervals between stay-at-home orders. This can be attributed to the accumulation of transportation needs after periods of quarantine (Figure 9). While in 2019 the number of good days was 58, it was reduced to 30 days in 2020. On the other hand, the number of moderate days marginally increased from 202 in 2019 to 214 in 2020 (Figure 8).

3.7. Significance of Variations

As previously mentioned, a correlated pairs t-test was implemented to determine if the differences (results) were statistically significant. The null hypothesis is that the true difference in the mean value of each index before and during COVID-19 is zero. Table 1 summarizes the p-values achieved for the indices. Considering the 95% confidence interval (i.e., p-value ≤ 0.05), the null hypothesis is rejected in this study. Accordingly, significant change in SO2 (AQI) was observed in all (almost all) months. Regarding CO and NO2, significant variation in air quality was seen in two (December and November) and three (March, April, and December) months, respectively. The monthly significant changes in PM10 and O3 indices were seen in four months during the pandemic.
Reductions in primary air pollutants during the COVID-19 outbreak were reported in several studies. Table 2 compares our findings with those attained in different regions.

4. Conclusions

In this article, using daily data from 14 air quality monitoring stations across Tehran metropolitan city, air quality dynamics before and during the COVID-19 pandemic and its driving factors were examined. The results of this study compare monthly and mean annual pollution levels in 2019, 2020, and usual concentration for CO (20.17 ppm, 25.2 ppm, 26.6—32.1 ppm), NO2 (71.8, 71.7, 85) ppb, PM10 (56.7, 55.8, 99.5) μg/m3, O3 (42.4, 45.7,68.8) ppb, SO2 (7.4, 17.5, 8.9) ppb, respectively. According to the results, any significant reduction in annual concentration of CO, NO2, PM10 and O3 was not observed. However, the SO2 concentrations increased significantly during the pandemic. These trends are attributed to the change in the main fuel source from natural gas to fuel oil in Tehran power plants. Political sanctions and undue economic pressure inhibited the maintenance and upgrade of Iran’s infrastructure, which forced the decision makers to choose poor air quality (i.e., use of fuel oil in power plants) over cutting natural gas for urban consumers in the cold winter days. Spatial analysis shows that air pollution indices have drastic heterogeneity in Tehran, which are attributed to topography, population density and land use patterns. This heterogeneity leaves the poor with higher pollutant levels than the wealthy, with significant implications for environmental justice issues. Furthermore, changes in the pattern of inter-city travel, from personal travel to public bus travel due to the COVID-19 outbreak, have increased and concentrated pollution around suburban terminals. The AQI index analysis shows the days with a good quality index (AQI 50) in 2020 decreased when compared to 2019, whereas the number of moderate days (50 < AQI 100) increased. This trend is also in contrast to a global improvement in air quality, highlighting that economic restraints limited the effects of social activity reduction in Tehran. Finally, in the intervals between the lockdown periods, we see an increase in the AQI index. This could be due to the accumulation of social transportation needs after periods of quarantine.

Supplementary Materials

The following supporting information can be downloaded at: https://www.mdpi.com/article/10.3390/su142316313/s1, Figure S1: Green space and green area per capita across Tehran; Figure S2: Temporal distribution of CO content at each station, gray rectangular shows strict lockdown period. Figure S3: Temporal distribution of NO2 content in all investigated station, gray rectangular shows strict lockdown period; Figure S4: Temporal distribution of PM10 content in all investigated station, gray rectangular shows strict lockdown period; Figure S5: Temporal distribution of O3 content in all investigated station, gray rectangular shows strict lockdown period; Figure S6: Temporal distribution of SO2 content in all investigated station, gray rectangular shows strict lockdown period; Figure S7: Temporal distribution of the AQI indices in all investigated stations, the gray rectangles show strict lockdown periods.

Author Contributions

Conceptualization, M.M. and A.D.M.; methodology, M.M. and S.M.K.; software, M.M. and S.P.; validation, A.D.M., M.S. and V.N.; formal analysis, M.M. and B.G.; investigation, M.M. and A.D.M.; resources, B.G.; data curation, M.M. and S.P.; writing—original draft preparation, M.M., S.M.K. and A.D.M.; writing—review and editing, M.M., S.M.K. and A.D.M.; visualization, M.M. and A.D.M.; supervision, M.S. and V.N. All authors have read and agreed to the published version of the manuscript.

Funding

This research received no external funding.

Institutional Review Board Statement

Not applicable.

Informed Consent Statement

Not applicable.

Data Availability Statement

Data used in this study available from corresponding author upon a reasonable request.

Acknowledgments

The authors are thankful to three anonymous reviewers for their constructive comments.

Conflicts of Interest

The authors declare no conflict of interest.

References

  1. Naddafi, K.; Hassanvand, M.S.; Yunesian, M.; Momeniha, F.; Nabizadeh, R.; Faridi, S.; Gholampour, A. Health impact assessment of air pollution in megacity of Tehran, Iran. Iran. J. Environ. Health Sci. Eng. 2012, 9, 28. [Google Scholar]
  2. Tuygun, G.T.; Gundoğdu, S.; Elbir, T. Estimation of ground-level particulate matter concentrations based on synergistic use of MODIS, MERRA-2 and AERONET AODs over a coastal site in the Eastern Mediterranean. Atmos. Environ. 2021, 261, 118562. [Google Scholar] [CrossRef]
  3. WHO (World Health Organization). 7 Million Premature Deaths Annually Linked to Air Pollution; World Health Organization: Geneva, Switzerland, 2014. [Google Scholar]
  4. Vafa-Arani, H.; Jahani, S.; Dashti, H.; Heydari, J.; Moazen, S. A system dynamic modeling for urban air pollution: A case study of Tehran, Iran. Transp. Res. D-Transp. Environ. 2014, 31, 21–36. [Google Scholar] [CrossRef]
  5. Hosseini, V.; Shahbazi, H. Urban air pollution in Iran. Iran. Stud. 2016, 49, 1029–1046. [Google Scholar]
  6. Kayalar, Ö.; Arı, A.; Konyalılar, N.; Doğan, Ö.; Can, F.; Şahin, Ü.A.; Gaga, E.O.; Kuzu, S.L.; Arı, P.E.; Odabası, M. Existence of SARS-CoV-2 RNA on ambient particulate matter samples: A nationwide study in Turkey. Sci. Total Environ. 2021, 789, 147976. [Google Scholar] [CrossRef]
  7. Noori, R.; Hoshyaripour, G.; Ashrafi, K.; Araabi, B.N. Uncertainty analysis of developed ANN and ANFIS models in prediction of carbon monoxide daily concentration. Atmos. Environ. 2010, 44, 476–482. [Google Scholar]
  8. Vasconcellos, E.A. Urban Transport Environment and Equity: The Case for Developing Countries, 1st ed.; Routledge: London, UK, 2014. [Google Scholar]
  9. Habibi, R.; Alesheikh, A.A.; Mohammadinia, A.; Sharif, M. An assessment of spatial pattern characterization of air pollution: A case study of CO and PM2. 5 in Tehran, Iran. ISPRS Int. J. Geoinf. 2017, 6, 270. [Google Scholar] [CrossRef] [Green Version]
  10. Cohen, B. Urbanization in developing countries: Current trends, future projections, and key challenges for sustainability. Technol. Soc. 2006, 28, 63–80. [Google Scholar] [CrossRef]
  11. Atash, F. The deterioration of urban environments in developing countries: Mitigating the air pollution crisis in Tehran, Iran. Cities 2007, 24, 399–409. [Google Scholar] [CrossRef]
  12. Akbarzadeh, A.; Vesali Naseh, M.; Nodefarahani, M. Carbon Monoxide Prediction in the Atmosphere of Tehran Using Developed Support Vector Machine. Pollution 2020, 6, 43–57. [Google Scholar]
  13. Heger, M.; Sarraf, M. Air pollution in Tehran: Health Costs, Sources, and Policies; Environment and Natural Resources Global Practice Discussion Paper, No. 6; World Bank: Washington, DC, USA, 2018. [Google Scholar]
  14. Bayat, R.; Ashrafi, K.; Motlagh, M.S.; Hassanvand, M.S.; Daroudi, R.; Fink, G.; Kunzli, N. Health impact and related cost of ambient air pollution in Tehran. Environ. Res. 2019, 176, 108547. [Google Scholar] [CrossRef] [PubMed]
  15. Keyhani, A.; Ghasemi-Varnamkhasti, M.; Khanali, M.; Abbaszadeh, R. An assessment of wind energy potential as a power generation source in the capital of Iran, Tehran. Energy 2010, 35, 188–201. [Google Scholar] [CrossRef]
  16. Madanipour, A. Urban planning and development in Tehran. Cities 2006, 23, 433–438. [Google Scholar] [CrossRef]
  17. Shams, M.; Rahimi-Movaghar, V. Risky driving behaviors in Tehran, Iran. Traffic Inj. Prev. 2009, 10, 91–94. [Google Scholar] [CrossRef]
  18. Contini, D.; Costabile, F. Does Air Pollution Influence COVID-19 Outbreaks? Atmosphere 2020, 11, 377. [Google Scholar] [CrossRef] [Green Version]
  19. Liu, S.; Yang, X.; Duan, F.; Zhao, W. Changes in Air Quality and Drivers for the Heavy PM2.5 Pollution on the North China Plain Pre- to Post-COVID-19. Int. J. Environ. Res. Public Health 2022, 19, 12904. [Google Scholar] [CrossRef]
  20. Rumpler, R.; Venkataraman, S.; Göransson, P. An observation of the impact of COVID-19 recommendation measures monitored through urban noise levels in central Stockholm, Sweden. Sustain. Cities Soc. 2020, 63, 102469. [Google Scholar] [CrossRef]
  21. Rahmani, A.M.; Mirmahaleh, S.Y.H. Coronavirus disease (COVID-19) prevention and treatment methods and effective parameters: A systematic literature review. Sustain. Cities Soc. 2021, 64, 102568. [Google Scholar]
  22. Agarwal, N.; Meena, C.S.; Raj, B.P.; Saini, L.; Kumar, A.; Gopalakrishnan, N.; Kumar, A.; Balam, N.B.; Alam, T.; Kapoor, N.R. Indoor air quality improvement in COVID-19 pandemic. Sustain. Cities Soc. 2021, 70, 102942. [Google Scholar]
  23. Velraj, R.; Haghighat, F. The contribution of dry indoor built environment on the spread of Coronavirus: Data from various Indian states. Sustain. Cities Soc. 2020, 62, 102371. [Google Scholar]
  24. Kleinschroth, F.; Kowarik, I. COVID-19 crisis demonstrates the urgent need for urban greenspaces. Front. Ecol. Environ. 2020, 18, 318. [Google Scholar]
  25. Casanova, L.M.; Jeon, S.; Rutala, W.A.; Weber, D.J.; Sobsey, M.D. Effects of air temperature and relative humidity on coronavirus survival on surfaces. Appl. Environ. 2010, 76, 2712–2717. [Google Scholar] [CrossRef] [Green Version]
  26. Sun, C.; Zhai, Z. The efficacy of social distance and ventilation effectiveness in preventing COVID-19 transmission. Sustain. Cities Soc. 2020, 62, 102390. [Google Scholar]
  27. Hashim, B.M.; Al-Naseri, S.K.; Al Maliki, A.; Sa’adi, Z.; Malik, A.; Yaseen, Z.M. On the investigation of COVID-19 lockdown influence on air pollution concentration: Regional investigation over eighteen provinces in Iraq. Environ. Sci. Pollut. Res. 2021, 28, 50344–50362. [Google Scholar]
  28. Niu, H.; Zhang, C.; Hu, W.; Hu, T.; Wu, C.; Hu, S.; Silva, L.F.O.; Gao, N.; Bao, X.; Fan, J. Air Quality Changes during the COVID-19 Lockdown in an Industrial City in North China: Post-Pandemic Proposals for Air Quality Improvement. Sustainability 2022, 14, 11531. [Google Scholar] [CrossRef]
  29. Nabavi-Pelesaraei, A.; Bayat, R.; Hosseinzadeh-Bandbafha, H.; Afrasyabi, H.; Chau, K.W. Modeling of energy consumption and environmental life cycle assessment for incineration and landfill systems of municipal solid waste management-A case study in Tehran Metropolis of Iran. J. Clean Prod. 2017, 148, 427–440. [Google Scholar]
  30. Noroozian, A.; Bidi, M. An applicable method for gas turbine efficiency improvement. Case study: Montazar Ghaem power plant, Iran. J. Nat. Gas. Sci. Eng. 2016, 28, 95–105. [Google Scholar] [CrossRef]
  31. Davies, H.W.; Vlaanderen, J.; Henderson, S.; Brauer, M. Correlation between co-exposures to noise and air pollution from traffic sources. J. Occup. Environ. Med. 2009, 66, 347–350. [Google Scholar] [CrossRef]
  32. Chen, T.-M.; Kuschner, W.G.; Gokhale, J.; Shofer, S. Outdoor air pollution: Nitrogen dioxide, sulfur dioxide, and carbon monoxide health effects. Am. J. Med. Sci. 2007, 333, 249–256. [Google Scholar]
  33. Kumar, R.; Joseph, A.E. Air pollution concentrations of PM 2.5, PM10 and NO2 at ambient and kerbsite and their correlation in Metro City–Mumbai. Environ. Monit. Assess. 2006, 119, 191–199. [Google Scholar]
  34. Rosofsky, A.; Levy, J.I.; Zanobetti, A.; Janulewicz, P.; Fabian, M.P. Temporal trends in air pollution exposure inequality in Massachusetts. Environ. Res. 2018, 161, 76–86. [Google Scholar] [PubMed]
  35. Liu, J.C.; Peng, R.D. Health effect of mixtures of ozone, nitrogen dioxide, and fine particulates in 85 US counties. Air Qual. Atmos. Health 2018, 11, 311–324. [Google Scholar]
  36. Al-Hemoud, A.; Al-Dousari, A.; Al-Shatti, A.; Al-Khayat, A.; Behbehani, W.; Malak, M. Health impact assessment associated with exposure to PM10 and dust storms in Kuwait. Atmosphere 2018, 9, 6. [Google Scholar]
  37. Carugno, M.; Consonni, D.; Bertazzi, P.A.; Biggeri, A.; Baccini, M. Temporal trends of PM10 and its impact on mortality in Lombardy, Italy. Environ. Pollut. 2017, 227, 280–286. [Google Scholar] [PubMed]
  38. Rovira, J.; Domingo, J.L.; Schuhmacher, M. Air quality, health impacts and burden of disease due to air pollution (PM10, PM25, NO2 and O3): Application of Air Q+ model to the Camp de Tarragona County (Catalonia, Spain). Sci. Total Env. 2020, 703, 135538. [Google Scholar]
  39. Azimi, M.; Feng, F.; Yang, Y. Air pollution inequality and its sources in SO2 and NOx emissions among Chinese provinces from 2006 to 2015. Sustainability 2018, 10, 367. [Google Scholar]
  40. Tucker, K.A. A Breath of Polluted Air: How Indiana’s air pollution policies are impacting its citizens. Ind. Health L. Rev. 2020, 17, 339. [Google Scholar] [CrossRef]
  41. Xue, J.; Xu, Y.; Zhao, L.; Wang, C.; Rasool, Z.; Ni, M.; Wang, Q.; Li, D. Air pollution option pricing model based on AQI. Atmos. Pollut. Res. 2019, 10, 665–674. [Google Scholar]
  42. Air Quality Assessment Division of Office of Air Quality Planning and Standards. Technical Assistance Document for the Reporting of Daily Air Quality—The Air Quality Index (AQI), U.S. Environmental Protection Agency (USEPA), 2018, EPA 454/B-18-007. Available online: https://www.epa.gov/outdoor-air-quality-data/how-aqi-calculated (accessed on 10 April 2021).
  43. Moradzadeh, R. The challenges and considerations of community-based preparedness at the onset of COVID-19 outbreak in Iran, 2020. Epidemiol. Infect. 2020, 148, e82. [Google Scholar]
  44. Broomandi, P.; Karaca, F.; Nikfal, A.; Jahanbakhshi, A.; Tamjidi, M.; Kim, J.R. Impact of COVID-19 event on the air quality in Iran. Aerosol Air Qual. Res. 2020, 20, 1793–1804. [Google Scholar]
  45. Aghashariatmadari, Z. The effects of COVID-19 pandemic on the air pollutants concentration during the lockdown in Tehran, Iran. Urban Clim. 2021, 38, 100882. [Google Scholar]
  46. Nassiri, H.; Mohammadpour, S.I.; Dahaghin, M. How do the smart travel ban policy and intercity travel pattern affect COVID-19 trends? Lessons learned from Iran. PLoS ONE 2022, 17, e0276276. [Google Scholar] [CrossRef]
  47. Khalesi, B.; Daneshvar, M.R.M. Comprehensive temporal analysis of temperature inversions across urban atmospheric boundary layer of Tehran within 2014–2018. Model. Earth Syst. Environ. 2020, 6, 967–982. [Google Scholar]
  48. Berman, J.D.; Ebisu, K. Changes in US air pollution during the COVID-19 pandemic. Sci. Total Env. 2020, 739, 139864. [Google Scholar] [CrossRef]
  49. Gautam, S. COVID-19: Air pollution remains low as people stay at home. Air Qual. Atmos. Health 2020, 13, 853–857. [Google Scholar] [CrossRef]
  50. Fattorini, D.; Regoli, F. Role of the chronic air pollution levels in the COVID-19 outbreak risk in Italy. Environ. Pollut. 2020, 264, 114732. [Google Scholar] [CrossRef]
  51. Wang, Q.; Li, S. Nonlinear impact of COVID-19 on pollutions–Evidence from Wuhan, New York, Milan, Madrid, Bandra, London, Tokyo and Mexico City. Sustain. Cities Soc. 2021, 65, 102629. [Google Scholar] [CrossRef]
  52. Jandacka, D.; Durcanska, D. Seasonal Variation, Chemical Composition, and PMF-Derived Sources Identification of Traffic-Related PM1, PM2.5, and PM2.5–10 in the Air Quality Management Region of Žilina, Slovakia. Int. J. Environ. Res. Public Health 2021, 18, 10191. [Google Scholar]
  53. Pant, P.; Harrison, R.M. Estimation of the contribution of road traffic emissions to particulate matter concentrations from field measurements: A review. Atmos. Environ. 2013, 77, 78–97. [Google Scholar] [CrossRef]
  54. Wang, S.; Kaur, M.; Li, T.; Pan, F. Effect of Different Pollution Parameters and Chemical Components of PM2.5 on Health of Residents of Xinxiang City, China. Int. J. Environ. Res. Public Health 2021, 18, 6821. [Google Scholar]
  55. WHO. Air Quality Guidelines; World Health Organization, Regional Office for Europe: Copenhagen, Denmark, 2000. [Google Scholar]
  56. Givehchi, R.; Arhami, M.; Tajrishy, M. Contribution of the Middle Eastern dust source areas to PM10 levels in urban receptors: Case study of Tehran, Iran. Atmos. Environ. 2013, 75, 287–295. [Google Scholar] [CrossRef]
  57. Venter, Z.S.; Aunan, K.; Chowdhury, S.; Lelieveld, J. COVID-19 lockdowns cause global air pollution declines. Proc. Natl. Acad. Sci. USA 2020, 117, 18984–18990. [Google Scholar] [CrossRef]
  58. Ghiasi, B.; Alisoltani, T.; Jalali, F.; Tahsinpour, H. Effect of COVID-19 on transportation air pollution by moderation and mediation analysis in Queens, New York. Air Qual. Atmos. Health 2022, 15, 289–297. [Google Scholar]
  59. Adam, M.G.; Tran, P.T.; Balasubramanian, R. Air quality changes in cities during the COVID-19 lockdown: A critical review. Atmos. Res. 2021, 264, 105823. [Google Scholar] [PubMed]
  60. Naqvi, H.R.; Datta, M.; Mutreja, G.; Siddiqui, M.A.; Naqvi, D.F.; Naqvi, A.R. Improved air quality and associated mortalities in India under COVID-19 lockdown. Environ. Pollut. 2021, 268, 115691. [Google Scholar] [CrossRef] [PubMed]
  61. Jephcote, C.; Hansell, A.L.; Adams, K.; Gulliver, J. Changes in air quality during COVID-19 ‘lockdown’in the United Kingdom. Environ. Pollut. 2021, 272, 116011. [Google Scholar] [PubMed]
  62. Wang, M.; Liu, F.; Zheng, M. Air quality improvement from COVID-19 lockdown: Evidence from China. Air Qual. Atmos. Health 2021, 14, 591–604. [Google Scholar] [CrossRef]
  63. Singh, R.P.; Chauhan, A. Impact of lockdown on air quality in India during COVID-19 pandemic. Air Qual. Atmos. Health 2020, 13, 921–928. [Google Scholar]
  64. Lian, X.; Huang, J.; Huang, R.; Liu, C.; Wang, L.; Zhang, T. Impact of city lockdown on the air quality of COVID-19-hit of Wuhan city. Sci. Total Environ. 2020, 742, 140556. [Google Scholar]
  65. Menut, L.; Bessagnet, B.; Siour, G.; Mailler, S.; Pennel, R.; Cholakian, A. Impact of lockdown measures to combat COVID-19 on air quality over western Europe. Sci. Total Environ. 2020, 741, 140426. [Google Scholar] [CrossRef]
  66. Mahato, S.; Pal, S.; Ghosh, K.G. Effect of lockdown amid COVID-19 pandemic on air quality of the megacity Delhi, India. Sci. Total Environ. 2020, 730, 139086. [Google Scholar] [CrossRef]
  67. Nakada, L.Y.K.; Urban, R.C. COVID-19 pandemic: Impacts on the air quality during the partial lockdown in São Paulo state, Brazil. Sci. Total Environ. 2020, 730, 139087. [Google Scholar]
Figure 1. Study area and location of monitoring stations.
Sustainability 14 16313 g001
Figure 2. Main meteorological variables at Tehran synoptic station during the COVID-19 pandemic, (a) maximum and minimum mean temperature with mean temperature, (b) mean daylight and sunshine hours, (c) mean monthly rainfall and number of rainy days, and (d) mean wind speed.
Sustainability 14 16313 g002
Figure 3. (a) Distribution map of maximum, minimum and mean of monthly CO concentration at each station and (b) spatial distribution of variations in the mean monthly CO concentration in 2020 compared to 2019.
Sustainability 14 16313 g003aSustainability 14 16313 g003b
Figure 4. (a) Distribution map of mean monthly NO2 concentration at each station and (b) spatial distribution of variations in the mean monthly NO2 concentration in 2020 compared to 2019.
Sustainability 14 16313 g004aSustainability 14 16313 g004b
Figure 5. (a) Distribution map of the mean monthly PM10 concentration at each station and (b) spatial distribution of variations in the mean monthly PM10 concentration in 2020 compared to 2019.
Sustainability 14 16313 g005aSustainability 14 16313 g005b
Figure 6. (a) Distribution map of mean monthly O3 concentration at each station and (b) spatial distribution of variations in the mean monthly O3 concentration in 2020 compared to 2019.
Sustainability 14 16313 g006aSustainability 14 16313 g006b
Figure 7. (a) Distribution map of mean monthly SO2 concentration at each station and (b) spatial distribution of variations in the mean monthly SO2 concentration in 2020 compared to 2019.
Sustainability 14 16313 g007aSustainability 14 16313 g007b
Figure 8. AQI index among investigated stations in 2019 and 2020.
Sustainability 14 16313 g008
Figure 9. (a) Distribution map of the mean monthly AQI concentration at each station and (b) spatial distribution of variations in the mean monthly AQI concentration in 2020 compared to 2019.
Sustainability 14 16313 g009aSustainability 14 16313 g009b
Table 1. The attained p-value on air quality indices across Tehran.
IndexSO2CONO2PM10O3AQI
Month
January<0.050.120.120.410.71<0.05
February<0.050.620.430.540.98<0.05
March<0.050.23<.05<0.050.40<0.05
April<0.050.57<.050.200.70<0.05
May<0.050.520.130.300.180.65
June<0.050.810.63<0.05<0.05<0.05
July<0.050.530.87<0.050.120.18
August<0.050.820.170.22<0.05<0.05
September<0.050.820.170.22<0.05<0.05
October<0.050.510.190.54<0.050.44
November<0.05<0.050.22<0.050.640.44
December<0.05<0.05<0.050.210.33<0.05
Mean annual<0.050.70.410.110.35<0.05
Table 2. Summary of recent studies on COVID-19 effect on air pollution.
StudyStudy AreaFindings
This articleTehranCO significantly reduced in December and November
NO2 did not decrease sharply at the stations, but the daily mean concentration in March, April and December has significantly decreased.
PM10 concentration increased in March, June, July, and November
O3 has increased in June, August, September, and October.
Mean annual and monthly SO2 increased.
Mean annual AQI has decreased.
[58]New YorkPM2.5 and NO2 has decreased. O3 has increased.
[59]GlobalPrimary air pollutants have reduced.
Secondary PM and O3 has increased in some cities.
[60]IndiaAQI has improved and the tropospheric NO2 and O3 have reduced.
[61]United KingdomNO2 and PM2.5 concentrations have reduced.
[62]ChinaPM2.5, PM10, SO2, NO2, and CO have decreased
[63]IndiaPM2.5, NO2, and AQI over Delhi, Mumbai, Hyderabad, Kolkata, and Chennai have declined.
[64]WuhanAQI has decreased significantly.
NO2 has decreased, but O3 has increased significantly.
[65]Western EuropeNO2 has decreased considerably. PM has reduced relatively.
[66]DelhiPM10, PM2.5 NO2, and CO have reduced.
The central and Eastern Delhi have experienced maximum improvement in air quality.
[67]São PauloCO, NO, and NO2 have decreased. O3 has increased.
Publisher’s Note: MDPI stays neutral with regard to jurisdictional claims in published maps and institutional affiliations.

