Article

Municipal Solid Waste Collection and Haulage Modeling Design for Lahore, Pakistan: Transition toward Sustainability and Circular Economy

1
Sustainable Development Study Center (SDSC), Government College University, Lahore 54000, Pakistan
2
Lahore Waste Management Company (LWMC), Government of the Punjab, Lahore 54000, Pakistan
3
Department of Urban Studies and Planning, Massachusetts Institute of Technology (MIT), Cambridge, MA 02139, USA
4
The Urban Unit, Planning & Development Department, Government of the Punjab, Lahore 54000, Pakistan
5
Department of Pharmacy, University of Huddersfield, Huddersfield HD13DH, UK
6
Department of Chemical Sciences, University of Huddersfield, Huddersfield HD13DH, UK
*
Author to whom correspondence should be addressed.
Sustainability 2022, 14(23), 16234; https://doi.org/10.3390/su142316234
Submission received: 20 October 2022 / Revised: 28 November 2022 / Accepted: 29 November 2022 / Published: 5 December 2022
(This article belongs to the Collection Waste Management towards a Circular Economy Transition)

Abstract

:
Municipal solid waste management (MSWM) is a critical administrative, environmental and financial issue in low-income countries, such as Pakistan, where waste collection efficiency is less than 75% in all urban areas, except Lahore. Therefore, it is pertinent to develop practical decision-making tools to enhance waste collection efficiency by local municipalities and waste management companies (WMCs). A tool/calculator, holistically measure analyze forecast honestly (HMAFH), is proposed for waste collection in urban areas based on the lessons learned. The tool was developed considering local conditions, i.e., business environment, socio-economic and cultural dynamics, city infrastructure and stakeholders’ desires. It is flexible to various proposed waste collection modes, with heterogeneous fleet choices, and it presents an opportunity to integrate collection with a material recovery facility (MRF) or direct haulage to the disposal site. The HMAFH was tested successfully in the Lahore district. Based on the proposed scenarios, the result shows a material recovery of up to 33% by defining dedicated waste collection streams with a 26% saving on fuel. The proposed interventions can prove to be a defining step toward building a circular economy (CE) that allows the integration of treatment options with economic potential to account for 35% of the current operating expenditures and a reduction in greenhouse gases (GHGs) emission, i.e., 1,604,019 tons of CO2-eq./annum.

1. Introduction

Solid waste management (SWM) is essential in cleaning up the environment if managed technically, efficiently and smartly in synch with local market trends. Technical innovation in the SWM sector can perform a pivotal role in improving the efficiency of services and environmental sustainability by assisting the local municipalities, waste management companies (WMCs), relevant stakeholders and citizens toward the quality of life [1]. Various models are being practiced in the SWM sector considered as decision-making tools, i.e., the cost–benefit analysis (CBA), life cycle analysis (LCA) perspective, geographic information system (GIS) in combination with the technique for order of preference by similarity to ideal solution (TOPSIS) [2] and multi-criteria decision making (MCDM). A multi-objective optimization model was implemented in the southeastern part of Tehran city. The result showed a 27% lower environmental impact, particularly in terms of recycling and waste-to-energy (WtE) technologies [3]. The integrated solid waste management (ISWM) approach effectively streamlines and integrates different waste components, i.e., transfer, recycling, treatment and final disposal [4]. The ISWM model for Tehran (Iran) was developed by applying the mixed-integer linear programing (MILP) technique to minimize the waste haulage cost [5]. The route optimization model for bulk waste collection, i.e., construction and demolition (C&D), was designed based on a simheuristic approach, which guides policymakers to allocate, haul and recycle C&D waste accurately [6]. The coordinated solid waste management (CSWM) multiple objective functions approach can be applied for sustainable vehicle route optimization. The adaptive memory social engineering optimizer (AMSEO) application is more effective for route optimization as compared to simulated annealing (SA) and social engineering optimizer (SEO) [7]. A multi-objective mathematical model is a decision-making tool, which guides the integration location, fleet route and inventory control. This tool improves the overall waste management structure by minimizing the impacts of hazardous waste handling [8]. Most models meet the criteria of sustainability’s three dimensions, i.e., environmental responsibility, economic performance and acceptance by the general public/social equity. However, the current models require fundamental sustainability objectives, including public consultation, stakeholders’ involvement, the informal waste sector and problem identification based on local dynamics [9]. The success of the MSWM model is linked to public education to streamline the local system, which will facilitate the creation of ownership among citizens. Community involvement is the key to achieving cost-effective solutions based on local demands, which sustain the MSWM operations [10]. Integrated SWM with a holistic approach is essential for the new model’s success in middle and low-income countries. Clustering criteria are considered a more effective dimension of sustainability for the design of a new model. Sometimes, multi-sustainability dimensions are applied to obtain the desired results, where an assessment of the system is not possible under clustering criteria [11].
Developed countries have adopted methodologies for reducing waste generation, recycling, waste-to-energy and discouraging the landfill site concept [12]. As a result, an optimal configuration and increase in the degree of recycling/material recovery facility (MRF), composting and refuse-derived fuel (RDF) production can lead the sector toward sustainability with an increase in net profit cost in low-income countries [13]. Moreover, the recovery of recyclable components and composting from an organic proportion of waste are more suitable treatment options than incineration, waste-to-energy and landfilling in Asian countries [14]. The primary issue in developing countries is the low waste collection efficiency and dedication of all efforts to removing waste from central areas and roads. Normally, it is merely the shifting of waste from residential and commercial places to any remote site for disposal without considering the waste as a resource [15]. Anthropogenic activities are responsible for about 20% of the CH4 emission globally from waste disposal facilities. East Asia and the sub-continent countries emit 446–884 and 1328 kg of CH4 per hour according to the estimates [16]. Cleaning services are legally essential, while local municipalities and WMCs are bound to provide regular SWM services. However, its implementation can improve if financial constraints and technical capacity improve in low-income countries. Cities in low-income countries consume about 20% to 50% of their municipal budget on solid waste handling [17]. The engagement of the private sector/public–private partnership (PPP) for outsourcing some components of SWM services can provide local solutions. Still, local municipalities’ technical and administrative capacity issues hinder them from performing an active role as “clients”, which impedes the desired results [18]. Low-income countries can improve the SWM system by adopting the experience in waste collection and treatment technologies from developed nations [19] by applying modification based on local conditions.
Pakistan generates an estimated 20 million tons of waste per annum with a 2.4% annual growth rate. Waste collection services in Pakistan range from 34 to 84% in urban areas, with no recovery of recyclables at a formal level. The informal waste sector is active in Karachi, with a 26% recovery of recyclables. The average per ton waste collection cost for urban areas in the country is PKR 4794 [20]. All metropolitan cities are facing severe waste concerns, and heaps are found scattered alongside roads and streets due to a lack of urban planning, public education and poor infrastructure of SWM. Municipalities in low-income countries spend 50% of their budget on essential municipal services [21]. The sustainability of the SWM sector in the country will strengthen the economy in terms of gaining self-sufficiency in fertilizer and power/energy sectors, i.e., compost and biogas production from organic waste. The foreign debt of Pakistan has been reported as 39.7% of the gross domestic product (GDP) and held responsible for downsizing the country’s economy [22]. Therefore, the SWM sector has the potential to help the government shed the debt burden on the power/energy and fertilizer sectors, which comprise a significant component of foreign debt [23]. The debt of Pakistan has surged to USD 130.2 billion. Therefore, the federal government should explore an innovative approach, i.e., investment in the waste/climate change sector by declaring it a national instrument to pay off the debt. Low-income countries, including Pakistan, must focus on the SWM sector from a circular economy perspective and utilize the opportunity to use the sector’s welfare to pay the outstanding national foreign debt and explore voluntary transaction programs for future investment in the industry [24]. This can initiate the country’s sustainable economic growth by mobilizing domestic spending to protect the common global asset of the “environment”, which will sustain life on earth [25].
Reviewing the existing literature on solid waste collection, route optimization, related treatment options and technology helps in designing the model for Pakistan based on local conditions. Researchers deployed various methodologies with novel interventions to resolve the constraints to upgrade the MSWM system a step ahead. Different criteria, including parameters, were used to develop models (Table 1), i.e., spatial multi-criteria evaluation, multi-echelon logistics network, second-order disjoint factor analysis, Internet of Things (IoT), priority considered green vehicle routing problem (PCGVRP) model, global positioning system/geographic information system (GPS/GIS) sensitivity analysis, modified capacitated clustering approach, mixed-integer programing (MIP) model, techniques for order of preference by similarity to the ideal solution with GIS and bi-objective mixed-integer linear programing (MILP) model. Developing a local tool to address the issue requires the integration of all aspects (Table 1) together to achieve the desired results. Therefore, there was a need to integrate all the required 17 aspects/parameters into one tool for ease of local municipalities/WMCs. After a review of the existing literature, there was a need to incorporate all the required parameters into a single study, e.g., C&D waste collection [26], green waste collection, sludge collection, color coding of the heterogeneous fleet for dedicated streams [27], integration of waste collection modes with other private entities, working shifts, mechanical sweeping and washing component [28], stakeholders’ input, especially waste scavengers’ business interest, real-world implication, calculation of equipment and allied staff, i.e., drivers, helpers and workers. Municipalities and WMCs in Pakistan are responsible for providing all the explained services; therefore, there was a need for a tool/model to cover all aspects to enhance the local capacity for the assessment of the required resources.
Abbreviations used in Table 1 are described/explained in Table 2.
Therefore, there was a need to design a tool locally to integrate all aspects of MSWM, as depicted in Figure 1, as the dynamics of local waste handling are very different from other developing and developed countries. The idea of a novel MSWM tool/model was perceived from a literature review of the existing waste collection and haulage models. Therefore, there was a need for a hybrid/MCDM approach, i.e., a waste collection model based on local practical experience and waste treatment options based on technically advanced and environmentally friendly/green technologies from developed countries. The model will provide a base for the sector’s sustainability [38] with sound technical solutions to enhance the capacity of local municipalities [39] and WMCs. Therefore, policymakers, relevant stakeholders, national and foreign lenders should lead the sector’s sustainability by executing the proposed model in developing countries, such as Pakistan. In addition, dedicated waste collection streams will recover good quality recyclables [40] and reduce operational costs, including landfill [41], with a favorable climate impact, i.e., reduction in GHGs emissions. The model will also guide the politicians to invest and focus on local capacity building of municipalities [17] rather than outsourcing waste collection services as a lesson learned from international outsourcing of SWM services in Lahore, Rawalpindi and Karachi. The local market’s capacity has now developed to provide the appropriate equipment and machinery required to perform waste collection and haulage services [20]. Therefore, involving the private sector in waste treatment and disposal functions based on the PPP modality is more relevant for enhancing the local capacity for environmental sustainability [42,43]. These interventions will also help upgrade the linear waste economy to a circular economy in the country [44].
Even the local municipalities in Pakistan regard solid waste collection as a liability. The study’s primary objective (Figure 1) is to increase the waste collection efficiency of the MSW collection system in the country by proposing a tool that will help local municipalities and WMCs assess the required resources accurately based on local conditions and wisdom. A heterogeneous fleet with dedicated waste collection streams, i.e., residential, commercial, private entities and bulk material, will help deploy resources efficiently and recover recyclables by initiating the circular economy concept in waste management. It will help in effective waste collection with proposed interventions [45]/dedicated waste streams to save fuel and assist in the recovery of recyclables. This study will also prove that “waste is an asset and resource” [46] and can play an essential role in the sustainability of the sector in the context of a circular economy.
Pakistan has observed the worst flooding during the latest monsoon due to negative climatic impacts, which caused damage to humans, property, agriculture and the native ecosystem [47]. Moreover, it is a fact that developing countries, such as Pakistan, are most dependent on foreign debt to gain economic stability to meet internal development goals. The sector has an excellent potential to strengthen the economy of Pakistan by focusing on waste treatment and its scientific disposal to produce energy and alternative fertilizers, i.e., WtE, biogas and compost, respectively. Developed nations and multilateral lenders can guide low-income countries, such as Pakistan, to upgrade the sector toward a circular economy by achieving GHGs emission reduction targets through voluntary transaction with a transfer of green technology according to the climate change agenda.

2. Materials and Methods

The existing literature on the subject was studied in detail to define the criteria for the proposed model. The data suggested that the available SWM models are more suitable for developed countries and require some modification for replication in developing countries due to local conditions, including financial, industrial capacity and practicability constraints. Furthermore, the waste treatment options and technologies should be compatible with allied stakeholders’ interests. Therefore, the proposed model is based on a solid desire to present such design/tool, which covers the aspects of local socio-economic, cultural, environmental and stakeholder consultation and acceptance by the community. The data on current SWM practice, i.e., waste characteristics, generation rate, fleet quantity and working methodology, were collected from the Lahore Waste Management Company (LWMC) [48] and allied departments. Subsequently, after a detailed data analysis, a new model was designed and translated into a calculator named the holistically measure analyze forecast honestly (HMAFH) to help enhance the capacity of local municipalities and WMCs by perceiving ideas from the tri-echelon logistics network and transportation system [4,5]. A multi-sustainability dimensional [2]/hybrid approach was applied to develop a novel model for the urban areas of Pakistan.
The generated waste is categorized into two main components, i.e., municipal waste and bulk waste. Municipal waste is further categorized into residential, commercial and private entities, i.e., residential housing societies, including institutes [49]. Two modes of waste collection with heterogeneous fleet options are proposed for waste collection from the identified waste streams. It is proposed that the collected waste be hauled at the transfer station or MRF. The nature of bulk waste differs from municipal waste [50]. A relevant compatible fleet is proposed to collect waste from the source for further haulage to the transfer station with the option for direct haulage to the landfill site. Dumper vehicles and trailers are proposed for collecting waste from the transfer stations and MRF (residual waste) and hauling it to the landfill site for final disposal. A systemic flow chart for an overview of the waste collection model is depicted in Figure 2.
The concept for the parameters and variables used to design the current model/tool is perceived from the mathematical model [3] and depicted in Table 3.
The equations used to create the MSW collection and haulage model are explained and converted into a calculator/tool. The design parameters and variables are flexible [3] to adjust for the future needs of the cities accordingly. The equations used to develop the waste collection and haulage model are as follows.

2.1. Solid Waste Generation Estimates

The waste generation of the area is calculated in kilograms per day [51] and tons per day [52,53].
S W G ( k g d ) = P × R
S W G ( t d ) = P × R 1000
where SWG(t/d) is the solid waste generation in tons per day.

2.2. Major Components of Solid Waste

Solid waste generation is divided into two main components: municipal waste and bulk waste [54].
M W ( c o m p o n e n t ) ( t d ) = S W G ( t d ) × % M W  
B W ( c o m p o n e n t ) ( t d ) = S W G ( t d ) × % B W  
  • Waste Generation Estimates for Commercial Areas
C W ( t d ) = C W ( s m ) + C W ( m m ) + C W ( l m ) + C W ( x l m )  
C W ( s m ) = N ( e n t i t y ) × S ( s m )  
C W ( m m ) = N ( e n t i t y ) × S ( m m )  
C W ( l m ) = N ( e n t i t y ) × S ( l m )  
C W ( x l m ) = N ( e n t i t y ) × S ( x l m )  
  • Waste Generation Estimates for Housing Societies
H S ( t d ) = H H ( h s ) ( n ) × H H ( h s ) ( s z ) × ( R × % M W )  
  • Waste Generation Estimates for Residential Municipal Solid Waste [55]
R ( M W ) ( t d ) = M W ( c o m p o n e n t ) ( t d ) ( C W ( t d ) + H S ( t d ) )  
  • Door-to-Door Waste Collection and Container-Based Collection [56,57]
D t D ( t d ) = % D t D × R ( M W ) ( t d )  
C B C ( t d ) = % C B C × R ( M W ) ( t d )  
  • Model for Door-to-Door and Container-Based Collection
Q t y ( c 25 m 3 ) D t D = D t D ( c 25 m 3 ) % ÷ ( v c × t r i p s )  
D t D ( c 25 m 3 ) % = D t D ( m ) × % ( c 25 m 3 ) D t D  
Q t y ( c 13 m 3 ) D t D = D t D ( c 13 m 3 ) % ÷ ( v c × t r i p s )  
D t D ( c 13 m 3 ) % = D t D ( m ) × % ( c 13 m 3 ) D t D  
Q t y ( c 7 m 3 ) D t D = D t D ( c 7 m 3 ) % ÷ ( v c × t r i p s )  
D t D ( c 7 m 3 ) % = D t D ( m ) × % ( c 7 m 3 ) D t D  
Q t y ( m d 1 m 3 ) D t D = D t D ( m d 1 m 3 ) % ÷ ( v c × t r i p s )  
D t D ( m d 1 m 3 ) % = D t D ( m ) × % ( m d 1 m 3 ) D t D  
Q t y ( m d 2.5 m 3 ) = D t D ( m d 2.5 m 3 ) % ÷ ( v c × t r i p s )  
D t D ( m d 2.5 m 3 ) % = D t D ( m ) × % ( m d 2.5 m 3 ) D t D  
Q t y ( c 7 m 3 ) c b c = c b c ( c 7 m 3 ) % ÷ ( v c × t r i p s )  
c b c ( c 7 m 3 ) % = c b c ( m ) × % ( c 7 m 3 ) c b c  
Q t y ( c 13 m 3 ) c b c = c b c ( c 13 m 3 ) % ÷ v c × t r i p s  
c b c ( c 13 m 3 ) % = c b c ( m ) × % ( c 13 m 3 ) c b c  
Q t y ( c a r 5 m 3 ) c b c = c b c ( c a r 5 m 3 ) % ÷ v c × t r i p s  
c b c ( c a r 5 m 3 ) % = c b c ( m ) × % ( c a r 5 m 3 ) c b c  
Q t y ( t l ) c b c = Q t y ( c a r 5 m 3 ) c b c ÷ ( + / + )  
The idea to calculate the number of containers was perceived from integer variables [56,58].
Q t y ( w s c 0.8 m 3 ) c b c = c b c ( t d ) × [ % ( c 13 m 3 ) c b c + % ( c 7 m 3 ) c b c ) ]   y × 1000 ÷ c ( w s c )
Q t y ( w s c 5 m 3 ) c b c = c b c ( t d ) × % ( c a r 5 m 3 ) c b c × 1000 ÷ c ( w s c )
  • Model for Commercial Waste Collection
Q t y ( c a r 5 m 3 ) c w = c w ( c a r 5 m 3 ) % ÷ ( v c × t r i p s )  
c w ( c a r 5 m 3 ) % = C W ( t d ) × % ( c a r 5 m 3 ) c w  
Q t y ( c 25 m 3 ) c w = c w ( c 25 m 3 ) % ÷ ( v c × t r i p s )  
c w ( c 25 m 3 ) % = C W ( t d ) × % ( c 25 m 3 ) c w  
Q t y ( c 13 m 3 ) c w = c w ( c 13 m 3 ) % ÷ ( v c × t r i p s )  
c w ( c 13 m 3 ) % = C W ( t d ) × % ( c 13 m 3 ) c w  
Q t y ( c 7 m 3 ) c w = c w ( c 7 m 3 ) % ÷ ( v c × t r i p s )  
c w ( c 7 m 3 ) % = C W ( t d ) × % ( c 7 m 3 ) c w  
Q t y ( w s c 5 m 3 ) c w = c w ( t d ) × % ( c a r 5 m 3 ) c w × 1000 ÷ c ( w s c )  
Q t y ( w s c 0.8 m 3 ) c w = c w ( t d ) × [ % ( c 7 m 3 ) c w + % ( c 13 m 3 ) c w + % ( c 25 m 3 ) c w ] × 1000 ÷ c ( w s c )  
  • Model for Waste Collection from Housing Societies
Q t y ( c 25 m 3 ) h s = h s ( c 25 m 3 ) % ÷ ( v c × t r i p s )  
h s ( c 25 m 3 ) % = H S ( t d ) × % ( c 25 m 3 ) h s  
Q t y ( c 13 m 3 ) h s = h s ( c 13 m 3 ) % ÷ ( v c × t r i p s )  
h s ( c 13 m 3 ) % = H S ( t d ) × % ( c 13 m 3 ) h s  
Q t y ( c 7 m 3 ) h s = h s ( c 7 m 3 ) % ÷ ( v c × t r i p s )  
h s ( c 7 m 3 ) % = H S ( t d ) × % ( c 7 m 3 ) h s  
Q t y ( w s c 0.8 m 3 ) h s = h s ( w s c 0.8 m 3 ) % ÷ c ( w s c )  
h s ( w s c 0.8 m 3 ) % = ( H S ( t d ) × 1000 ) × % ( w s c 0.8 m 3 )  
Q t y ( w s c 5 m 3 ) h s = h s ( w s c 5 m 3 ) % ÷ c ( w s c )  
where Qty(wsc5m3)hs is the quantity of the 5 m3 waste storage containers for housing societies.
h s ( w s c 5 m 3 ) % = ( H S ( t d ) × 1000 ) × % ( w s c 5 m 3 )  
  • Model for Bulk Waste Collection
Q t y ( d 5 m 3 ) b w = b w ( d 5 m 3 ) % ÷ ( v c × t r i p s )  
b w ( d 5 m 3 ) % = B W ( c o m p o n e n t ) ( t d ) × % ( d 5 m 3 ) b w  
Q t y ( d 10 m 3 ) b w = b w ( d 10 m 3 ) % ÷ ( v c × t r i p s )  
b w ( d 10 m 3 ) % = B W ( c o m p o n e n t ) ( t d ) × % ( d 10 m 3 ) b w  
Q t y ( t t 5 m 3 ) b w = b w ( t t 5 m 3 ) % ÷ ( v c × t r i p s )  
b w ( t t 5 m 3 ) % = B W ( c o m p o n e n t ) ( t d ) × % ( t t 5 m 3 ) b w  
Q t y ( t l ) b w = [ Q t y ( d 5 m 3 ) b w + ( Q t y ( d 10 m 3 ) b w + ( Q t y ( t t 5 m 3 ) b w ) ] ÷ + / +
Q t y ( e x c v ) b w = [ Q t y ( d 25 m 3 ) b w + Q t y ( d 10 m 3 ) b w + Q t y ( t t 5 m 3 ) b w ] ÷ | u n c e r t .
Q t y ( f n d ) b w = [ Q t y ( d 5 m 3 ) b w + Q t y ( d 10 m 3 ) + Q t y ( t t 5 m 3 ) b w ] ÷ | u n c e r t .
  • Model for Waste Haulage from Transfer Station/Facility to Landfill Site
Q t y ( d 25 m 3 ) m w ( t s ) = M W ( C o m p o n e n t ) ( t d ) ÷ ( v c × t r i p s )  
Q t y ( d 25 m 3 ) b w ( t s ) = B W ( C o m p o n e n t ) ( t d ) ÷ ( v c × t r i p s )  
Q t y ( e x c v ) t s = [ Q t y ( d 25 m 3 ) m w ( t s ) + d ( 25 m 3 ) b w ( t s ) ] ÷ + / +
Q t y ( f n l ) t s = [ Q t y ( d 25 m 3 ) m w ( t s ) + Q t y ( d 25 m 3 ) b w ( t s ) ] ÷ + / +

2.3. Mechanical Sweeping and Washing

Mechanical sweeping and washing are essential aspects of cleanliness in urban areas. The vacuum/mechanical sweeping function will help to collect the dust along road dividers/medians and footpaths, and washing monuments will improve the city’s aesthetics.
Q t y ( v s 4 m 3 ) m s = % ( v s 4 m 3 ) m s × m s v s 4 m 3 ( v c s )  
Q t y ( v s 6 m 3 ) m s = % ( v s 6 m 3 ) m s × m s v s 6 m 3 ( v c s )  
Q t y ( w v 4500 l ) m w = % ( w v 4500 l ) m w × m w w v 4500 l ( v c s )  
Q t y ( w v 8000 l ) m w = % ( w v 8000 l ) m w × m w m v 8000 l ( v c s )  
Q t y ( m s m w ) m w = m w ( t a r g e t d ) / + / +

2.4. Environmental Modeling and Analysis of BAU and Proposed Scenarios

The assessment of greenhouse gases (GHGs) and short-lived climate pollutants (SLCPs) was performed by using the Emission Qualification Tool (EQT) developed by the Institute for Global Environmental Strategies (IGES), Japan [59]. The tool facilitated a rapid assessment of GHGs emissions and black carbon associated with solid waste for in-built features, i.e., business-as-usual (BAU), and offered alternative scenarios. In addition, an environmental analysis of transportation, composting, anaerobic digestion (AD), recycling, uncollected garbage, mixed waste landfilling and open burning was performed using the tool, as depicted in Figure 3. The basic functional unit for emissions estimation is kg of CO2-eq./ton; however, the global warming potential (GWP) also uses estimates from yearly collected waste in tons of CO2-eq. for assessment.

2.5. Economic Modeling and Analysis of Proposed Scenarios

The objective of the economic modeling [60] of the proposed municipal waste treatment options is to determine the cost of the establishment of the facility, its operations, related revenue from the sale of products and environmental benefits in terms of monetary value. The MRF will assist in revenue generation and the associated environmental benefits by diverting waste into three streams, i.e., compost [61], biogas and recovery of recyclables. Methane recovery at a landfill site will also help with the monetary benefit. The proposed interventions will ensure sustainability and serve as a step toward integrating the waste sector into the circular economy [62] (Figure 4).
The economic analysis of the proposed waste treatment options is performed in Pakistani Rupees (PKR) per ton by considering Equations (1)–(7) described in the economic modeling [20]. The economic value of biogas generation from anaerobic digestion (AD) is determined via Equation (71). Equations (72)–(74) and (75)–(78) assist in assessing the value of performing the cost–benefit analysis (CBA) and economic potential (EP) analysis, respectively. The parameters and variables used to design the economic model [63] are depicted in Table 4.
The equations used for economic modeling are as follows:
P t o n ( B g ) R e v = Q t y . m 3 / t ( B g ) p r o d × S P ( B g ) / m 3
T P t o n ( R & O c & B g ) R e v = P t o n ( R ) R e v + P t o n ( O c ) R e v + P t o n ( B g ) R e v
C B A ( a v g t ) S 1 = [ { P t o n ( R ) R e v + P t o n ( O c ) R e + P t o n ( C ) O c & R ( b e n e f i t ) } ÷ 3 ] P t o n ( F c )
C B A ( a v g t ) S 2 = [ { P t o n ( R ) R e v + P t o n ( O c ) R e v + P t o n ( B g ) R e v + P t o n ( C ) O c & R & B g ( b e n e f i t ) } ÷ 4 ] P t o n ( F c )
l f g ( e n v .   b e n e f i t / d ) = { P t o n ( C ) l f g ( b e n e f i t ) × Q t y . ( t d ) d w ( l f s ) }
EP . ( S 1 d ) = { C B A ( a v g t ) S 1 × Q t y . ( t d ) O c & R }
EP ( S 2 d ) = { C B A ( a v g t ) S 2 × Q t y . ( t d ) O c & R & B g }
EP ( S 3 d ) = { C B A ( a v g t ) S 2 × Q t y . ( t d ) O c & R & B g } + l f g ( b e n e f i t / d )

3. Results

3.1. Background

The Lahore district stretches over an area of 1772 km2, including the area jurisdiction of Lahore Cantonment Board (LCB) and Walton Cantonment Board (WCB) [64]. Lahore is the second largest city in Pakistan after Karachi, with a population of approximately 12 million and a population density of 6275 persons/km2 [65]. The city’s population increased from 6.3 million in 1998 to 11.1 million in 2017. The city’s urban area has increased by 68% since 1972, and more than 200 housing societies have been approved to meet the growing population’s demand. The built-up area has also increased, and more than 250 villages have been merged with the urban infrastructure. A recent city expansion has been observed in the southern and southwestern directions to accommodate the inhabitants [66]. Legally, the Metropolitan Corporation Lahore (MCL) is responsible for providing cleaning services, including manual sweeping, waste collection and treatment, along with its final disposal under the mandate and supervision of the Local Government and Community Development (LG&CD) department (Government of the Punjab). The MCL further entrusted the MSWM functions to the LWMC under the Services and Assets Management Agreement (SAAMA) signed on 25 June 2011. The LWMC further outsourced waste collection and its haulage services to two Turkish companies in November 2011 for seven (07) years at a cost of USD 320 million [48]. The LWMC is now performing the primary waste collection and haulage functions after terminating the previous contracts on 31 December 2020. Secondary waste collection services, i.e., collection and haulage of waste from the transfer station to the disposal facility, are outsourced locally to enhance the collection efficiency of the system (Figure 5).

3.2. Basic Information of City

Lahore city is divided administratively into nine towns with two cantonments (Figure 6a) and five revenue tehsils (Figure 6b). The city’s current population is approximately 12 million, with 291 miniature administrative setups, i.e., 274 union councils (UCs), 7 sectors and 10 wards [64]. Zone-1 to Zone-3 comprise three towns, each with 249 UCs. The Lahore district’s peripheral areas include Zone-4 with 25 UCs. Zone-5 and Zone-6 comprise the Cantonment Board areas based on area jurisdiction (Table 5).
It is proposed to divide the city into six zones for efficient waste collection and haulage to the temporary collection points (TCPs)/transfer stations, with final disposal at a designated landfill site (LFS). The zoning of the city was proposed based on contiguous features, infrastructure, local socio-economic conditions and area jurisdiction, i.e., Zone-1 to Zone-4 are under MCL and LWMC, while Zones-5 and 6 are under the area jurisdiction of the Cantonment Boards (Figure 7). The proposed zoning will also help monitor and decentralize services for the system’s sustainability.

3.3. Waste Collection and Haulage Model

The steps for designing a city waste collection and haulage model are explained as follows:
  • City basic information, i.e., town, zone, area, ward/union council and population of the area concerned.
  • City solid waste is further categorized into two main components, i.e., municipal and bulk waste components, and separate waste collection arrangements are proposed.
  • The collection of the municipal waste component is further sub-categorized into three collection streams, i.e., residential areas, commercial entities and private housing societies, with a dedicated heterogeneous fleet.
  • For the city of Lahore, two modes are proposed for residential waste collection, i.e., DtD and CBC.
  • The CBC mode with an option for semi-underground containers is proposed for commercial entities and housing societies of the city.
  • All waste collection streams will collect and haul the waste to the transfer station or MRF for further handling, i.e., segregation into recyclables and organic waste or direct haulage for waste disposal depending on the scenario.
The steps involved in the design of the proposed MSWM model are illustrated in Figure 8.
The solid waste generated by Lahore city is 6407 tons per day, with a waste generation rate of 0.54 kg/c/d [48]. The generated waste is categorized into two major components, i.e., municipal waste (71%) and bulk waste (29%). Municipal waste is further divided into three streams, i.e., commercial (14% of 71% municipal waste), housing societies (13% of 71% municipal waste) and residential (73% of 71% municipal waste). Residential waste collection is proposed via two modes, i.e., CBC (73% of 73% residential waste) and DtD waste collection (27% of 73% residential waste) (Figure 9).
Now, it is time to strengthen and sustain the SWM sector in Pakistan by adopting methodologies compatible with the local market and citizens’ desires. However, unfortunately, the waste collection efficiency was below 75% in almost all cities in Pakistan, except Lahore [20], where the nature of the waste collected is heterogeneous, without any separate arrangements for collection streams.

3.3.1. Municipal and Bulk Waste Components

The waste components are categorized into municipal and bulk waste [48] (Table 6). Bulk waste, i.e., non-combustible, animal waste/dung, construction and demolition (C&D) and green waste, is often mixed with municipal waste due to the non-availability of dedicated separate waste collection arrangements in the urban areas of low-income countries [67]. In addition, weak enforcement and lack of public education are also responsible for mixing both types of waste.
Dedicated waste collection arrangements can offer a more suitable choice, and the methodologies for both types of waste, i.e., municipal and bulk, are considered in the modeling to increase the system’s efficiency. The city’s historical data show the percentage of municipal and bulk waste components (Table 7). The quantity of bulk waste is reasonably high due to the presence of animal dung, C&D waste, green waste and sludge, as desilted by the local municipality.

3.3.2. Door-to-Door and Container-Based Collection

Three waste streams, i.e., residential, commercial/institutes and housing societies, are proposed for collecting municipal waste by considering local conditions. The model presents the collection methodology for residential waste through DtD and CBC modes (Figure 9). Considering the public acceptance, informal sector activities and local city infrastructure, DtD waste collection is proposed for 25% of the residential area and CBC for the remaining, i.e., 75%, of the area. (Table 8). The cantonment areas fall in the planned infrastructure category and have a well-defined enforcement mechanism; therefore, a 50% DtD and 50% CBC mode is a suitable option for collection.
The DtD waste collection mode is required based on the city infrastructure, acceptance by the residents and significant stakeholders, i.e., the informal waste sector/scavengers’ business in the area [68]. About 888 tons of household waste will be collected by the DTD mode regularly. Therefore, waste collection via the DtD mode will ensure the availability of recyclable material for the proposed treatment facilities. The local fleet market survey shows the availability of different fleets based on area accessibility to perform DtD collection. The fleet resources calculated to perform the DtD collection function are depicted in Figure 10—for example, compactor vehicles of 25 m3 and 13m3 on one trip/day, compactors of 7 m3 on two trips/day and mini-dumpers of 1 m3 and 2.5 m3 on three and two trips, respectively. Therefore, the resources suggest bearing in mind the local conditions, the desire of citizens and the bureaucratic and political opinion to clean the city by 10 am daily.
The CBC mode is more convenient for municipalities due to the deployment of communal storage bins/containers, which are accessible for citizens to dump waste. About 2440 tons of municipal waste, predominantly household waste, will be collected by the CBC mode on a daily basis. Citizens and the municipality’s crew will be responsible for transporting the garbage to the waste storage containers. In addition, the informal sector, i.e., scavengers, also segregates maximum recyclables from the containers. Therefore, this mode of waste collection is more cost effective than DtD for the municipalities and vice versa from an environmental aspect.
A heterogeneous fleet is proposed for the CBC mode, i.e., compactors with on-site container emptying and chain arm roll with hauled container system, based on the waste generation trend of the locality. The resources calculated to perform the CBC mode are depicted in Figure 11. Compactor vehicles, i.e., 7 m3, 13 m3 and 5 m3 chain arm roll vehicles, are proposed for three, two and five trips, respectively. The scheme of the CBC mode is depicted in Figure 12b.
The scheme of the DtD waste collection mode is depicted in Figure 12a.

3.3.3. Waste Collection from Commercial Entities

The city has 690 commercial entities [64] generating 640 tons/day of waste, as depicted in Figure 13a. The resources calculated for collecting waste from commercial areas are depicted in Figure 13b and Figure 13c. Compactor vehicles, i.e., 7 m3, 13 m3, 25 m3 and 5 m3 chain arm roll vehicles, are proposed for two, one, one and five trips, respectively. The scheme of commercial waste collection is depicted in Figure 13d.

3.3.4. Waste Collection from Private Entities

There are 265,374 households in private/cooperative housing societies in Lahore generating 609 tons of waste per day, as depicted in Figure 14a. Compactor vehicles, i.e., 13 m3 and 25 m3, are proposed for two and one trips, respectively. The quantity of the proposed fleet and waste storage containers for private entities’ waste collection mode is depicted in Figure 14b. Scheme of waste collection from housing societies is explained in Figure 14c.
Zone-wise areas are identified for DtD collection, CBC, and commercial and private entities of the city, as depicted in Figure 15a. The zone-wise proposed location of TCPs/transfer stations with centralized MRF is depicted in Figure 15b.

3.3.5. Bulk Waste Collection

The other component of MSWM is bulk waste. Bulk waste is part of municipal waste in low-income countries, and there is a need to devise dedicated arrangements for 1829 tons/day of waste collection with a specialized fleet (Figure 16a).
The resources calculated for bulk waste collection are depicted in Figure 17a. Hydraulic dumper vehicles of 5 m3, 10 m3, and a tractor trolley of 5 m3 can undertake four trips by each dumper and three visits by trolley per day.

3.3.6. Secondary Waste Collection (from Transfer Station/TCPs/Treatment Facility to Designated Disposal Site

Secondary collection, i.e., haulage of waste/residual waste after treatment, etc., is required for final disposal at the designated site. The scheme of the secondary waste collection mode is depicted in Figure 16b. The resources needed to collect and haul waste from TCPs/transfer station/treatment facility to the final disposal site are calculated and illustrated in Figure 17b. A hydraulic dumper of 25 m3 for three to six trips per day is an effective vehicle for waste haulage from the waste treatment facility based on the distance from the transfer station to a designated dumpsite. The quantity of excavator and front-end loader vehicles is proposed for an eight-hour working day.

3.3.7. Mechanical Sweeping and Washing (MS&MW)

The road mechanical sweeping and washing function is essential for cleaning services in megacities/urban areas. The road length is calculated to perform the operation depicted in Figure 18a. Its demand is high in metropolitan areas of low-income countries due to frequent littering of sand/soil on roads during the transportation of building materials for renovation/construction of buildings and city infrastructure—the resources required to perform that function, as depicted in Figure 18b. The roads identified to perform a mechanical sweeping and washing function are displayed on the city map (Figure 19).

3.4. Environmental and Economic Model

The integration of the waste treatment aspect [69] needs to be included in the existing scenario of SWM in the country, which will provide a step forward to achieving the desired goals. Therefore, dedicated waste collection streams are defined, i.e., residential, housing societies, commercial and bulk waste, to be integrated with the centralized material recovery facility (MRF) [13] for the sector’s sustainability. Based on the proposal, residential waste collection is performed via two modes, i.e., DtD and CBC, as the DtD mode is directly integrated with MRF, while CBC is integrated with LFS [70]. This methodology is proposed bearing in mind the business interest of the informal waste sector, which mainly depends on a communal waste storage system for picking/segregating recyclables. As suggested, the mixed waste collection methodology is favorable initially for residential areas based on public behavior, education level, waste perception, responsibility, ownership and the legal framework. Bulk waste haulage will be directed to a LFS, except for green waste, which is linked to improving the compost product quality. The proposed waste collection modes are integrated with MRF to recover recyclables and separate organic waste for its utilization at the compost and anaerobic digestion plant. The flow chart also depicts the potential market for material recovery and product use (Figure 20).
The proposed model [58] is based on local conditions, wisdom and practical experience in the SWM sector. Furthermore, the defined scenarios will allow executing the model in a phased manner within timelines to achieve the NDC targets. The centralized MRF will receive 1000 tons of mixed waste per day in Scenario-1 (Phase-A, Year 2024), and an extension of the facility will receive up to 2000 tons of waste per day in Scenarios-2 and 3 in Phases-B (Year 2025) and C (Year 2026), respectively (Figure 21).

3.4.1. Climate Impact of Existing and Proposed Models/Scenarios

Waste treatment options based on environmental aspects are discussed in three scenarios to propose a viable solution to strengthen the sector in Pakistan. Currently, waste is being collected and disposed of openly without any treatment as BAU. Based on the proposed treatment options, Scenario-3 is a more feasible choice for the city with composting, AD, recycling and landfill gas (LFG) recovery. It has the lowest net GHGs emissions, i.e., methane (CH4), black carbon (BC), carbon dioxide (CO2), nitrogen dioxide (N2O) and other SLCPs, as depicted in Figure 22. Therefore, Scenario-3 seems to be the most appropriate choice from an environmental perspective compared to Scenario-1 and Scenario-2.

3.4.2. Economic Modeling of Proposed Scenarios

A centralized MRF will facilitate the segregation of organic waste for composting and anaerobic digestion and will also help recover the recyclables, i.e., plastic, paper and cardboard, glass and metal. The detail of the costs (PKR) of operating the facility per day and ton [20] is depicted in Figure 23a,b, respectively, and the same summary is given in Figure 24a.
The revenue streams for economic analysis based on sales revenue and the environmental benefit/carbon credit from compost products, recyclables [20] and biogas for the proposed scenarios are depicted in Table 9.
The expected revenue from the sale of compost and recyclables (Scenario-1), compost, recyclables and biogas (Scenario-2 and Scenario-3), and related environmental benefit cost (PKR) per ton are depicted in Figure 24b.
The revenue cost, including environmental benefit, i.e., savings in emission reduction, is compared with the current operational price for BAU by translating it into potential economic cost per ton (Figure 25a). Therefore, based on the analysis, Scenario-3 is more economical and can provide 35% of the current operating expenditures of LWMC compared to Scenario-1 and Scenario-2, i.e., 33% and 31%, respectively (Figure 25b).
The environmental benefit cost per ton increases from Scenario-1 to Scenario-3 with the increase in capital investment cost/ton of the facility. The analysis of capital investment and related environmental benefit cost per ton shows that Scenario-3 is a more economical and environmentally friendly choice for the city (Figure 26).

4. Discussion

The fundamental issue related to MSWM in Pakistan is the gap in the professional capacity to design a practicable model and system for the municipal corporation, divisional, district and tehsil headquarters, even for rural settlements. Therefore, a comprehensive waste collection and haulage model will help the government replicate it in other urban areas of the country. The model was tested in Lahore based on local conditions and professional wisdom. The result shows that 33% (2138 tons/day) of total generated waste (6407 tons/day) or 42% of residential, commercial and society streams, excluding bulk waste, is available for MRF. Dedicated waste collection streams with a heterogenous fleet will ensure raw material availability for MRF to further segregate waste for compost, anaerobic digestion and recycling. The proposed intervention will allow a transition from a linear to a circular economy and the sustainability of the sector in Pakistan. The remaining waste will be hauled to the landfill site for final disposal (Figure 27).
The model’s parameters and variables rely on the local market and professional wisdom. For example, the volumetric capacity of the fleet and fuel average per kilometer were verified through a time and motion study [50] because local waste characteristics differ from developed countries based on socio-economic and cultural aspects [71]. Fuel consumption, volumetric fleet capacity, waste characteristics and generation rate are essential parameters for designing a new waste collection and haulage model. Therefore, the current waste generation rate and time and motion studies verify the design’s assumptions; a pictorial representation of the studies is shown in Figure 28. The fuel average of each vehicle per kilometer and the volumetric capacity (in tons) of the proposed fleet and storage containers are depicted in Figure 29.
The total GHGs emissions in Pakistan were 421.6 million tons of CO2-eq., as reported in 2018 [72]. The country is committed to reducing the projected GHGs emissions from BAU by up to 50%, i.e., 15% with in-house interventions and 35% with international support, by 2030 [73]. In the proposed model, three waste collection streams, i.e., DtD, commercial and societies, are linked with MRF, excluding the CBC mode, bearing in mind the interest of existing informal sector business. In the proposed model, scavengers can recover the recyclables from containers placed in the residential area for CBC, as per the BAU scenario. The MRF will support the formal transformation of the sector toward environmental and economic sustainability [74]/circular economy and provide a step toward integrating the informal sector with the formal one. Scenario-3 is a more feasible option from an environmental perspective, as it has the lowest net GHGs emissions based on technological choice. The model is intended for a phased-manner implementation by the country’s urban areas, i.e., executing Scenario-1 and then moving toward Scenario-2 and Scenario-3, to achieve the GHGs emission reduction targets. The proposed waste collection mode will save 7.7 kg of CO2-eq./ton emissions of GHGs compared to the BAU scenario. Composting, anaerobic digestion, recycling and LFG flaring have a net climate impact on GHGs of 192 kg of CO2-eq./ton, −238 kg of CO2-eq./ton, −796 kg of CO2-eq./ton and 474 kg of CO2-eq./ton, respectively. Open burning incidents at Lakhodair LFS and uncollected waste (12%) in the BAU scenario contribute 289 kg of CO2-eq./ton and 454 kg CO2-eq./ton net climate impact. Incineration in terms of Waste to Energy is not a suitable option [75] based on the characteristics of the MSW. Furthermore, highly calorific material from waste can be used as RDF. There is an excellent opportunity to utilize the raw material as a coal fuel substitute in the cement industry because importing coal will be banned in the future to achieve the targets defined in NDCs and Sustainable Development Goals (SDGs).
Currently, fuel consumption is reported as 39,920 L per day (Figure 30a) for performing primary and secondary waste collection by LWMC and the cantonments under BAU. However, based on the field studies, fuel consumption for a new model is calculated as 29,384 L per day (Figure 30b), with a 15% increase in tonnage compared to the BAU scenario. Therefore, the proposed MSWM model will save 26% on fuel expenditures (PKR 923 million/annum), with an opportunity to invest in establishing an MRF facility in the city.
The facility’s net operational cost per ton is directly proportional to waste processing/handling quantity. It increases from PKR 1223 to 1681 per ton with the increase in waste quantity from 1000 to 2000 tons per day for Scenario-1 to Scenario-3. There is no drastic increase in revenue from the sale of compost, recyclables and biogas, as estimated in the scenarios, i.e., PKR 95,530 to 96,900 per ton for Scenario-1 to Scenario-3. However, there is a swift increase in the environmental benefit cost from PKR 84 to 397 per ton for Scenario-1 to Scenario-3; landfill methane capturing in Scenario-3 seems to be a more environmentally friendly option. The economic potential analysis shows that Scenario-3 is the most appropriate choice for the city. It can contribute 35%, i.e., PKR 1934 per ton, to the current operational cost of LWMC; it will help reduce the operating cost of LWMC from PKR 5609 to 3675 per ton, with an overall benefit of PKR 4 billion per annum.
Capital investment in the waste sector is possible by exploring the various innovative financial instruments for climate finance that are available for funding [76] in order to establish SWM-related infrastructure in low-income countries, such as Pakistan (Table 10).
Governments of low-income countries may design climate finance funding as part of a debt management strategy and integrate it with future strategic negotiations in the long run for debt treatment [25].

5. Implication

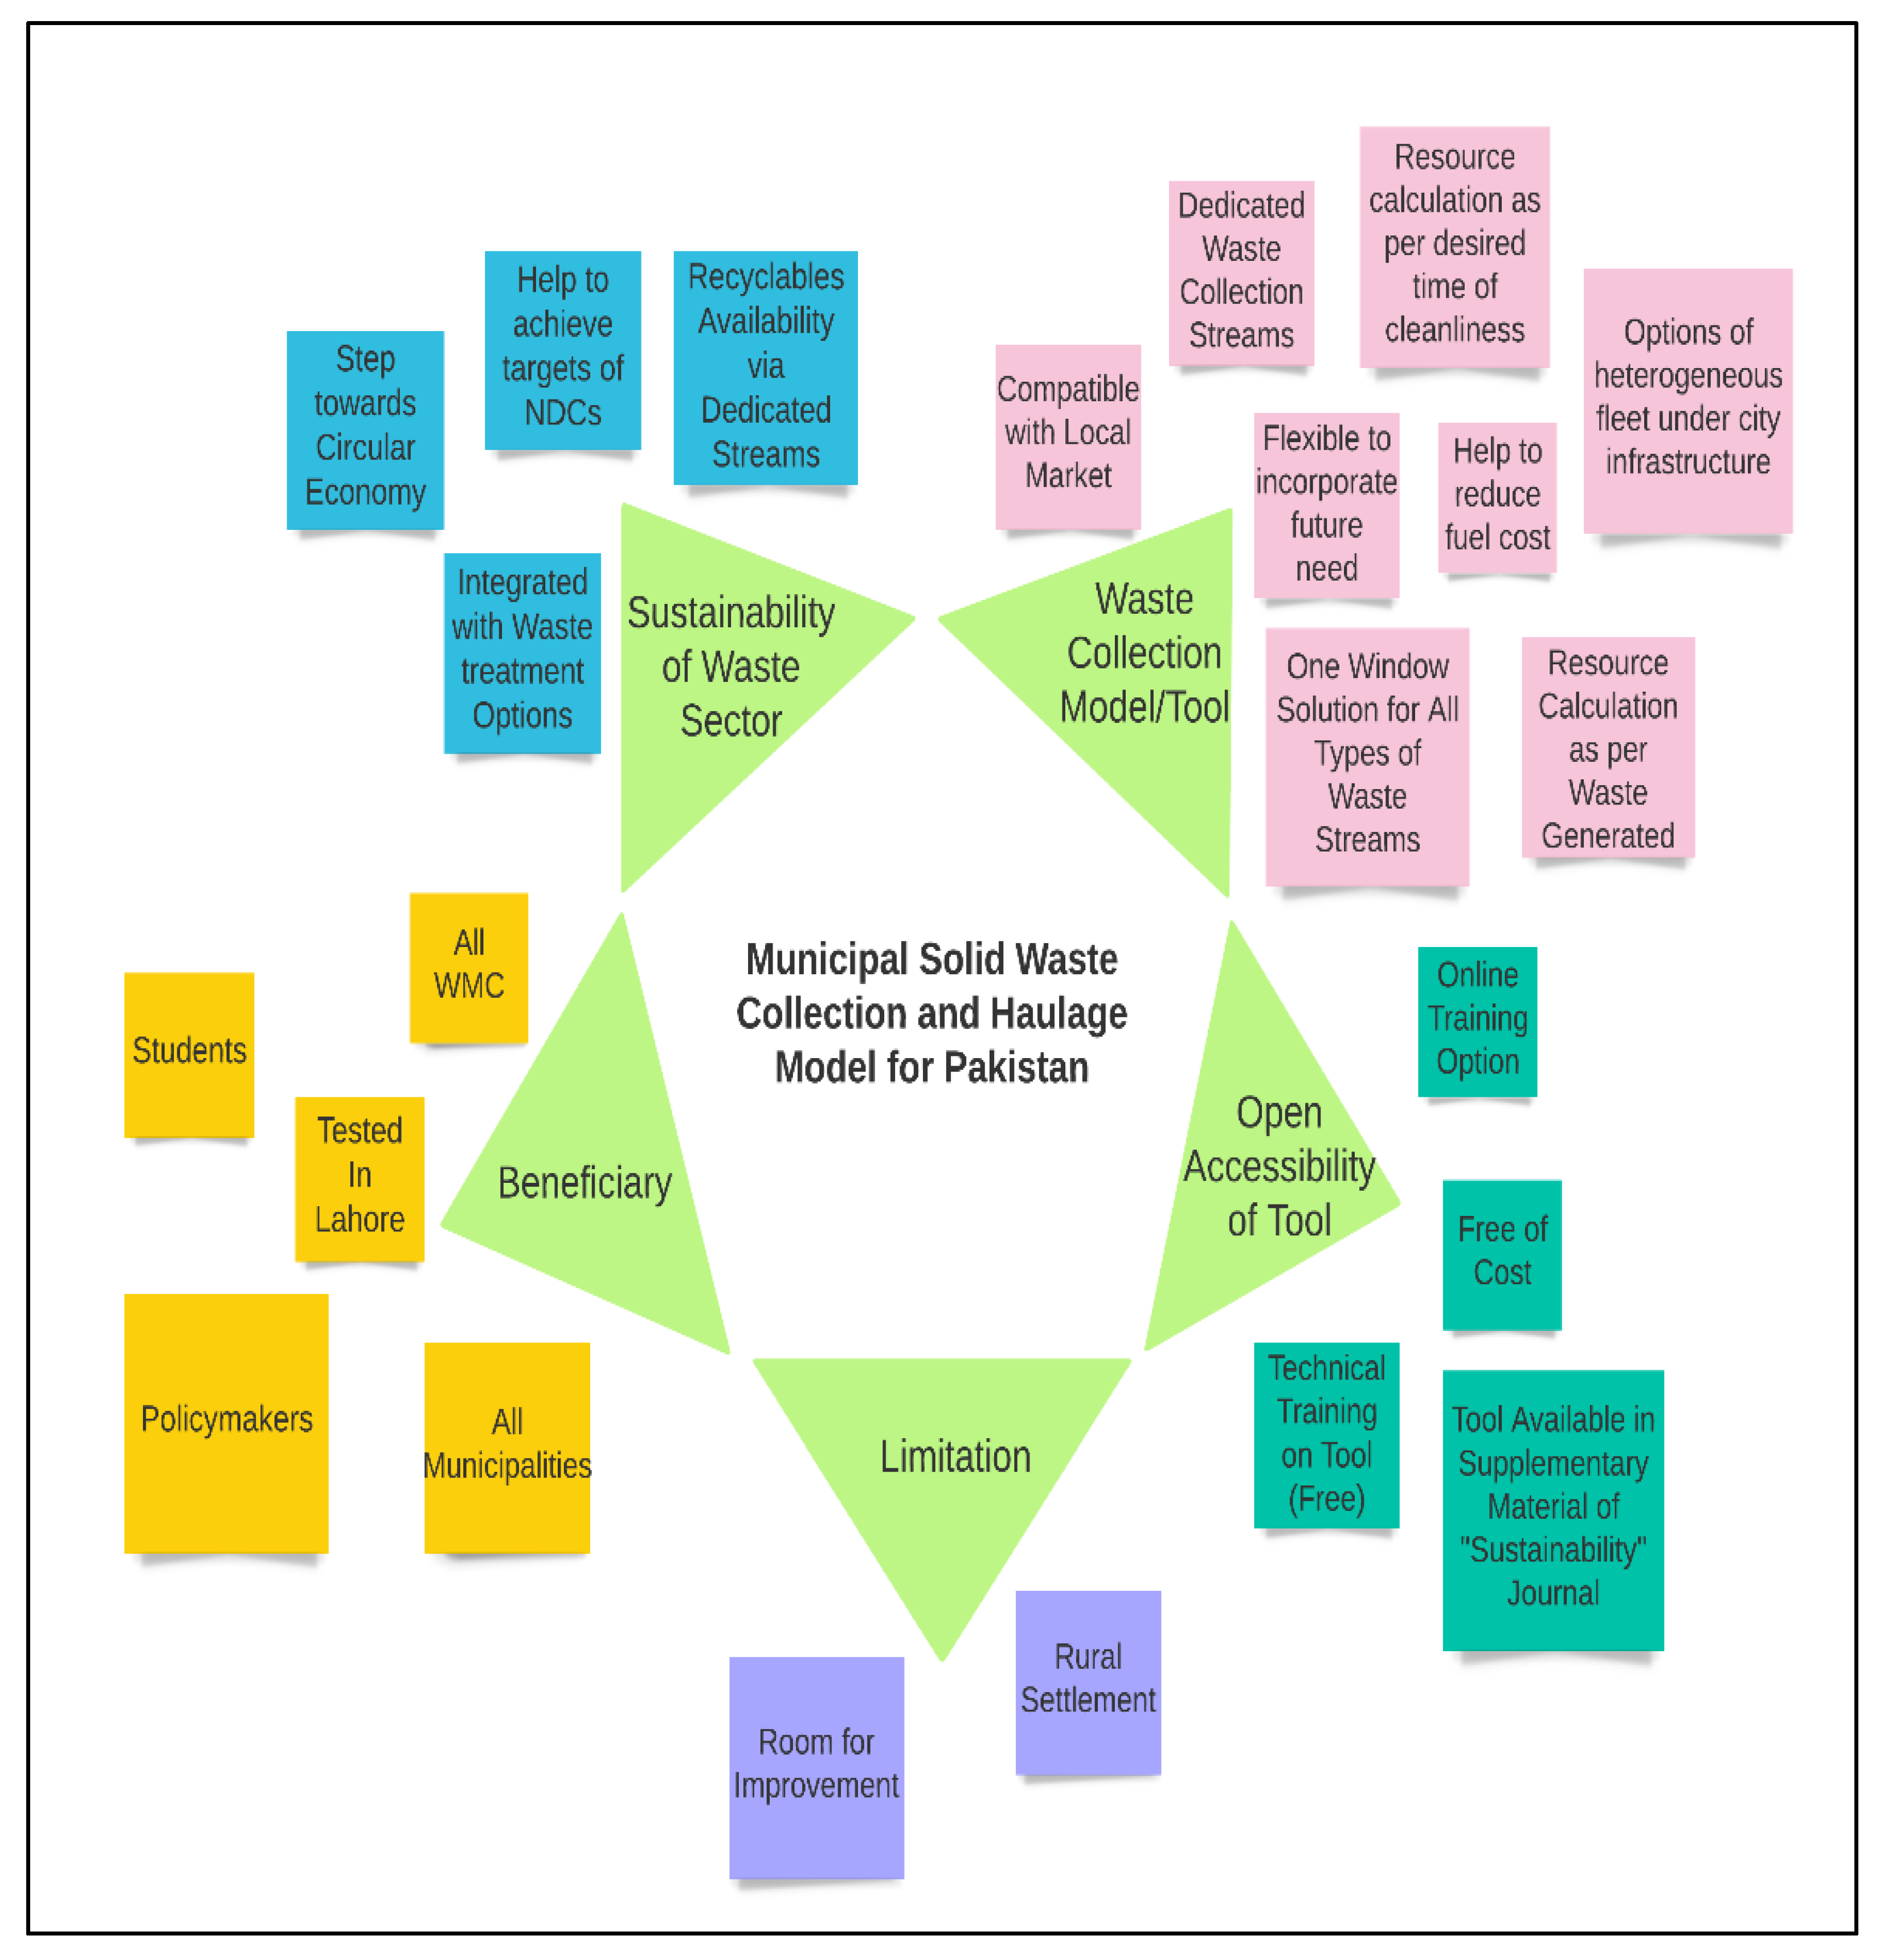
Currently, local municipalities and WMCs focus on manual sweeping and waste collection without considering it a resource. Therefore, there is an urgent need to allocate and deploy resources based on waste generation trends and city dynamics. However, due to capacity issues, local municipalities need help in translating practical experience into a plan/design. For example, sanitary inspectors (SI) and chief sanitary inspectors (CSI) have a fair knowledge of area/ward-wise waste generation quantum and peak waste hours. They are also familiar with the local area/accessibility and can prioritize the operational tasks in their minds. However, the SI/CSI cannot calculate the required resources mathematically. Therefore, the HMAFH tool will act as a bridge and provide a platform for translating the practical knowledge to design and allocate resources for dedicated waste collection streams and their haulage based on local conditions.
For the sustainability of the waste sector in Pakistan, an HMAFH calculator/tool will support the local municipalities and WMCs in assessing the resources for various waste collection streams. HMAFH will act as a strategic tool for policymakers to initiate the sector’s transformation toward sustainability [13]. The calculator is easy to understand and operate. It comprises different excel sheets, i.e., basic city information with waste generation and components, municipal and bulk waste proportion. Further, it will assist in integrating the commercial/institutional entities’ and housing societies’ waste into the main waste collection streams. This arrangement will help in minimizing illegal waste disposal incidents.
The flexible design of the calculator will allow and guide the users to develop an MSWM system based on the city’s needs with various waste collection options, i.e., complete DtD or CBC, or hybrid, compatible with the local market, i.e., heterogeneous fleet. The HMAFH calculator provides the solution for bulk waste collection, transfer station to landfill site (LFS) collection mode and MS&MW for the main roads. Furthermore, the summary sheet will allow adding the drivers’ and helpers’ data along with vehicle travel distance for comparison against fuel averages to calculate the daily, monthly and yearly operational expenditures. Therefore, the availability of the calculator is open and accessible for the ease of municipalities/WMCs in Pakistan to enhance their technical capacity. To summarize, HMAFH will enable cities to design systems, i.e., DtD or CBC, or a hybrid, with the option to integrate all residential and commercial entities with dedicated resources for bulk waste collection and its haulage to a treatment or disposal facility with heterogeneous fleet options (Figure 31).
The tool will allow its users to design/calculate the resources based on the desired time of city cleaning. For example, the political government in Lahore may want the city to be cleaned once a day at 10 am, whereas in Faisalabad/Gujranwala, the desired time may be 2 pm; however, this decision has operational cost implications. The stakeholders’ aspect (formal and informal) is incorporated into the tool to distinguish and ensure its practicability in the real world. The tool was tested in Lahore and Gujrat cities, with populations of 11.8 million and 0.44 million, respectively. The tool was developed for urban areas of the country with limited use for rural/village waste planning, as rural entities require different types of methodology, fleet and equipment, with different frequencies. Future research is needed to convert the HMAFH tool into a computer application/software by incorporating the default values of all Pakistani cities. This would include country census reports, waste characteristics, treatment options and related GHGs emission values for the ease of municipalities/WMCs to strengthen the MSWM sector in the country in line with NDCs targets.

6. Conclusions

The proposed waste collection and haulage interventions will help the local municipalities and WMCs obtain better results with improved service delivery. Integrating dedicated waste collection streams with a material recovery facility will ensure the sustainability of the waste management sector in the country. In return, this can help attain self-sufficiency in the fertilizer and energy sectors from compost and waste-to-energy/biogas. The research also highlights that “waste is a resource”, which can guide the decision makers [78] of the government of Pakistan to achieve the GHGs emission reduction targets, as defined by the NDCs. Future research is required to upgrade the HMAFH calculator/tool into a computer software by incorporating the default values of all urban areas of the country for the sustainability of the sector from the perspective of the climate change agenda.

Supplementary Materials

The following supporting information can be downloaded at: https://www.mdpi.com/article/10.3390/su142316234/s1.

Author Contributions

A.I. contributed to writing the original draft; A.Y., A.-S.N., R.H., A.A.K., F.S., A.B.T., I.A.S. and M.M.C. contributed to revision and final editing. All authors have read and agreed to the published version of the manuscript.

Funding

This research received no external funding.

Institutional Review Board Statement

Not applicable.

Informed Consent Statement

Informed consent was obtained from all individuals to use their pictures and data collected from the relevant agencies.

Data Availability Statement

All data is available in Supplementary Materials.

Acknowledgments

The authors highly appreciate the support of the Institute of Global Environmental Strategies (IGES) https://www.iges.or.jp/en, Japan, for EQT (Version-II) for estimating the GHGs/SLCPs from the solid waste sector to perform an environmental analysis. The authors also appreciate the support of LWMC (https://www.lwmc.com.pk/) in conducting the time-and-motion and waste generation rate studies, and Miss Hina Riaz, Communication Consultant at the Urban Unit (https://urbanunit.gov.pk/), for reviewing the manuscript. The authors would also like to appreciate https://lucid.co/ for providing free access in order to develop the graphs.

Conflicts of Interest

The authors declare no conflict of interest.

References

  1. Akram, S.V.; Singh, R.; Gehlot, A.; Rashid, M.; AlGhamdi, A.S.; Alshamrani, S.S.; Prashar, D. Role of wireless aided technologies in the solid waste management: A comprehensive review. Sustainability 2021, 13, 13104. [Google Scholar] [CrossRef]
  2. Asefi, H.; Lim, S. A novel multi-dimensional modeling approach to integrated municipal solid waste management. J. Clean. Prod. 2017, 166, 1131–1143. [Google Scholar] [CrossRef]
  3. Rabbani, M.; Mokarrari, K.R.; Akbarian-saravi, N. A multi-objective location inventory routing problem with pricing decisions in a sustainable waste management system. Sustain. Cities Soc. 2021, 75, 103319. [Google Scholar] [CrossRef]
  4. Asefi, H.; Shahparvari, S.; Chhetri, P. Integrated Municipal Solid Waste Management under uncertainty: A tri-echelon city logistics and transportation context. Sustain. Cities Soc. 2019, 50, 101606. [Google Scholar] [CrossRef]
  5. Asefi, H.; Shahparvari, S.; Chhetri, P.; Lim, S. Variable fleet size and mix VRP with fleet heterogeneity in Integrated Solid Waste Management. J. Clean. Prod. 2019, 230, 1376–1395. [Google Scholar] [CrossRef]
  6. Yazdani, M.; Kabirifar, K.; Frimpong, B.E.; Shariati, M.; Mirmozaffari, M.; Boskabadi, A. Improving construction and demolition waste collection service in an urban area using a simheuristic approach: A case study in Sydney, Australia. J. Clean. Prod. 2021, 280, 124138. [Google Scholar] [CrossRef]
  7. Mojtahedi, M.; Fathollahi-Fard, A.M.; Tavakkoli-Moghaddam, R.; Newton, S. Sustainable vehicle routing problem for coordinated solid waste management. J. Ind. Inf. Integr. 2021, 23, 100220. [Google Scholar] [CrossRef]
  8. Rabbani, M.; Heidari, R.; Yazdanparast, R. A stochastic multi-period industrial hazardous waste location-routing problem: Integrating NSGA-II and Monte Carlo simulation. Eur. J. Oper. Res. 2019, 272, 945–961. [Google Scholar] [CrossRef]
  9. Morrissey, A.J.; Browne, J. Waste management models and their application to sustainable waste management. Waste Manag. 2004, 24, 297–308. [Google Scholar] [CrossRef]
  10. Pardini, K.; Rodrigues, J.J.; Kozlov, S.A.; Kumar, N.; Furtado, V. IoT-based solid waste management solutions: A survey. J. Sens. Actuator Netw. 2019, 8, 5. [Google Scholar] [CrossRef]
  11. Zurbrügg, C.; Caniato, M.; Vaccari, M. How assessment methods can support solid waste management in developing countries—A critical review. Sustainability 2014, 6, 545–570. [Google Scholar] [CrossRef] [Green Version]
  12. Medina-Mijangos, R.; Seguí-Amórtegui, L. Research trends in the economic analysis of municipal solid waste management systems: A bibliometric analysis from 1980 to 2019. Sustainability 2020, 12, 8509. [Google Scholar] [CrossRef]
  13. Anwar, S.; Elagroudy, S.; Abdel Razik, M.; Gaber, A.; Bong, C.P.; Ho, W.S. Optimization of solid waste management in rural villages of developing countries. Clean Technol. Environ. Policy 2018, 20, 489–502. [Google Scholar] [CrossRef]
  14. Li, H.; Nitivattananon, V.; Li, P. Developing a sustainability assessment model to analyze China’s municipal solid waste management enhancement strategy. Sustainability 2015, 7, 1116–1141. [Google Scholar] [CrossRef] [Green Version]
  15. Dhokhikah, Y.; Trihadiningrum, Y. Solid waste management in Asian developing countries: Challenges and opportunities. J. Appl. Environ. Biol. Sci. 2012, 2, 329–335. [Google Scholar]
  16. Bloomberg. Available online: https://www.bloomberg.com/news/features/2022-11-06/-satellite-data-methane-release-climate-change (accessed on 8 November 2022).
  17. Schübeler, P.; Christen, J.; Wehrle, K. Conceptual Framework for Municipal Solid Waste Management in Low-Income Countries; SKAT (Swiss Center for Development Cooperation): St. Gallen, Switzerland, 1996; pp. 18–53. [Google Scholar]
  18. Rodić, L.; Wilson, D.C. Resolving governance issues to achieve priority sustainable development goals related to solid waste management in developing countries. Sustainability 2017, 9, 404. [Google Scholar] [CrossRef] [Green Version]
  19. Olalo, K.F.; Nakatani, J.; Fujita, T. Optimal Process network for integrated solid waste management in Davao City, Philippines. Sustainability 2022, 14, 2419. [Google Scholar] [CrossRef]
  20. Iqbal, A.; Abdullah, Y.; Nizami, A.S.; Sultan, I.A.; Sharif, F. Assessment of solid waste management system in Pakistan and sustainable model from environmental and economic perspective. Sustainability 2022, 14, 12680. [Google Scholar] [CrossRef]
  21. Aleluia, J.; Ferrão, P. Characterization of urban waste management practices in developing Asian countries: A new analytical framework based on waste characteristics and urban dimension. Waste Manag. 2016, 58, 415–429. [Google Scholar] [CrossRef]
  22. Kausar, S.W.; Ali, R.; Khan, T.A. The Impact of foreign debt on the economy of Pakistan. Glob. Econ. Rev. 2022, 7, 10–19. Available online: https://www.gerjournal.com/jadmin/Auther/31rvIolA2LALJouq9hkR/vcGLXPdrfc.pdf (accessed on 7 October 2022). [CrossRef]
  23. Saeed, S.; Siddiqui, K. The Express Tribune Explains Foreign Debt. The Express Tribune. 2014. Available online: http://labs1.tribune.com.pk/the-express-tribune-explains-foreign-debt/ (accessed on 7 October 2022).
  24. Clean Finance and Development Center. Available online: https://greenfdc.org/ (accessed on 8 October 2022).
  25. Organization for Economic Co-Operation and Development (OECD). Available online: https://www.oecd.org/environment/outreach/39352290.pdf (accessed on 10 October 2022).
  26. Cooper, J.C. Controls and incentives: A framework for the utilisation of bulk wastes. Waste Manag. 1996, 16, 209–213. [Google Scholar] [CrossRef]
  27. De Feo, G.; Ferrara, C.; Iuliano, C.; Grosso, A. LCA of the collection, transportation, treatment and disposal of source separated municipal waste: A Southern Italy case study. Sustainability 2016, 8, 1084. [Google Scholar] [CrossRef] [Green Version]
  28. Drake, J.; Bradford, A. Assessing the potential for rehabilitation of surface permeability using regenerative air and vacuum Sweeping Trucks. J. Water Manag. Model. 2013. [Google Scholar] [CrossRef]
  29. Cavicchia, C.; Sarnacchiaro, P.; Vichi, M. Cost and performance: A composite indicator for separated waste collection in Italy. In Proceedings of the 63rd ISI World Statistics Congress, Virtual, Online, 11–16 July 2021. [Google Scholar]
  30. Amri, S.; Martono, D.N.; Soesilo, T.E. Mapping out the municipal solid waste generation and collection model using spatial multi-criteria evaluation. Environ. Earth Sci. 2021, 716, 012011. [Google Scholar] [CrossRef]
  31. Haque, K.F.; Zabin, R.; Yelamarthi, K.; Yanambaka, P.; Abdelgawad, A. An IoT based efficient waste collection system with smart bins. In Proceedings of the 2020 IEEE 6th World Forum on Internet of Things (WF-IoT), Virtual, Online, 2 June 2020. [Google Scholar]
  32. Wu, H.; Tao, F.; Yang, B. Optimization of vehicle routing for waste collection and transportation. Int. J. Environ. Res. Public Health 2020, 17, 4963. [Google Scholar] [CrossRef] [PubMed]
  33. Anagnostopoulos, T.; Kolomvatsos, K.; Anagnostopoulos, C.; Zaslavsky, A.; Hadjiefthymiades, S. Assessing dynamic models for high priority waste collection in smart cities. J. Syst. Softw. 2015, 110, 178–192. [Google Scholar] [CrossRef] [Green Version]
  34. Dang, N.H. Assessment of Waste Collection Systems and Separate Collection Alternatives in Vietnam. Ph.D. Thesis, Okayama University, Okayama, Japan, August 2018. [Google Scholar]
  35. Adnanjwad, Z.; Talib Hasson, S. An Optimization Approach to Model the Waste Collection Process. Int. J. Eng. Technol. 2018, 7, 615–619. Available online: https://www.sciencepubco.com/index.php/ijet/article/view/27970 (accessed on 7 November 2022).
  36. Korcyl, A.; Książek, R.; Gdowska, K. A MILP model for the municipal solid waste selective collection routing problem. DMMS 2019, 13, 17–35. [Google Scholar]
  37. Sadeghi Ahangar, S.; Sadati, A.; Rabbani, M. Sustainable design of a municipal solid waste management system in an integrated closed-loop supply chain network using a fuzzy approach: A case study. J. Ind. Prod. Eng. 2021, 38, 323–340. [Google Scholar] [CrossRef]
  38. Pheakdey, D.V.; Quan, N.V.; Khanh, T.D.; Xuan, T.D. Challenges and priorities of municipal solid waste management in Cambodia. Int. J. Environ. Res. Public Health 2022, 19, 8458. [Google Scholar] [CrossRef]
  39. Yukalang, N.; Clarke, B.; Ross, K. Solid waste management solutions for a rapidly urbanizing area in Thailand: Recommendations based on stakeholder input. Int. J. Environ. Res. Public Health 2018, 15, 1302. [Google Scholar] [CrossRef] [PubMed] [Green Version]
  40. Ferronato, N.; Nova Pinedo, M.L.; Torretta, V. Assessment of used baby diapers composting in Bolivia. Sustainability 2020, 12, 5055. [Google Scholar] [CrossRef]
  41. Yasar, A.; Basit, S.; Tabinda, A.U.; Ali, A.; Naqvi, S.U.; Nizami, A.S.; Naqvi, S.L.; Mahmood, S.; Tanveer, R. Evaluation of operational and financial viability models of combined landfill site for intermediate cities in Pakistan. Environ. Sci. Pollut. Res. 2022, 1–6. [Google Scholar] [CrossRef]
  42. Ferronato, N.; Pasinetti, R.; Valencia Vargas, D.; Calle Mendoza, I.J.; Guisbert Lizarazu, E.G.; Gorritty Portillo, M.A.; Conti, F.; Torretta, V. Circular economy, international cooperation, and solid waste management: A development project in La Paz (Bolivia). Sustainability 2022, 14, 1412. [Google Scholar] [CrossRef]
  43. Loizidou, M.; Moustakas, K.; Rehan, M.; Nizami, A.S.; Tabatabaei, M. New developments in sustainable waste-to-energy systems. Renew. Sustain. Energy Rev. 2021, 151, 111581. [Google Scholar] [CrossRef]
  44. Debrah, J.K.; Teye, G.K.; Dinis, M.A. Barriers and challenges to waste management hindering the circular economy in Sub-Saharan Africa. Urban Sci. 2022, 6, 57. [Google Scholar] [CrossRef]
  45. Sahib, T.M.; Mohd-Mokhtar, R.; Kassim, A.M. Survey on meta-heuristic algorithms for solving vehicle route problems in a waste collection system. In Proceedings of the 11th International Conference on Robotics, Vision, Signal Processing and Power Applications, Singapore, 13 February 2022. [Google Scholar]
  46. Song, Q.; Li, J.; Zeng, X. Minimizing the Increasing Solid Waste through Zero Waste Strategy. J. Clean. Prod. 2015, 104, 199–210. [Google Scholar] [CrossRef]
  47. Aljazeera. Available online: https://www.aljazeera.com/news/2022/10/7/un-demands-money-for-poor-nations-dealing-with-climate-chaos (accessed on 10 October 2022).
  48. Lahore Waste Management Company (LWMC). Available online: https://www.lwmc.com.pk/ (accessed on 9 November 2022).
  49. Kawai, K.; Tasaki, T. Revisiting estimates of municipal solid waste generation per capita and their reliability. J. Mater. Cycles Waste Manag. 2016, 18, 1–3. [Google Scholar] [CrossRef] [Green Version]
  50. Chesapeake Virginia. Available online: https://www.cityofchesapeake.net/government/city-departments/departments/Public-Works-Department/Divisions/wastemanagement/wastemanagement-bulkwaste-popupwindow.htm (accessed on 9 November 2022).
  51. Miezah, K.; Obiri-Danso, K.; Kádár, Z.; Fei-Baffoe, B.; Mensah, M.Y. Municipal solid waste characterization and quantification as a measure towards effective waste management in Ghana. Waste Manag. 2015, 46, 15–27. [Google Scholar] [CrossRef] [Green Version]
  52. Aziz, S.Q.; Aziz, H.A.; Bashir, M.J.; Yusoff, M.S. Appraisal of domestic solid waste generation, components, and the feasibility of recycling in Erbil, Iraq. Waste Manag. Res. 2011, 29, 880–887. [Google Scholar] [CrossRef] [PubMed]
  53. Hadi, N.S. Estimation of municipal solid waste generation rate (Case study of Hilla city). JKU 2014, 12, 72–80. [Google Scholar]
  54. Singh, R. Municipal solid waste management in the city of Indore—A case study. J. Civ. Eng. Environ. Sci. 2021, 7, 8–17. [Google Scholar]
  55. Beliën, J.; De Boeck, L.; Van Ackere, J. Municipal solid waste collection problems: A literature review. Econ. Manag. 2014, 48, 78–102. [Google Scholar] [CrossRef]
  56. Cavallin, A.; Rossit, D.G.; Herran Symonds, V.; Rossit, D.A.; Frutos, M. Application of a methodology to design a municipal waste pre-collection network in real scenarios. Waste Manag. Res. 2020, 38, 117–129. [Google Scholar] [CrossRef] [PubMed]
  57. Slavík, J.; Rybová, K. The costs of municipal waste and separate collection. Efficient measures how to cut them down. In Proceedings of the 21st International Conference Current Trends in Public Sector Research, Masaryk University, Brno, Czech Republic, 19–20 January 2017. [Google Scholar]
  58. Tınmaz, E.; Demir, I. Research on solid waste management system: To improve existing situation in Corlu Town of Turkey. Waste Manag. 2006, 26, 307–314. [Google Scholar] [CrossRef] [PubMed]
  59. Menikpura, N.; Premakumara, D.G.J. Emission Quantification Tool (EQT) for Estimation of GHGs/SLCPs from Solid Waste Sector, 2nd ed.; Institute for Global Environmental Strategies (IGES): Hayama, Japan, 2018. [Google Scholar]
  60. Mehta, Y.D.; Shastri, Y.; Joseph, B. Economic analysis and life cycle impact assessment of municipal solid waste (MSW) disposal: A case study of Mumbai, India. Waste Manag. Res. 2018, 36, 1177–1189. [Google Scholar] [CrossRef]
  61. Vigoroso, L.; Pampuro, N.; Bagagiolo, G.; Cavallo, E. Factors influencing adoption of compost made from organic fraction of municipal solid waste and purchasing pattern: A survey of Italian professional and hobbyist users. Agronomy 2021, 11, 1262. [Google Scholar] [CrossRef]
  62. Sadhukhan, J.; Dugmore, T.I.; Matharu, A.; Martinez-Hernandez, E.; Aburto, J.; Rahman, P.K.; Lynch, J. Perspectives on “game changer” global challenges for sustainable 21st century: Plant-based diet, unavoidable food waste biorefining, and circular economy. Sustainability 2020, 12, 1976. [Google Scholar] [CrossRef] [Green Version]
  63. Aye, L.; Widjaya, E.R. Environmental and economic analyses of waste disposal options for traditional markets in Indonesia. Waste Manag. 2006, 26, 1180–1191. [Google Scholar] [CrossRef] [PubMed]
  64. District Lahore. Available online: https://lahore.punjab.gov.pk/ (accessed on 8 October 2022).
  65. Bureau of Statistics. Punjab Development Statistics 2021; Bureau of Statistics, Planning & Development Board—Government of the Punjab: Lahore, Pakistan, 2021; pp. 377–380. Available online: https://bos.gop.pk/system/files/PDS%202021.pdf (accessed on 11 September 2022).
  66. Riaz, O.; Ghaffar, A.; Butt, I. Modelling land use patterns of Lahore (Pakistan) using remote sensing and GIS. Glob. J. Sci. Front. Res. Environ. Earth Sci. 2014, 14, 24–30. [Google Scholar]
  67. Ferronato, N.; Torretta, V. Waste mismanagement in developing countries: A review of global issues. Int. J. Environ. Res. Public Health 2019, 16, 1060. [Google Scholar] [CrossRef] [PubMed] [Green Version]
  68. Godfrey, L.; Oelofse, S. Historical review of waste management and recycling in South Africa. Resources 2017, 6, 57. [Google Scholar] [CrossRef] [Green Version]
  69. Kazuva, E.; Zhang, J. Analyzing municipal solid waste treatment scenarios in rapidly urbanizing cities in developing countries: The case of Dar es Salaam, Tanzania. Int. J. Environ. Res. Public Health 2019, 16, 2035. [Google Scholar] [CrossRef] [Green Version]
  70. Lima, P.D.; Colvero, D.A.; Gomes, A.P.; Wenzel, H.; Schalch, V.; Cimpan, C. Environmental assessment of existing and alternative options for management of municipal solid waste in Brazil. Waste Manag. 2018, 78, 857–870. [Google Scholar] [CrossRef]
  71. Mihai, F.C.; Gündoğdu, S.; Markley, L.A.; Olivelli, A.; Khan, F.R.; Gwinnett, C.; Gutberlet, J.; Reyna-Bensusan, N.; Llanquileo-Melgarejo, P.; Meidiana, C.; et al. Plastic pollution, waste management issues, and circular economy opportunities in rural communities. Sustainability 2021, 14, 20. [Google Scholar] [CrossRef]
  72. The World Bank. Available online: https://datatopics.worldbank.org/world-development-indicators/themes/environment.html#carbon-dioxide-emissions (accessed on 6 October 2022).
  73. United Nations Climate Change. Available online: https://unfccc.int/gcse?q=Pakistan (accessed on 7 October 2022).
  74. Pouriani, S.; Asadi-Gangraj, E.; Paydar, M.M. A robust bi-level optimization modelling approach for municipal solid waste management; a real case study of Iran. J. Clean. Prod. 2019, 240, 118125. [Google Scholar] [CrossRef]
  75. Yasar, A.; Shabbir, S.A.; Tabinda, A.B.; Nazar, M.; Rasheed, R.; Malik, A.; Mukhtar, S. Refuse-derived fuels as a renewable energy source in comparison to coal, rice husk, and sugarcane bagasse. Energy Source Part A 2019, 41, 564–572. [Google Scholar] [CrossRef]
  76. International Monetary Fund. Available online: https://www.imf.org/en/Publications/GFSR/Issues/2022/10/11/global-financial-stability-report-october-2022 (accessed on 8 October 2022).
  77. Mako, W.P.; Nabi, I.; Mahmood, A.; Khan, S. Recent Developments in Climate Finance: Implications for Pakistan; International Growth Center (IGC): London, UK, 2022; pp. 1–156. Available online: https://cdpr.org.pk/wp-content/uploads/2022/08/Recent-Development-in-Climate-Finance.pdf (accessed on 1 December 2022).
  78. Maihami, R.; Ghalehkhondabi, I. Pricing problem in a medical waste supply chain under environmental investment: A game theory approach. J. Ind. Prod. Eng. 2022, 39, 597–613. [Google Scholar] [CrossRef]
Figure 1. Aims and objectives of the research.
Sustainability 14 16234 g001
Figure 2. Systemic flow chart of waste collection and haulage model/tool for urban areas of Pakistan.
Sustainability 14 16234 g002
Figure 3. Environmental analysis of the MSWM system.
Sustainability 14 16234 g003
Figure 4. Economic model and circular economy concept of waste.
Sustainability 14 16234 g004
Figure 5. Current waste collection system for BAU in Lahore (linear economy).
Sustainability 14 16234 g005
Figure 6. Lahore district description: (a) Map of the district showing nine administrative towns and two cantonments; (b) Map of the district showing five tehsils.
Sustainability 14 16234 g006
Figure 7. The proposed six zones for Lahore city.
Sustainability 14 16234 g007
Figure 8. Steps for designing the waste collection and haulage model.
Sustainability 14 16234 g008
Figure 9. Proposed waste streams and modes for collection.
Sustainability 14 16234 g009
Figure 10. Fleet resources calculated for DtD waste collection mode: (a) Three types of compactor vehicles, i.e., 7 m3—Equation (18), 13 m3—Equation (16) and 25 m3—Equation (14), are proposed based on area dynamics; (b) Two types of mini-dumpers, i.e., 1 m3—Equation (20) and 2.5 m3—Equation (22), are proposed based on area accessibility.
Sustainability 14 16234 g010
Figure 11. Fleet resources calculated for CBC mode: (a) Four types of vehicles, i.e., compactor 7 m3—Equation (24), compactor 13 m3—Equation (26), chain arm roll 5 m3—Equation (28) and tractor loader (4 × 4)—Equation (30), are proposed based on area requirement and local wisdom; (b) Two types of waste storage containers, i.e., 0.8 m3—Equation (31) and 5 m3—Equation (32), are proposed based on waste generation quantum.
Sustainability 14 16234 g011
Figure 12. Scheme of waste collection: (a) DtD collection mode; (b) CBC mode.
Sustainability 14 16234 g012
Figure 13. Details of waste generation, proposed fleet and equipment for commercial entities: (a) Zone-wise waste generation from small markets—Equation (6), medium markets—Equation (7), large markets—Equation (8) and extra-large markets—Equation (9); (b) Four types of fleet, i.e., chain arm roll—Equation (33), compactor 7 m3—Equation (39), compactor 13m3—Equation (37) and compactor 25 m3—Equation (35), proposed for collection of waste from commercial entities of the city based on area accessibility; (c) Two types of containers, i.e., 5 m3—Equation (41) and 0.8 m3—Equation (42), proposed for storage of waste in commercial entities of the city; (d) Scheme of commercial waste collection.
Sustainability 14 16234 g013
Figure 14. Details of waste generation, housing units, proposed fleet and equipment for private/cooperative housing societies: (a) Town-wise household size of residential societies and waste generation—Equation (10); (b) Calculated/proposed quantity of compactor vehicles, i.e., 13 m3—Equation (42) and 25 m3—Equation (43), and waste storage containers, i.e., 0.8 m3—Equation (49) and 5 m3—Equation (51); (c) Scheme of housing societies waste collection.
Sustainability 14 16234 g014
Figure 15. Map of Lahore district with proposed zones and infrastructure: (a) City zoning and areas identified for executing the HMAFH model; (b) Proposed location of transfer stations and MRF.
Sustainability 14 16234 g015
Figure 16. Scheme for bulk and secondary waste collection: (a) Specialized resources for bulk waste collection; (b) Scheme for secondary waste collection.
Sustainability 14 16234 g016
Figure 17. Resources calculated/proposed for bulk waste collection based on waste generation trends in low-income countries and proposed transfer station resources: (a) Heterogeneous fleet for bulk waste collection include dumper 5 m3—Equation (53), dumper 10 m3—Equation (55), tractor trolley—Equation (57), tractor loader—Equation (59), excavator—Equation (60) and front-end loader—Equation (61); (b) Separate dumpers/trailers and allied equipment, i.e., dumper 25 m3 for municipal waste—Equation (62), dumper 25 m3 for bulk waste—Equation (63), excavator—Equation (64) and front-end loader—Equation (65), as proposed/calculated for collection and haulage of waste from transfer station/MRF (residual waste) to designated landfill site.
Sustainability 14 16234 g017
Figure 18. Mechanical sweeping and washing details: (a) Mechanical sweeping and washing lengths based on city road infrastructure; (b) Resources calculated to perform mechanical sweeping, including mechanical sweeper 4 m3—Equation (66) and mechanical sweeper 6 m3—Equation (67), and washer 4500 L capacity—Equation (68) and washer 8000 L capacity—Equation (69), achieve the sweeping and washing targets.
Sustainability 14 16234 g018
Figure 19. Roads identified for MS&MW operations: (a) Proposed mechanical sweeping; (b) Proposed mechanical washing.
Sustainability 14 16234 g019
Figure 20. Proposed model for integrating waste treatment options.
Sustainability 14 16234 g020
Figure 21. Proposed waste treatment scenarios for achieving sustainability in the sector in a phased manner.
Sustainability 14 16234 g021
Figure 22. Comparison of climate impact of various scenarios: (a) Climate impact of GHGs emissions/ton of collected waste (kg of CO2-eq./ton) and yearly collected waste (tons of CO2-eq.); (b) GHGs/SLCPs emissions/ton of collected waste (kg/ton); (c) BC emissions/ton of collected waste (kg/ton) and yearly collected waste (tons); (d) Net climate impact of GHGs from waste disposal landfill (kg of CO2-eq./ton).
Sustainability 14 16234 g022
Figure 23. Capital and operational expenses of operating the facility (MRF): (a) Cost (PKR) per day of operating the facility under different scenarios; (b) Cost (PKR) per ton of operating the facility under different scenarios.
Sustainability 14 16234 g023
Figure 24. Cost of the facility and related revenue, including carbon benefit, for different scenarios: (a) Summary of per day and ton cost of the MRF; (b) Revenue from sale and related environmental benefit per ton for different scenarios—Equations (72)–(74).
Sustainability 14 16234 g024
Figure 25. Economic potential of three scenarios to sustain the current operational cost: (a) Economic potential of different scenarios in ton and operational cost per ton for BAU; (b) Annual economic potential of proposed scenarios to account for operational cost of BAU—Equations (76)–(78).
Sustainability 14 16234 g025
Figure 26. Comparison of capital investment and related environmental benefit cost per ton of proposed scenarios.
Sustainability 14 16234 g026
Figure 27. Model/scheme for MSW collection, treatment and disposal.
Sustainability 14 16234 g027
Figure 28. Pictures of field studies to confirm the assumptions used in modeling: (a,b) Time and motion study conducted in six towns of Lahore; (c,d) Waste generation rate study conducted based on income groups.
Sustainability 14 16234 g028
Figure 29. Results of Time and Motion Study: (a) Average fuel consumption per kilometer or hour; (b) Volumetric capacity of fleet in tons.
Sustainability 14 16234 g029
Figure 30. Fuel detail for city waste collection: (a) Fuel consumption (L per day) for waste collection (BAU); (b) Proposed fuel allocated/collected for various waste streams (L per day).
Sustainability 14 16234 g030
Figure 31. HMAFH calculator/tool.
Sustainability 14 16234 g031
Table 1. Review of the literature on the subject.
StudiesDWSHFSCCMWAWCDWGWCMWSASSITSP/STTDFTEIm
[7]----- ------
[29]------------
[30]-----------
[31]----------
[32]---------
[33]----------
[34]---------
[35]----------
[36]-----------
[2]----------
[5]------------
[37]----
Table 2. Abbreviation and description of reviewed literature (reference Table 1).
AbbreviationDescriptionAbbreviationDescription
DWSDedicated Waste StreamsASAllied Staff, including City Broom Crew
HFSHeterogeneous Fleet SpecificationSIStakeholder Input
CCColor CodingTSTransfer Station
MWMunicipal WasteP/SPrimary and Secondary Collection
AWAnimal Waste/DungTTDTrips/Travel/Time and Distance
CDWConstruction and Demolition WasteFFuel Averages per Vehicle
GWGreen WasteTETransportation Emissions
CMCollection ModeImImplication
WSWorking Shifts--
Table 3. Parameters and variables used for designing a waste collection model/tool.
Solid Waste—Generation, Estimates, Components and Categories
SWGsolid waste generation(c13m3)%quantity of tonnage allocated to 13 m3 compactor
(kg/d)kilograms per day%(c13m3)area accessibility in % for a 13 m3 compactor
(t/d)tons per dayQty(c7m3)required quantity of 7 m3 compactors
Ppopulation of study area(c13m3)%quantity of tonnage allocated to 7 m3 compactor
Rwaste generation rate in kilogram/person/day%(c7m3)area accessibility in % for a 7 m3 compactor
%MWpercentage of municipal solid waste componentQty(md1m3)required quantity of 1 m3 mini-dumper
%BW% of bulk waste component(md1m3)%quantity of tonnage allocated to 1 m3 mini-dumper
N(entity)number of commercial markets in area%(md1m3)area accessibility in % for a 1 m3 mini-dumper
S(sm)number of shops in a small market with range of 1-50, and the default value for waste generation is 0.3 ton/dayQty(md2.5m3)required quantity for 2.5 m3 mini-dumper
S(mm)number of shops in a medium-size market with a range of 51-150, and the default value for waste generation is 1 ton/day(md2.5m3)%quantity of tonnage allocated to 2.5 m3 mini-dumper
S(lm)number of shops in a large-size market with a range of 151-300, and the default value for waste generation is 2.3 tons/day%(md2.5m3)area accessibility in % for a 2.5 m3 mini-dumper
S(xlm)number of shops in an extra-large-size market with more than 300, and the default value for waste generation is 4 tons/dayQty(car5m3)required quantity of 5 m3 chain arm rolls
HH(hs)(∑n)the sum of household number of each society in area(car5m3)%quantity of tonnage allocated to 5 m3 chain arm roll
HH(hs)(sz)household size is number of people per household as per the census report%(car5m3)area accessibility in % for a 5 m3 chain arm roll
%DtDarea percentage requires door to door (DtD) collection servicesQty(tl)required quantity of tractor loaders
%CBCarea percentage requires container based collection (CBC)/curbside servicesQty(wsc0.8m3)required quantity of 0.8 m3 waste storage containers
Waste Collection & Haulage Modes And ResourcesQty(wsc5m3)required quantity of 5 m3 waste storage containers
DtDdoor to door collectionQty(d5m3)required quantity of 5 m3 dumpers
cbccontainer-based collection(d5m3)%quantity of tonnage allocated to 5 m3 dumper
vccapacity of vehicle in tons%(d5m3)the percentage for a 5 m3 dumper out of total fleet for bulk waste
cwcommercial areaQty(d10m3)required quantity of 10 m3 dumpers
hshousing society(d10m3)%quantity of tonnage allocated to 10 m3 dumper
bwbulk waste%(d10m3)the percentage for a 10 m3 dumper out of total fleet for bulk waste
tstransfer stationQty(tt5m3)required quantity of 5 m3 trolleys
mwmunicipal waste(tt5m3)%quantity of tonnage allocated to 5 m3 trolley
bwbulk waste%(tt5m3)% for a 5 m3 trolley out of the total fleet for bulk waste
tripsnumber of complete trips by vehicle(+/+)any desired value from 1 to 9 that will help obtain the required value of a machine, i.e., tractor loader for CBC
c(wsc)waste storage capacity in tons for containerʃ(+/+)any desired value from 1 to 9 that will help obtain the required value of a machine, i.e., tractor loader, front-end loader and excavator
DtD(m)door-to-door collection modem͇|uncert.any desired value from 1 to 9 that will help obtain the required value of a machine under uncertain condition
cbc(m)container-based collection modeQty(vs4m3)required quantity of 4 m3 vacuum sweepers
msmechanical sweeping%(vs4m3)% of sweeping length for a 4 m3 vacuum sweeper
mwmechanical washingQty(vs6m3)required quantity of 6 m3 vacuum sweepers
vc/svehicle sweeping/washing capacity per shift in kilometers%(vs6m3)% of sweeping length for a 6 m3 vacuum sweeper
vsvacuum sweeper machineQty(wv4500l)required quantity of mechanical washers with 4500 L tanker capacity
wvwasher vehicle%(wv4500l)% of washing length for a 4500 L washer
Qty(c25 m3)required quantity for 25 m3 compactorQty(wv8000l)required quantity for mechanical washer with 8000 L tanker capacity
(c25 m3)%quantity of tonnage allocated to 25 m3 compactor%(wv8000l)% of washing length for a 8000 L washer
%(c25 m3)area accessibility in % for a 25 m3 compactorQty(ms-mw)mwrequired quantity of “dedicated” mechanical sweepers to support washing operation
Qty(c13 m3)required quantity of 13 m3 compactorsmw-(target/d)mechanical washing target per day
Table 4. Parameters and variables for the economic model.
Parameters and Variables for the Economic Model
Ptonper ton CBAcost–benefit analysis
Bgbiogasavg/taverage per ton
Revrevenue from biogasS1scenario 1
Qty.quantitybenefitenvironmental/carbon benefit
m3cubic meterFcfacility cost
ttonS2scenario 2
prodproduction/producelfglandfill gas
SPselling pricedday
Rrecyclablesdwwaste diverted/accepted at landfill
Ocorganic compostS3scenario 3
Table 5. Basic facts of Lahore district used to perform the modeling.
ZonesTownsUCsPopulation
Zone-1Iqbal, Nishtar, Gulberg803,134,696
Zone-2Samanabad, Data Gunj Bukh, Ravi984,118,513
Zone-3Shalimar, Aziz Bhatti, Wagha712,843,550
Zone-4Periphery area251,029,526
Zone-5WCB (Sector)7509,025
Zone-6LCB (Wards)10227,112
Total29111,862,422
Table 6. Municipal and bulk waste components.
SNWaste ComponentsMunicipal WasteBulk Waste
1Combustibles-
2Diaper-
3Electro.-
4Glass-
5Hazardous *-
6Kitchen waste-
7Metals-
8Non-combustible, i.e., dust, dirt, ashes, stones, bricks, sludge, etc.-
9Paper–cardboard-
10PET-
11Nylon-
12Plastics-
13Tetrapak-
14Textile-
15Wood, leaves, straw, green waste-
16Animal waste/dung-
* Not desired in municipal waste.
Table 7. Solid waste generation (tons/day) estimates and categorization into municipal and bulk waste components.
ZonesSWG (kg/d) *SWG (t/d) **%MW%BWMW (ton/Day) ***BW (ton/Day) ****
Zone-11,692,73616930.650.351100593
Zone-22,223,99722240.800.201779445
Zone-31,535,51715360.700.301075461
Zone-4555,9445560.550.45306250
Zone-5274,8742750.80.222055
Zone-6122,6401230.80.29825
Total6,405,7086407--45781829
* Equation (1); ** Equation (2); *** Equation (3); **** Equation (4).
Table 8. Residential waste generation (tons/day) estimates and waste quantities for DtD and CBC modes.
ZonesR(MW) t/d *%DtD%CBCDtD (t/d) **CBC (t/d) ***
Zone-15910.250.75148443
Zone-214320.250.753581074
Zone-38590.250.75215644
Zone-42220.250.7556167
Zone-51660.50.58383
Zone-6590.50.52929
Total3329--8882440
* Equation (7); ** Equation (12); *** Equation (13).
Table 9. Scenario details used to perform the economic analysis.
Revenue StreamsScenario-1Scenario-2Scenario-3
Sale of compost
Sale of recyclables
Sale of biogas-
Environmental benefit—compost
Environmental benefit—recyclables
Environmental benefit—biogas-
Environmental benefit—LFG--
Table 10. Relevant donors/modes for climate finance [77] in the SWM sector.
Donors/Modes for Climate FinancePotential Priority Areas for SWM Sector
Green Climate Fund It invests in low-income countries more affected by climate change, such as Pakistan
Pay For Success It provides independent private funding in the form of capital investment for proposed interventions
New Resilience and Sustainability TrustDebt-free finance for coping with the climate emergency via long-term structural challenges
Asian Pacific Climate Finance FundIt invests in the climate sector and mobilizes sources of private funding for climate
Urban Climate Change Resilience Trust FundIt supports urban infrastructure, policies and capacity-building funding
Japan International Cooperation AgencyIt invests in the technical corporations in the sector
German Aid AgenciesThey provide financial and technical support for climate-change-related initiatives
German Corporation for International CooperationIt supports sustainable infrastructure and climate change funding
The Small Grant Program of the Global Environmental FacilityPrioritized grants are available for the waste sector
World Bank GroupIt will align its finances to meet the goals of the Paris Accord from next year, which will help the sector gain funds for sustainability
Climate Investment FundIt provides funding for renewable energy solutions
United Kingdom Donor AgenciesIt provides funding for low-carbon development
European Union InstitutionsIt provides funding for sanitation and clean development mechanism
Asian Development BankTechnical assistance and investment in climate change fund
Asian Development FundInvestment in environmentally sustainable development
Clean Energy Financing Partnership Facility (under the partnership with ACEF, CCFPS and CEF)It promotes clean energies, improves private climate finance and adaptation to climate mitigation
Urban Environmental Infrastructure FundIt invests in sanitation and climate change mitigation and adaptation
Federal Ministry for Economic Cooperation and DevelopmentIt supports NDCs, cities and climate finance
Global Partnership for Social AccountabilityInvests in climate policies
Islamic Development BankMainstream climate action by investing in the sanitation sector
Publisher’s Note: MDPI stays neutral with regard to jurisdictional claims in published maps and institutional affiliations.

