Article

Impacts of COVID-19 Lockdown on Traffic Flow, Active Travel and Gaseous Pollutant Concentrations; Implications for Future Emissions Control Measures in Oxford, UK

1
School of Geography, Earth and Environmental Sciences, University of Birmingham, Edgbaston Park Road, Birmingham B15 2TT, UK
2
Institute of Applied Health Research, University of Birmingham, Edgbaston Park Road, Birmingham B15 2TT, UK
3
Department of Engineering Science, University of Oxford, Parks Road, Oxford OX1 3PJ, UK
4
Apertum Consulting, Harwell, Oxfordshire, UK
5
Oxford City Council, St Aldates Chambers, 109 St Aldates, Oxford OX1 1DS, UK
6
Ricardo Energy & Environment, Gemini Building, Fermi Avenue, Harwell, Didcot OX11 0QR, UK
7
Oxfordshire County Council, County Hall, New Road, Oxford OX1 1ND, UK
*
Author to whom correspondence should be addressed.
These authors contributed equally to this work.
Sustainability 2022, 14(23), 16182; https://doi.org/10.3390/su142316182
Submission received: 27 October 2022 / Revised: 25 November 2022 / Accepted: 1 December 2022 / Published: 4 December 2022

Abstract

:
The COVID-19 lockdown provided a unique opportunity to test the impacts of changes in travel patterns on air quality and the environment. Therefore, this study provides insights into the impacts of COVID-19 emergency public health “lockdown” measures upon traffic flow, active travel and gaseous pollutant concentrations (NO, NO2 and O3) in Oxford city centre during 2020 using time-series analysis and linear regression methods. Comparisons of traffic counts indicated pronounced changes in traffic volume associated with national lockdown periods. Car volume reduced by 77.5% (statistically significant) during the first national lockdown, with lesser changes in goods vehicles and public transport (bus) activity during the second lockdown. Cycle flow reduced substantively during the first lockdown only. These changes resulted in a reduction in nitric oxide (NO) and nitrogen dioxide (NO2) concentrations of 75.1% and 47.4%, respectively, at roadside, and 71.8% and 34.1% at urban background during the first lockdown period. In contrast ozone (O3) concentrations increased at the urban background site by 22.3% during the first lockdown period, with no significant changes in gaseous concentrations during the second lockdown at either roadside or urban background location. The diurnal pattern of peak mean NO and NO2 concentrations reduced in magnitude and was shifted approximately 2 h earlier in the morning and 2 h later in the evening (roadside) and 3 h earlier in the morning and 3 h later in the evening (urban background). Our findings provide an example of how gaseous air quality in urban environments could respond to future urban traffic restrictions, suggesting benefits from reductions in peak and daily NO2 exposures may be offset by health harms arising from increases in ground level O3 concentrations in the summer months.

1. Introduction

Ambient air pollution is a major global environmental and health concern which exerts direct and indirect health, environmental and economic costs on urban areas, public and private sector organisations [1]. In urban areas, air pollution has been identified as one of the top five causes of death, ahead of road traffic accidents and excess winter deaths [2]. It is estimated that between 28,000 and 36,000 people die prematurely each year in the United Kingdom (UK) due to air pollutant exposure, with an average reduction in life expectancy of up to 6 months [3].
The continued growth of motor transportation in many urban settings in recent decades has increased concerns around the impact of transport-related air pollutant emissions upon human health and the quality of the urban environment [4]. These concerns have driven increasing demand for effective transport, emissions and air quality management policies in UK towns and cities, with a focus upon intervention measures intended to achieve legal compliance with legally binding air quality objectives [5] and to accelerate the uptake of low or ‘zero’ emission vehicles [6].
Petrol and diesel vehicle emissions are an important source of nitric oxide (NO), nitrogen dioxide (NO2) (the main nitrogen-containing atmospheric pollutant gases) and particulate matter (PM), including volatile organic compounds (VOC) such as benzene, aldehyde and polycyclic aromatic hydrocarbons (PAHs) [7,8]. Air pollutant emissions related to road transport combustion sources also affect the formation of secondary pollutants and oxidants, such as ozone (O3), hydroxyl radicals (OH) and peroxyacetyl nitrate (PAN), thereby contributing to climate change [7]. O3 is formed by photochemical oxidation of VOCs in the presence of NOx with ground level O3 variations influenced by the availability of sunlight and balance between VOC and NOx levels [9]. Over the past 2 decades there has been an increase in the probability of high mean O3 concentrations in UK urban centres, attributed to reduced NOx emissions [10].
The relationship between vehicle pollutant emissions and adverse human health outcomes is now well recognized. NOx can irritate the lungs, increasing susceptibility to acute and chronic cardio-respiratory disease. People with chronic respiratory problems such as asthma or chronic obstructive pulmonary disease (COPD) are more susceptible to the effects of NO2 exposure. Among children, NOx may cause longer-term damage to lung development, limiting lung growth and capacity [11]. Epidemiological studies have consistently reported an association between residential proximity to high-traffic roads and increased risk of adverse health effects [12,13,14]. These include increased risks of asthma, low birth weight and developmental effects, cardiovascular disease, cancer and premature death [11,15]. Short-term exposure to ground-level O3 can also trigger inflammation of the respiratory tract, eyes, nose and throat and cardiovascular effects have also been identified [16].
In the UK, it is estimated that around 34% of NOx emissions arise from road transport, with further contributions from industry and domestic combustion [17]. A 2017 Defra report identified that the main source of roadside NOx was motor vehicles, responsible for approx. 80% of NOx concentrations at roadside, with diesel vehicles a major emissions source [18]. The NOx produced by combustion is mainly NO, whether from a mobile or stationary source, with only a small proportion as direct NO2 emissions [19]. The overall traffic volume in built-up areas is closely related to NOx levels [20]. Further, NOx concentrations in urban areas typically show greater spatial and diurnal temporal variability than those arising from non-road sources. Reliable data regarding the impact of changes in traffic volume and vehicle type upon local NO and NO2 concentrations and understanding of any potential O3 increases are relevant for developing appropriate UK air quality abatement policies.
The coronavirus disease (COVID-19), caused by Severe Acute Respiratory Syndrome Coronavirus 2 (SARS-CoV-2), emerged in China in late 2019, leading to a global pandemic [21]. As a result of the outbreak, countries around the world rapidly adopted a series of emergency public health measures to contain viral transmission, including social distancing, school closures and travel restrictions [22,23]. The promulgation of these measures was recognised to substantially impact upon local traffic volumes and related air pollution levels, initially widely reported as positive improvements in multiple cities [24]. The UK government introduced a series of emergency public health protection measures to control the pandemic, with a full national ‘lockdown’ implemented from 23 March 2020 [25]. According to data from the Department of Transport (DfT), by mid-April 2020, overall UK traffic volume was reduced by about 70% [24]. In urban environments, after adjustment for meteorological changes, the average urban NOx concentration was reported to reduce by 30–40%, with an average NOx concentration reduction of 20–30% across UK cities [24].
Previous research undertaken by the study team in Oxford City found that reductions in roadside NO2 emissions consistent with the first lockdown period could prevent 48 lost-life years and deliver economic benefits of up to £2.5 million [26]. However, the extent to which public health benefits arising from reduced gaseous traffic emissions could be offset by increased O3 concentrations in a low-emission future context remains uncertain [27]. Providing effective local clean air strategies requires a clear understanding of the local air quality benefits from primary city-level interventions. The COVID-19 lockdown provided a unique and natural experimental opportunity to test the potential effects of short-term traffic interventions on Oxford’s air quality and the environment.
The purpose of this study was therefore to explore the impacts of COVID-19 control measures upon traffic levels and ambient air quality in Oxford from 1 January to 31 December 2020, with a focus upon gaseous pollutant concentrations. By integrating regulatory air quality monitoring data with transport mode and traffic flow data obtained from roadside detection sensors, we consider temporal changes in roadside NO and NO2 concentrations and urban background O3 concentrations, undertaking comparisons both before, within and between lockdown periods and identifying the dominant contributors to these changes.

2. Materials and Methods

2.1. Study Setting

Oxford is a dynamic international city, with a population of 152,450 residents and around 34,000 students enrolled at two universities [28]. At least 46,000 people commute into the city for work daily [29]. Oxford suffers from the recognized challenge of poor air quality with road transport the main source of NO2 emissions [30]. In response to these challenges, Oxford City Council declared the whole city an Air Quality Management Area (AQMA) in 2010 and implemented a bus-based central Low Emission Zone (LEZ) from 2014 [31]. Data from the city’s existing regulatory monitoring locations indicated that, between 2016 and 2017, levels of NO2 across the city fell by an average of 22.7% [32]. However, in 2019, levels remained above legal limits in six central locations [33]. Seeking to further improve city centre air quality, Oxford City and Oxfordshire County Councils committed to introducing a Zero Emissions Zone from February 2022 alongside stricter emissions requirements for the bus-based LEZ introduced in summer 2020 [34,35,36]. The City Council has also approved a revised Air Quality Plan, including a target of 30 µg/m3 annual average target for NO2 concentrations [33].

2.2. Data Sources and Processing

2.2.1. Air Quality Data

For this study, NO and NO2 data for the period 1 January to 31 December 2020 were obtained from two monitoring locations in Oxford, namely the city council operated High Street automatic monitoring station (roadside) and St Ebbe’s urban background station, the latter being part of the UK Automatic Urban and Rural Network (AURN) (UKA00518). Data for O3 were available at the urban background St Ebbe’s AURN site only. A map showing the study monitoring locations is provided in Figure 1. The roadside site is located adjacent to High Street, 3.7 m from the edge of the road, close to the city centre and surrounded by tourist attractions, shopping centres and residential buildings. Hourly measured NO and NO2 concentrations at the roadside monitoring site were obtained from the Oxfordshire Air quality website [37]. The surrounding environment of St Ebbe’s (urban background) site is relatively quiet within a residential suburban area. Hourly measurements of NO, NO2 and O3 concentrations at this monitoring site were obtained from the UK Department for Environment, Food and Rural Affairs (Defra) Automatic Urban and Rural Network (AURN) [38].

2.2.2. Meteorological Data

Hourly meteorological data comprising relative humidity (RH) and air temperature (T) measured at the St Ebbe’s AURN site for 2020 (1 January to 31 December) were obtained from Ricardo Plc.

2.2.3. Transport Mode and Traffic Flow Data

Transport mode and traffic flow data for the High Street location for the time period 1 January to 31 December 2020 were obtained from two ‘Vivacity Labs’ roadside vehicle detection sensors managed by Oxfordshire County Council [39]. Hourly classified counts were classified by transport mode (cars, motorcycles, buses, Large Goods Vehicles—LGVs, Ordinary Goods Vehicles—OGVs, bicycles).

2.3. Timeline for Introduction of Public Health Control Measures

Information regarding the timing and specific requirements for public health control measures was obtained from relevant national and governmental websites [40,41] and correspondence with relevant local authority officers (Oxford City Council, Oxfordshire County Council). The timeline for specific policies and implementation dates is shown in Figure 2. From 16 March 2020, social activities were not encouraged, although not explicitly prohibited. Starting on 21 March 2020, all schools closed and on 23 March 2020 the first national ‘lockdown’ period was initiated until 15 June 2020. From 5 November 2020, the Government implemented the second lockdown period in England until 2 December 2020. A third national lockdown was imposed from 5 January 2021 after a subsequent resurgence in cases during the Christmas and New Year period. The study focuses on two national lockdown periods in England during 2020; the first lockdown included the longest period of public activity restrictions, while the second lockdown had a relatively shorter period (Figure 2).

2.4. Statistical Analysis

In order to determine whether public health control measures were associated with statistically significant changes in NO2, NO and O3 air pollutant concentrations, an analysis was undertaken to compare average levels during four defined time periods in 2020: (i) pre-lockdown (1 January–22 March); (ii) lockdown 1 (23 March–15 June); (iii) Inter-lockdown between national lockdown periods–(16 June–4 November); (iv) lockdown 2 (5 November–2 December). Stepwise linear regression analysis was adopted to assess the relationship between predictor variables: meteorological factors (RH and temperature), transportation mode counts (motorbike, LGV—Light Goods Vehicles, OGVs- Ordinary Goods Vehicles, bus and car counts) and the independent variable: hourly air pollutant concentrations (NO and NO2 concentrations). Stepwise (forward and backward) selection was undertaken by iteratively adding and removing predictor variables to obtain the subset of variables resulting in the best performing model to predict pollutant concentrations. Regression analysis was performed using IBM SPSS statistics—version 25.0 (IBM, Armonk, NY, USA) [42] and RStudio programming tool was used for all further data visualisation and analysis (RStudio, PBC, Boston, MA, USA) [43].

3. Results and Discussion

3.1. Impacts of National Lockdown Measures upon Traffic Flow, Active Travel and Air Quality in Oxford

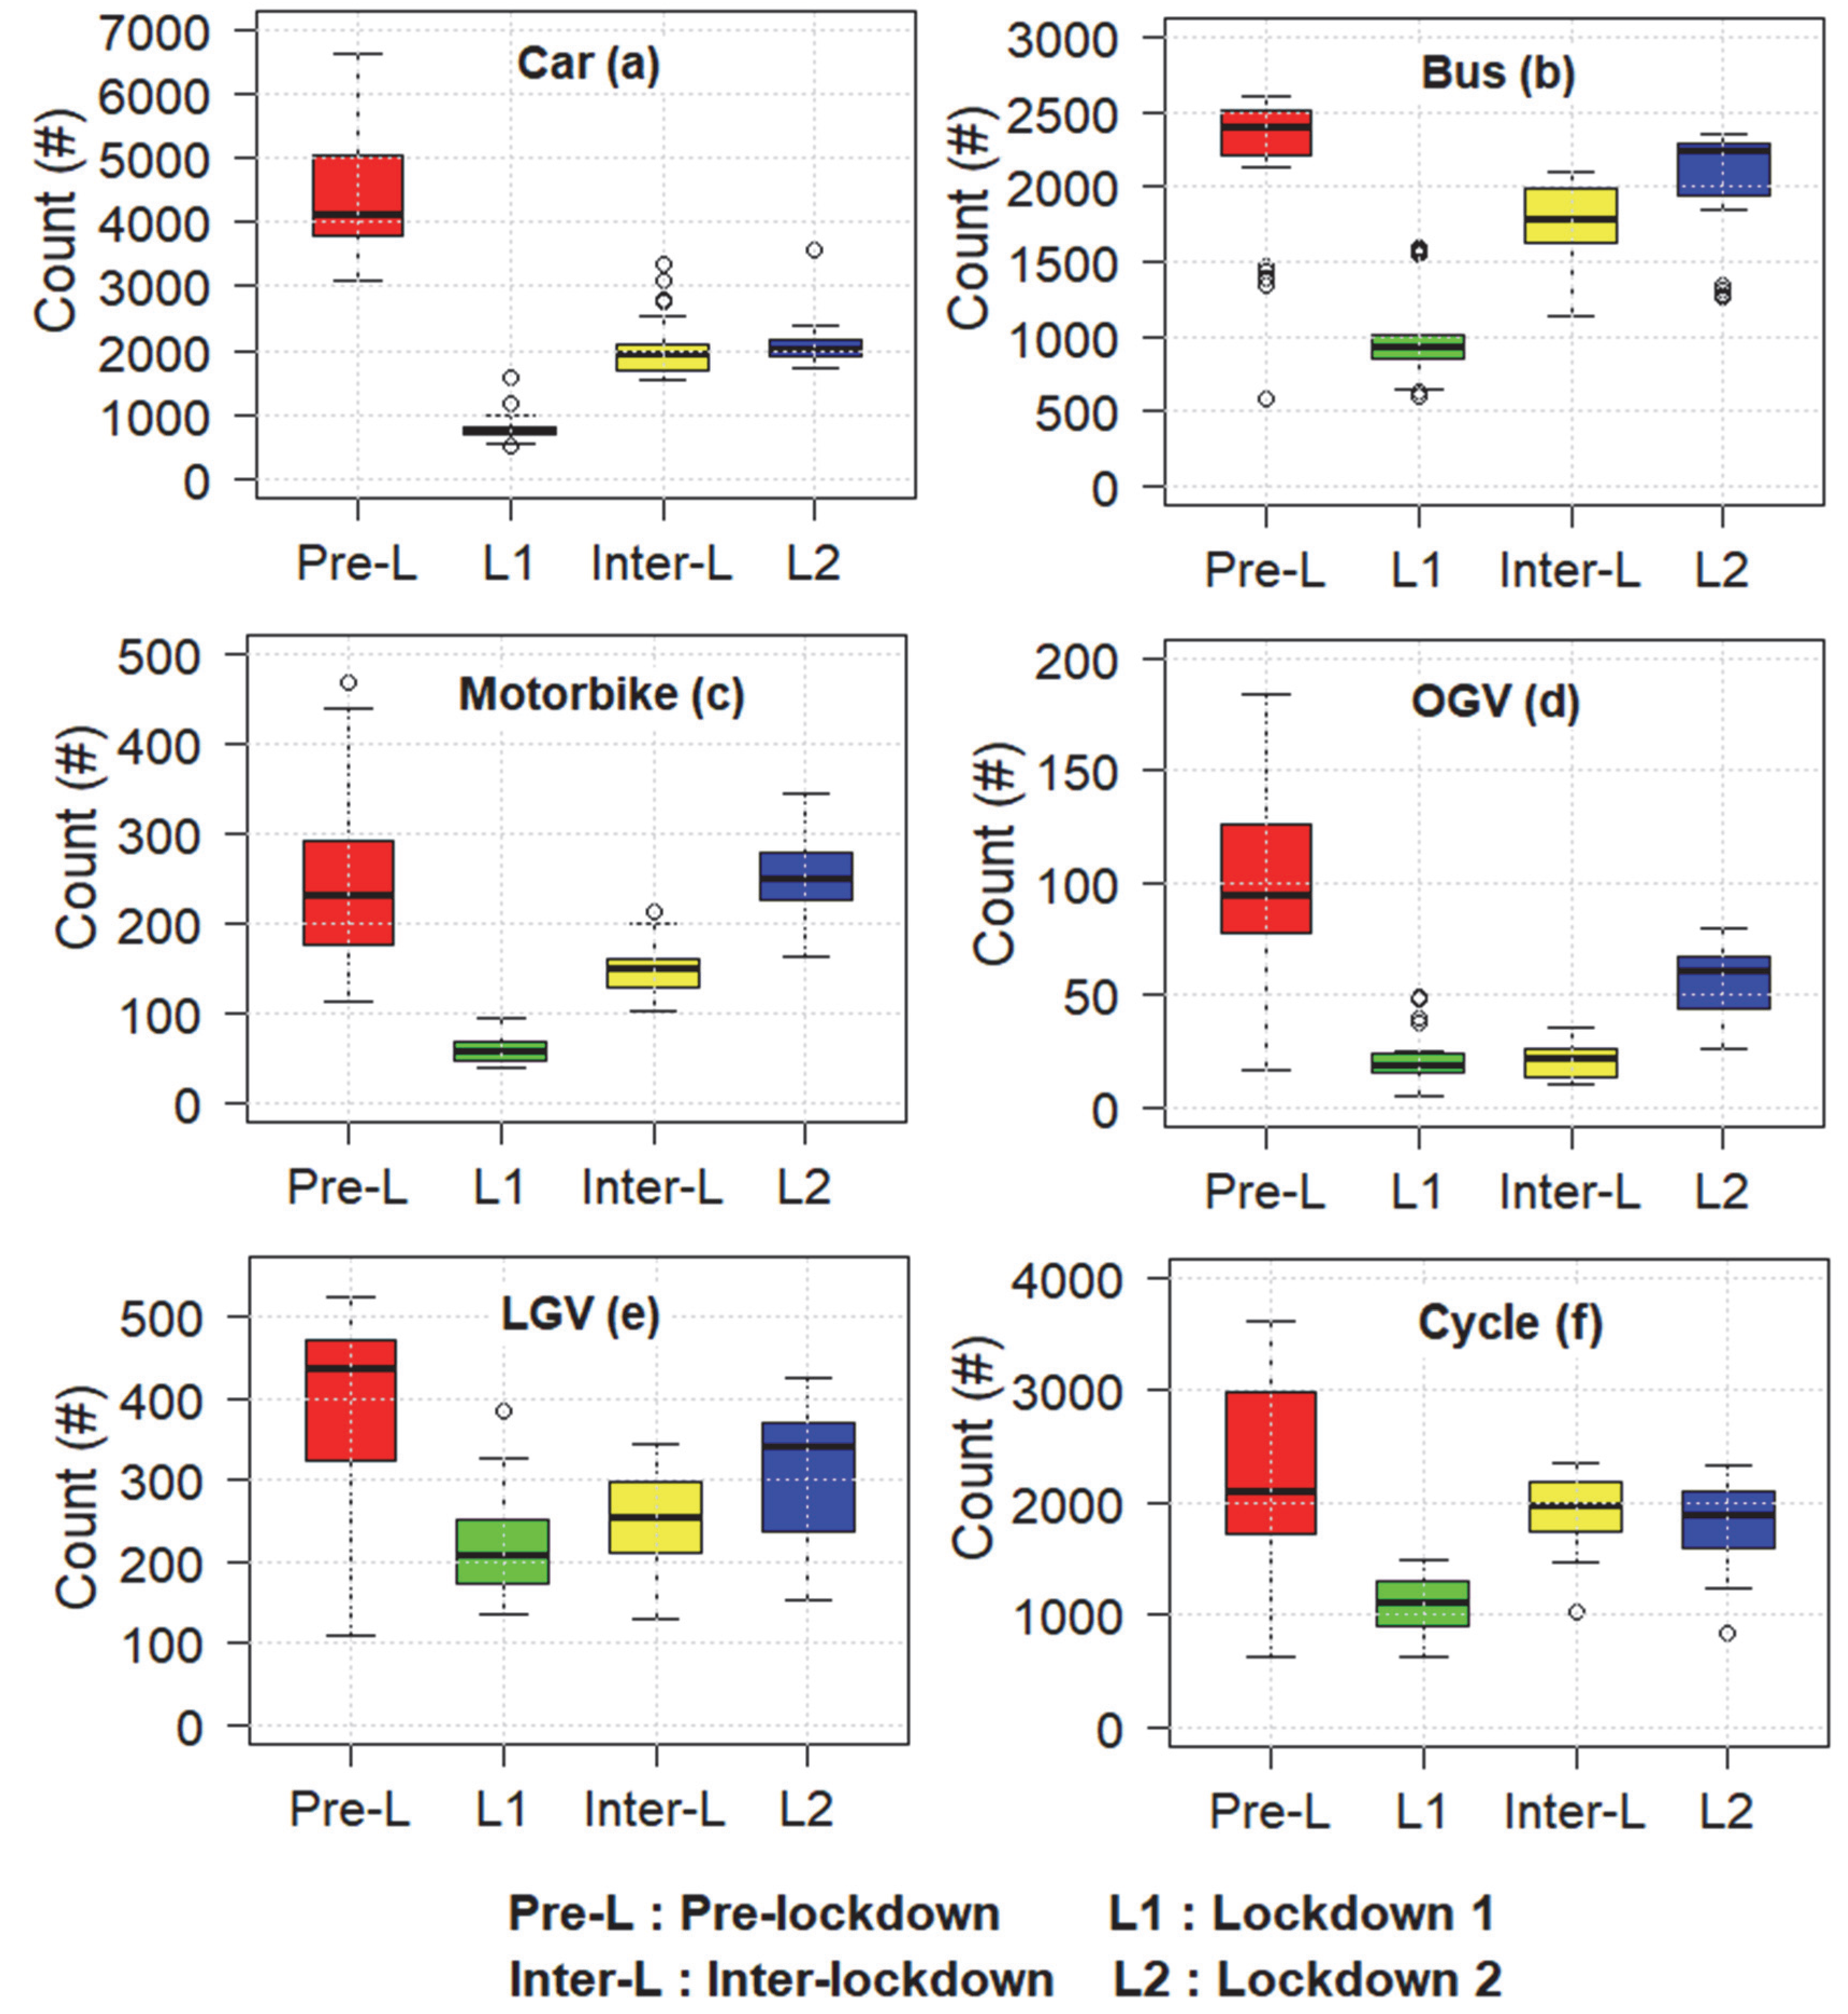
3.1.1. Analysis of Transport Modal Share and Traffic Flow Changes during the COVID-19 Pandemic in 2020

Figure 3 compares changes in daily transport modal share and traffic flow at Oxford High Street for pre-lockdown, lockdown 1, inter-lockdown and lockdown 2 periods, respectively, in 2020. It is evident that public health control measures exerted substantial impact on overall daily traffic movements during lockdown 1, with a clear downward trend for all modes after the closure measures were adopted. Overall, the daily traffic flow for specific vehicle types: car, bus, motorcycle, OGV and LGV decreased by 77.5%, 56.0%, 67.5%, 73.8% and 40.6%, respectively, during lockdown 1, compared to the pre-lockdown period. It is also identified that the overall daily traffic flow for specific types of vehicles (car, bus, motorcycle, OGV and LGV) during the inter-lockdown and lockdown 2 periods remained lower than the pre-lockdown periods (Figure 3), suggesting levels did not return to pre-pandemic baseline at any stage of the study period after March 2020. The second lockdown had overall lesser effects upon traffic flow with levels for all vehicle types remaining high compared to the inter-lockdown period (Figure 3). Daily cycle flow had a similar pattern to motor vehicle flow for lockdown 1 and the inter-lockdown period but showed evidence of a reduction again during lockdown 2. These trends contrast with those reported in Department for Transport statistics, which suggested a 300% increase in cycling from 16 March–1 June when indexed against the equivalent period of 2019, with monthly figures remaining above baseline levels until October 2020. These differences are likely to reflect the relatively high modal share of cycling trips for utility purposes in Oxford compared to other UK cities, where changes in recreational cycling were more pronounced.
Local changes in vehicle traffic flow exceeded those reported in national figures (40% reduction in April 2020 relative to pre-lockdown) and it is likely that traffic movements within Oxford were heavily influenced by changes in the educational sectors, including reduced attendance at schools, colleges and universities during term time in the first lockdown period. The University of Oxford is the largest employer in Oxfordshire, supporting around 33,700 jobs and, therefore, transport patterns will be strongly influenced by measures influencing this sector [44]. Trends in goods vehicle volumes are also consistent with those observed in other UK cities; however, the reduction in pedal cycle traffic in both the first and second lockdown periods contrasts with an overall 45% increase at a national level [45]. This is likely to reflect the relatively high contribution of commuting and utility cycling trips taken by cycle among residents living in Oxford at the pre-pandemic baseline, with recreational cycling more likely to take place outside the city [46].

3.1.2. Temporal Trends of Daily Mean Nitrogen Oxides and Ozone Concentrations in 2020

Figure 4 compares the daily mean NO, NO2, and O3 concentrations at the High Street (roadside) and St Ebbe’s (urban background) sites, highlighting impacts of national lockdowns measures. Typically, concentrations of NO and NO2 at the roadside site were higher than those at the urban background site (Figure 4). The overall mean concentrations of NO and NO2 in 2020 were 17.1 ± 20.5 µg/m3 and 26.5 ± 14.0 µg/m3, respectively, at roadside, whereas at the urban background site were 5.0 ± 11.7 µg/m3 and 11.0 ± 7.0 µg/m3 respectively. Near the dominant emission source (e.g., vehicles at the roadside site), the concentration of pollutants is therefore typically higher for both NO and NO2, although observed differentials decreased during respective lockdown periods. It is noted that before the first lockdown measures were implemented in 2020, the daily mean peak concentrations of NO and NO2 at the High Street (roadside) site were 130.6 µg/m3 and 72.1 µg/m3, whereas the corresponding daily average peaks at the St Ebbe’s (background) site were 104.6 µg/m3 and 38.5 µg/m3. The daily mean peak concentrations of NO and NO2 during the first lockdown period were 21.3 µg/m3 and 45.4 µg/m3, respectively, at the roadside site and 11.4 µg/m3 and 24.3 µg/m3, respectively, at urban background site. By contrast, during the second lockdown, the daily mean peak concentrations of NO and NO2 were 165.7 µg/m3 and 63.0 µg/m3, respectively, at the roadside site and 107.3 µg/m3 and 37.1 µg/m3, respectively, at urban background sites. These differences, which are also influenced by seasonal trends, suggest a more marked impact of traffic changes during the first lockdown period upon peak roadside compared to background pollutant levels, with implications for future control strategies.
Further, Figure 4 shows that the dates of the peak concentrations of NO and NO2 at both sites before the first lockdown period coincide, all occurring on 21 January (Tuesday in the third week), 6 February (Thursday in the sixth week) and 6 March (Friday in the ninth week), 2020. These were all days with minimum temperature < 0 °C and, therefore, NOx concentrations are likely to be influenced by cold start driving cycles and inversion layer effects. We also observe similar diurnal profiles for NO and NO2 on a weekly basis.
A rapid drop in daily mean NO and NO2 concentrations was also observed at both roadside and urban background sites after the first lockdown measures were introduced. At this time, the NO2 concentration at the roadside remained elevated above the background value, although the NO concentration on the roadside is sometimes higher than the background value and sometimes lower than the background value. This suggests that public health control measures were not solely responsible for the NO2 reduction, because the concentration of the secondary pollutant will be affected by many other factors, including meteorological conditions and contributions from sources other than vehicular traffic. It is noted that, after the second national lockdown measures were implemented on 5 November 2020, daily mean concentrations of NO and NO2 also decreased at both roadside and urban background sites; however, this was not sustained, with concentrations increasing approximately 2 weeks after restrictions were imposed (Figure 4).
In contrast to changes in daily mean temporal trends of NO and NO2 concentrations, levels of O3 (measured at urban background only) increased during the first lockdown period relative to the pre-lockdown period. Less pronounced temporal changes in O3 levels were observed during the second national lockdown period as compared to the inter-lockdown period.

3.1.3. Changes in Hourly Diurnal Profile of Traffic Flow and Air Quality Levels during National Lockdowns in Oxford

This section presents the analysis of hourly diurnal changes in traffic counts for different vehicle types and gaseous pollutant (NO, NO2 and O3) concentrations during national lockdowns in comparison to the pre-lockdown and inter-lockdown periods in 2020 (Figure 5 and Figure 6). A clear reduction was observed in the mean hourly traffic counts for specific vehicle types (car, bus, motorbike, OGV, LGV and cycles) during the first lockdown as compared to pre-lockdown (Figure 5). The first lockdown also saw changes in the traffic profile throughout the day, with a flattened morning peak of lower magnitude for all types of vehicles. However, no changes were observed in the mean diurnal patterns of traffic flow (for all types of vehicles) during the second lockdown as compared to the inter-lockdown period, indicating that there was no pronounced impact of the lockdown measures on traffic at High Street (Figure 5). Instead, during the second lockdown period, a relatively higher magnitude of traffic volume for buses, LGVs and motorbikes was observed compared to inter-lockdown.
The typical diurnal pattern of trace gases showed that the level of roadside pollutants was strongly correlated with traffic levels (Figure 5 and Figure 6). Notably, in comparison to pre-lockdown, clear changes were observed in the hourly pattern of trace gases both at roadside and urban background sites during the first lockdown (Figure 6). The NO and NO2 mean diurnal time-series were observed to be lower than pre-lockdown at both roadside and urban background sites, where reductions for NO concentrations were more pronounced, uncovering effects of lowered traffic volumes associated with closure measures. Notably, the hours for peak mean NO and NO2 concentrations during the first lockdown were shifted from the pre-lockdown pattern at both roadside (approximately 2 h earlier in the morning and 2 h later in the evening) and urban background (approximately 3 h earlier in the morning and 3 h later in the evening) (Figure 6). In contrast to NO and NO2, increased concentrations of O3 were observed with different hourly patterns at the urban background site during the first lockdown compared to pre-lockdown. Interestingly, during the second lockdown, the average daily O3 time-series similar to that of NO and NO2 were observed, but with relatively higher concentrations compared to the inter-lockdown at both roadside and urban background sites. These results clearly indicate that second lockdown measures were not associated with reduced gaseous air pollutant concentrations in Oxford, as reported previously [26]. Further, in contrast to NO and NO2, the mean O3 concentration was observed to be lower, with distinct peaks during the second lockdown, as compared to the inter-lockdown period (Figure 6).

3.1.4. Overall Changes in Gaseous air Pollutant Concentrations during COVID-19 Lockdown in Oxford

Table 1 shows a comparison of overall daily mean pollutant concentrations during pre-lockdown, lockdown 1, inter-lockdown and lockdown 2. In general, NO and NO2 daily mean concentrations decreased after the first lockdown measures at both roadside and urban background sites. Although no major effects of the second lockdown measures on air pollutants were identifiable, relatively higher daily mean concentrations of NO and NO2 were noted at both sites during the second lockdown compared to the inter-lockdown period (Table 1). After the first closure measures were implemented, NO concentrations at roadside and urban background sites reduced by 75.1% and 71.8%, respectively, and NO2 by 47.4% and 34.1%, respectively. However, during the second lockdown as compared to the pre-lockdown period, overall daily mean concentrations of NO and NO2 increased by 102.6% and 22.4%, respectively, at the roadside site and 314.6% and 66.0% at the urban background site, respectively (Table 1). These differences are likely to be due to seasonal effects, with NOx higher during the winter months. Furthermore, an increase in the overall daily mean concentration of O3 was observed during the first national lockdown at the urban background site. Specifically, there was a 22.3% increase in the overall daily average concentration of O3 during the first lockdown period compared to the pre-lockdown period, while the concentration declined by 25.4% from the inter-lockdown to second lockdown period (Table 1).

3.2. Factors Affecting NO and NO2 Concentrations during COVID-19 Lockdowns at the Oxford High Street Location

The outputs from the final model obtained by stepwise linear regression analysis are shown in Table 2. Here, the unstandardized coefficient (β) shows how much NO and NO2 concentrations varies with an independent factor when all other independent factors are constant. By contrast, a standardized Beta coefficient is representing the strength or relative magnitude of the effects of individual variables (i.e., car, bus, motorbike, OGV, LGV, RH and temperature) to NO and NO2 concentrations. The higher the absolute value of the β coefficient represents the greater effect of individual predictor variables on NO and NO2. The results showed that the concentrations of hourly roadside NO and NO2 concentrations were significantly (p < 0.001) related to meteorological factors notably the air temperature (Table 2), which had the strongest correlation in all four periods. This is consistent with previous research indicating that light-duty diesel NOx emissions are highly dependent upon ambient temperature, with lower temperatures resulting in higher NOx emissions [47]. At the same time, under normal circumstances, the emissions of various vehicles were closely related to the concentration of NO and NO2.
The results highlight that meteorology imparts a significant effect upon pollutant concentrations throughout the year, with lower temperatures and increased humidity associated with higher concentrations. Although buses and cars were typically the major sources of NO and NO2 emissions, this relationship was weaker during the first lockdown and pollutants were more affected by other factors, with buses and OGVs the main emissions source at this time (Table 2). This spring period also coincides with agricultural fertilizer spreading: a recognized important source of NOx emissions (amongst others) [48]. The relationship between traffic factors and NO and NO2 was also observed to be relatively stronger during the second lockdown than during the first and inter-lockdown periods, where the contribution of buses, cars and LGVs to the pollutant concentrations was increased significantly during the second lockdown (Table 2).
Since NOx is closely related to vehicle emissions, reducing overall daily traffic flow is an effective method to control NOx concentrations. Policy measures intended to achieve these changes include those which incentivize modal shift, such as redistribution of road space to pedestrians and cyclists, parking restrictions, pedestrianization schemes and selected modal filters, as reflected in the most recent Oxford Air Quality plan [49,50]. In February 2022, a Zero Emission Zone (ZEZ) was introduced in the city centre, with charges for non-compliant emission vehicles entering the zone between 07:00 and 19:00 daily. Although the initial zone does not include the study locations, expansion to the whole city is planned by 2035 [51].
Although we identify that traffic reduction arising from public health control measures had a positive effect in reducing NO and NO2 concentrations, levels remained elevated even during national lockdown periods, and broader pollution control measures which consider contributions from non-vehicle sources and surrounding areas are also important to achieve further improvements towards health-based limit values. To date, air quality gains in Oxford have been achieved by introduction of bus-based emissions control measures, including a bus-based LEZ introduced in 2014 and extended in 2020 to require Euro VI compliance for all services operating within the city. As a result of these measures, and advances in vehicle technology, NOx levels reduced by 29% over the time period from 2009 to 2019 [33]. However, it is widely recognised that broader measures will be required to achieve further incremental progress towards WHO 2021 Global Air Quality Guidelines [52]. Further, when considering health benefits achieved by reduced NO2 concentrations, it is important to consider potential exceedances for O3 limits. WHO 2021 guidelines include a 100 µg/m3 8-h daily maximum, reducing to 60 µg/m3 during the peak season, typically occurring during June or July in the UK. In Oxford, we identify peak seasonal O3 levels in the range of 50–100 µg/m3; therefore, benefits of reducing NOx in the context of future traffic reduction measures should be considered in the context of potential increases in O3 exceedances in this context.

4. Conclusions

It is widely recognized that emergency public health control measures introduced to prevent COVID-19 transmission have exerted a major impact on travel behaviors among those living and working in cities in the UK. We find natural experimental evidence of the effects of these changes upon traffic flow and ambient air quality in this case study, providing valuable insights into future management strategies in small and medium-sized. Overall, we identify pronounced reductions in overall traffic volume, including a 77.5% reduction in cars during the first national lockdown. Interestingly, we also identified a reduction in cycle flow during the first lockdown period, suggesting that pre-pandemic car trips were not being replaced by cycle trips at this specific location. We found that buses and cars were the major sources of NO and NO2 emissions on Oxford High Street, where the contribution of buses, cars and LGVs to the pollutant concentrations was relatively higher during the second lockdown as compared to the first lockdown period. The first national lockdown was also characterized by substantive reductions in daily mean NO and NO2 concentrations of 75.1% and 47.4%, respectively, at roadside and from 71.8% and 34.1%, respectively, at urban background. In contrast, daily mean NO and NO2 concentrations increased during the second lockdown compared to the pre-lockdown period at both roadside and urban background sites. Furthermore, we identify that daily mean O3 concentrations at urban background increased during the first lockdown by 22.3%, coinciding with the warmer summer months; however, the concentration declined by 46.1% during the second lockdown from the pre-lockdown period, coinciding with cooler periods. Meteorology was found to be an important factor in assessing changing pollution levels, where air temperature was closely related to NO and NO2 concentrations in addition to traffic emissions.
Importantly, shifts in diurnal pollutant concentration profiles characterized by lesser magnitude peak concentrations were identified as occurring earlier and later in the day compared to pre-pandemic baseline.
Our findings from this novel study utilizing real-time air quality and roadside detection sensor data in Oxford, suggest abrupt changes in personal transport demand as a consequence of COVID-19 restrictions, resulting in reduced relative contribution of cars and increased relative contribution of buses and goods vehicles to NO2 and NO levels at roadside. Importantly, we identify that reduced demand for transport can mitigate peak magnitude concentrations of transport related pollutants and indicates the importance of future traffic reduction measures which may protect against high magnitude NO and NO2 personal exposure in the morning and evening periods. It is also evident that traffic reduction may be associated with increased O3 levels of future relevance in the context of reduced NO2 emissions from vehicles as a consequence of phasing out petrol and diesel vehicles [53]. Further research is required specifically to evaluate effectiveness of national and local interventions to deliver environmental and health benefits in small UK cities to inform effective public policy decisions. Further, it is important to apply this learning and share best practice to address emerging challenges of reducing carbon emissions from the transport sector in similar settings worldwide.

Author Contributions

A.S.: writing—original draft, methodology, formal analysis, data visualization; T.G.: writing—original draft, formal analysis; T.B.: data curation, project administration; P.A.: validation; F.C.P.L.: funding acquisition, methodology, investigation, supervision, writing—review and editing; B.S.: data curation, validation; G.E.: funding acquisition, data curation; R.A.: funding acquisition, resources; S.C.: funding acquisition; G.N.T.: funding acquisition, methodology; F.D.P.: funding acquisition, supervision; S.E.B.: writing—original draft, methodology, funding acquisition, supervision, writing—review and editing. All authors have read and agreed to the published version of the manuscript.

Funding

The research was funded by the Natural Environment Research Council grants ‘Assessing environmental impacts of COVID-19 emergency public health measures in Oxford City’ [NE/V010360/1] and ‘Optimising air quality and health benefits associated with a low-emission transport and mobility revolution in the UK’ [NE/V002449/1] This study/project is also funded by the National Institute for Health Research (NIHR) [PHR 130095]. The views expressed are those of the author(s) and not necessarily those of the NIHR or the Department of Health and Social Care.

Institutional Review Board Statement

Ethical approval for this study was provided on 5 January 2021 by the University of Birmingham Science, Technology, Engineering and Mathematics Ethical Review Committee. ERN_20-0831.

Informed Consent Statement

Not applicable.

Data Availability Statement

The datasets used in this study have been obtained from publicly available data sources, where detailed links are provided within the manuscript.

Acknowledgments

We are grateful to key members of the OxAria Study Advisory Group (notably Neil Harris and the late Martin Williams) for their expert advice and support for undertaking all project activities. We are grateful to Jason Taylor (Oxfordshire County Council) for assistance with accessing roadside vehicle detection sensor data and location details.

Conflicts of Interest

The authors declare no conflict of interest.

References

  1. RCPCH. Every Breath We Take: The Lifelong Impact of Air Pollution; Royal College of Physicians: London, UK, 2016; Available online: https://www.rcplondon.ac.uk/projects/outputs/every-breath-we-take-lifelong-impact-air-pollution (accessed on 20 January 2022).
  2. PHE. Estimation of Costs to the NHS and Social Care Due to the Health Impacts of Air Pollution: Summary Report; Public Health England: London, UK, 2018. Available online: https://assets.publishing.service.gov.uk/government/uploads/system/uploads/attachment_data/file/836720/Estimation_of_costs_to_the_NHS_and_social_care_due_to_the_health_impacts_of_air_pollution.pdf (accessed on 20 January 2022).
  3. PHE. Associations of Long-Term Average Concentrations of Nitrogen Dioxide with Mortality (2018): COMEAP Summary; Public Health England: London, UK, 2018. Available online: https://www.gov.uk/government/publications/nitrogen-dioxide-effects-on-mortality/associations-of-long-term-average-concentrations-of-nitrogen-dioxide-with-mortality-2018-comeap-summary (accessed on 18 February 2022).
  4. Costabile, F.; Allegrini, I. A new approach to link transport emissions and air quality: An intelligent transport system based on the control of traffic air pollution. Environ. Model. Softw. 2008, 23, 258–267. [Google Scholar] [CrossRef]
  5. DERFA. UK Air Information; Department for Environment Food & Rural Affairs: London, UK, 2021. Available online: https://uk-air.defra.gov.uk (accessed on 1 June 2021).
  6. DBEIS. COP26 Declaration on Accelerating the Transition to 100% Zero Emission Cars and Vans; Department for Business, Energy & Industrial Strategy: London, UK, 2021. Available online: https://www.gov.uk/government/publications/cop26-declaration-zero-emission-cars-and-vans/cop26-declaration-on-accelerating-the-transition-to-100-zero-emission-cars-and-vans (accessed on 18 February 2022).
  7. Nelson, P.F.; Tibbett, A.R.; Day, S.J. Effects of vehicle type and fuel quality on real world toxic emissions from diesel vehicles. Atmos. Environ. 2008, 42, 5291–5303. [Google Scholar] [CrossRef]
  8. Senecal, K.; Leach, F. Racing toward Zero: The Untold Story of Driving Green. 2021. Available online: https://www.sae.org/publications/books/content/r-501/ (accessed on 20 January 2022).
  9. Monks, P.S.; Archibald, A.T.; Colette, A.; Cooper, O.; Coyle, M.; Derwent, R.; Fowler, D.; Granier, C.; Law, K.S.; Mills, G.E.; et al. Tropospheric ozone and its precursors from the urban to the global scale from air quality to short-lived climate forcer. Atmos. Chem. Phys. 2015, 15, 8889–8973. [Google Scholar] [CrossRef] [Green Version]
  10. Finch, D.P.; Palmer, P.I. Increasing ambient surface ozone levels over the UK accompanied by fewer extreme events. Atmos. Environ. 2020, 237, 117627. [Google Scholar] [CrossRef]
  11. Brauer, M.; Hoek, G.; Van Vliet, P.; Meliefste, K.; Fischer, P.H.; Wijga, A.; Koopman, L.P.; Neijens, H.J.; Gerritsen, J.; Kerkhof, M.; et al. Air Pollution from Traffic and the Development of Respiratory Infections and Asthmatic and Allergic Symptoms in Children. Am. J. Respir. Crit. Care Med. 2002, 166, 1092–1098. [Google Scholar] [CrossRef] [PubMed] [Green Version]
  12. Finkelstein, M.M.; Jerrett, M.; Sears, M.R. Traffic Air Pollution and Mortality Rate Advancement Periods. Am. J. Epidemiol. 2004, 160, 173–177. [Google Scholar] [CrossRef] [PubMed]
  13. Hoek, G.; Brunekreef, B.; Goldbohm, S.; Fischer, P.; van den Brandt, P.A. Association between mortality and indicators of traffic-related air pollution in the Netherlands: A cohort study. Lancet 2002, 360, 1203–1209. [Google Scholar] [CrossRef] [PubMed] [Green Version]
  14. Wong, C.-M.; Ou, C.-Q.; Chan, K.-P.; Chau, Y.-K.; Thach, T.-Q.; Yang, L.; Chung Roger, Y.-N.; Thomas Graham, N.; Peiris Joseph Sriyal, M.; Wong, T.-W.; et al. The Effects of Air Pollution on Mortality in Socially Deprived Urban Areas in Hong Kong, China. Environ. Health Perspect. 2008, 116, 1189–1194. [Google Scholar] [CrossRef] [PubMed] [Green Version]
  15. Harrison, R.M.; Leung, P.-L.; Somervaille, L.; Smith, R.; Gilman, E. Analysis of incidence of childhood cancer in the West Midlands of the United Kingdom in relation to proximity to main roads and petrol stations. Occup. Environ. Med. 1999, 56, 774–780. [Google Scholar] [CrossRef] [PubMed] [Green Version]
  16. Nuvolone, D.; Petri, D.; Voller, F. The effects of ozone on human health. Environ. Sci. Pollut. Res. 2018, 25, 8074–8088. [Google Scholar] [CrossRef] [PubMed]
  17. DfT. Transport and Environment Statistics: Autumn 2021; Department for Transport: London, UK, 2021. Available online: https://www.gov.uk/government/statistics/transport-and-environment-statistics-autumn-2021/transport-and-environment-statistics-autumn-2021 (accessed on 20 January 2022).
  18. DEFRA. Improving Air Quality in the UK: Tackling Nitrogen Dioxide in Our Towns and Cities; Joint Air Quality Unit, Department for Environment, Food & Rural Affairs: London, UK, 2017. Available online: https://consult.defra.gov.uk/airquality/air-quality-plan-for-tackling-nitrogen-dioxide/supporting_documents/Draft%20Revised%20AQ%20Plan.pdf (accessed on 20 January 2022).
  19. Leach, F.C.P.; Davy, M.H.; Peckham, M.S. Cyclic NO2:NOx ratio from a diesel engine undergoing transient load steps. Int. J. Engine Res. 2019, 22, 284–294. [Google Scholar] [CrossRef]
  20. Berkowicz, R.; Winther, M.; Ketzel, M. Traffic pollution modelling and emission data. Environ. Model. Softw. 2006, 21, 454–460. [Google Scholar] [CrossRef]
  21. WHO. Listings of WHO’s Response to COVID-19; World Health Organization: Geneva, Switzerland, 2020; Available online: https://www.who.int/news/item/29-06-2020-covidtimeline (accessed on 20 January 2022).
  22. Abdullah, A.S.M.; Tomlinson, B.; Cockram, C.S.; Thomas, G.N. Lessons from the Severe Acute Respiratory Syndrome Outbreak in Hong Kong. Emerg. Infect. Dis. J. 2003, 9, 1042. [Google Scholar] [CrossRef] [PubMed] [Green Version]
  23. Erkhembayar, R.; Dickinson, E.; Badarch, D.; Narula, I.; Warburton, D.; Thomas, G.N.; Ochir, C.; Manaseki-Holland, S. Early policy actions and emergency response to the COVID-19 pandemic in Mongolia: Experiences and challenges. Lancet Glob. Health 2020, 8, e1234–e1241. [Google Scholar] [CrossRef] [PubMed]
  24. AQEG. Report: Estimation of Changes in Air Pollution Emissions, Concentrations and Exposure during the COVID-19 Outbreak in the UK: Rapid Evidence Review; The Air Quality Expert Group, Department for Environment, Food and Rural Affairs (DEFRA): London, UK, 2021. Available online: https://uk-air.defra.gov.uk/library/reports.php?report_id=1005 (accessed on 20 January 2022).
  25. UK Health Security Agency (UKHSA). Coronavirus (COVID-19). 2021. Available online: https://www.gov.uk/coronavirus (accessed on 1 January 2021).
  26. Singh, A.; Bartington, S.E.; Song, C.; Ghaffarpasand, O.; Kraftl, M.; Shi, Z.; Pope, F.D.; Stacey, B.; Hall, J.; Thomas, G.N. Impacts of emergency health protection measures upon air quality, traffic and public health: Evidence from Oxford, UK. Environ. Pollut. 2022, 293, 118584. [Google Scholar] [CrossRef] [PubMed]
  27. Grange, S.K.; Lee, J.D.; Drysdale, W.S.; Lewis, A.C.; Hueglin, C.; Emmenegger, L.; Carslaw, D.C. COVID-19 lockdowns highlight a risk of increasing ozone pollution in European urban areas. Atmos. Chem. Phys. 2021, 21, 4169–4185. [Google Scholar] [CrossRef]
  28. ONS. Population Estimates for the UK, England and Wales, Scotland and Northern Ireland: Mid-2019, Using April 2019 Local Authority District Codes; Office for National Statistics: Fareham, UK, 2020. Available online: https://www.ons.gov.uk/peoplepopulationandcommunity/populationandmigration/populationestimates/datasets/populationestimatesforukenglandandwalesscotlandandnorthernireland (accessed on 20 January 2022).
  29. OCC. Oxford Profile 2018 Key Facts; Oxford City Council: Oxford, UK, 2018. Available online: https://www.oxford.gov.uk/downloads/file/5021/oxford_profile_2018 (accessed on 20 January 2022).
  30. Ricardo, E.E. Oxford Source Apportionment Study; Ricardo Energy & Environment: Harwell, UK, 2020. Available online: https://www.oxford.gov.uk/downloads/file/7320/oxford_source_apportionment_study (accessed on 20 January 2022).
  31. OCC. Oxford’s Low Emission Zone (LEZ); Oxford City Council: Oxford, UK, 2013. Available online: https://www.oxford.gov.uk/info/20299/air_quality_projects/208/oxfords_low_emission_zone_lez (accessed on 18 February 2021).
  32. OCC. Significant Reduction in Oxford’s Air Pollution after Cleaner Buses Introduced—But City Still Has Toxic Air in Some Streets; Oxford City Council: Oxford, UK, 2018. Available online: https://www.oxford.gov.uk/news/article/798/significant_reduction_in_oxford_s_air_pollution_after_cleaner_buses_introduced_%25E2%2580%2593_but_city_still_has_toxic_air_in_some_streets (accessed on 18 February 2021).
  33. OCC. Background to the Oxford Zero Emission Zone (ZEZ) about Oxford; Oxford City Council: Oxford, UK, 2021. Available online: https://www.oxford.gov.uk/info/20299/air_quality_projects/1305/oxford_zero_emission_zone_zez (accessed on 18 February 2021).
  34. Hitchcock, G.; Birchby, D.; Bouvet, C.; Clarke, D. Oxford Zero Emission Zone Feasibility and Implementation Study: Report for Oxford City Council and Oxfordshire County Council; Ricardo Energy & Environment: Harwell, UK, 2017. Available online: https://www.oxford.gov.uk/downloads/file/4019/zero_emission_zone_feasibility_study_october_2017 (accessed on 20 January 2022).
  35. OCC. Updates to Emission Standards for Hackney Carriages and Timeline for Buses for the Oxford Zero Emission Zone Following Coronavirus Pandemic; Oxford City Council: Oxford, UK, 2020. Available online: https://www.oxford.gov.uk/news/article/1413/updates (accessed on 18 February 2021).
  36. OCC. 2020 Air Quality Annual Status Report (ASR); Oxford City Council: Oxford, UK, 2021. Available online: https://www.oxford.gov.uk/downloads/file/7612/air_quality_annual_status_report_2020 (accessed on 20 January 2022).
  37. OAQ. Oxfordshire AirQuality; Oxford City Council: Oxford, UK, 2021; Available online: https://oxfordshire.air-quality.info (accessed on 1 June 2021).
  38. DEFRA. UK Plan for Tackling Roadside Nitrogen Dioxide Concentrations; Department for Environment, Food & Rural Affairs, Joint Air Quality Unit: London, UK, 2017. Available online: https://assets.publishing.service.gov.uk/government/uploads/system/uploads/attachment_data/file/633269/air-quality-plan-overview.pdf (accessed on 1 June 2021).
  39. Vivacity. Improving Traffic Insights with Artificial Intelligence: Traffic Data. 2021. Available online: https://vivacitylabs.com/ (accessed on 9 July 2021).
  40. The Cabinet Office, Government of the United Kingdom. COVID-19 Response–Spring 2021 (Summary): Roadmap Out of Lockdown. 2021. Available online: https://www.gov.uk/government/publications/covid-19-response-spring-2021/covid-19-response-spring-2021-summary#roadmap-out-of-lockdown (accessed on 25 November 2021).
  41. IfG. Timeline of UK Government Coronavirus Lockdowns and Measures, March 2020 to December 2021; The Institute for Government: London, UK, 2021; Available online: https://www.instituteforgovernment.org.uk/sites/default/files/timeline-coronavirus-lockdown-december-2021.pdf (accessed on 10 January 2022).
  42. IBM. IBM SPSS Statistics—Version 25.0. 2021. Available online: https://www.ibm.com/products/spss-statistics (accessed on 15 September 2021).
  43. RStudioTeam. RStudio: Integrated Development for R; RStudio, PBC: Boston, MA, USA, 2020; Available online: http://www.rstudio.com/ (accessed on 30 June 2021).
  44. Conlon, G.; Halterbeck, M.; Williams, R.; Manly, L. The Economic Impact of the University of Oxford; London Economics: London, UK, 2021; Available online: https://www.ox.ac.uk/sites/files/oxford/Economic%20impact%20of%20the%20University%20of%20Oxford%202021.pdf (accessed on 20 January 2022).
  45. DfT. Transport Decarbonisation Plan: Decarbonising Transport: A Better, Greener Britain; Department for Transport: London, UK, 2021. Available online: https://www.gov.uk/government/publications/transport-decarbonisation-plan (accessed on 20 January 2022).
  46. Gilligan, A. Running Out of Road: Investing in Cycling in Cambridge, Milton Keynes and Oxford; National Infrastructure Commission: London, UK, 2021; Available online: https://nic.org.uk/studies-reports/growth-arc/running-out-of-road (accessed on 20 January 2022).
  47. Grange, S.K.; Farren, N.J.; Vaughan, A.R.; Rose, R.A.; Carslaw, D.C. Strong Temperature Dependence for Light-Duty Diesel Vehicle NOx Emissions. Environ. Sci. Technol. 2019, 53, 6587–6596. [Google Scholar] [CrossRef] [PubMed] [Green Version]
  48. Venterea, R.T.; Rolston, D.E. Nitric and nitrous oxide emissions following fertilizer application to agricultural soil: Biotic and abiotic mechanisms and kinetics. J. Geophys. Res. Atmos. 2000, 105, 15117–15129. [Google Scholar] [CrossRef]
  49. Barrett, T.; Oxford Air Quality Cleanest ‘Since Days of Horse and Cart’. The Air Quality News. 2020. Available online: https://airqualitynews.com/2020/05/12/oxford-air-quality-cleanest-since-days-of-horse-and-cart/ (accessed on 30 September 2021).
  50. OCC. Oxford City Council Air Quality Action Plan (AQAP) 2021–2025; Oxford City Council: Oxford, UK, 2021. Available online: https://www.oxford.gov.uk/downloads/file/7428/air_quality_action_plan_2021-2025 (accessed on 20 January 2022).
  51. OCC. Oxford City Centre Movement and Public Realm Strategy: Final Report; Oxford City Council and Oxfordshire County Council: Oxford, UK, 2018. Available online: https://www2.oxfordshire.gov.uk/cms/sites/default/files/folders/documents/roadsandtransport/transportpoliciesandplans/areatransportstrategies/oxford/03001-FinalReport-RevC2.pdf (accessed on 20 January 2022).
  52. WHO. WHO Global Air Quality Guidelines: Particulate Matter (PM2.5 and PM10), Ozone, Nitrogen Dioxide, Sulfur Dioxide and Carbon Monoxide; World Health Organization: Geneva, Switzerland, 2021; Available online: https://apps.who.int/iris/handle/10665/345329 (accessed on 24 November 2022).
  53. DfT. Annual Road Traffic Estimates: Great Britain 2020; Department for Transport: London, UK, 2021. Available online: https://assets.publishing.service.gov.uk/government/uploads/system/uploads/attachment_data/file/1028165/road-traffic-estimates-in-great-britain-2020.pdf (accessed on 20 January 2022).
Figure 1. Map of the roadside (High Street: 51.752527, −1.250939), urban background (St Ebbe’s: 51.744806, −1.260278) AURN monitoring locations and vehicle detection sensor (51.75241, −1.25424) in Oxford (Leaflet package, R Studio).
Sustainability 14 16182 g001
Figure 2. Timeline of COVID-19 related specific emergency public health measures in England.
Sustainability 14 16182 g002
Figure 3. Box and whisker plots of the traffic volume (count) for Pre-lockdown, Lockdown 1, Inter-lockdown and Lockdown 2 periods at Oxford High Street using daily data, where (a) Car, (b) Bus, (c) Motorbike, (d) OGV, (e) LGV and (f) cycle.
Sustainability 14 16182 g003
Figure 4. Time series of daily mean air pollutant concentrations (ac) at the roadside (High Street) and urban background sites (St Ebbe’s) in Oxford from 1 January to 31 December 2020. UK national lockdown periods shown by yellow shading.
Sustainability 14 16182 g004
Figure 5. Diurnal changes in hourly mean traffic flow by vehicle type at Oxford High Street during pre-lockdown, lockdown 1, inter-lockdown and lockdown 2 periods in 2020. The shaded areas represent the 95% confidence interval.
Sustainability 14 16182 g005
Figure 6. Diurnal changes in hourly mean air pollutant levels in Oxford during pre-lockdown, lockdown 1, inter-lockdown and lockdown 2 periods in 2020. The shaded areas represent the 95% confidence interval.
Sustainability 14 16182 g006
Table 1. Comparisons of overall daily mean air pollutant concentrations during pre-lockdown, lockdown 1, inter-lockdown and lockdown 2 periods in 2020, at roadside and urban background sites in Oxford. Uncertainties are at 1 standard deviation (±1σ) of the mean.
LocationEventNO (µg/m3)NO2 (µg/m3)O3 (µg/m3)
High StreetPre-lockdown22.9 ± 25.932.1 ± 16.6NA
Lockdown 15.7 ± 2.816.9 ± 6.7NA
Inter-lockdown19.1 ± 12.829.0 ± 12.0NA
Lockdown 238.7 ± 41.235.5 ± 17.6NA
St Ebbe’sPre-lockdown6.4 ± 15.612.3 ± 8.752.9 ± 17.6
Lockdown 11.8 ± 2.18.1 ± 4.864.7 ± 11.6
Inter-lockdown4.1 ± 7.610.0 ± 5.338.2 ± 11.1
Lockdown 217.0 ± 26.116.6 ± 8.928.5 ± 20.3
Table 2. Stepwise linear regression analysis assessing relationship between traffic (vehicle type), meteorological factors and air pollutant (NO and NO2) concentrations (Oxford High Street).
VariablesUnstandardized CoefficientsStandardized Coefficientst-Valuep-ValueVariablesUnstandardized CoefficientsStandardized Coefficientst-Valuep-Value
NOBStd. ErrorBeta NO2BStd. ErrorBeta
Pre-
Lockdown 1
Constant0.6136.631 0.0820.935Constant29.4933.747 7.8700.000
T−5.4940.205−0.514−26.7710.000T−4.0750.117−0.583−34.7740.000
Bus0.2100.0110.38319.4020.000Bus0.2010.0070.56127.7060.000
RH0.3810.0660.1135.8150.000Motorbike0.2640.0290.1679.1240.000
Motorbike0.1770.0510.0733.4660.001LGV−0.1980.040−0.095−4.9990.000
Car0.0150.0050.0582.7490.006Car0.0110.0030.0693.7260.000
RH0.0980.0380.0452.6160.009
VariablesUnstandardized CoefficientsStandardized Coefficientst-Valuep-ValueVariablesUnstandardized CoefficientsStandardized Coefficientst-Valuep-Value
NOBStd. ErrorBeta NO2BStd. ErrorBeta
Lockdown 1Constant4.4870.281 15.9770.000Constant12.1571.780 6.8280.000
Bus0.1140.0040.58226.3420.000Bus0.1240.0080.35115.6990.000
T−0.4220.021−0.404−20.1480.000T−0.5280.055−0.279−9.6570.000
Car0.0240.0030.1367.1940.000Car0.0490.0130.1553.8940.000
OGV0.2900.0860.0623.3580.001OGV0.8110.1780.0954.5590.000
LGV0.0690.0220.0673.0930.002Motorbike0.2170.0670.1193.2410.001
RH0.0420.0170.0702.4860.0013
VariablesUnstandardized CoefficientsStandardized Coefficientst-Valuep-ValueVariablesUnstandardized CoefficientsStandardized Coefficientst-Valuep-Value
NOBStd. ErrorBeta NO2BStd. ErrorBeta
Inter-
Lockdown
Constant18.430.835 22.0710.000Constant18.0860.860 21.0200.000
Car0.0410.0040.23510.7700.000Car0.0390.0040.22410.0140.000
Bus0.1270.0050.39826.2320.000Bus0.1100.0050.34021.9080.000
T−1.3180.051−0.390−25.9090.000T−0.5740.052−0.169−10.9470.000
Motorbike0.0950.0320.0652.9880.003Motorbike0.2690.0330.1838.2010.000
VariablesUnstandardized CoefficientsStandardized Coefficientst-Valuep-ValueVariablesUnstandardized CoefficientsStandardized Coefficientst-Valuep-Value
NOBStd. ErrorBeta NO2BStd. ErrorBeta
Lockdown 2Constant−27.13925.598 −1.0600.289Constant22.82010.757 2.1210.034
T−8.3630.433−0.608−19.3280.000T−3.8650.181−0.615−21.3960.000
Bus0.3660.0340.39310.8430.000Bus0.2150.0150.50614.6160.000
Car0.1160.0250.1384.5820.000Motorbike0.4030.0880.1764.5760.000
RH1.0380.2500.1304.1570.000LGV−0.5620.091−0.199−6.1810.000
LGV−0.6210.218−0.101−2.8510.004Car0.0550.0140.1433.9370.000
RH0.2430.01050.0672.3030.022
Publisher’s Note: MDPI stays neutral with regard to jurisdictional claims in published maps and institutional affiliations.

