Article

Improving Energy Efficiency in China Based on Qualitative Comparative Analysis

1
College of Northeast Asian Studie, Jilin University, Changchun 130012, China
2
College of Economics and Management, Northeast Electric Power University, Jilin 132012, China
3
College of International Business, Jilin International Studies University, Changchun 130117, China
*
Author to whom correspondence should be addressed.
Sustainability 2022, 14(23), 16103; https://doi.org/10.3390/su142316103
Submission received: 10 November 2022 / Revised: 27 November 2022 / Accepted: 29 November 2022 / Published: 2 December 2022
(This article belongs to the Special Issue Renewable Energy Consumption and Economic Growth)

Abstract

:
Currently, in China, the influence of energy efficiency problems on economic and social development is increasingly prominent. The factors influencing energy efficiency and improving them have become the focus of academics. In this study, the effects of allocation on technical progress, industrial structure, energy consumption structure, and economic levels of energy efficiency are discussed based on a sample of 30 provinces in China using qualitative comparative analysis (QCA). The results show that three paths could simulate high energy efficiency. The first path is dominated by economic level and energy consumption structure, with the assistance of industrial structure. The second path is dominated by economic level and energy consumption structure, with the assistance of technical progress. The third path is dominated by technical progress and industrial structure, with the assistance of economic level. None of the proposed four factors were required for high energy efficiency. Path 1 and path 2 formed the second-order equivalent configuration. In most provinces, high energy efficiency is stimulated through the path dominated by technical progress and industrial structure, assisted by economic level.

1. Introduction

Currently, the energy problem has attracted the wide attention of academics, media personnel, and the general public. The energy problem not only influences the national economy and strategic safety but is also related to the improvement of people’s living standards and the ecological environment. It has become a highly concerning problem. According to the International Energy Agency (IEA), in 2009, China surpassed the US and became the largest energy consumer in the world. In recent years, energy demands have increased significantly owing to accelerating industrialisation and urbanisation. However, the energy supply structure in China is relatively isolated. The trade-off between supply and demand brings China into a dilemma of serious energy shortage. There are two major approaches to solving the energy shortage. One is to seek new renewable energy sources and alternative energy sources on the energy supply end, while the other is to take measures to improve energy utilisation. The development and use of technologies of new and alternative energies are not yet perfect and they cannot meet the needs of production and daily life. Therefore, increasing energy utilisation is the most effective method to solve energy shortages in the short run. Hu et al. (2005) [1] estimated the energy conservation efficiency of 17 countries in the Asia-Pacific Economic Cooperation (APEC) economic entity from 1991 to 2000. The results show that the energy-saving rate in China is the highest, but approximately 50% of the energy sources are wasted due to low energy efficiency [1]. Improving energy utilisation is not only conducive to solving energy shortages but also making considerable contributions to the reduction of environmental pollution. Therefore, it is imperative to solve the issue for China’s strategic development by exploring effective paths to improve energy efficiency continuously.
Existing research has achieved many results from the two perspectives of energy efficiency measurement and influencing factors and has also made important breakthroughs in theory. However, since energy efficiency is a complex system affected by many factors, it will be of essential research value to examine the formation paths of high energy efficiency in each region from an overall perspective. QCA adopts a holistic perspective, pays attention to the complexity of antecedents, and combines the advantages of qualitative and quantitative methods in the research paradigm. It has become an important tool for the study of complex causal systems. Using the QCA method, we can effectively explore the synergistic linkage of multiple antecedent conditions, to better explore the relationship between energy efficiency and its influencing factors. Energy efficiency may be affected by a combination of factors, such as economic development level, technological progress, industrial structure, and energy consumption structure. Therefore, this study started from the perspective of configuration, and on the basis of acknowledging the complexity of causality, adopted the fsQCA method to construct a model of influencing factors of energy efficiency by taking 30 provinces, municipalities and autonomous regions in China as the research objects. This research explored new horizons for energy efficiency research, and also provided theoretical reference for further improving energy efficiency in various regions.

2. Literature Review and Model Construction

For studies on energy efficiency, academics mainly focus on two aspects, namely the measurement of energy and factors influencing energy efficiency.

2.1. Studies on Energy Efficiency and Measurement

Energy efficiency refers to the ability of the highest economic output under fixed energy consumption or the ability to reach the lowest energy consumption under the fixed economic output level. Didier and Cécile (1997) [2] proposed two interpretations of energy efficiency: (1) economically, energy efficiency is the ability to acquire more outputs with a lower energy input; (2) energy efficiency is to decrease energy consumption by technical progress and changing lifestyle [2]. Chinese scholars proposed some definitions of energy efficiency. Wei and Liao (2010) defined energy efficiency as contributions of energy consumption to maintain and facilitate sustainable economic, social, and environmental development [3]. Wang and Wu (2015) pointed out that the connotation of energy efficiency is to ‘acquire the maximum economic output with the lowest energy input while minimizing the negative environmental externality’ [4].
Studies on the measurement of energy efficiency started in the 1950s. Farrell (1957) [5] believed that comprehensive technical efficiency and allocation efficiency are two major aspects of energy efficiency. Comprehensive technical efficiency is mainly used to measure the highest output achieved under the existing input level during production. Allocation efficiency measures the minimum cost for a given output with considerations of price factors of energy input [5]. Follow-up studies on the measurement of energy efficiency are carried out based on this concept. Phylipsen et al. (1997) [6] expanded their study on the energy efficiency problem based on the energy efficiency index pyramid, which was established by the IEA in 1997. They also pointed out that traditional energy efficiency only focused on input and output, which did not take other elements into account, thus resulting in poor reasonability [6]. In recent years, Chinese scholars proposed some suggestions in studies on the measurement of energy efficiency. Wang (2001) [7] viewed energy demands for GDP increase per unit as the comprehensive energy efficiency index of a country and divided the energy efficiency of a department into economic and physical indexes. Specifically, the economic index is expressed by energy consumption per unit output and the physical index is generally expressed by thermal efficiency [7]. Limited by the low marketisation degree in China, it is relatively challenging to deduce the shadow price of energy elements. Hence, most researchers focus on the comprehensive technical efficiency of energy. For example, Wei and Liao (2010) [3] analysed seven types of energy efficiency measurement indexes thoroughly and discussed the theoretical basis, hypotheses, applicability, strengths and weakness, and relations of indexes. They further elaborated on the understanding and wrong applications of energy efficiency indexes [3]. Moreover, data envelopment analysis (DEA) has become a common method for researchers to calculate the comprehensive technical efficiency of energy sources. DEA calculates comprehensive technical efficiency of energy by constructing the production leading surface, during which production input and output elements have to be set. Wei and Shen (2008) [8], Wu and Wu (2009) [9], and Du (2015) [10] used material capital, labour, force and energy as inputs. Shi and Shen (2008) [11] used the gross domestic production (GDP) of energy using regions as the single expected output.

2.2. Factors Influencing Energy Efficiency
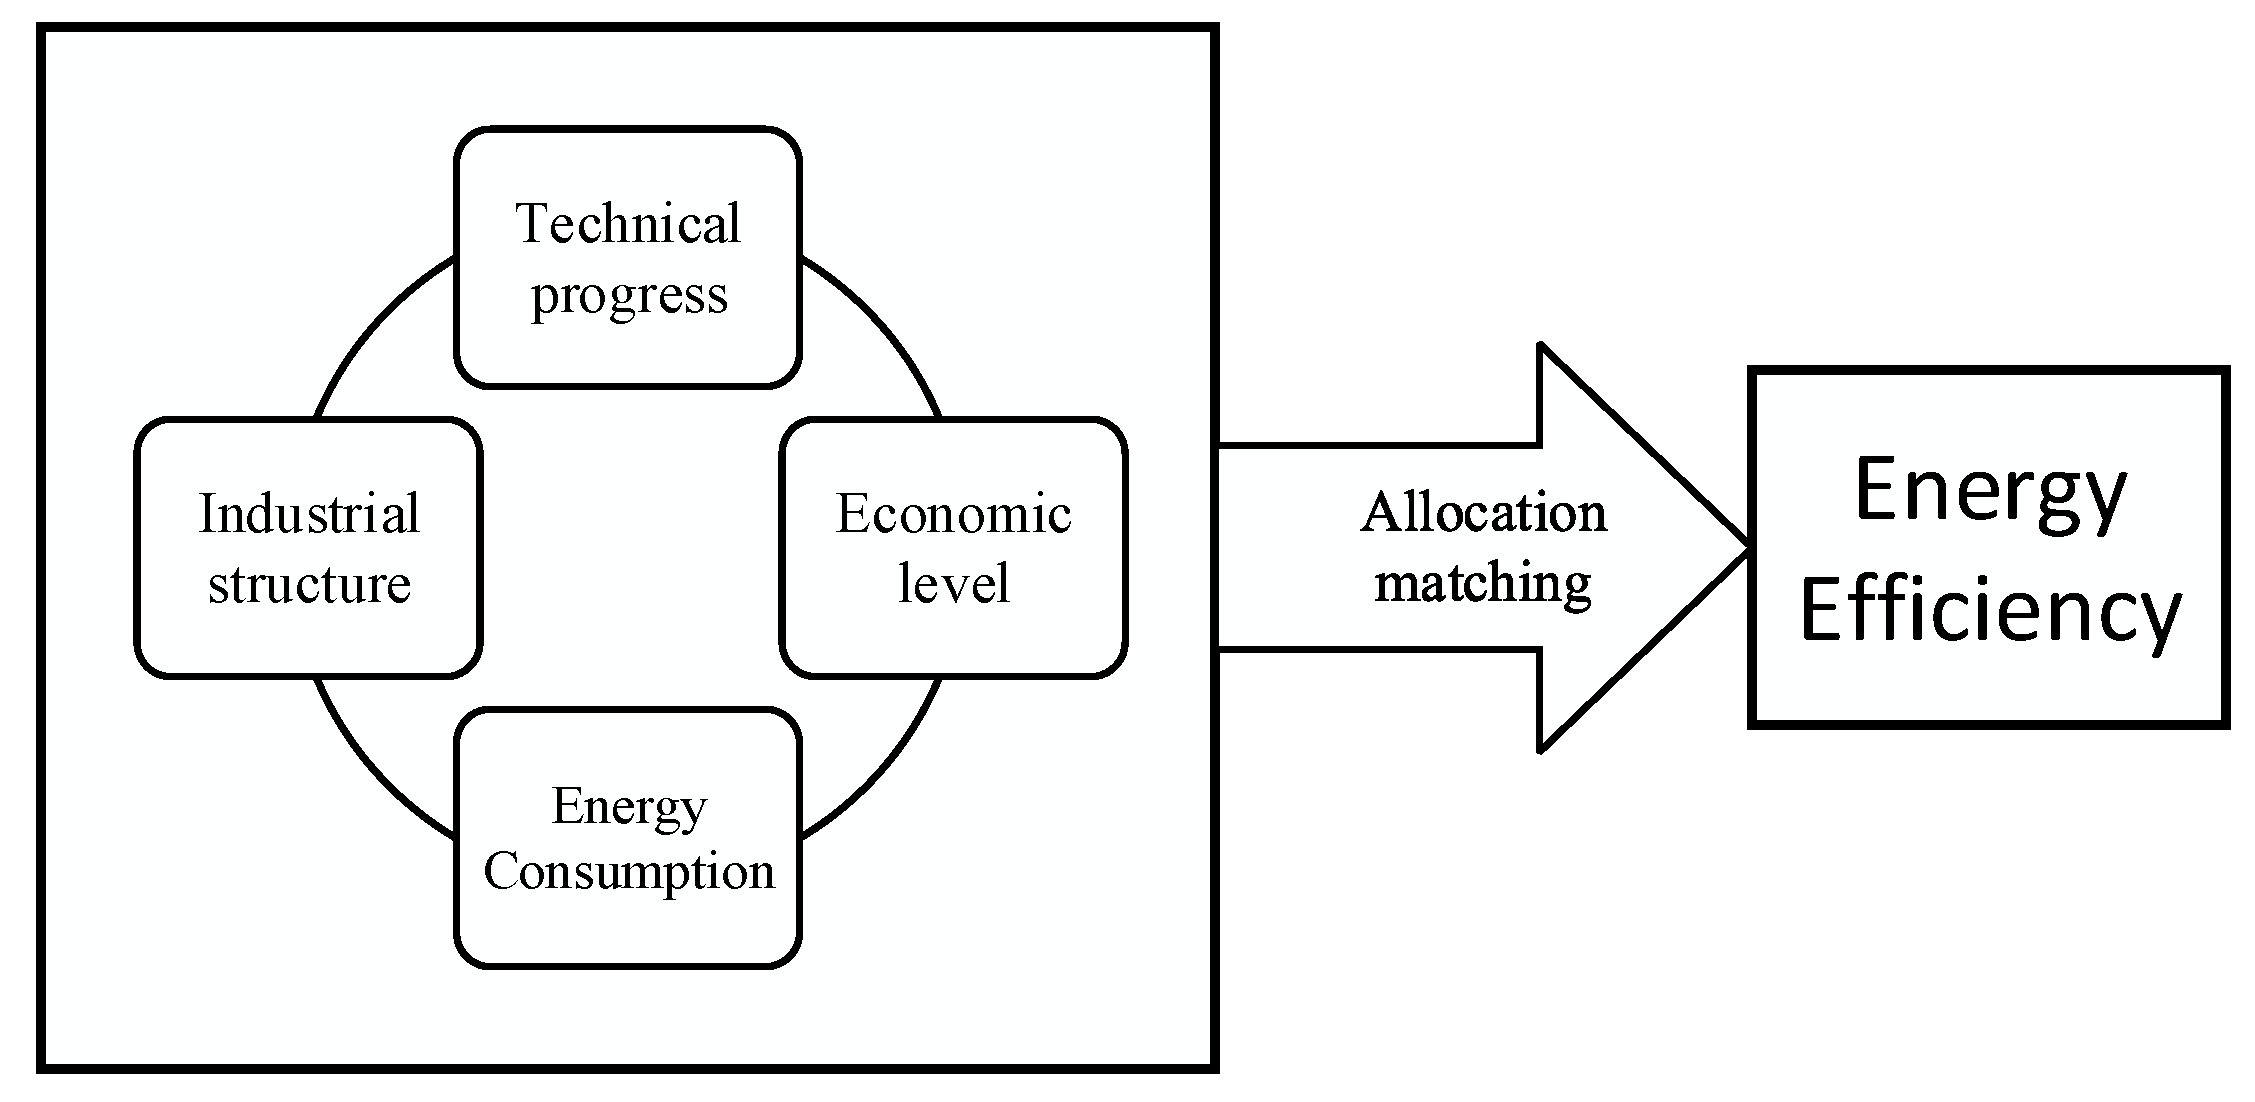
In recent years, China has achieved rapid economic and social development at the cost of increasing and continuous energy consumption. However, the total global energy is decreasing continuously, which proposes higher requirements for energy efficiency in China. At present, China has a lower energy utilisation level compared with some developed countries, which restricts China’s sustainable economic and social development to some extent. Hence, recognising factors influencing energy efficiency, decreasing energy waste, achieving higher output with limited energy sources, and improving energy efficiency continuously are of critical importance to the economic and social development of China.
Industrial restructuring optimised energy allocation, improved energy efficiency, and decreased energy consumption in China. This has been widely accepted by most scholars [12]. Lu (1999) [13] believed that industrial structural changes promote improvements in energy efficiency and are very important to the development of the energy industry. Increasing the proportion of the tertiary industry and optimizing the energy structure of the secondary industry can significantly improve regional energy efficiency [14]. Shi and Zhang (2003) [15] pointed out that different industries lead to different energy species needed for production, thus bringing different degrees and directions of influences of industrial structural changes on energy efficiency. However, industrial structural changes can improve energy efficiency. Based on panel data of 285 prefecture-level or higher-level cities in China from 2003 to 2013, Yu (2017) [16] discussed the effects of industrial structural changes on the improvement of energy efficiency by using the Dubin model (SDM). The results show that improving industrial structural adjustment quality can facilitate significant improvements in energy efficiency [16].
With continuous scientific developments, technical progress becomes one of the important factors that improve energy efficiency.
Ye and Sun (2002) [17] found that technical progress and scientific and technological innovation are major factors that improve energy efficiency. Using advanced technologies can promote the improvement of energy efficiency, updating of industrial structure, and optimisation of energy allocation. Similarly, based on China’s provincial panel data, Feng (2015) [18] constructed an empirical model to analyse the dynamic effect of energy efficiency and influencing factors from the endogenous perspective. He concluded that technical progress has a significant and positive impact on energy efficiency [18]. Li (2022) [19] empirically tested the promotion effect of technological progress on energy efficiency by using the panel data of 271 prefecture-level cities in China from 2014 to 2019. The study found that, in addition to the direct impact, technological progress also has a positive impact on regional energy efficiency indirectly through economic growth and industrial structure upgrading.
The effects of the energy consumption structure on energy efficiency are also relatively obvious. The distribution of energy structure and consumption ratio can directly and positively influence energy efficiency. Hang and Tu (2006) [20] pointed out that reducing the ratio of coal consumption in primary energy sources significantly improved energy efficiency. Guo et al. (2008) [21] pointed out that China’s energy efficiency is closely related to changes in primary energy consumption structure and the improvement of energy efficiency is significantly influenced by energy consumption’s structural optimisation and updating. Brodny J (2022) [22] used the Gini coefficient and Lorenz curves to analyse the energy consumption structure and energy efficiency of the industrial sector in the European Union with data from 1995 to 2019. The analysis results proved that the energy consumption structure can significantly affect energy efficiency.
Economic level is also an important factor that influences energy efficiency. Wu and Wang (2019) [23] carried out quantitative analysis of the relationship between China’s energy consumption, energy efficiency, and business cycle from the perspective of periodic fluctuation. Considering the industrial level, a stable economy is conducive to improvements in energy efficiency [23]. When studying factors influencing energy intensity changes in China, Shi (2002) [24] proposed that the opening level and marketisation reform have significant effects on improving energy efficiency. Moreover, Shi (2002) [24] pointed out that driven by market reform, enterprises will pay more attention to improvements in technological innovation and production efficiency due to market mechanisms, thus improving energy production and utilisation. With the continuous growth of the marketisation level, energy may also flow to enterprises with higher development efficiency as an important production factor, thus improving the overall allocation efficiency of energy sources [24].

2.3. Research Model

Complicated factors influence regional energy efficiency and no widely accepted comprehensive analysis system has been reached. By studying factors influencing energy efficiency in China from 1979 to 2006, Chen and Xu (2008) [25] found that it is beneficial to improve the energy efficiency of China, especially technical progress if the state increases scientific research input, accelerates human capital formation, and uses foreign direct investment positively. Zhang (2011) [26] analysed factors influencing energy efficiency, such as economic structure, technical progress, energy investment level, and energy marketisation, by using the structural equation model (SEM). They concluded that the above factors have direct or indirect influences on the improvement of energy efficiency [26]. Based on the current status of regional energy efficiency in China, Liang et al. (2020) [27] believe that technical progress, industrial structure, energy structure, environmental regulation, energy prices, and foreign exchange are major factors influencing energy efficiency in China. Jiang and Ji (2011) [28] carried out an empirical study on energy efficiency by using the ridge regression method and pointed out that technical progress, industrial structure, energy consumption structure, and comprehensive economic level are major factors influencing regional energy efficiency. All four influencing factors cover various aspects of energy efficiency, and this has been approved by many scholars [29].
Based on relevant theoretical analyses and analyses on variable sets of factors influencing regional energy efficiency [28], influences of technical progress, industrial structure, energy consumption structure, and comprehensive economic level on energy efficiency were investigated with considerations to the coverage of the above factors. It aims to identify the most effective pathway to improve regional energy efficiency [28]. The model constructed is shown in Figure 1.

3. Method

The social science field is currently plagued by complicated social phenomena which often involve many influencing factors. The formation of complicated events is a characteristic of multiple concurrence combinations. Therefore, the traditional quantitative analysis based on line causality cannot meet the needs of the current complicated studies. Therefore, the qualitative comparative analysis (QCA) was innovatively introduced as a major research method. As an emerging research paradigm, QCA can analyse multi-element, concurrence, and cause–effect asymmetric complicated social phenomena. It has been extensively applied to fields of management, sociology, information science, and disease transmission to name a few.
QCA was proposed by Charles C. Ragin at the end of the 19th century. QCA is based on the set theory and Boolean algebra. It surpasses the traditional case study method and realises trans-case analysis. It tries to investigate the causes of an event, the interaction of internal generation factors, and possible relational combinations systematically, aiming to explore internal correlations of antecedent conditions as well as causality between antecedent conditions and their combinations and consequences. Through empirical data and continuous theoretical dialogues, people’s understanding of complicated causalities of events is deepened continuously [30].
In this study, QCA was chosen owing to the following reasons: (1) QCA applies to middle- and small-sized sample data analysis, and it requires a low sample size. In this study, 30 provinces, municipalities, and autonomous regions in 2020 in China were chosen as research samples and the sample size conforms to the requirements of the method. (2) Many factors influence the improvement of regional energy efficiency, and the realisation process is complicated. The QCA can determine the factor combination and core conditions of high regional energy efficiency by comparing the factor combination set relations. It can provide references for regions with different development characteristics to improve energy efficiency and thereby promote improvements in China’s energy efficiency.
At present, QCA is mainly divided into csQCA (clear-set quantitative comparative analysis) and fsQCA (fuzzy-set quantitative comparative analysis). csQCA adopts the dichotomous variable method and divides variables according to 0|1. If a variable exists, it values 1; otherwise, it values 0. Nevertheless, many variables cannot be clearly determined whether they exist or not in the complicated reality. For instance, the technical progress of some provinces in this study is between existence and absence. This problem is solved by fsQCA. fsQCA calibrates the original data, which transfer to the 0~1 fuzzy membership fraction and transform the variable into a set. This solves the defect of csQCA in the mechanical division of variables. Therefore, fsQCA was chosen for data analysis.
The process of the fsQCA method consists of five parts: case selection, variable calibration, necessary condition analysis, configuration analysis and robustness test, as shown in Figure 2.
First, the QCA method is suitable for both large case samples and small case samples. Different from the requirements of traditional statistics on the number of cases, the QCA method pays more attention to the selection of cases. “Sufficient homogeneity of the case population and maximum heterogeneity within the case population” are the principles for selecting cases by the QCA method. Second, variable calibration is usually performed before analysis, converting the raw data into a fuzzy membership score between 0 and 1. Again, necessary condition analysis must be carried out. Necessary conditions are an important part of causality, and identifying necessary conditions plays an important role in analysing the causal relationship between variables. Finally, configuration analysis is performed. Through the configuration results, different paths to stimulate regional energy efficiency are obtained. Then, through a deeper qualitative analysis of the path, specific suggestions for improving energy efficiency in each region are summarized. Of course, robustness test should be performed before final path conclusions are determined.

4. Data and Variable Measurement

4.1. Data and Sample

Based on the availability of data, all sample data used in the analysis come from the Statistical Yearbook and China Energy Statistical Yearbook of 30 provinces (municipalities and autonomous regions) in 2020. Due to data missing from Tibet, it was excluded from the research samples.

4.2. Measurement and Calibration of Variables

4.2.1. Measurement of Variables

  • Energy Efficiency
Studies on the measurement of energy efficiency are very mature. There are diversified measurement indexes. Among them, common and relative authoritative measuring indexes include energy consumption per unit GDP, energy consumption per unit added value, energy consumption per unit product, and terminal energy utilisation. With reference to the measurement method of energy efficiency proposed by [28], the energy efficiency of each sample province was calculated by using the following formula:
Energy efficiency = GDP (CNY 100 million)/energy consumption (10,000 tons of standard coal)
  • Technical Progress
Several methods are used to measure technical progress. As a type of intangible capital, technology is very difficult to be calculated and measured intuitively. For the convenience of this study, technical progress (development level) was expressed by the R&D expenditure of administrative regions in 2020 according to [31].
  • Industrial Structure
As there are several measurement indexes of industrial structure, and the secondary and tertiary industries in China account for a high proportion of energy consumption, most scholars measured industrial structure by the proportion of the secondary and tertiary industries in GDP. Based on the above analysis, the proportion of secondary and tertiary industries was used to measure the industrial structures of the samples. With reference to [32], the industrial structural updating level of provinces was interpreted by introducing the industrial structural layer coefficient (upIns). The estimation formula is:
upIns = i = 2 3 c i   ×   i
where upIns is the updating level of industrial structure and ci is the proportion of the ith industry. Next, 2 represents the secondary industry and 3 represents the tertiary industry.
  • Energy Consumption Structure
In the energy consumption structure, a higher proportion of relatively clean energy is more beneficial to the updating of the energy consumption structure. Moreover, the increasing proportion of natural gas consumption has become an important means to promote energy consumption reform. Therefore, according to Xu and Wang(2018) [33], the proportion of natural gas consumption in total energy consumption was used to measure energy consumption structure.
  • Economic Level
To measure regional economic level, Cao and Fan’s (2016) opinion that ‘the higher per capita GDP indicates the higher degree of economic development’ was referred to. The per capita GDP of each sample region was chosen as the measuring index of regional economic level [34].

4.2.2. Calibration of Variables

The process where fsQCA transforms variables into a set is called the calibration of variables. Before calibration, the complete affiliated point, intersection point, and complete non-affiliated point have to be determined. According to Du and Jia (2017) [30], these three anchoring points were set as the maximum, mean, and minimum of variable data, respectively. The calibrated anchoring points in this study are listed in Table 1.

5. Fuzzy-Set Analysis

5.1. Necessary Analysis

A necessary condition can be viewed as a super-set of the results. It should be noted that if the necessary condition is included in the fsQCA analysis, it might be included in the logic residual term and thereby simplified. Hence, it is essential to analyse the necessary conditions before fsQCA analysis [35]. The analysis results of necessary conditions in this study are listed in Table 2.
The consistency of various condition variables is lower than 0.9, indicating that the condition variables are not necessary conditions to produce high energy efficiency.

5.2. fsQCA Analysis

fsQCA provides three types of solutions, namely parsimonious solution, intermediate solution, and complex solution [36]. Generally, the intermediate solution is superior to the other two solutions as it uses theoretical and practical logic residual terms and it does not simplify necessary conditions. Moreover, the central and contributing conditions of paths can be gained by comparing the intermediate and simplified solutions; the conditions that occur in the intermediate solution are only contributing conditions, while the conditions that occur in the intermediate solution and parsimonious solution together are centre conditions [36]. In this study, 30 provincial sample data were analysed by using fsQCA3.0. According to Du and Jia (2017) [30], the number for frequency was chosen as 1 and the consistency was higher than 0.8. Combining with PRI, consistency was higher than 0.75.
Based on the calculations, three paths stimulate high energy efficiency. It can be observed from Table 3 that the consistency values of the three paths are 0.97, 0.97, and 0.88, showing relatively high consistency [37].
This reflects that these three paths are sufficient conditions for high energy efficiency [37]. The overall coverage of the three paths is 0.70, indicating that these three paths explain 70% of causes of high energy efficiency and they have relatively strong explanation power. In the following text, each path will be independently analysed.
(1)
Path dominated by economic level and energy consumption structure with the assistance of industrial structure
Path 1 indicates that high energy efficiency can be stimulated under any technological development level by optimising energy consumption structure and improving regional economic level with the assistance of industrial structural updating. At present, economic development in China is driven by energy consumption. Energy consumption is one of the major impetuses to economic growth. Moreover, economic level has a great influence on the energy consumption structure and the degree of influence tends to be reasonably continuous. With economic development, social demands for clean energy sources are increasing continuously. The energy consumption structure is optimised accordingly. Moreover, the industrial structure is closely related to the energy consumption structure. Due to the requirements of energy-saving and consumption reduction, the industrial structure is adjusted and optimised positively, and the tertiary industry is developed vigorously. All of these are conducive to the production of high energy efficiency.
Fan et al.(2012) [38] pointed out that improving the regional economic level was beneficial to shifting from resource-intensive industries to technical-intensive industries. The proportion of added value industry is increasing, while industrial structural updating drives optimisation of energy consumption structure. As a result, regional GDP is increased without increasing energy consumption, thus improving energy efficiency [38]. Li and Huo (2010) [39] pointed out that the influences of the economy on the energy consumption structure are very obvious in the short and long run. They emphasised trying to decrease the proportion of primary energy sources (coal), increase the proportion of clean energy consumption, and support the development and use of new energies under the premise of energy supply and safety. Meanwhile, accelerating optimisation, adjusting the industrial structure, and changing the economic growth model to an intensive type can increase energy utilisation better [39].
Under such a path, the major samples include Beijing City, Jiangsu Province, Shanghai City, Chongqing City, Guangdong Province, Zhejiang Province, and Hubei Province. All of these areas have high economic levels and the energy consumption structures in these regions have been optimising continuously in recent years. The proportion of coal in primary energy consumption is replaced by clean energy sources, such as natural gas. Furthermore, continuous optimisation and updating of the industrial structure are conducive to the increasing proportion of the tertiary industry of energy efficiency. Hence, these regions rank high among 30 samples in terms of energy efficiency.
Considering Jiangsu Province as an example, according to statistics, the energy consumption of Jiangsu Province in 2020 reached 326.7249 million tons of standard coals, which makes it top few in China. Stimulated by the numerous energy sources, in 2020, the economic strength of Jiangsu Province leapt high. The GDP of Jiangsu Province crossed over three 1000 billion-level steps and reached CNY 10,270 billion (equivalent to USD 14,390 billion) and the per capita GDP reached CNY 125,000 (equivalent to USD 17,524.9212), ranking top among all the samples. In 2020, Jiangsu Province accelerated industrial structural adjustment and the proportions of the added value of three industries were adjusted to 4.4:43.1:52.2. On one hand, Jiangsu Province formulated new heavy industrial development strategies which conform to future competition direction. It promoted transformation, upgrading, and high-quality development of steel, chemical, and coal power industries along the Yangtze River, while decreasing heavy industrial output and backward production capacity. These strategies were promoted together with industrial structure adjustment and layout optimisation. On the other hand, the Jiangsu provincial government introduced the Opinions on Promoting Green Industrial Development to implement the green development philosophy firmly, accelerate new–old kinetic energy transformation, and form coupling concurrence of the industrial chain. Jiangsu Province has preliminarily established the green low-carbon circulation system of high resource and energy utilisation and perfected the institutional mechanism of green industrial development gradually. Additionally, the focus is on the development of new energy industries and a group of new energies that lead the green industrial development. Jiangsu ranked the top in China in terms of new energy installation scale, such as offshore wind power and distributed photovoltaic devices. As a result, energy guarantees, such as power and natural gas, were further enhanced. The proportion of coal consumption decreased, while the proportion of other clean energy utilisation, such natural gas, increased significantly. According to data from the relevant statistical department, the energy consumption structure was continuously optimised due to rapid economic development. Driven by industrial structural transformation and updating, the energy consumption per unit GDP of Jiangsu Province decreased by 3.1% in 2020. The cumulative reduction during the ‘13th Five-year Plan’ amounted to 20.6%. Hence, Jiangsu Province ranked first in China in terms of energy efficiency and submitted a qualified answer sheet for green development.
(2)
Path dominated by economic level and energy consumption structure with the assistance of technical progress
Path 2 indicates that high energy efficiency can be stimulated under any regional industrial structure as long as there is a relatively high economic level and a relatively good energy consumption structure in the region, together driven by technical progress. The relatively high economic level lays a solid foundation for technological development. Improving economy and technologies facilitate optimisation and adjustment of the regional industrial structure together. Under the collaborative effect of economic level, technical progress, and industrial structure, relatively high energy efficiency is triggered. Qin et al. (2015) [40] pointed out that whether technical progress can improve energy efficiency by improving energy consumption structure is determined by the local economic level. Only when the economic level reaches a certain threshold can the region attract sufficient talents, build relatively perfect infrastructures, and purchase advanced equipment. Under such a scenario, the energy efficiency can be improved by optimising the energy consumption structure [40]. Zhou and Kong (2018) [41] pointed out that with the increasing national economic level, wealth accumulation, and high and new technological development, some new energy sources are developed and used gradually, thus making the energy consumption structure more balanced and optimised. The proportion of high-efficiency cleaning energy is increasing continuously, thus increasing energy efficiency [41].
The sample cities under this path mainly include Beijing City, Jiangsu Province, Shanghai City, Guangdong Province, Zhejiang Province, Shaanxi Province, and Hubei Province. These regions rank the highest in China in terms of economic level, while the proportion of clean energy consumption in these regions is higher than the national average. In recent years, they have optimised the energy consumption structure continuously and are thereby ranked high in terms of energy efficiency due to technical progress.
Considering Zhejiang Province as an example, in 2020, Zhejiang completed the ‘13th Five-year Plan’ perfectly. It achieved decisive achievements to build a moderately and comprehensively prosperous society at a high level. The economic aggregates of Zhejiang Province amounted to 6000 billion and the GDP increased by 3.6% to CNY 6461.3 billion (equivalent to USD 950.74 billion) compared to that of the previous year. The annual average growth reached 6.5%. Zhejiang ranked first in terms of both economic aggregates and economic growth rates. The considerable economic strength lays solid foundations for the technological development of Zhejiang Province. Zhejiang Province has been enlisted as an innovative province and it maintained a stable position in the first gradient of innovation strength. In 2020, the R&D expenditure of Zhejiang Province reached CNY 185.99 billion (equivalent to USD 26.07 billion) and it was ranked fourth in China. The proportion of GDP increased from 2.3% in 2019 to 2.8%, a new historical high. The quantity of high-tech enterprises increased quickly, and the contribution rate of technological progress was relatively high. In 2020, Zhejiang Province won the annual State Science and Technology Award for 38 technical achievements and built a region-wide innovation system with global influence and national first-class and local characteristics. Technological innovation significantly supported high-quality development. Concerning the energy utilisation structure, Zhejiang Province is endeavouring to develop clean energy sources, promote new construction and reconstruction of natural gas distributed heat-power cogeneration, promote the construction of pilot projects positively, and increase the consumption of natural gas. Furthermore, Zhejiang Province continued to support the development and use of wind photoelectricity, develop offshore wind power generation greatly, and promote the construction of ground photovoltaic power stations to accelerate the approval and construction of nuclear power projects in the province. Under the collaborative efforts of multiple parties, clean energy in Zhejiang Province has been consumed completely and a series of innovative practices that facilitate ‘carbon emission peak’ have been carried out continuously. As clean energy replaces traditional coal, Zhejiang optimised and updated the energy consumption structure continuously. During the ‘13th Five-year Plan’, Zhejiang supported 6.5% of GDP growth at the energy consumption growth rate of 2.5%, and it realised green, high-efficiency, and sustainable development. In 2020, Zhejiang Province ranked high in terms of energy efficiency due to the relatively high economic level, relatively good energy consumption structure, and technical innovation.
It is important to note that path 1 and path 2 form the second-order equivalent combination. In these two paths, economic level and energy consumption structure are viewed as the centre conditions, while technical progress is a contribution condition. This indicates that to stimulate high energy efficiency through these two paths, the key attention shall be paid to improving the economic level and energy consumption structure.
(3)
Path dominated by technical progress and industrial structure with the assistance of economic level
Path 3 indicates that high energy efficiency can be achieved under any energy consumption structure as long as it can improve the economic level and technical progress and optimise the industrial structure. Improving the technical level can facilitate updating of regional industrial structure, which can further promote regional economic development. In this path, high technical progress and high industrial structure are viewed as centre conditions, indicating that priority shall be paid to the improvement of technical progress and industrial structural optimisation to improve energy efficiency through path 3. Wu et al. (2019) [42] believed that it can facilitate reform on the supply side of industrial structure effectively, encourage clean energy development, and continue to promote optimisation and updating of the industrial structure by facilitating inter-regional technological communication and improving technical level. Developing the industrial structural scale effect is conducive to improving the allocation efficiency of economic resources and thereby improving regional energy efficiency [42]. Zhou (2017) [43] carried out a Pearson test on the relationship between regional energy efficiency levels and influencing factors. The results show that regions can effectively improve energy efficiency by facilitating technical progress, optimising industrial structure, and improving the economic level [43].
The samples under this path include Beijing City, Shanghai City, Zhejiang Province, Guangdong Province, Jiangsu Province, Fujian Province, Anhui province, Hubei Province, and Hunan Province. These regions have relatively high economic levels, high technical development expenditures, and relatively reasonable industrial structural configurations. They are regions with good economic development.
Considering Guangdong Province as an example, from the perspective of technological innovation, Guangdong Province promoted innovation-driven development strategies greatly, deepened structural reform at the supply end, and accelerated the transformation and updating of the real economy in 2020. The total R&D expenditure of Guangdong Province in 2020 reached CNY 320 billion (equivalent to USD 44.86 billion), which accounted for 2.9% of regional GDP. Guangdong Province ranked first in terms of regional innovative comprehensive ability, the number of valid invention patents, and the number of PCT national patent applications. Technological innovation excited the continuous updating of industrial structure in Guangdong Province. According to statistics, the proportions of primary, secondary, and tertiary industries in Guangdong Province in 2020 were 4.3%, 39.2%, and 56.5%, respectively. The proportions of value-added of the manufacturing industry and high-tech manufacturing industry were increasing continuously and accounted for 56.1% and 31.1%, respectively. Industrial cooperation and competitiveness enhanced continuously. This indicates that the industrial structure of Guangdong Province was optimising and updating continuously. Concerning economic development, Guangdong is a big economic province in China, and it takes the leading role in China given several economic indexes, possessing obvious economic strengths. In 2020, Guangdong Province implemented the macro-control policy of the central government and the ‘1 + 1 + 9’ work deployment thoroughly and promoted continuous steady healthy economic development throughout the province, bringing the comprehensive economic strength to a big step and increasing the quality benefits significantly. In 2020, the GDP of Guangdong Province exceeded CNY 11,000 billion (equivalent to USD 1542.1 billion). The annual growth rate of GDP was 6% during the ‘13th Five-year Plan’. Guangdong Province ranked first for 32 successive years in terms of economic aggregates. Further, the per capita GDP in Guangdong Province reached CNY 94,000 (equivalent to USD 13,175.04), which ranked first in China. Under the collaborative effect of technical progress, industrial structural updating, and economic level, Guangdong Province ranked first in terms of energy efficiency.

5.3. Robustness Test

The robustness of the examination and analysis results is an important step in QCA studies. According to Zhang and Du (2019) [36], a robustness test was carried out by adjusting the consistency threshold. With reference to the method of Ordanini et al. (2014) [44], the consistency threshold was increased by 0.05. In other words, the consistency threshold was 0.85 instead of 0.8 for secondary analysis. The analysis results are shown in Table 4.
Under this circumstance, the adjustment of parameters did not cause substantial changes in combination modes, consistency, and coverage, indicating that the analysis results are more robust [44].

6. Conclusions, Discussions, and Limitations

6.1. Conclusions

As an important index that influences economic and social development, energy efficiency is widely considered by countries globally when they formulate energy policies and make economic decisions. As the largest developing country, China has relatively lower energy efficiency than developed countries. Moreover, the extensive energy consumption mode still exists, which brings pressure on environmental protection and restricts economic development. Hence, it is urgent to improve energy efficiency to develop the economy.
Based on the idea of configuration, the relations of energy efficiency with technical progress, industrial structure, energy consumption structure, and economic level under the combination and complicated causality mechanism were investigated by QCA. The following conclusions could be drawn:
(1)
According to the analysis of the essential conditions, none of the four dependent variables is a necessary condition of the outcome variable (high energy efficiency). In other words, technical progress, industrial structure, energy consumption structure, and economic level are not bottlenecks of energy efficiency. Which means, no matter what situation the city or region is in, it can stimulate high energy efficiency through the rational allocation of the four conditions of technological progress, industrial structure, energy consumption structure and economic level.
(2)
According to combination analysis, three paths are found to improve energy efficiency. The first path is dominated by economic level and energy consumption structure with the assistance of industrial structure. The second path is dominated by economic level and energy consumption structure with the assistance of technical progress. The third path is dominated by technical progress and industrial structure with the assistance of the economic level.
(3)
Path 1 and path 2 form the second-order equivalent combination, indicating that technical progress and industrial structure are replaceable when energy consumption structure and economic level are relatively good.
(4)
It can be understood from the coverage of the paths that L3 shows the highest coverage, indicating that it can stimulate high energy efficiency the highest.

6.2. Discussions and Implications

6.2.1. Theoretical Contributions

The theoretical contributions of this study are as follows:
(1)
The causality relations based on essentiality are analysed through essential conditions. It was found that technical progress, industrial structure, energy consumption structure, and economic level are not essential conditions to stimulate high energy efficiency. This means although each province has a different degree of a single factor, this does not hinder the stimulation of high energy efficiency through different combination modes.
(2)
This study organised and selected four key variables that influence energy efficiency and the three paths that stimulate high energy efficiency are recognised by QCA. This proves that these four key variables influence and mutually depend on energy efficiency rather than presenting a simple linear relationship. This result expanded studies on energy efficiency.

6.2.2. Management Enlightenment

This study gained the following enlightenment in management:
(1)
Most regions achieve high energy efficiency mainly through technical progress and industrial structure, assisted by economic level. Therefore, attention should be paid to the important role of technical progress, industrial structure, and economic level. The perfect completion of the ‘13th Five-year Plan’ further improved the economic development of different regions. All cities in China have improved their economic strength by following up the tide of age development, which provides capital support to technical progress. They all increased R&D expenditures continuously, and guided enterprises and scientific research institutes in technological R&D and innovation. Significant attention is paid to the promotion effect of technical progress in industrial structural optimisation. The industrial structure is updated by improving technological innovation levels continuously, thus making proportions of light and heavy industries increasingly more reasonable. The production technological level of the industrial department has increased and a development system with high value-added, high-energy efficiency, and energy conservation has been established.
(2)
Path 1 and path 2 formed the second-order combination. This means that industrial structure and technical progress are replaceable when the economic level and energy consumption structure are relatively good. Central and western China shall introduce and reform advanced technologies continuously, strengthen technological communication among regions, and improve regional energy efficiency through technical progress. Coastal regions in eastern China shall emphasise optimisation and adjustment of industrial structure, continue to implement the strategy of ‘shifting from a labour-intensive industry to service the economy’, and transfer production actors from low-productivity sectors to those with high-productivity. On the one hand, the structural and production effects brought by the productivity transfer continue to promote economic development, and on the other hand, ‘shifting from a labour-intensive industry to service the economy’ decreases economic dependence on energy sources, thus improving energy efficiency.

6.3. Limitations

Essentially, this study has some shortcomings.
(1)
This study mainly focuses on the analysis of the four key variables that influence energy efficiency. However, more factors influence energy efficiency. Follow-up studies can involve more condition variables to analyse the possible allocation effect of their combinations, aiming to increase the universality of this study.
(2)
This study is a static case study without considering the important possible influences of time dimension on energy efficiency. In the future, panel data should be collected and dynamic QCA should be used to further verify the complicated causality between different influencing factors and energy efficiency.

Supplementary Materials

The following supporting information can be downloaded at: https://www.mdpi.com/article/10.3390/su142316103/s1.

Author Contributions

Conceptualization, C.L.; Methodology, B.S.; Writing—original draft, Z.T.; Writing—review & editing, G.Q. All authors have read and agreed to the published version of the manuscript.

Funding

This paper is supported by the Science and Technology Department of Jilin Province in China “Research on Talent Training Mechanism of Scientific and Technological Innovation in Jilin Province Based on QCA Method (Project No.: 20210601049FG)”.

Institutional Review Board Statement

Not applicable.

Informed Consent Statement

Not applicable.

Data Availability Statement

All sample data used in the analysis come from the Statistical Yearbook and China Energy Statistical Yearbook of 30 provinces (municipalities and autonomous regions) in 2020 (http://www.stats.gov.cn/). All the data was open. We also provide the raw data of this study in Supplementary Materials.

Conflicts of Interest

The authors declare no conflict of interest.

References

  1. Hu, J.L.; Kao, C.H. Efficient energy-saving targets for APEC economies. Energy Policy 2005, 35, 373–382. [Google Scholar] [CrossRef]
  2. Didier, B.; Cécile, R. The need to link energy efficiency indicators to related policies. Energy Policy 1997, 25, 813–823. [Google Scholar]
  3. Wei, Y.M.; Liao, H. Seven types of measuring indicators of energy efficiency and measurement methods. China Soft Sci. 2010, 1, 128–137. [Google Scholar]
  4. Wang, X.L.; Wu, C.Y. International comparison of energy ecological efficiency from the perspective of “greening”—An empirical test based on panel data of “G20”. Technol. Econ. 2015, 34, 70–77. [Google Scholar]
  5. Farrell, M.J. The Measurement of Productive Efficiency. J. R. Stat. Soc. 1957, 120, 253–290. [Google Scholar] [CrossRef]
  6. Phylipsen, G.J.M.; Blok, K.; Worrell, E. International comparisons of energy efficiency-Methodologies for the manufacturing industry. Energy Policy 1997, 25, 715–725. [Google Scholar] [CrossRef]
  7. Wang, Q.Y. Energy efficiency and its policies and technology (I). Energy Eng. Environ. Prot. 2001, 6, 11–14. [Google Scholar]
  8. Wei, C.; Shen, M.H. Whether structural adjustment can improve energy efficiency: A study based on provincial data of China. World Econ. 2008, 11, 77–85. [Google Scholar]
  9. Wu, Q.; Wu, C.Y. Research on energy efficiency evaluation model based on DEA. Manag. Sci. 2009, 22, 103–112. [Google Scholar]
  10. Du, J.M. Evaluation on interprovincial energy efficiency of China based on super-efficiency DEA. Ecol. Econ. 2015, 31, 51–55, 75. [Google Scholar]
  11. Shi, F.; Shen, K.R. China’s total factor energy efficiency under market segmentation: An empirical analysis based on super-efficiency DEA. World Econ. 2008, 9, 49–59. [Google Scholar]
  12. Zhang, W.; Cheng, J.; Liu, X.; Zhu, Z. Heterogeneous industrial agglomeration, its coordinated development and total factor energy efficiency. Environ. Dev. Sustain. 2022, 1–27. [Google Scholar] [CrossRef]
  13. Lu, Z.N. Empirical analysis of influences of industrial restructuring on China’s energy consumption. Quant. Tech. Econ. Res. 1999, 12, 53–55. [Google Scholar]
  14. Zhang, C.; Chen, P. Applying the three-stage sbm-dea model to evaluate energy efficiency and impact factors in rcep countries. Energy 2022, 241, 122917. [Google Scholar] [CrossRef]
  15. Shi, D.; Zhang, J.L. Effects of industrial structural changes on energy consumption. Econ. Theory Bus. Manag. 2003, 8, 30–32. [Google Scholar]
  16. Yu, B.B. How does industrial restructuring improve regional energy efficiency?—An empirical survey based on double dimensions of amplitude and quality. Financ. Res. 2017, 43, 86–97. [Google Scholar]
  17. Ye, Y.G.; Sun, L. Resource efficiency and technological innovation. Chin. Popul. Resour. Environ. 2002, 6, 17–19. [Google Scholar]
  18. Feng, F. Research on variation effect of energy price and technological progress on energy efficiency from the endogenous perspective—Based on PVAR model. Manag. Rev. 2015, 27, 38–47. [Google Scholar]
  19. Li, G.; Gao, D.; Li, Y. Dynamic environmental regulation threshold effect of technical progress on green total factor energy efficiency: Evidence from china. Environ. Sci. Pollut. Res. 2022, 6, 29. [Google Scholar] [CrossRef] [PubMed]
  20. Hang, L.M.; Tu, M.Z. Effects of energy price on energy intensity—A case study based on China’s manufacturing industry. Quant. Tech. Econ. Res. 2006, 12, 93–100. [Google Scholar]
  21. Guo, J.E.; Chai, J.; Xi, Y.M. Effects of primary energy consumption structural changes on energy consumption per unit GDP of China. Chinese Population. Resour. Environ. 2008, 4, 38–43. [Google Scholar]
  22. Brodny, J.; Tutak, M. Analysis of the efficiency and structure of energy consumption in the industrial sector in the european union countries between 1995 and 2019. Sci. Total Environ. 2022, 808, 152052. [Google Scholar] [CrossRef] [PubMed]
  23. Wu, L.X.; Wang, L. Research on China’s energy consumption and energy efficiency fluctuation and influencing factors. Urban Environ. Study 2019, 3, 55–71. [Google Scholar]
  24. Shi, D. Improvement of energy utilization during China’s economic growth. Econ. Study 2002, 9, 49–56+94. [Google Scholar]
  25. Chen, J.; Xu, S.Y. Effects of technological progress on China’s energy efficiency: 1979—2006. Sci. Manag. Res. 2008, 1, 9–13. [Google Scholar]
  26. Zhang, L.J. Research on energy efficiency in China and influencing factors. Technoecon. Manag. Res. 2011, 4, 74–77. [Google Scholar]
  27. Liang, H.J.; Song, Y.Q.; Zhou, Y.Y.; Zhao, D. Analysis on influencing factors of regional energy efficiency in China and countermeasures. North. Econ. Trade 2020, 3, 114–116. [Google Scholar]
  28. Jiang, L.; Ji, M.H. Technological progress, industrial structure, energy consumption structure and China’s energy efficiency—An analysis based on ridge regression. Contemp. Econ. Manag. 2011, 33, 13–16. [Google Scholar]
  29. Guo, X.M.; Huang, S. Research on Influencing Factors of Energy Efficiency of Three Industries in China from the Multi-Dimension Perspective; China Fortune Publishing House: Beijing, China, 2019. [Google Scholar]
  30. Du, Y.Z.; Jia, L.D. Combination perspective and qualitative comparative analysis (QCA): A new path to study management science. Manag. World 2017, 6, 155–167. [Google Scholar]
  31. Long, R.Y.; Li, Z.G. Empirical study on the relationship between technological progress and energy intensity. East China Econ. Manag. 2009, 23, 36–39. [Google Scholar]
  32. Xu, M.; Jiang, Y. Can China’s industrial updating narrow the urban-rural consumption gap? Quant. Tech. Econ. Res. 2015, 32, 3–21. [Google Scholar]
  33. Xu, Y.Z.; Wang, Q.T. Research of influences of energy consumption on new urbanization—Test based on threshold effect. East China Econ. Manag. 2018, 32, 5–13+2. [Google Scholar] [CrossRef]
  34. Cao, Q.; Fan, M.T. Analysis on China’s provincial energy efficiency and influencing factors. J. Guizhou Univ. Financ. Econ. 2016, 3, 85–94. [Google Scholar]
  35. Cheng, J.Q.; Luo, J.L.; Du, Y.Z. When institutional environment and psychological cognition stimulate entrepreneurship?—A research based on QCA. Sci. Technol. Manag. 2019, 2, 18. [Google Scholar]
  36. Zhang, M.; Du, Y.Z. Application of QCA in organization and management studies: Orientation, strategy and direction. J. Manag. 2019, 16, 1312–1323. [Google Scholar]
  37. Ragin, C.C. Redesigning Social Inquiry: Fuzzy Sets And Beyond; University of Chicago Press: Chicago, IL, USA, 2008. [Google Scholar]
  38. Fan, D.C.; Wang, S.H.; Zhang, W. Analysis on influencing factors of primary energy consumption structure under low-carbon economic goal. Resour. Sci. 2012, 34, 696–703. [Google Scholar]
  39. Li, G.Z.; Huo, Z.J. China’s energy consumption, energy consumption structure and economic growth—An empirical study based on ARDL model. Mod. Econ. Sci. 2010, 32, 55–60+125–126. [Google Scholar]
  40. Qin, T.; Tong, J.P.; Cao, Q.; Chen, X. Research on economic threshold effect of technological progress and energy consumption. Sci. Technol. Manag. Res. 2015, 35, 32–36. [Google Scholar]
  41. Zhou, S.J.; Kong, X.L. Panel segmentation regression of influences of energy consumption on energy efficiency. Ind. Technol. Econ. 2018, 37, 145–153. [Google Scholar]
  42. Wu, J.; Tan, T.; Yang, K.; Yang, J. Research on total factor energy efficiency evaluation in China—Based on inseparable three-staged DEA model. Appl. Stat. Manag. 2019, 38, 418–432. [Google Scholar]
  43. Zhou, N. Regional difference of energy efficiency in China and influencing factors—Based on interprovincial panel data from 2006 to 2015. Chin. Assoc. Quant. Econ. 2017, 18, 543–565. [Google Scholar]
  44. Ordanini, A.; Parasuraman, A.; Rubera, G. When the Recipe Is More Important Than the Ingredients: A Qualitative Comparative Analysis (QCA) of Service Innovation Configurations. J. Serv. Res. 2014, 17, 134–149. [Google Scholar] [CrossRef]
Figure 1. Influencing factors’ model of energy efficiency.
Sustainability 14 16103 g001
Figure 2. fsQCA method flow chart.
Sustainability 14 16103 g002
Table 1. Calibrated anchoring points of variables.
SetFuzzy-Set Calibration
Complete Affiliated PointIntersection PointComplete Non-Affiliated Point
Energy efficiency3.021.911.11
Technical progress979.28525.86161.23
Industrial structure2.832.362.04
Energy consumption structure11.625.94.05
Economic level7.725.855.11
Table 2. Results of analysis of essential conditions.
ConfigurationConsistencyCoverage
technical progress0.790.82
~technical progress0.310.31
industrial structure0.690.71
~industrial structure0.400.41
energy consumption structure0.660.70
~energy consumption structure0.440.45
economic level0.750.77
~economic level0.340.35
Table 3. Paths of high energy efficiency.
ConfigurationHigh Energy Efficiency Solution
L1L2L3
Technical progress
Industrial structure
Energy consumption structure
Economic level
Consistency0.970.970.88
Raw coverage0.520.510.64
Unique coverage0.040.160.09
Overall solution coverage0.70
Overall solution consistency0.88
Note: Relevant signs in the table are introduced as follows: with reference to expression modes of [37], ● represents the occurrence of condition variables [38]. Specifically, the big circle indicates core conditions, and the small circle indicates contributing conditions. The blank means that the condition variable is not important to the occurrence of results (either appearance or absence is acceptable).
Table 4. Robustness test.
ConfigurationsHigh Energy Efficiency
L1L2
Technical progress
Industrial structure
Energy consumption structure
Economic level
Consistency0.970.97
Raw coverage0.520.51
Unique coverage0.040.03
Overall solution coverage0.54
Overall solution consistency0.96
Note: Relevant signs in the table are introduced as follows: ● represents the occurrence of condition variables. Specifically, the big circle indicates core conditions, and the small circle indicates contribution conditions. The blank means that the condition variable is not important to the occurrence of results (either appearance or absence is acceptable).
Publisher’s Note: MDPI stays neutral with regard to jurisdictional claims in published maps and institutional affiliations.

