Article

Urban Growth Boundaries Delineation under Multi-Objective Constraints from the Perspective of Humanism and Low-Carbon Concept

1
School of Resources and Environmental Engineering, Wuhan University of Technology, Wuhan 430070, China
2
Patent Examination Cooperation Guangdong Center of the Patent Office, CNIPA, Guangzhou 510000, China
*
Author to whom correspondence should be addressed.
Sustainability 2022, 14(23), 16100; https://doi.org/10.3390/su142316100
Submission received: 14 October 2022 / Revised: 21 November 2022 / Accepted: 29 November 2022 / Published: 1 December 2022

Abstract

:
Urban growth boundaries (UGBs) play an important role in controlling urban sprawl and protecting natural ecosystems. Traditional methods mainly focus on the heterogeneity of regional resources and environment rather than residents’ behavioral activities. However, residents’ behavioral activities are one of the most important factors influencing urban spatial form. Fortunately, the emergence of big data, especially phone signaling data, provides alternative data sources to understand the dynamic resident behavior activity space, which is significant for people-oriented urban development. Therefore, we propose a novel framework for UGB delineation based on multi-source big data and multi-objective constraints, which emphasizes humanism and the low-carbon concept in urban expansion simulation. The multi-objective constraints are constructed from the evaluation of resident activity space expansion potential, the evaluation of urban construction suitability, the evaluation of ecological conservation importance, and the human survival materials limitation. We apply the framework to Ningbo, and the results show that the framework under multi-objective constraints from a people-oriented and low-carbon perspective is more reliable and comprehensive than that without constraints. The findings also show that the UGB delineation based on multi-source big data has higher accuracy and better performance. The conceptual and methodological advances of this study are also applicable to other cities to help UGBs delineation.

1. Introduction

The amount of land that has been utilized to satisfy urban growth has increased dramatically during rapid urbanization, resulting in urban sprawl, degradation of ecosystem functions, and over-exploitation of natural resources, which restricts sustainable urban development [1,2]. Meanwhile, carbon emissions caused by urban sprawl are contributing to climate changes. Thus, how to scientifically promote people-oriented and low-carbon development of city and reasonably coordinate the balanced relationship between development and protection have become urgent problems in urban planning and management [3,4,5]. To resolve these issues, UGB provides an effective method for sustainable urban management and is regarded as a useful planning tool [3,6,7].
The UGB is the regional boundary that can carry out urban construction and allow urban construction land expansion under different planning objectives. It is a tool that can be used to guide and limit urban growth, controlling urban sprawl with rigid boundaries [8]. UGB was originally proposed in 1976 by the city of Salem to resolve the conflicts with neighboring counties Polk and Marion over the management of urban space [9,10]. Subsequently, UGBs were implemented in some cities, such as Portland and Melbourne, effectively controlling the urban sprawl caused by a rapidly rising population and a rapidly growing number of cars [11,12]. By the 1990s, more than 100 cities and regions in the United States had employed UGBs to manage urban development [6]. In China, with the advancement of reform and opening up and rapid economic development, the urbanization process has been accelerating, and the urbanization rate of the population has increased from 17.9% in 1978 to 63.8% in 2020, exceeding the world average. The rapid urban development has also brought about many urban problems [13]. In order to solve these problems, researchers introduced UGBs into China in the early 21st century [14], and UGBs became an important policy tool to control urban sprawl [15,16].
Methods of UGB delineation are mainly divided into two types: static spatial analysis methods and dynamic spatial growth simulations [17]. The former involves Frey’s qualitative delineation method and Portland’s qualitative delineation method [18]. Frey’s qualitative delineation method delineates UGBs by identifying regional development issues and predicting future construction land expansion based on population, infrastructure, and development costs [19]. Portland’s qualitative delineation method is to determine the urban development pattern and then refines UGB by combining factors that affect urban development. These factors include land use, service center’s location, environmentally sensitive areas, and unsuitable land for development, etc. However, the classic static spatial analysis methods failed to simulate the spatio-temporal change of the urban boundary. Thus, dynamic models for urban growth simulation attracted considerable attention [20], such as cellular automaton (CA) [21] and an agent-based model [22]. In particular, CA has been extensively employed in urban growth simulation due to its advantages in dynamic simulation of urban development. Traditional CA focuses on the interaction of land units and does not consider the influence of environmental and economic factors on land. Therefore, quite a few models have been proposed to consider the above-mentioned factors affecting urban development, such as the SLEUTH model, the CLUE-S model, the CA–Markov model, and the constrained CA model [23,24]. Among them, the constrained CA model has certain advantages and application prospects in urban simulations. For example, Long et al. (2009) simulated Beijing’s UGB using the constraint CA [25]. Ma et al. (2014) utilized this model to pre-evaluate land-use planning schemes in Guangzhou and analyzed the conflict areas between simulation results and planning results [26]. The constraints of these existing models have considered factors that influence urban expansion, such as natural conditions, spatial location from ecological perspective, etc. However, limited by the absence of data that can characterize human activities at fine scales, few studies have included humanistic indicators such as human behavioral activities in the constrained CA [27,28]. However, humanism is the criterion for the appropriateness of urban development and is necessary and significant in urban growth boundary’s delineation [29]. Thus, indicators like residents’ activities, living environment, and so on should be integrated into the constrained CA.
Most of the existing studies are based on traditional data, such as satellite images, data on transportation, and natural features. These data are ineffective in describing the characteristics of human behavior activities, and the description of the refinement of urban simulation is yet insufficient. The reason is that it is difficult to obtain fine-scale data to study the impact of residential activities on urban sprawl. The emergence and development of big data technology provides good conditions to solve the above problems. Compared with traditional data, big data has advantages in describing the human–land relationship and discovering spatial problems, which provides an effective method for people-oriented urban planning [30]. In recent years, it is worth noting that big data have attracted considerable attention in urban planning. It has been widely employed to study the urban system, urban spatial structure zoning, etc. For instance, using 2.5 million communication data, obtained from Belgian mobile operators, Kring analyzed the links between 571 cities in Belgium to build a social network between cities and to describe the city hierarchy [31]. Gong identified the maintenance activity space, commuting activity space, and recreational activity space at multiple geographic scales by using mobile phone data and analyzed the relationship between the built environment and activity space [32]. However, in the field of UGB delineation, big data is not yet widely used. The above-mentioned urban measures, which use big data, have also been rarely introduced into the UGB delineation. However, big data, especially mobile phone signaling data, not only provides a new perspective for the study of human activities and urban space but also provides a new method for UGB delineation [33]. Thus, it is an excellent data source for the future urban expansion model [34]. The UGB delineation based on big data is more humanized and scientific.
At the same time, low-carbon urban development is a topic that must be considered to balance climate change and human development. The consideration of low-carbon concepts in urban development can better guide cities to reduce carbon emissions and promote carbon peaking and carbon neutrality goals. Lei Chen employed the DID method for panel data from 2000 to 2019 in China to shed light on the effects on carbon emissions. Results show that the UGB can reduce carbon emissions considerably, and the carbon emissions of the pilot cities decreased by 23.91%. [35] Thus, incorporating low-carbon concepts in the UGB delineation can promote carbon emission reduction in urban development and ultimately reduce carbon emissions from urban human activities to better contribute to solving climate change issues.
Therefore, we attempt to establish a framework for the delineation of UGBs that couples humanism with the concept of low-carbon development. In this framework, multi-source big data, such as phone signaling data, POI, and night-light data, are used to analyze the spatial expansion potential of residents’ activities as a way to reflect the role of people in urban development. Then, combined with other multi-objective constraints like urban construction suitability, ecological conservation importance, and human survival materials, we optimize the constrained CA model to make it more comprehensive and humanistic and use the improved constrained CA model to simulate urban growth. The proposed framework aims to develops more humanized urban boundary and promote low-carbon development.

2. Study Area and Data
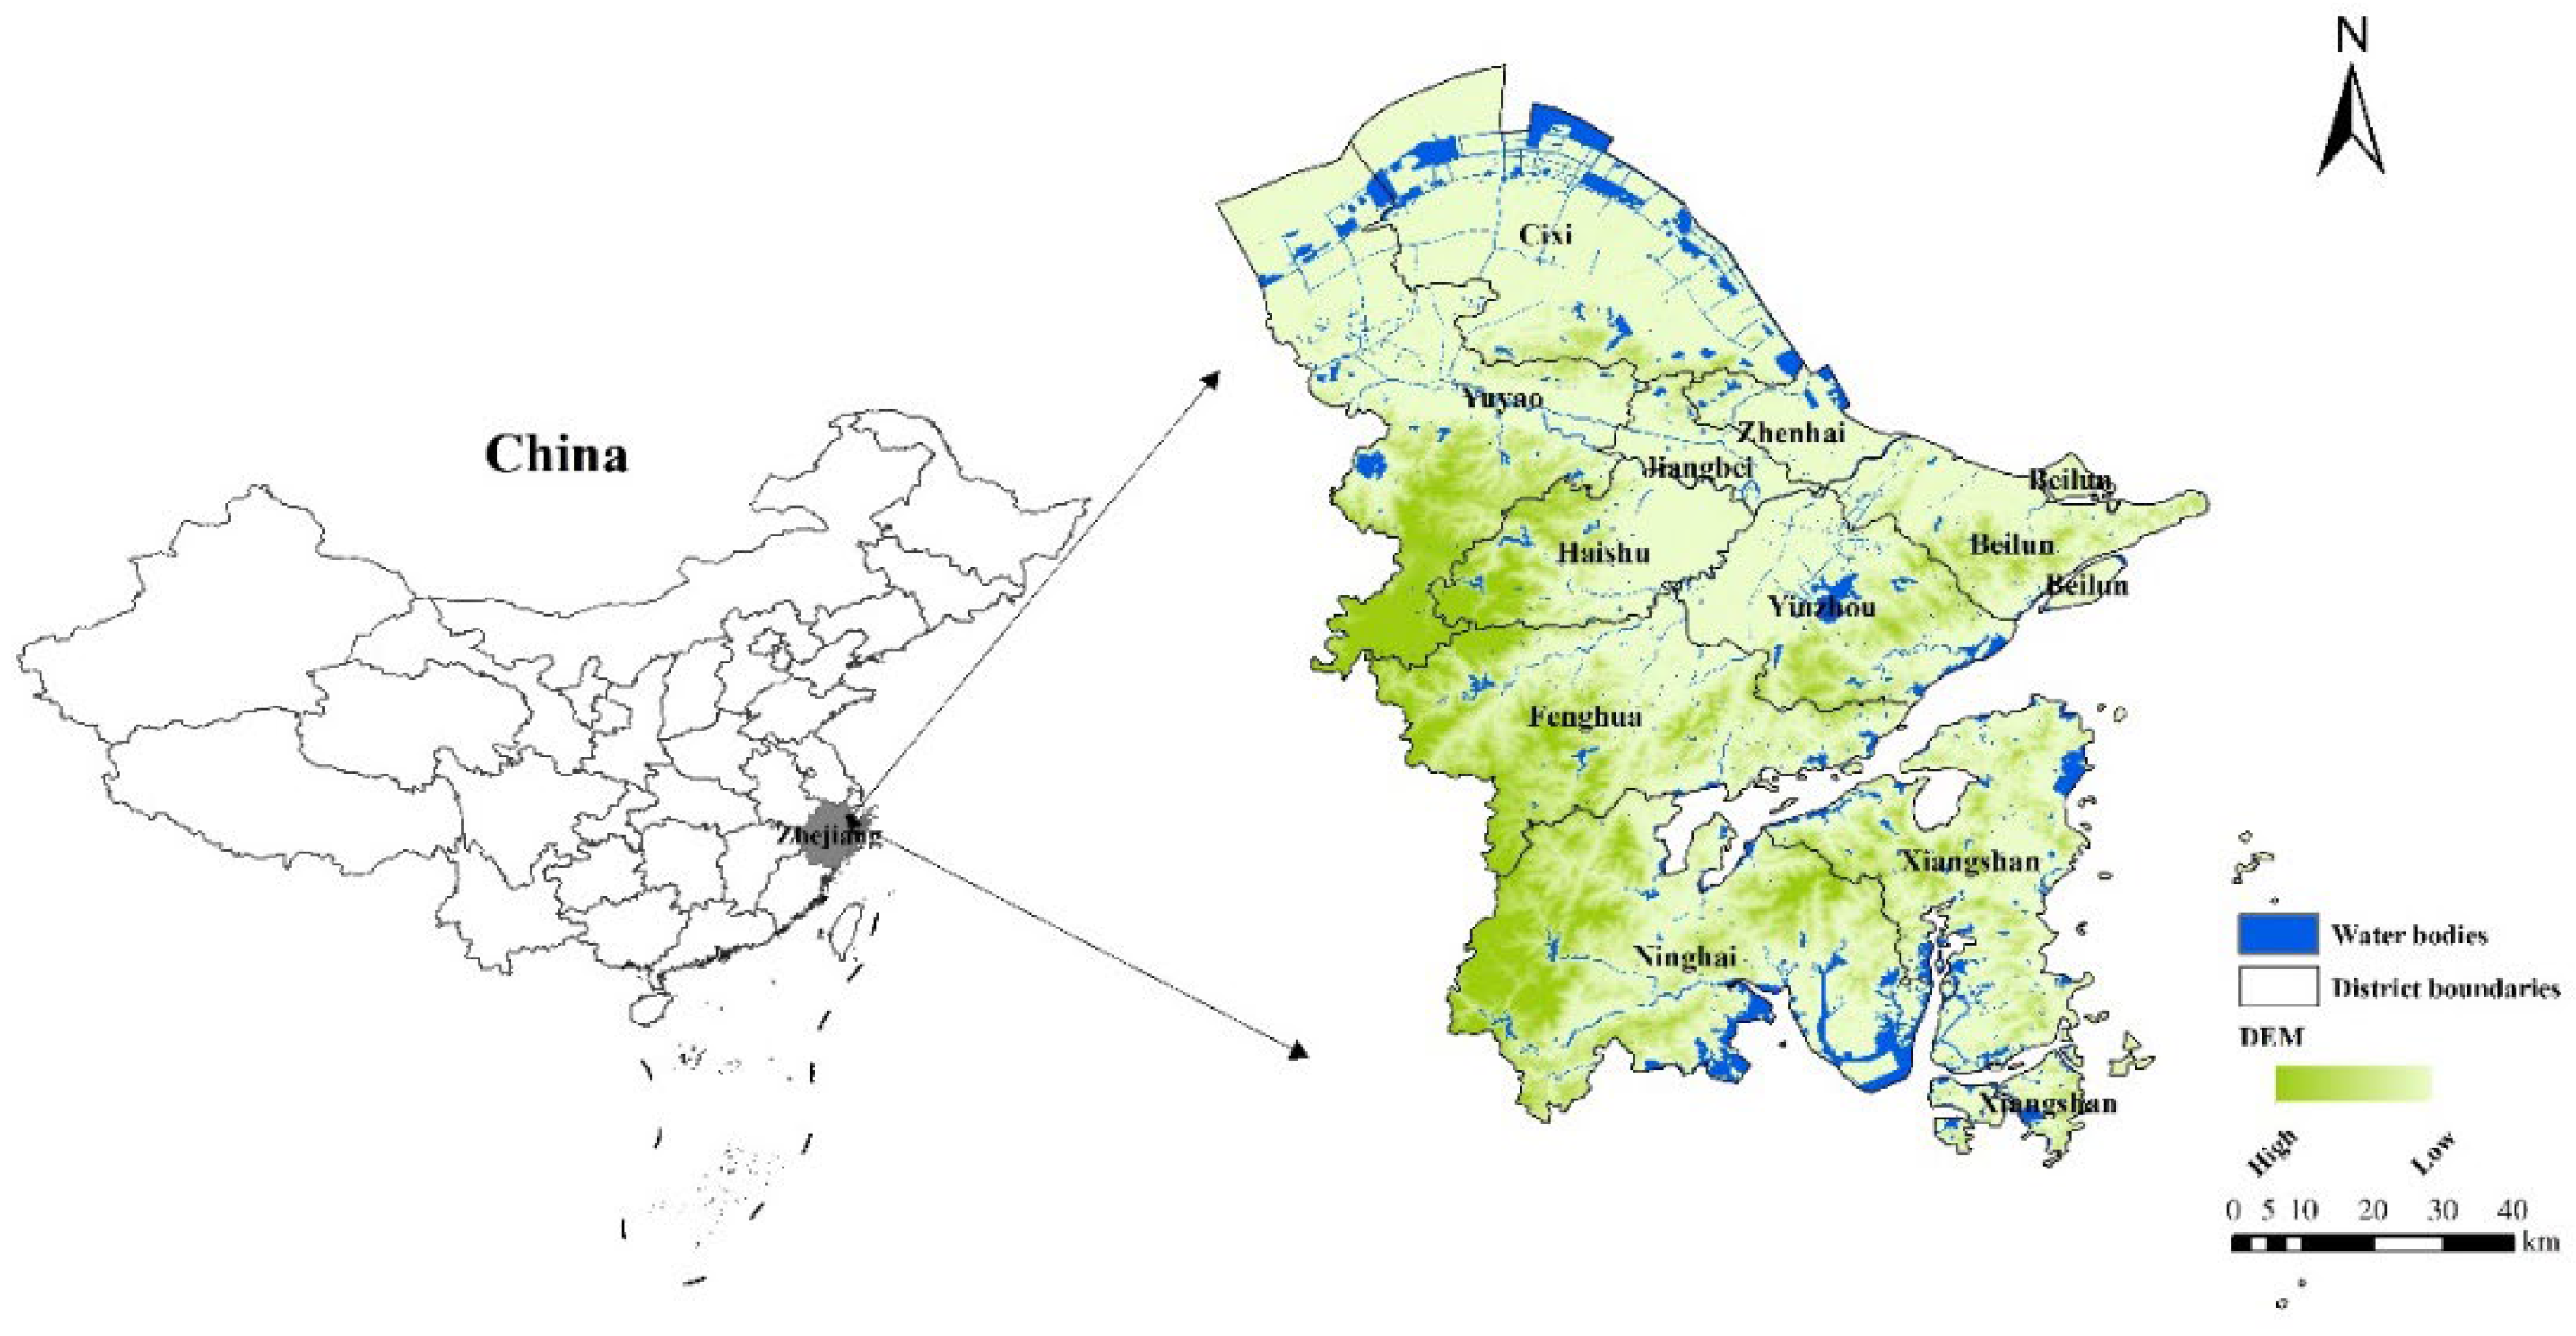
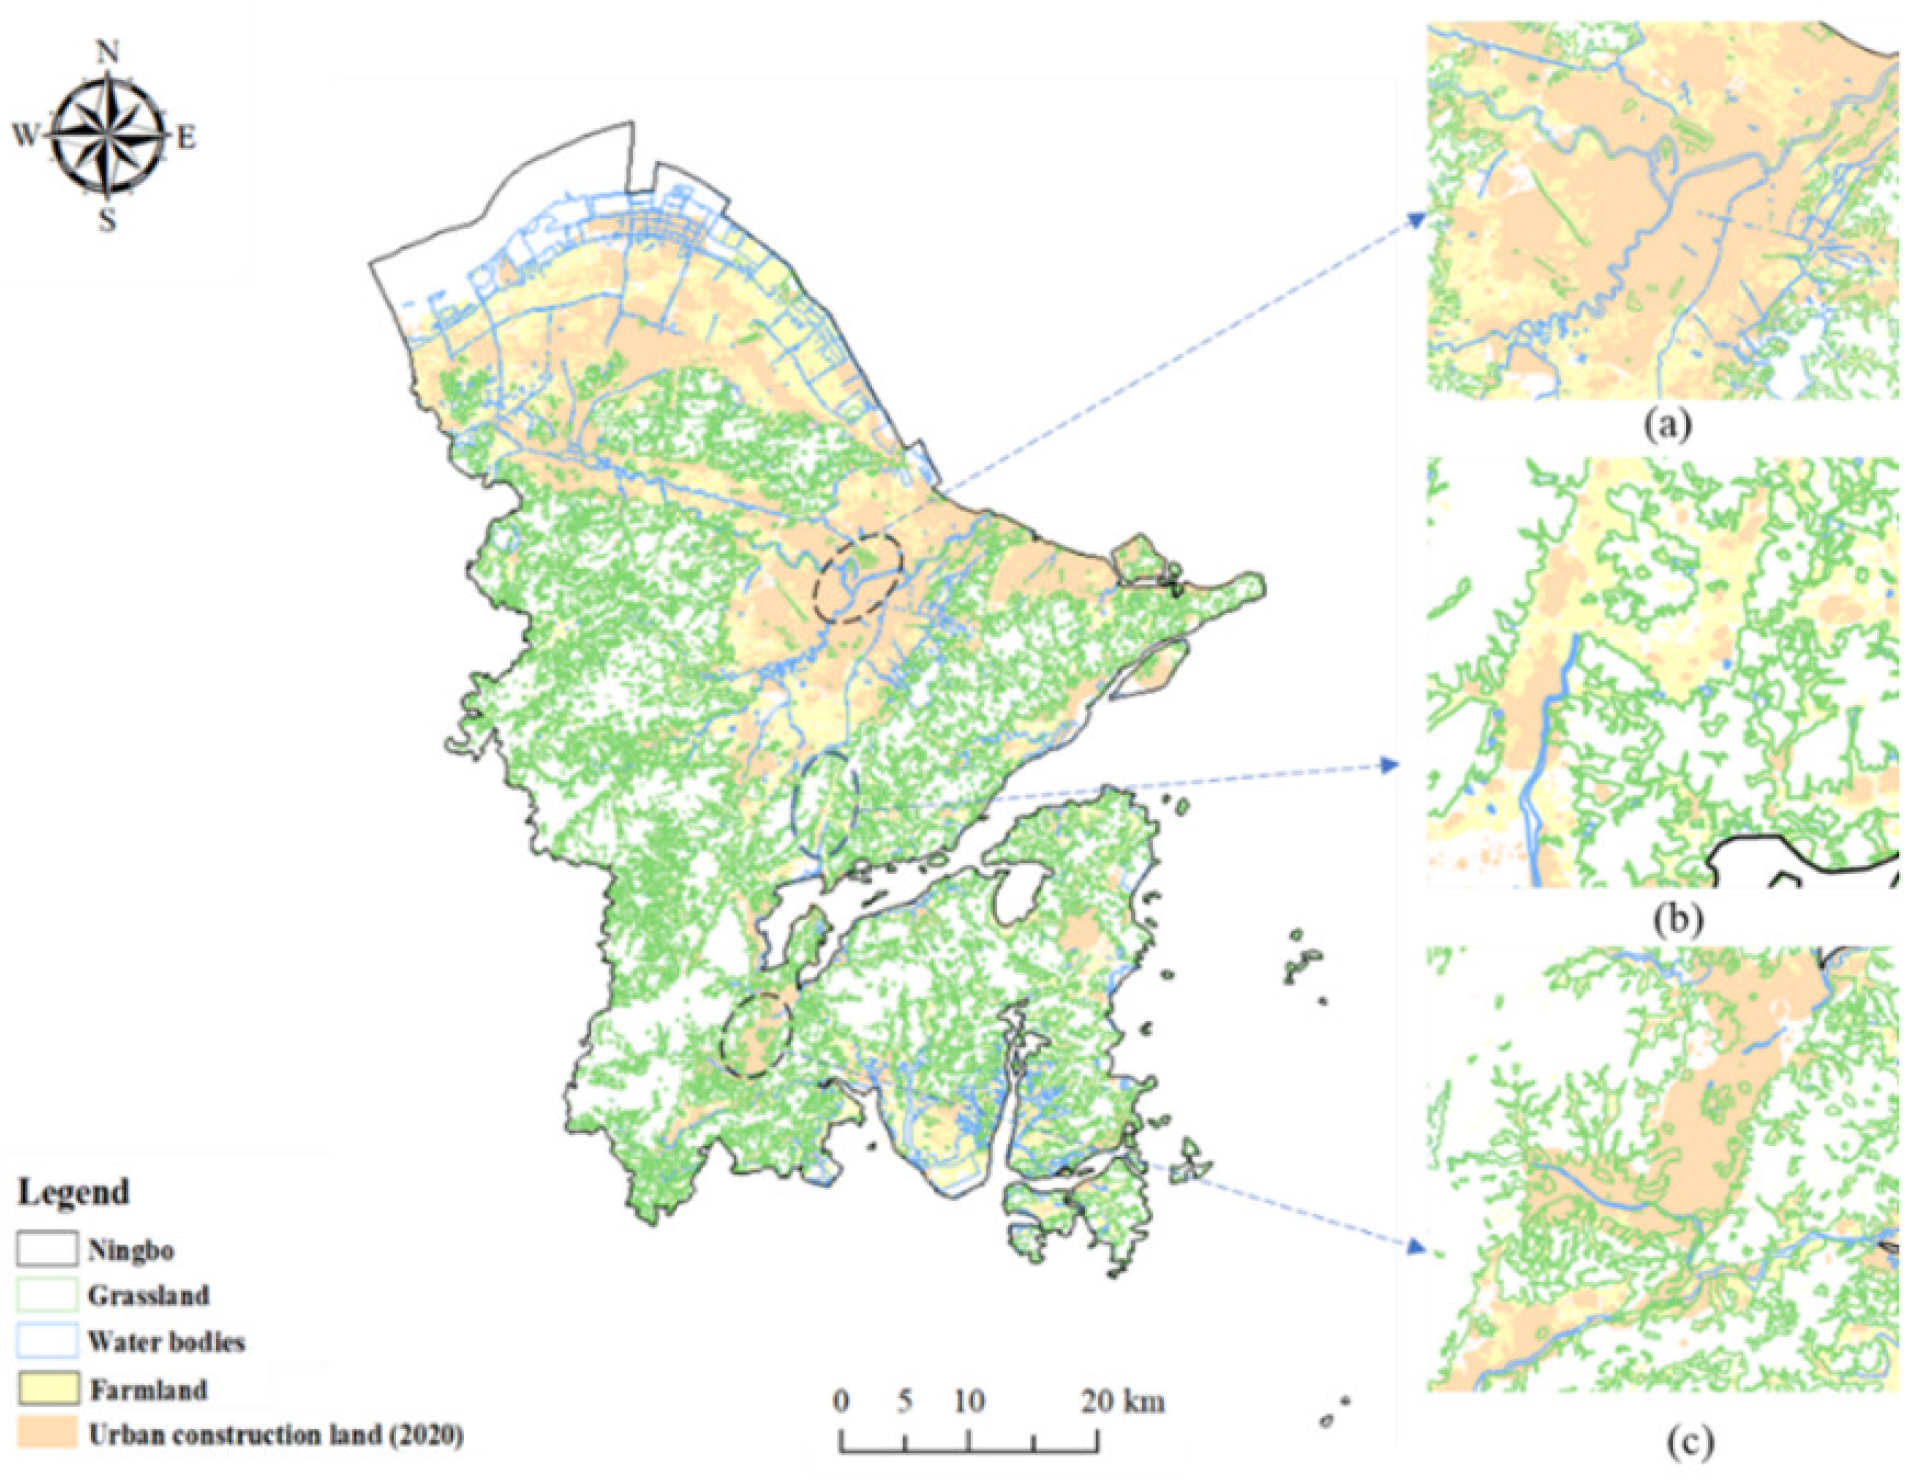
2.1. Study Area

Ningbo, a rapidly urbanizing city, is located in the southeastern coast of China. It is one of the economically central cities in Yangtze River Delta. Ningbo consists of six districts (Haishu, Jiangbei, Beilun, Zhenhai, Yinzhou, and Fenghua), two counties (Ninghai and Xiangshan), and two county-level cities (Cixi and Yuyao) (Figure 1). During the period from 1978 to 2020, Ningbo experienced rapid development in terms of population and urban built-up area: the population in 2020 was 9.4 million, which was approximately 2.05 times that in 1978 (4.58 million); the urban built-up area in 2019 was 526 km2, which was over 28 times that in 1978 (18.3 km2) [36]. Ningbo’s rapid urbanization has brought great pressure to the ecological environment and to human settlements. In addition, human needs and carbon reduction will receive more attention in urban growth management over the next five years (2020–2025) according to the Ningbo development strategy. Thus, UGB delineation from the perspective of humanism and the low-carbon concept should be considered in Ningbo’s future growth.

2.2. Data

There are considerable data needed for UGB delineation in this research. They are classified into administrative boundaries, land-use data, and constraint factor data (Table 1). Ningbo’s administrative boundary is used as a reference to clip all geospatial data from Ningbo. The land-use data served as the foundation in the constraint CA model. The constraint factor data is divided into four groups: residential activity space constraint, human settlement suitability constraint, human settlement ecological constraint, and human settlement security constraint. The coordinate system of spatial data is set as a CGCS2000 national geodetic coordinate system, and all data are resampled to the same resolution of 30 m × 30 m.

3. Methodology

3.1. Research Framework

In this study, Figure 2 demonstrates the proposed framework of UGB delineation. We adopt the constraint CA model to conduct UGB delineation by coupling the multi-objective constraints from humanism and the low-carbon concept. The humanism is reflected by the residential activity space constraint and the human settlements suitability constraint. The low-carbon concept is embodied in the human settlements ecological constraint and the human survival conditions constraint. The above multi-objective constraints are derived from three evaluations and a limitation (see Section 3.2, Section 3.3, Section 3.4 and Section 3.5 for details). Then, they are integrated into the constrained CA model to simulate urban expansion. Finally, the urban growth boundary is delimited using the expansion and erosion algorithm, because this algorithm has advantages in boundary smoothing and extraction [37].

3.2. Evaluation of Residential Activity Space Expansion Potential Based on Multi-Source Big Data

Evaluation of residential activity space expansion potential is used to reflect the willingness of residents’ behaviors. The stronger this willingness is, the higher the probability that the area will develop into a city. Thus, resident behavior, such as commuting, leisure consumption, etc., play an important role in driving urban development and forming an urban boundary [38]. Previous studies focus on factors in the economic, social and natural environment. However, there are few studies incorporating human behavior into analyzing the urban form. Thus, it is necessary to consider the influence of human activities on urban expansion. In this study, the evaluation was conducted from the aspects of resident behavior, economic development, and infrastructure layout by using telephone signal data, POI, and nighttime-lighting data, respectively (Table 2) [39].
In terms of resident behavior, studying urban expansion through residents ‘daily activities (e.g., commuting, leisure consumption) and evaluating residents’ activity space is helpful to discover new urban spatial characteristics. Using phone signaling data, we evaluate the impact of residents’ behavior characteristics on urban sprawl from five aspects: commuting, leisure consumption, the jobs–housing space, population distribution, and people flow. Specifically, (1) the average commuting distance to residents’ workplaces is calculated to characterize the attractiveness of jobs. The farther away it is, the greater is the potential of residential activity space expansion, because residents tend to choose employment in economically developed neighboring regions. (2) the average travel distance for leisure consumption is calculated to reflect the convenience of the residents’ leisure. The closer the distance, the greater the potential of residential activity space expansion because of residents’ leisure consumption proximity. (3) The job–resident ratio is calculated to judge the balance between work and housing. It also reflects the happiness of residents’ commuting. The closer the job–resident ratio is to 1, the greater the potential of residential activity space expansion. (4) The actual service population density is calculated to reflect the level of urban public service management. The bigger the actual service population density, the greater the potential of residential activity space expansion. (5) The total amount of people flow is evaluated to reflect the scale of the city’s hierarchy. The greater the total amount of people flow, the greater the potential of residential activity space expansion.
As far as economic development is concerned, the total nighttime-lighting index extracted from nighttime-light data reflects the impact of socio-economic factors on urban growth. The greater the total nighttime-lighting index, the greater the potential of residential activity space expansion [40].
In terms of infrastructure layout, using POI data, the distance to service facilities characterizes the impact of infrastructure layout on urban expansion. The more developed the infrastructure, the lower the development cost of urban space and the easier it is to convert non-urban land into urban land [41]. That is, the closer the distance, the greater the potential of residential activity space expansion.
After obtaining these indicators based on multi-source big data, the weight of each evaluation index is assigned due to different impacts of the index on urban expansion. The potential of residential activity space expansion is calculated using Equation 1, which is used to construct the residential activity space constraint.
S i j = k = 1 n β k D k
In Equation (1), S i j is the residential activity space expansion potential; β k is the weight of impact factors in urban expansion;   D k is the impact factor on urban expansion; n is the different dimension.

3.3. Evaluation of Urban Construction Suitability

The evaluation of urban construction suitability characterizes human settlement livability. Creating a good human settlement is essential for people-oriented sustainability development. In our study, the urban construction suitability indicates how natural environment elements influence human settlement and urban construction [42,43]. This evaluation mainly considers factors such as the livability of land resources, water resources, environment, and climate. After evaluating each factor, the results of the suitability of urban construction are synthesized, which is used to construct the constraints of human settlements suitability.

3.4. Evaluation of Ecological Conservation Importance

The evaluation of ecological conservation importance aims to protect important ecosystems, such as forests and wetlands. It is vital for enhancing the capacity of ecological carbon sinks, which should be considered in the UGB delineation. In this study, the ecological protection importance is evaluated from two aspects: ecosystem service importance and ecosystem vulnerability (Table 3) [44]. The ecosystem service importance is assessed regarding water resources retention capacity conservation, soil and water conservation, and biodiversity conservation. The ecosystem vulnerability is estimated from soil erosion, land desertification, and rock desertification [45].

3.5. Limitation of Human Survival Materials

The limitation of human survival materials is mainly used to protect the most basic resources for human survival and low-carbon development. Due to the expansion of urban construction land, limited land resources will inevitably lead to farmland occupation, water pollution, and other problems. However, water bodies and farmlands, which are important for food security, are the most basic elements of human survival and are also helpful in reducing carbon emission. At the same time, if farmland or water bodies are converted into construction land, the carbon emissions from human activities such as building will increase tremendously compared to their current state. Thus, their conservation makes sense not only for human survival but also for the sustainable development of low-carbon cities. However, such protection can act as a disincentive to urban expansion and must be considered in the constraints. At the same time, the government, as the supply side, considers its own low-carbon development requirements, and it restricts the conversion of basic agricultural land and water bodies into construction land, especially in the housing market. In order to reflect this requirement, we set farmland and water bodies as limitations from the low-carbon perspective and the supply perspective to ensure basic human survival needs and the sustainable development of low-carbon cities.

3.6. Constrained CA Model with Multi-Objective Constraints

According to the above three evaluations and a limitation, we establish four multi-objective constraints from humanism and the low-carbon concept. They are utilized to optimize the transition rules in the constrained CA model. Furthermore, the improved model’s delineation result helps to promote the carbon reduction capacity and quality of life for residents.
The multi-objective constraints for our proposed constrained CA model are expressed as follows:
In terms of residential activity space constraint, it reflects human behavior characteristics affecting urban expansion on the state transition of cells in the constrained CA model. According to the evaluation of residential activity space expansion potential, the probability of the residential activity space constraint is calculated using Equation (2).
P i , j l o c = 1 / 1 + E x p S i , j z
In Equation (2),   P i , j l o c is the probability of residential activity space constraint. S i , j z is the residential activity space expansion potential.
With regards to the human settlements suitability constraint, it is established to reflect the suitability of urban natural environment elements for human-concentrated living. The probability of the human settlements suitability constraint is determined by the result of urban construction suitability evaluation using Equation (3):
P i , j u r b = P i , j U
In Equation (3), P i , j u r b is the probability of the human settlements suitability constraint, and P i , j U is obtained from the normalized result of urban construction suitability evaluation.
Regarding the human settlements ecological constraint, it is important to prioritize the protection of important ecological areas for carbon storage. In the constrained CA model, the probability of the human settlements ecological constraint is computed based on the result of ecological conservation importance evaluation using Equation (4):
P i , j e c o = 1 P i , j A
In Equation (4), P i , j e c o is the probability of the human settlements ecological constraint, and P i , j A is obtained from the normalized result of ecological conservation importance evaluation.
In terms of the human survival materials constraint, it is important to protect farmland and water bodies from being occupied by urbanization. In the constrained CA model, its probability is computed using Equation (5):
P i , j i n s = c o n c i j = s u i t a b l e
In Equation (5), con is a function that determines whether the cell is located within the areas of limitation of human survival materials. If the cell is located within the areas of limitation of human survival materials, P i , j i n s is assigned a value of 0, which means it cannot be converted to an urban area, and if it is located outside the areas of limitation of human survival materials, P i , j i n s is assigned a value of 1, which means it is allowed to be developed as urban land.
For the constrained CA model, the change of cell state is not only related to the above constraints but is also affected by the surrounding-cell state, that is, the neighborhood effect [46], because it helps to enhance the compactness of urban forms [47]. It is calculated by using Equation (6):
P i , j n e i = n × n c o n c i j = u r b a n n × n 1
In Equation (6), n is the neighborhood size, c i j is the cell state, and con is the function that counts the amount of urban land in neighborhoods with a particular size.
Based on the above constraints and neighborhood effect, we propose a comprehensive transition rule. Equation (7) is used to determine the final transition probability of the cell state.
P i , j t = P i , j l o c P i , j u r b P i , j e c o P i , j i n s P i , j n e i
where P i , j t denotes the final transition probability of the cell state, P i , j l o c is the probability of the residential activity space constraint, P i , j u r b is the probability of the human settlements suitability constraint, P i , j e c o is the probability of the human settlements ecological constraint, P i , j i n s is the probability of the human settlements security constraint, and P i , j n e i is the neighborhood effect.
Finally, the constrained CA model is optimized by the comprehensive transition rules and utilized to simulate urban growth.

3.7. UGB Delineation Based on the Dilation and Erosion Algorithm

According to the simulation results in Section 3.6, there are some fragmented patches of the future urban boundary, which is not conducive to the implementation of management policies. UGB delineation requires eliminating these patches and obtaining a continuous urban-land polygon. The common methods in boundary processing include the artificial drawing method, moving window method, ant colony algorithm, dilation and erosion algorithm, etc. Among them, the dilation and erosion algorithm has advantages in edge extraction and image processing, which is beneficial to delineating UGB [48]. Therefore, we utilize it to extract urban boundaries. It involves two basic operations: dilation and erosion. The dilation operation convolves the image X with an arbitrarily shaped kernel (B), which has a defined anchor point, usually a square or a circle. As kernel B is scanned over the image, the maximal pixel value overlapped by B is computed to replace the image pixel in the anchor point position. In contrast to the dilation operation, the erosion operation focuses on the minimal pixel value overlapped by B. In fact, based on them, the opening and closing operations are used for boundary smoothing and interior filling [37]. The opening operation is an erosion operation followed by a dilation operation (Equation (8)), while the closing operation is a dilation operation followed by an erosion operation (Equation (9)). After dealing with the simulation results, the urban boundary is smoother and more suitable for urban managers’ decision making.
X∘B =(X⊖B)⊕B
X∙B =(X⊕B)⊖B

4. Implementations and Results

4.1. Results of the Residential Activity Space Expansion Potential Evaluation

Using the collected multi-source big data, the expansion potential of residents’ activity space in Ningbo is evaluated from three dimensions: resident behavior, economic development, and infrastructure layout, according to the method in Section 2.2.
In the dimension of resident behavior, this paper uses mobile signaling data to analyze Ningbo residents’ behavior such as commuting, consumption, and travel. The data were from Ningbo and were provided by a large telecom operator in China. They covered the records of about 5.3 million subscribers for one month (December, 2019) for this operator. Each record contained information including user location status (daily/monthly residence location, travel information records), user attribute information (gender, age, home, etc.), and so on. By setting different rules, these data are filtered and used to analyze different characteristics of residents’ activities. To be specific, the characteristics of residents’ behavior in Ningbo are estimated from five aspects: commuting, leisure consumption, the jobs–housing space, population distribution, and people flow. (1) In terms of commuting, the average commuting distance to residents’ workplaces is calculated to characterize the attractiveness of jobs. We set 0:00–8:00 and 20:00–24:00 every day as rest periods and set 8:00–20:00 on weekdays as working periods according to the characteristics of residents’ travel behavior in Ningbo. Then, all base stations visited by users in December, 2019 are classified according to the user records of different periods. The location of the base station where the user stays for the longest time during the rest period and stays for more than 16 days is regarded as the user’s residence. The location where the user stays the longest and stays for more than 11 days during the working period is considered the user’s working location. According to the above location, the average commuting distance of the residents’ workplace is calculated by district and county. (Figure 3a). (2) In terms of leisure consumption, the average travel distance for leisure consumption is calculated to reflect the convenience of the residents’ shopping and leisure, and 15:00–19:00 on weekends and holidays is set as the recreation period because of the large population size during this period. The location of the base station where the user stays the longest during the recreation period more than three times is regarded as their recreation place. Then, the average travel distance is calculated for leisure consumption by county and district (Figure 3b). (3) In terms of the jobs–housing space, the job–resident ratio is calculated to judge the balance between work and housing. Based on the identification of the place of residence and employment, the amount of the resident population and the employed population are counted, respectively, by county and district. Then the job–resident ratio is obtained by dividing the amount of employment by the number of residents. (Figure 3c). (4) In terms of population distribution, the actual service population density reflects the level of urban public service management. The actual service population is identified by the population residing in a certain place for more than three days. It is divided by the administration district area to obtain the actual service population density (Figure 3d). (5) In terms of people flow, the total amount of people flow reflects the scale of the city’s hierarchy. The residence place is regarded as the origin of residents’ travel. The districts and counties with the farthest travel distance is regarded as travel destinations. Then, the OD (origin to destination of residents’ travel) volume is counted to calculate the total amount of people flow in each district and county (see Figure 3e).
In the dimension of economic development, the total night-lighting index (TNL) is extracted from the night-lighting data (Figure 4), which is used to measure the economic development characteristics of Ningbo. To be specific, the night-lighting data from the Ningbo area are corrected and noise-reduced, firstly based on the invariant target area method and then the sum of the digital number (DN) of the night-lighting data is calculated, which is just the total night-lighting index (TNL). After obtaining the TNL, the distribution is compared with the economic statistics values from the Ningbo Bureau of Statistics, and it was found that the volume was basically the same as the level of economic development of the region. The higher the TNL value is, the higher the economic development degree is, then the characteristics of Ningbo’s economic development can be reflected from the spatial distribution of the TNL value.
In the dimension of infrastructure layout, the Euclidean distance from pixels in each raster to the nearest POI point is considered to reflect the infrastructure perfection required for residents’ daily activities. Seven types of infrastructure, including bus stations, subway stations, railway stations, medical facilities, schools, commercial facilities, and recreation areas, are collected, and the distance between each raster’s pixels and the above seven types of infrastructure POI is calculated to represent the level of infrastructure layout improvement (Figure 5a–g).
Following completing the calculation of indicators under the three dimensions, their weights need to be assigned. In this study, the analytic hierarchy process (AHP) is utilized to calculate the weights of each indicator. After checking for consistency, the weights that reflect the importance of different indicators are obtained (Table 4). Then the sum of weights and three-dimensional indicators is used to establish the residential activity space constraint. The evaluation results are obtained as shown in Figure 6. It shows that the potential is greatest in the north and smallest in the south of Ningbo. By comparing with the current urban planning scheme of Ningbo government, it is found that the development pattern of Ningbo in our study is generally consistent with previous research results. Specifically, the regions with high potential values in the evaluation results are mainly distributed in Yuyao and Cixi, because the residents’ activities in these regions are relatively rich and the degree of economic development is better. In addition, the areas with the smallest potential are mainly located in Xiangshan, Ninghai, and Fenghua because their urban growth is constrained by ecological land in the south.

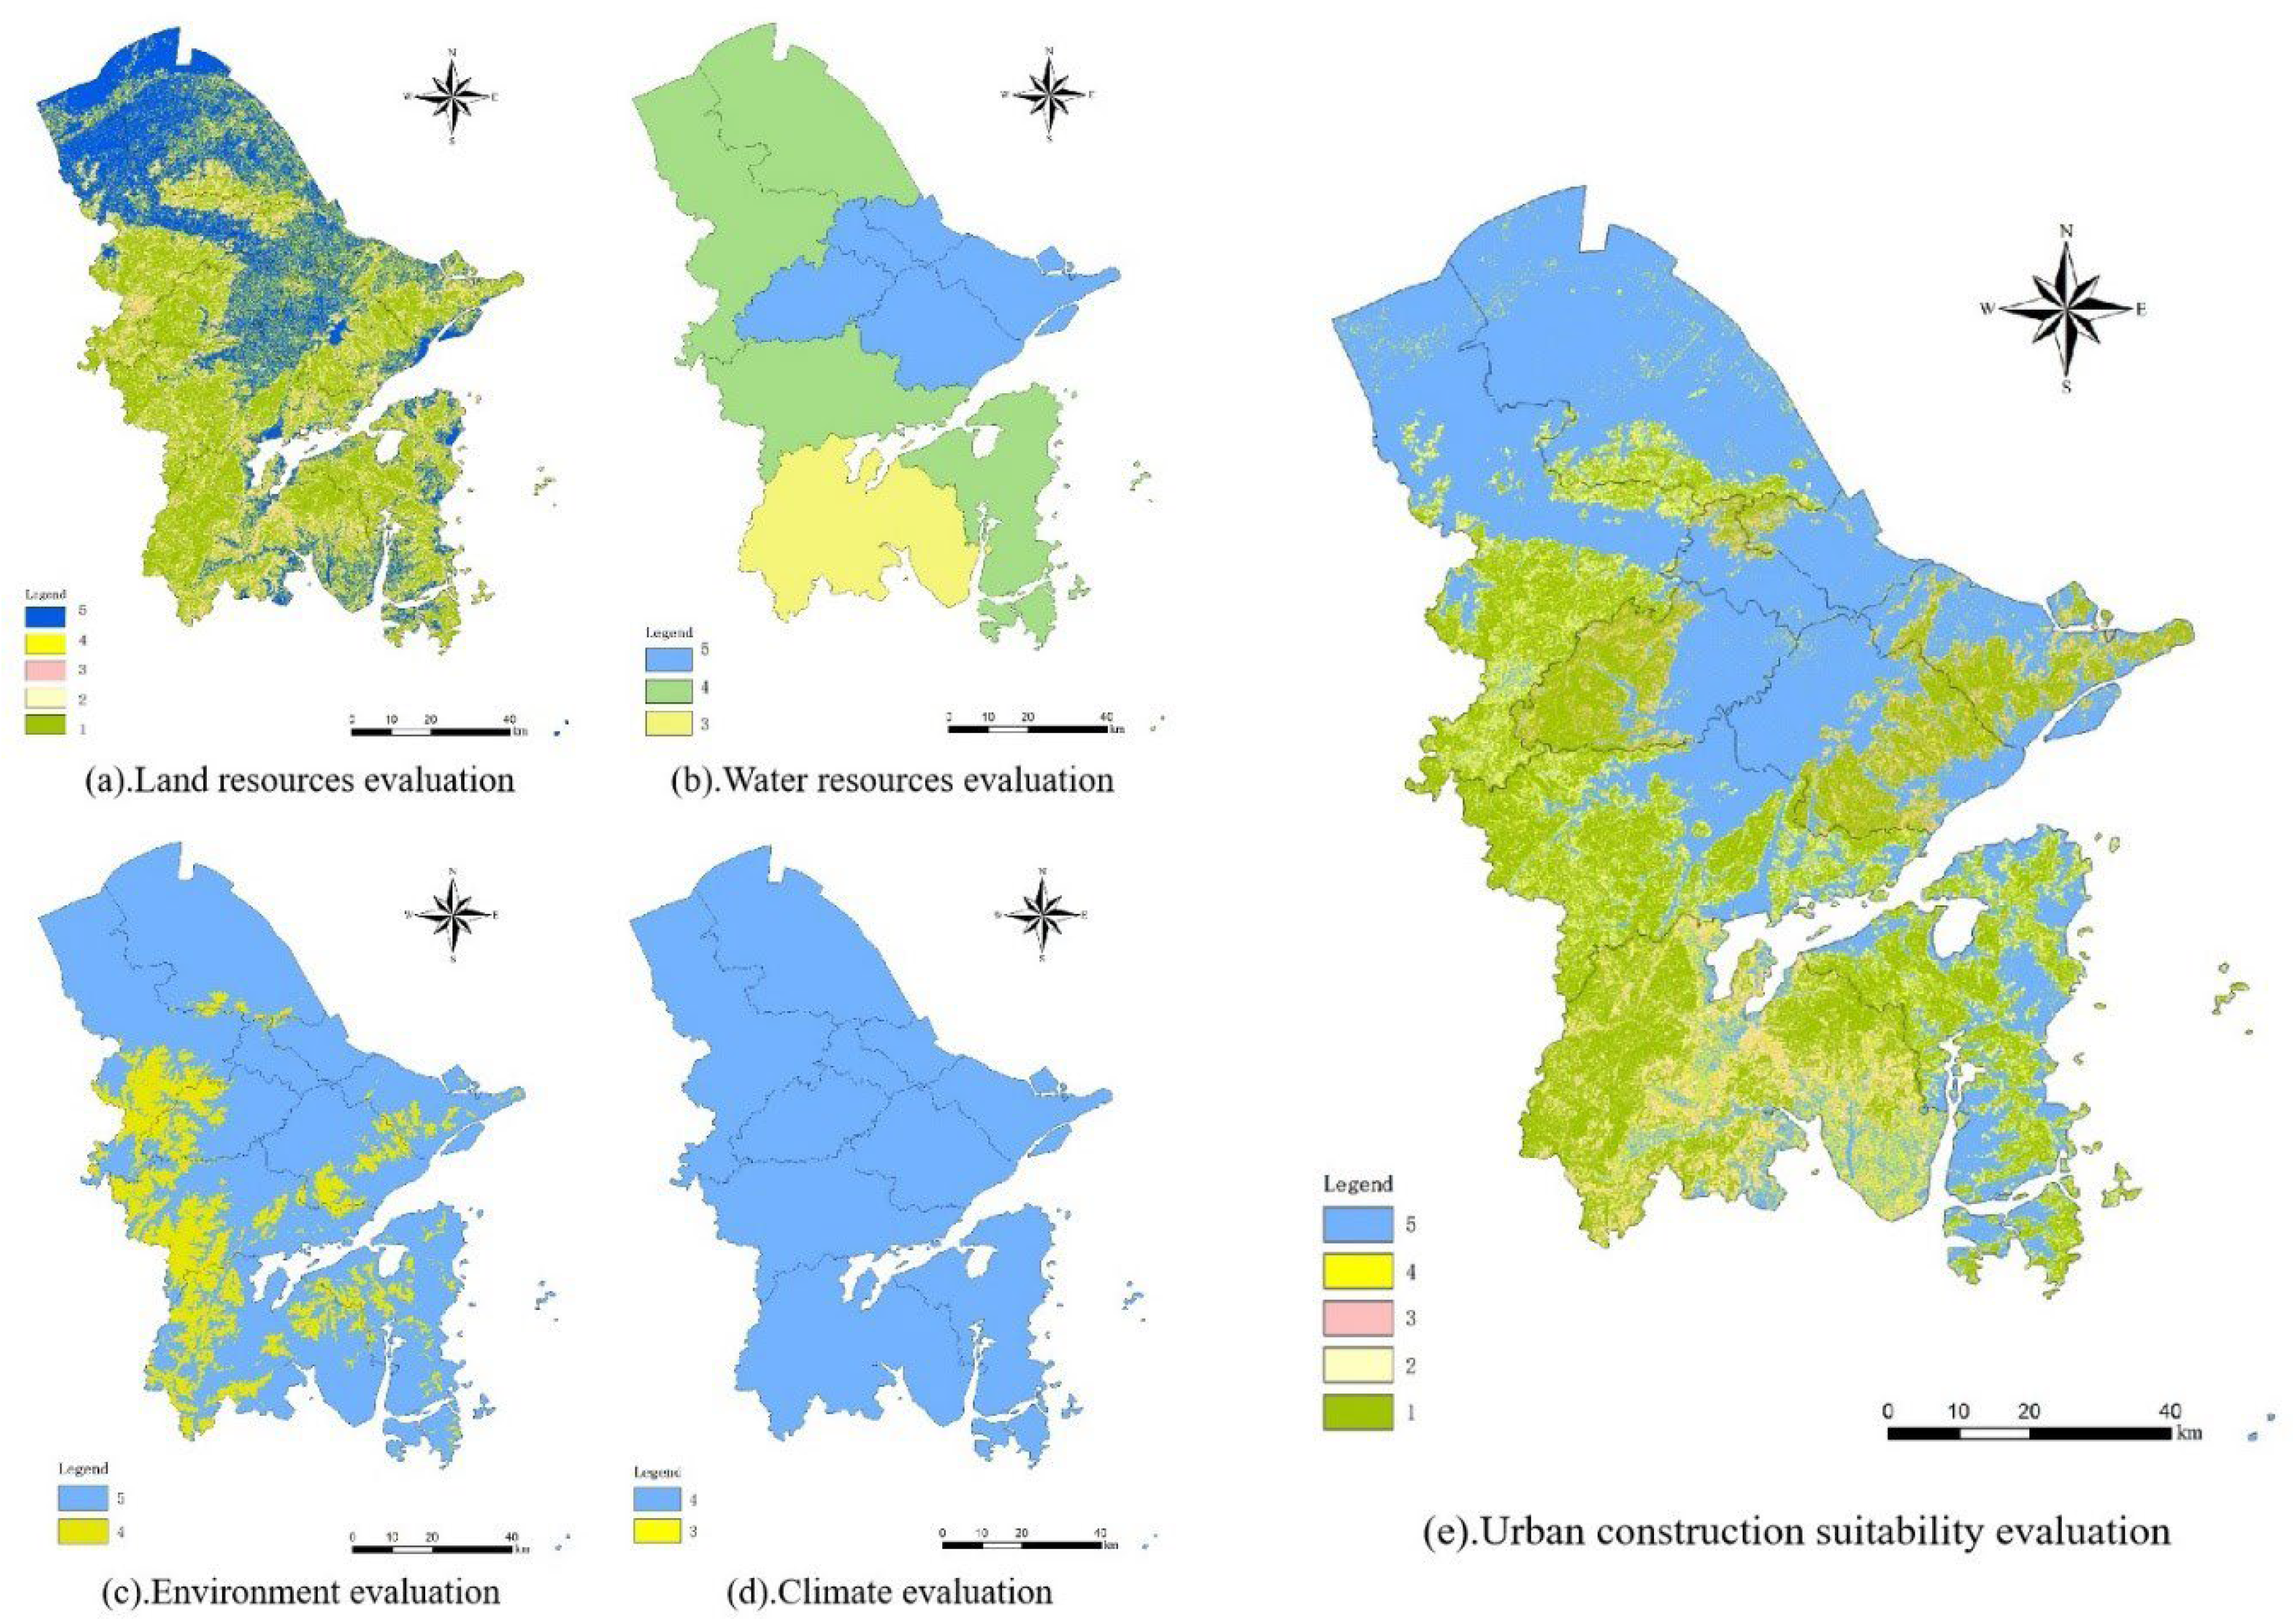
4.2. Results of the Urban Construction Suitability Evaluation

Good natural environmental conditions are important for human settlement livability and urban development. The concept of humanism also emphasizes the suitability of the living environment in urban development. Thus, we evaluate urban construction suitability according to a standard technical guideline [45]. This guideline defines an evaluation method including four sub-evaluations: land resources evaluation, water resources evaluation, environment evaluation, and climate evaluation. The above four sub-evaluations are evaluated respectively from topographic conditions, water supply conditions, climatic comfort, and atmospheric environmental capacity [45]. The calculation of each factor was performed according to the guidelines. As space is limited, the details of the calculations are not described here. Then the results of sub-evaluation (Figure 7a–d) are integrated to obtain the urban construction suitability in Ningbo (Figure 7e), which are used to establish the human settlements suitability constraint in the constrained CA model. As can be seen from Figure 7e, the urban construction suitability is high in the center and north of Ningbo, as well as the coastal areas, which have flat terrain, good water-supply conditions, comfortable and pleasant climate, and the good quality of the atmospheric environment. The area southwest of Ningbo is not suitable for urban construction because of its high topography and ecological importance

4.3. Results of the Ecological Conservation Importance Evaluation

A stable ecosystem and healthy ecological environment, which can expand the space of urban carbon sink, is an important foundation and contributes to green low-carbon development. Therefore, ecologically important areas need to be protected in urban development. To identify priority areas for ecological protection in urban expansion, we evaluate ecosystem service importance and ecological vulnerability in Ningbo according to the standard technical guideline mentioned in Section 4.2. This guideline also defines the methods of the above two evaluations.
The evaluation of ecosystem service importance is based on the results of three sub-evaluations, namely, the evaluation of water-resources retention capacity, the evaluation of soil and water conservation, and the evaluation of biodiversity conservation (Figure 8a–c). Figure 8d shows that ecosystem service importance in the southwest is higher than that in the northeast of Ningbo.
The evaluation of ecological vulnerability is integrated by the results of soil erosion, land desertification, and rock desertification evaluation (Figure 9a–c). After synthesizing the results of the above evaluation, Figure 9d shows that the ecological vulnerability of Ningbo is generally fragile.
Thus, the result of Ningbo ecological conservation importance evaluation (Figure 10) is derived from the combination of the above two evaluations, and the ecological importance level of Ningbo was divided into three grades: very important, important, and generally important. Figure 10 shows that the very important areas are located in the southwest. Most of the important areas were found in Fenghua, Ninghai, and Xiangshan. These areas are important for water connotation and soil conservation, necessitating the limitation of urban construction. The generally important areas are mainly located in Cixi, Yuyao, and the main urban area. There are less ecological constraints on human habitation, and the area can be prioritized for urban construction. The result is consistent with the layout of ecological land in urban planning (Ningbo Urban Master Plan 2006–2020), which proves the ecological conservation importance evaluation result is valid.

4.4. Result of the Limitation of Human Survival Materials

With the high-density development and the growth in urban construction land, urban problems such as farmland loss and water pollution have become increasingly serious. The conversion of these land uses to construction land also increases the city’s carbon emissions. In order to improve environment quality and promote low-carbon development, high-quality farmland and water bodies are protected from urban sprawl. In our study, these farmlands and water bodies are chosen to be free from invasions by urban build-up land; these sites are a human settlements security constraint (Figure 11).

4.5. Simulation Results

Based on above results in Section 4.1, Section 4.2, Section 4.3 and Section 4.4 three constraints and a limitation are obtained, respectively. Using these constraints and limitation, the multi-objective constrained CA model from the perspective of humanism and the low-carbon concept is developed to simulate the urban expansion in Ningbo. As for the model validation, we use the kappa coefficient to assess the relationship between the simulation results compared to the actual situation, and a larger coefficient value indicates that the simulation results are more reliable. For details, we choose the land-use map of Ningbo in 2010 and 2015 to simulate urban boundaries in 2015 and 2020, respectively (Figure 12 and Figure 13), and the kappa value is 0.84 and 0.85 for 2015 and 2020, respectively. Generally, a kappa coefficient between 0.8 and 1 indicates a high degree of consistency between the simulated and real values. Thus, the results of our study show that the model can be used to predict urban growth to the year 2025.

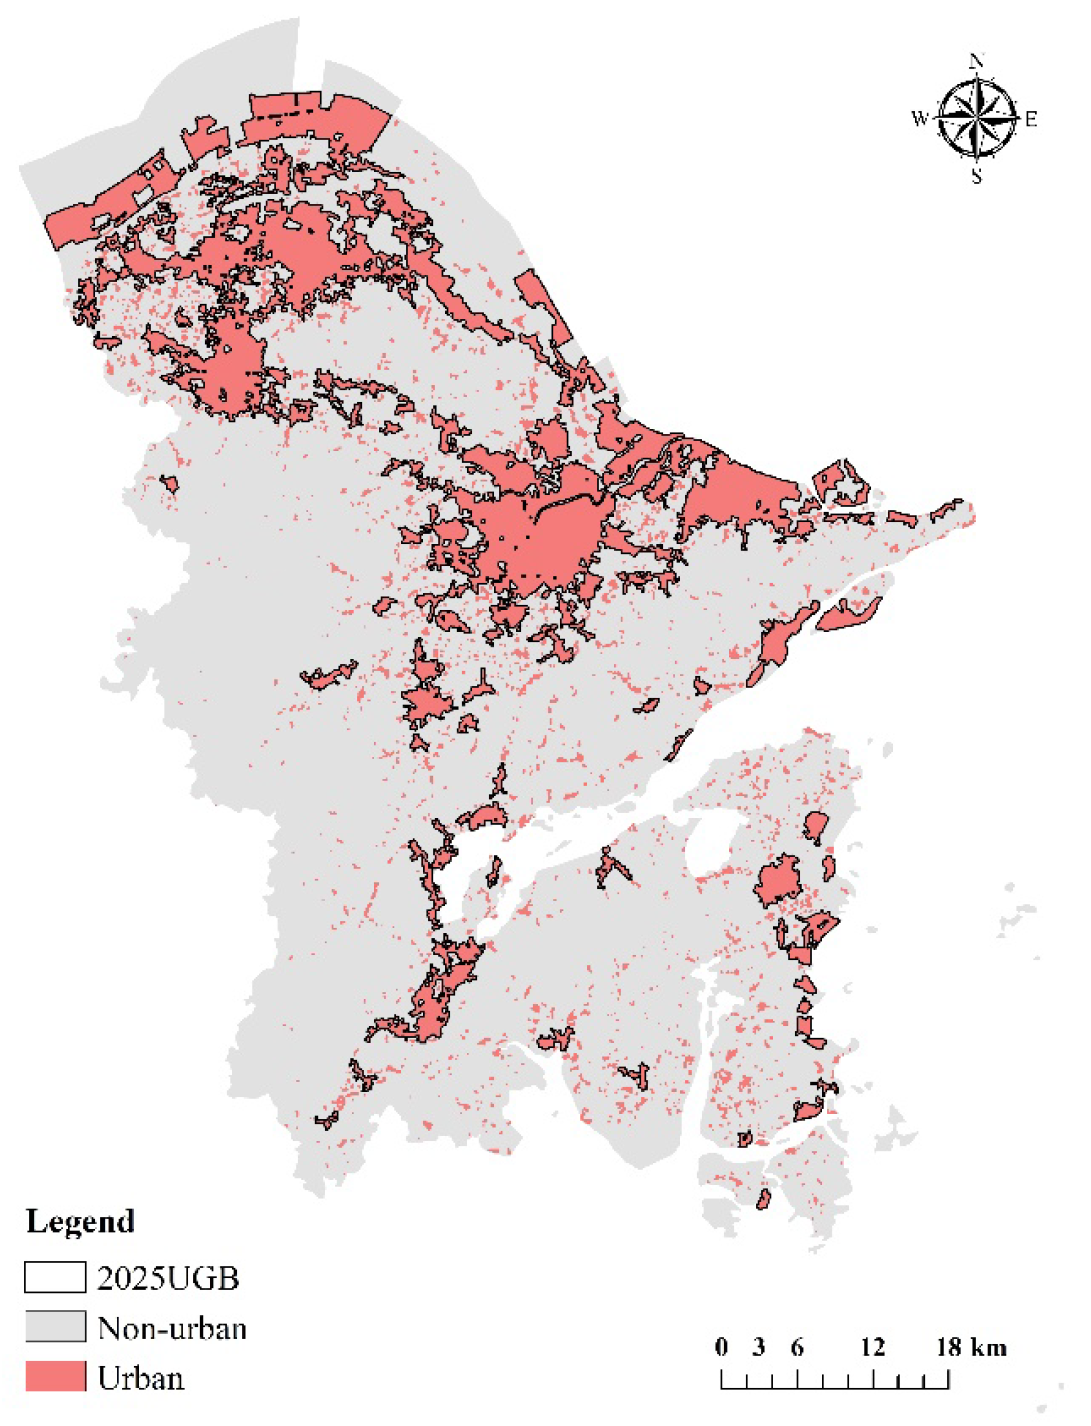
4.6. UGB Delineation

The urban boundary in 2025 obtained from our simulations using the model in Section 4.4 has some fragmented patches that are not conducive to the consolidated management of land. In order to ensure that the UGB is as smooth and continuous as possible, morphological function in the FLUS–UGB module is used to determine the UGB. A 7∗7 window is selected as the structural element for dilation and erosion. Then, the raster format UGB generated by FLUS is converted to vector format using GIS software, and small patches of UGB less than 2 km2 are removed to obtain the final UGB of Ningbo in 2025 (Figure 14).

5. Discussion

5.1. The Necessity of the UGB Delineation Framework from a People-Oriented and Low-Carbon Perspective

UGB delineation is a complex decision-making issue and should consider multiple objectives and constraints. Through reviewing the existing studies, we find that most of the existing studies on UGB delineation are limited to the objective perspectives like economic development and natural conditions, and few of them consider human perspective constraints. However, people are the center of urban development, and the people-oriented perspective is an indispensable core concept of urban development. The delineation of UGB should definitely consider multiple constraints such as humanism and low-carbon development. Further, in order to verify the necessity of these multi-objective constraints, we compare urban boundary simulation in 2020 with and without multi-objective constraints. Figure 15 shows that urban growth without multi-objective constraints leads to the encroachment on water bodies (see Figure 15a), such as the Yuyao River, Fenghua River, Yong River, etc., as well as agricultural land (see Figure 15b) and forested land (see Figure 15c). In contrast, urban expansion based on multi-objective constraints avoids water bodies and effectively protects ecological and agricultural land, which is helpful for carbon emission reduction. Figure 16 shows that there is a leap-type cluster in the north due to the increase in residents’ activities, which is consistent with the actual construction of Qianwan New District. The comparison results show that the multi-objective constraint from a people-oriented and low-carbon perspective is necessary and that the proposed framework is more comprehensive.

5.2. Comparison in UGBs Delineation with and without Big Data

Most previous studies on urban sprawl simulations have utilized traditional data, which are limited by the problem of an insufficiently fine scale and can only reflect the human activities at large scale but cannot finely characterize human activities at small scale. This makes it difficult for the simulation results to reflect the real situation. The emergence of big data, such as cell phone signaling, has provided a solution to this problem. Therefore, we innovatively use multi-source big data from three perspectives to demonstrate human activities and introduce it into the CA model. Among them, mobile phone signaling big data is used to measure the characteristics of residents’ behavior activities, night-light remote-sensing big data is used to measure the level of urban economic development, and POI big data is used to measure the layout of urban infrastructure. These big data, especially mobile signaling data, provide information on the impact of human behavior on urban expansion. In order to verify the necessity and feasibility of residential activity space constraints based on multi-source big data, this study compared the delineation results of UGBs obtained with and without the use of multi-source big data for residential activity space constraints under the same other two constraints and one limitation. The result shows that the delineated UGB based on multi-source big data is roughly consistent with the current situation of urban land in Ningbo in 2020. The Kappa value of urban extension simulation results considering residential activity space constraint is 0.855, while, without the residential activity space constraint, it is 0.831. The results show that the framework based on multi-source big data has higher accuracy and better performance in urban expansion simulation. The findings also show that big data provide an important data basis for refined urban land simulation. In addition, the international community has promoted the application of multi-source big data in territorial spatial planning [49,50], which also shows that multi-source big data has a high potential for application in spatial planning in the future.

6. Conclusions

The existing UGB delineation methods are limited by the lack of data granularity, and most of them can only simulate urban development based on the perspectives of economic development and natural resources, lacking consideration for human activities. To this end, we propose a new framework for the delineation of UGBs. This framework integrates the concepts of humanism and low-carbon development and sets constraints, including the potential of human activities, natural resource background, ecological environment protection, and subsistence conditions, to comprehensively consider the influence of human activities in low-carbon urban development. In terms of model construction, this framework utilizes a constrained CA model supported by multiple sources of big data. The CA model takes the patch change as the base unit of urban development simulation and uses the results of three evaluations and one limitation as constraints to simulate urban development. In particular, the support of big data makes it possible to calculate the expansion potential of human activities, and high fine-scale multi-source big data, such as mobile phone signaling data, also provide the possibility of a solution to the better evaluation of human activities. That makes the simulation results more accurate and reliable. The application of our proposed UGB delineation framework in a rapidly growing city in China demonstrates the applicability and reliability of this framework. Considering multi-objective constraints and big data support, the framework is also applicable in other cities.
However, our study still has some limitations. The range of mobile phone signaling data used in the case study only includes December 2019, which may not fully reflect the characteristic patterns of residents’ behaviors. In future studies, the data will be analyzed with a longer time series to obtain a more objective and comprehensive characteristic pattern. Meanwhile, this paper only discusses low-carbon development in terms of the evaluation of ecological conservation importance and the limitation of human survival materials constraints, and in the future, we will add quantitative measurements to make our framework more detailed.

Author Contributions

Conceptualization, Y.Y. and W.M.; methodology, Y.Y.; software, C.Z. and W.M.; validation, C.Z., Y.X. and X.G.; formal analysis, C.Z. and W.M.; investigation, C.Z.; data curation, Y.X. and X.G.; writing—original draft preparation, W.M.; writing—review and editing, Y.Y. and C.Z.; visualization, Y.X. and X.G. All authors have read and agreed to the published version of the manuscript.

Funding

This research was funded by National Natural Science Foundation of China (42171260, 52079101).

Conflicts of Interest

The authors declare no conflict of interest.

References

  1. Wang, W.; Jiao, L.; Zhang, W.; Jia, Q.; Su, F.; Xu, G.; Ma, S. Delineating urban growth boundaries under multi-objective and constraints. Sustain. Cities Soc. 2020, 61, 102279. [Google Scholar] [CrossRef]
  2. Hoekstra, A.Y.; Wiedmann, T.O. Humanity’s unsustainable environmental footprint. Science 2014, 344, 1114–1117. [Google Scholar] [CrossRef] [PubMed]
  3. Long, Y.; Han, H.; Lai, S.-K.; Mao, Q. Urban growth boundaries of the Beijing metropolitan area: Comparison of simulation and artwork. Cities 2013, 31, 337–348. [Google Scholar] [CrossRef]
  4. Wu, X.; Liu, X.P.; Liang, X.; Chen, G. Multi-scenarios simulation of urban growth boundaries in Pearl River Delta based on FLUS-UGB. J. Geo-Inf. Sci. 2018, 20, 532–542. [Google Scholar] [CrossRef]
  5. Yu, Y.; Han, Q.; Tang, W.; Yuan, Y.; Tong, Y. Exploration of the Industrial Spatial Linkages in Urban Agglomerations: A Case of Urban Agglomeration in the Middle Reaches of the Yangtze River, China. Sustainability 2018, 10, 1469. [Google Scholar] [CrossRef] [Green Version]
  6. Tayyebi, A.; Pijanowski, B.C.; Tayyebi, A.H. An urban growth boundary model using neural networks, GIS and radial parameterization: An application to Tehran, Iran. Landscape Urban Plan. 2011, 100, 35–44. [Google Scholar] [CrossRef]
  7. Ball, M.; Cigdem, M.; Taylor, E.; Wood, G. Urban growth boundaries and their impact on land prices. Environ. Plan. 2014, 46, 3010–3026. [Google Scholar] [CrossRef] [Green Version]
  8. He, X.; Mai, X.; Shen, G. Delineation of Urban Growth Boundaries with SD and CLUE-s Models under Multi-Scenarios in Chengdu Metropolitan Area. Sustainability 2019, 11, 5919. [Google Scholar] [CrossRef] [Green Version]
  9. Gerrit, K.; Arthur, N. The Regulated Landscape: Lessons on State Land Use Planning from Oregon; Lincoln Institute of Land Policy: Cambrige, MA, USA, 1992. [Google Scholar]
  10. He, Q.; Tan, R.; Gao, Y.; Zhang, M.; Xie, P.; Liu, Y. Modeling urban growth boundary based on the evaluation of the extension potential: A case study of Wuhan city in China. Habitat Int. 2018, 72, 57–65. [Google Scholar] [CrossRef]
  11. Jun, M. The effects of portland’s urban growth boundary on urban development patterns and commuting. Urban Stud. 2004, 41, 1333–1348. [Google Scholar] [CrossRef]
  12. Ma, S.; Zhao, Y.; Tan, X. Exploring Smart Growth Boundaries of Urban Agglomeration with Land Use Spatial Optimization: A Case Study of Changsha-Zhuzhou-Xiangtan City Group, China. Chin. Geogr. Sci. 2020, 30, 665–676. [Google Scholar] [CrossRef]
  13. Wang, J.; Fang, C. Growth of Urban Construction Land: Progress and Prospect. Prog. Geogr. 2011, 30, 1440–1448. [Google Scholar]
  14. Zhang, J. Urban Growth Management in the United States. Urban Plan. Overseas 2002, 2, 37–40. (In Chinese) [Google Scholar]
  15. Ma, S.; Li, X.; Cai, Y. Delimiting the urban growth boundaries with a modified ant colony optimization model. Comput. Environ. Urban Syst. 2017, 62, 146–155. [Google Scholar] [CrossRef]
  16. China’s State Council. Several Opinions on Establishing Territorial Spatial Planning System and Supervising for Implementation. (In Chinese). Available online: http://www.gov.cn/zhengce/2019-05/23/content_5394187.htm (accessed on 23 May 2019).
  17. Li, Y.H. Method of determining urban growth boundary from the view of ecology: A case study of Hangzhou. City Plan. Rev. 2011, 35, 83–90. (In Chinese) [Google Scholar]
  18. Wang, Y.; Gu, C.; Li, X. Research progress of urban growth boundary at home and abroad. Urban Plan. Int. 2014, 29, 1–11. [Google Scholar]
  19. Tan, R.; Liu, Y.; Liu, Y.; He, Q. A literature review of urban growth boundary: Theory, modeling, and effectiveness evaluation. Prog. Geogr. 2020, 39, 327–338. [Google Scholar] [CrossRef]
  20. Feng-Ming, X.I.; Yuan-Man, H.U.; Hong-Shi, H.E.; Tie-Mao, S.H.I.; Ren-Cang, B.U.; Xiao-Qing, W.U.; Jing-Hai, Z.H.U. Urban planning based on SLEUTH model in Shenyang-Fushun metropolitan area. J. Grad. Sch. Chin. Acad. Sci. 2009, 26, 765–774. (In Chinese) [Google Scholar]
  21. Long, Y.; Shen, Z.; Mao, Q. Retrieving spatial policy parameters from alter-native plans using constrained cellular automata and regionalized sensitivity analysis. Environ. Plan. B Plan. Des. 2012, 39, 586–604. [Google Scholar] [CrossRef] [Green Version]
  22. Alghais, N.; Pullar, D. Modelling future impacts of urban development in Kuwait with the use of ABM and GIS. Trans. GIS 2018, 22, 20–42. [Google Scholar] [CrossRef]
  23. Ying, L.; Jin, X.; Yang, X.; Zhou, Y. Reconstruction of historical arable land use patterns using constrained cellular automata: A case study of Jiangsu, China. Appl. Geogr. 2014, 52, 67–77. [Google Scholar]
  24. Wu, H.; Li, Z.; Clarke, K.; Shi, W.; Fang, L.; Lin, A.; Zhou, J. Examining the sensitivity of spatial scale in cellular automata Markov chain simulation of land use change. Int. J. Geogr. Inf. Sci. 2019, 33, 1040–1061. [Google Scholar] [CrossRef] [Green Version]
  25. Long, Y.; Han, H.; Mao, Q. Establishing urban growth boundaries using constrained CA. Acta Geogr. Sin. 2009, 64, 999–1008, (In Chinese with English Abstract). [Google Scholar]
  26. Ma, S.; Ai, B.; Nian, P. Pre-assessment and Warning of Land Use Planning with Constrained Cellular Automata. Geogr. Geo-Inf. Sci. 2014, 30, 51–55+2. (In Chinese) [Google Scholar]
  27. Sun, Z.; Deal, B.; Pallathucheril, V.G. The land-use evolution and impact assessment model: A comprehensive urban planning support system. Urisa J. 2009, 21, 57–68. [Google Scholar]
  28. Liu, X.; Li, X.; Ai, B.; Tao, H.; Wu, S.; Liu, T. Multi- agent systems for simulating and planning landuse development. Acta Geogr. Sin. 2006, 61, 1101–1112. [Google Scholar]
  29. Qin, X.; Zhen, F.; Li, Y. Discussion on the application framework of big data in territorial spatial planning. J. Nat. Resour. 2019, 34, 2134–2149. (In Chinese) [Google Scholar] [CrossRef]
  30. Kong, Y.; Zhen, F.; Zhang, S. Evaluation on High-quality Utilization of Territorial Space Based on Multi-source Data. China Land Sci. 2020, 34, 115–124. (In Chinese) [Google Scholar]
  31. Krings, G.; Calabrese, F.; Ratti, C.; Blondel, V.D. Urban Gravity: A Model for Intercity Telecommunication Flows. J. Stat. Mech. Theory Exp. 2009, 2009, L07003. [Google Scholar] [CrossRef] [Green Version]
  32. Gong, L.; Jin, M.; Liu, Q.; Gong, Y.; Liu, Y. Identifying urban residents activity space at multiple geographic scales using mobile phone data. Int. J. Geo-Inf. 2020, 9, 241. [Google Scholar] [CrossRef]
  33. Zhang, Q.; Hu, Y.; Liu, J. Identification of Urban Clusters in China Based on Assessment of Transportation Accessibility and Socio-Economic Indicators. Acta Geogr. Sin. 2011, 66, 761–770. [Google Scholar]
  34. He, Q.; He, W.; Song, Y.; Wu, J.; Yin, C.; Mou, Y. The impact of urban growth patterns on urban vitality in newly built-up areas based on an association rules analysis using geographical ‘big data’. Land Use Policy 2018, 78, 726–738. [Google Scholar] [CrossRef]
  35. Chen, L.; Qin, J.; Xu, L. Urban growth boundary: A revolution for low-carbon development. Environ. Sci. Pollut. Res. Int. 2022. [CrossRef]
  36. National Bureau of Statistics (NBS). Available online: http://www.stats.gov.cn/ (accessed on 3 December 2020).
  37. Liang, X.; Liu, X.; Li, X.; Chen, Y.; Tian, H.; Yao, Y. Delineating multi-scenario urban growth boundaries with a CA-based FLUS model and morphological method. Landsc. Urban Plan. 2018, 177, 47–63. [Google Scholar] [CrossRef]
  38. Tu, W.; Cao, J.; Gao, Q.; Cao, R.; Fang, Z.; Yue, Y.; Li, Q. Sensing Urban Dynamics by Fusing Multi⁃sourced Spatiotemporal Big Data. Geomat. Inf. Sci. Wuhan Univ. 2020, 45, 1875–1883. (In Chinese) [Google Scholar]
  39. Mei, M.; Chen, Z. Study on the Delineation Method of Urban Growth Boundary under the Coordination of Residential Activity Space and Ecological Constraint: A Case Study of Changsha, China. Resour. Environ. Yangtze Basin. 2018, 27, 2472–2480. [Google Scholar]
  40. Xu, K.; Chen, F. The Truth of China Economic Growth: Evidence from Global Night-time Light Data. Econ. Res. J. 2015, 50, 17–29+57. [Google Scholar]
  41. Zhou, C.; Zhang, R.; Jin, W. Urban Growth Boundary Delineation Oriented by Comprehensive Service level of Infrastructure: A case study of Guangzhou. Geogr. Geo-Inf. Sci. 2017, 33, 42–49. (In Chinese) [Google Scholar]
  42. Wang, H.; Huang, J.; Zhou, H.; Deng, C.; Fang, C. Analysis of sustainable utilization of water resources based on the improved water resources ecological footprint model: A case study of Hubei Province, China. J. Environ. Manag. 2020, 262, 110331. [Google Scholar] [CrossRef]
  43. Hao, Q.; Shan, J.; Deng, L. Evaluation on Natural Suitability of Human Settlement in the Context of Territorial Space Planning. China Land Sci. 2020, 34, 86–93. [Google Scholar]
  44. Ministry Of Natural Resources of the People’s Republic of China. Technical Guide for the Evaluation of Resource and Environment Carrying Capacity and Territory Spatial Development Suitability (In Chinese). 2019. Available online: http://gui-hua.com/post/33.html (accessed on 19 January 2020).
  45. Guidelines for Evaluation of Resource and Environment Carrying Capacity and Suitability of Territorial Spatial Development (for Trial Implementation); Ministry of Natural Resources of the People’s Republic of China: Beijing, China, 2019.
  46. Long, Y.; Mao, Q.; Shen, Z.; Du, L.; Gao, Z. Comprehensive Constrained CA urban model: Instructional Constraints and Urban Growth Simulation. Urban Plan. Forum 2008, 6, 83–91. [Google Scholar]
  47. Xia, C.; Wang, H.; Zhang, A.; Deng, Y. Multi-scenario simulation and policyanalysis of urban space under the effects of coupling and control ling. Hum. Geogr. 2017, 32, 68–76. [Google Scholar]
  48. Dai, Q.Y.; Yu, Y.L. The advances of mathematical morphology in imageprocessing. Control Theory Appl. 2001, 18, 478–482. [Google Scholar]
  49. Zeng, L.; Yu, W.; Cui, Y.; Liu, J. Innovative Method of Urban Planning Based on Intelligent City. In Proceedings of the 2021 International Conference on Intelligent Transportation, Big Data & Smart City (ICITBS), Xi’an, China, 27–28 March 2021. [Google Scholar]
  50. Luo, J. Exploring the Rational Management and Control Model of Land Development Intensity in the Era of Big Data. In Proceedings of the 2nd International Symposium on Economics, Management, and Sustainable Development (EMSD 2021), Hangzhou, China, 27–28 November 2021; Available online: https://bcpublication.org/index.php/BM/article/view/227 (accessed on 10 October 2022).
Figure 1. Location of the study area.
Sustainability 14 16100 g001
Figure 2. The framework of UGBs delineation.
Sustainability 14 16100 g002
Figure 3. The results of resident behavior analysis. (a) shows the result of commuting distance calculations; (b) shows the result of leisure consumption calculations; (c) shows the result of the job–resident ratio calculations; (d) shows the result of the actual service population density calculations; (e) shows the result of people flow calculations.
Sustainability 14 16100 g003
Figure 4. The total night-lighting index of Ningbo.
Sustainability 14 16100 g004
Figure 5. Distance to different POI. (a) shows the distance to bus stations; (b) shows the distance to subway stations; (c) shows the distance to railway stations; (d) shows the distance to medical facilities; (e) shows the distance to schools; (f) shows the distance to commercial facilities; (g) shows the distance to recreation areas.
Sustainability 14 16100 g005
Figure 6. The results of the evaluation of the potential for the expansion of residential activity space.
Sustainability 14 16100 g006
Figure 7. The results of urban construction suitability evaluation. (a) shows the result of land resources evaluation; (b) shows the result of water resources evaluation; (c) shows the result of environment evaluation; (d) shows the result of climate evaluation; (e) shows the result of urban construction suitability evaluation.
Sustainability 14 16100 g007
Figure 8. The results of the evaluation of ecosystem service importance. (a) shows the result of water-resources retention capacity evaluation; (b) shows the result of soil and water conservation evaluation; (c) shows the result of biodiversity conservation evaluation; (d) shows the result of ecosystem service importance evaluation.
Sustainability 14 16100 g008
Figure 9. The results of ecological vulnerability evaluation. (a) shows the result of soil erosion vulnerability evaluation; (b) shows the result of land desertification vulnerability evaluation; (c) shows the result of rock desertification vulnerability evaluation; (d) shows the result of ecological vulnerability evaluation.
Sustainability 14 16100 g009
Figure 10. The results of ecological conservation importance evaluation.
Sustainability 14 16100 g010
Figure 11. The areas of limitation of human survival materials.
Sustainability 14 16100 g011
Figure 12. Simulated urban land and actual urban land in 2015. (a) shows simulated urban land; (b) shows actual urban land (data source from http://data.ess.tsinghua.edu.cn/ accessed on 15 January 2021).
Sustainability 14 16100 g012
Figure 13. Simulated urban land and actual urban land in 2020. (a) shows simulated urban land; (b) shows actual urban land (data source from http://www.globallandcover.com/ accessed on 15 January 2021).
Sustainability 14 16100 g013
Figure 14. Urban growth boundary of Ningbo in 2025.
Sustainability 14 16100 g014
Figure 15. Simulated urban lands without constraints in 2020. (a) shows that multi-objective constraints leads to encroachment on water bodies; (b) shows that multi-objective constraints leads to encroachment on agricultural land; (c) shows that multi-objective constraints leads to encroachment on forested land.
Sustainability 14 16100 g015
Figure 16. Simulated urban lands with multi-objective constraints in 2020.
Sustainability 14 16100 g016
Table 1. Data types and sources.
Data TypesData Sources
Administrative boundaries https://www.webmap.cn/ (accessed on 5 July 2020)
Land-use datahttp://www.globallandcover.com/ (accessed on 5 July 2020)
Constraint factor dataResidential activity space constraint factor Mobile signaling datahttp://www.smartsteps.com/ (accessed on 2 August 2020)
Point of interest (POI)https://lbs.amap.com/api (accessed on 5 July 2020)
Night light datahttps://www.noaa.gov/ (accessed on 8 July 2020)
Human settlement suitability constraint factor Digital elevation model (DEM)http://www.gscloud.cn/ (accessed on 1 July 2020)
Total water consumption control indexNingbo Water Conservancy Bureau
Meteorological data (including temperature, precipitation, wind speed, air relative humidity)http://data.cma.cn/ (accessed on 11 May 2020)
River and lake datahttps://www.webmap.cn/ (accessed on 11 May 2020)
Road data
Residential data
Human settlement ecological constraint factorEcosystem typeshttp://www.ecosystem.csdb.cn/ (accessed on 11 May 2020)
Species distribution datahttps://www.gbif.org/ (accessed on 14 May 2020)
Normalized difference vegetation index (NDVI)https://www.resdc.cn/ (accessed on 14 May 2020)
Soil attribute datahttp://www.fao.org/soils-portal/soil-survey/soil-maps-and-databases/harmonized-world-soil-database-v12/en/ (accessed on 14 May 2020)
Evaporation (ET)http://www.geodoi.ac.cn/WebCn/Default.aspx (accessed on 20 May 2020)
Human settlements security constraint factor Permanent basic farmland dataNingbo natural resources and Planning Bureau
Table 2. Resident activity spatial potential evaluation system based on multi-source big data.
CategoryIndicator NameData
Resident behaviorCommutingAverage commuting distance to residents’ workplacesPhone signaling data
Leisure consumptionAverage travel distance for leisure consumption
Jobs-–housing spaceJob-–resident ratio
Population distributionActual service population density
People flowThe total number of people flow
Economic developmentThe total nighttime lighting indexNight time Nighttime-lighting data
Infrastructure layoutTransportationDistance to bus stopPOI
Distance to station
Distance to station
MedicalDistance to hospitals, clinics
EducationDistance to schools, colleges, and universities
Commercial ServicesservicesDistance to the commercial center, and office buildings
Recreation facilitiesDistance to recreational facilities
Table 3. Indicator system for evaluating the importance of ecological protection.
Evaluation Content
Ecosystem service importanceWater conservation
Soil and water conservation
Biodiversity conservation
Ecological vulnerabilitySoil erosion
Land desertification
Rock desertification
Table 4. The weight of each indicator.
CategoryIndicator NameWeight
Resident behaviorCommutingAverage commuting distance to residents’ workplaces0.0667
Leisure consumptionAverage travel distance for leisure consumption0.0667
Jobs–housing spaceJob–resident ratio0.0667
Population distributionActual service population density0.2
People flowThe total number of people flow0.2
Economic developmentThe total nighttime-lighting index0.2
Infrastructure layoutTransportationDistance to bus stop0.0286
Distance to station0.0286
MedicalDistance to hospitals, clinics0.0286
EducationDistance to schools, colleges, and universities0.0286
Commercial servicesDistance to commercial center and office buildings0.0286
Recreation facilitiesDistance to recreational facilities0.0286
Publisher’s Note: MDPI stays neutral with regard to jurisdictional claims in published maps and institutional affiliations.

