
Effectiveness of Road Cool Pavements, Greenery, and Canopies to Reduce the Urban Heat Island Effects


Abstract
:1. Introduction
- light and permeable road pavements to improve the heat transmission between air and buildings;
- greenery and trees to realize urban green infrastructures (UGIs);
- sustainable transport and mobility to reduce the negative effects s private vehicles or conventional transport;
- evapotranspiration to decrease the heating of the local urban atmosphere;
- urban ventilation to improve the heat exchange.
2. Materials and Methods
- Stone pavers (e.g., limestone, basalt, and porphyry) are used in urban areas because of their aesthetic value. The blocks allow different layouts of the surfaces [33].
- Case 1.x focuses on the sidewalk’s pavements; x ranges between 1 and 3, varying the sidewalk material;
- Case 2.x focuses on all the road pavements; x ranges between 1 and 3, varying the pavement material;
- Case 3.x focuses on all the road pavements and adds green furniture or photovoltaic panels to the area; x ranges between 1 and 4, varying the layout.
3. Results
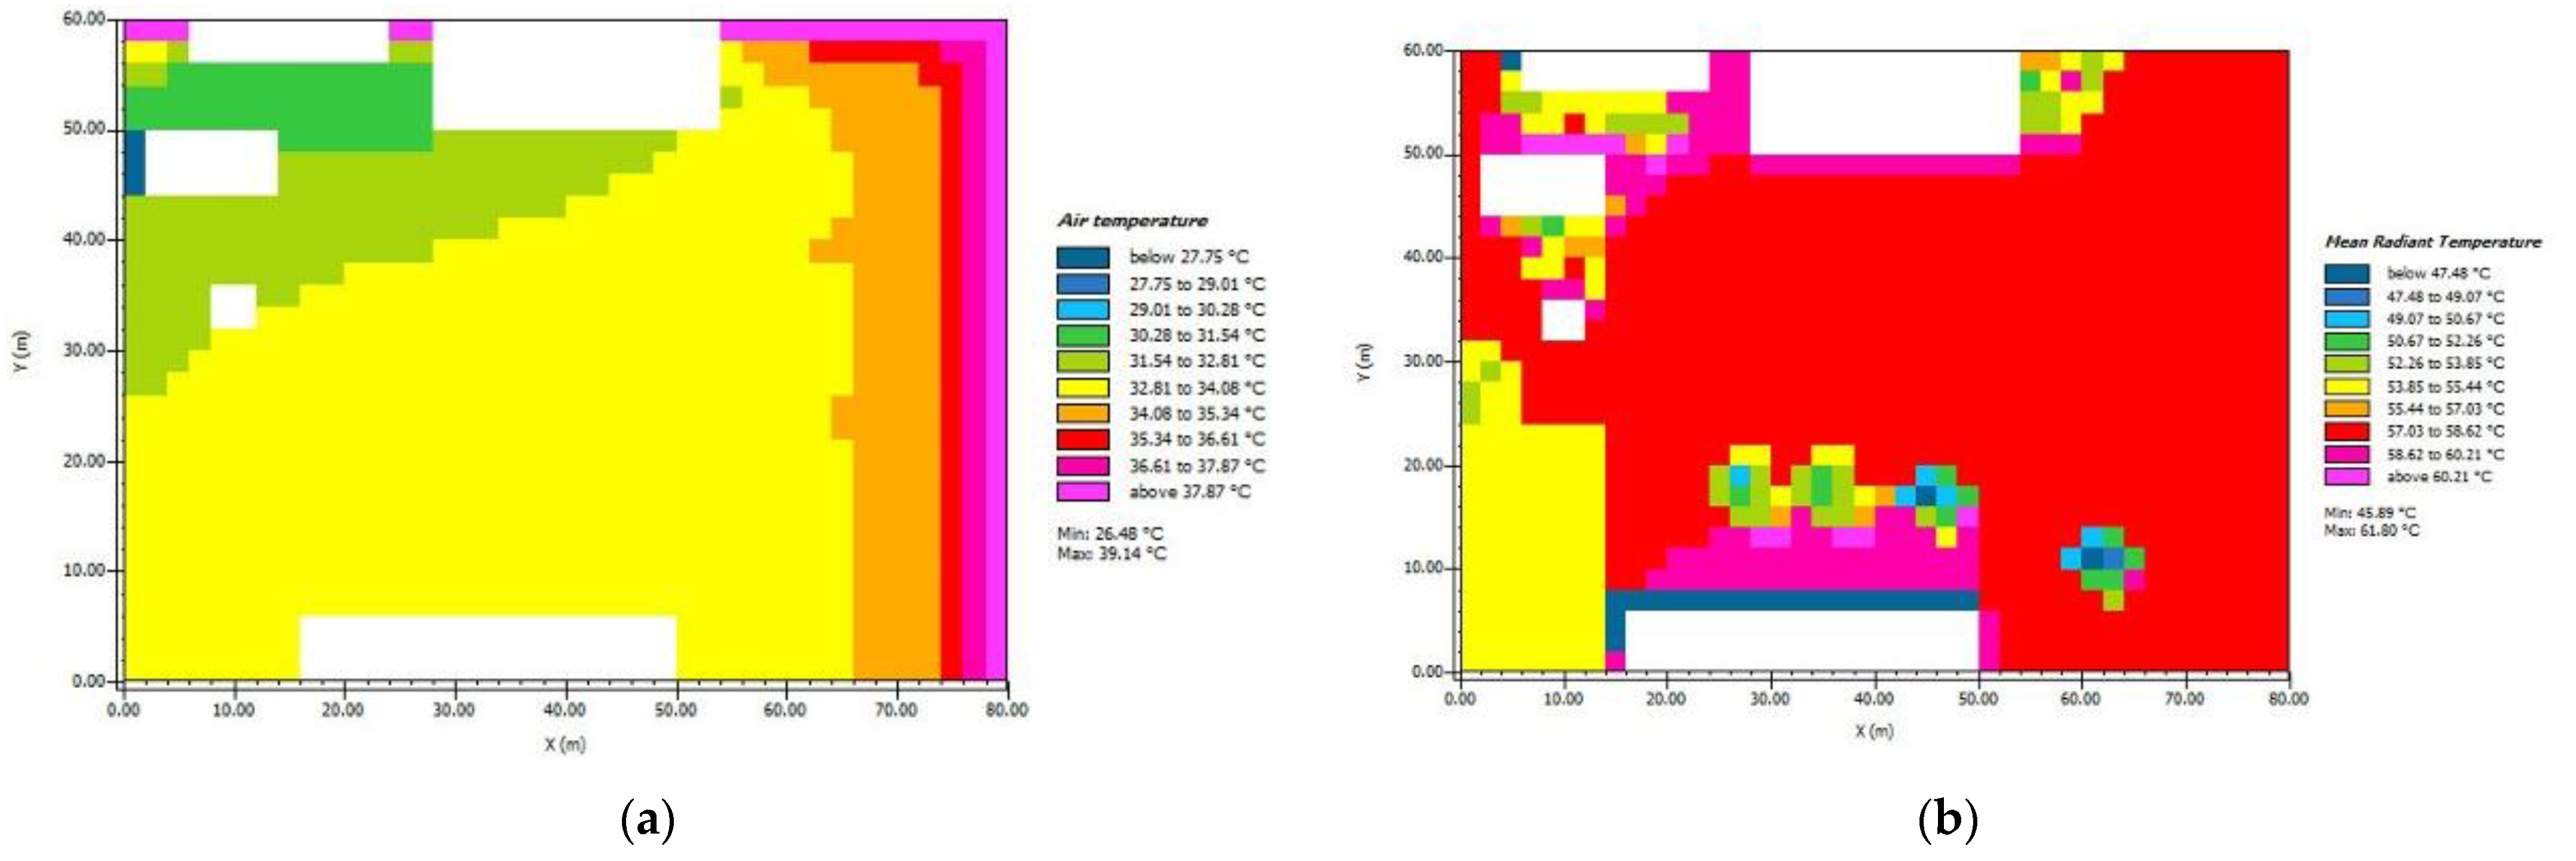
3.1. Current Scenario (S0)
3.2. Case 1.x
3.3. Case 2.x
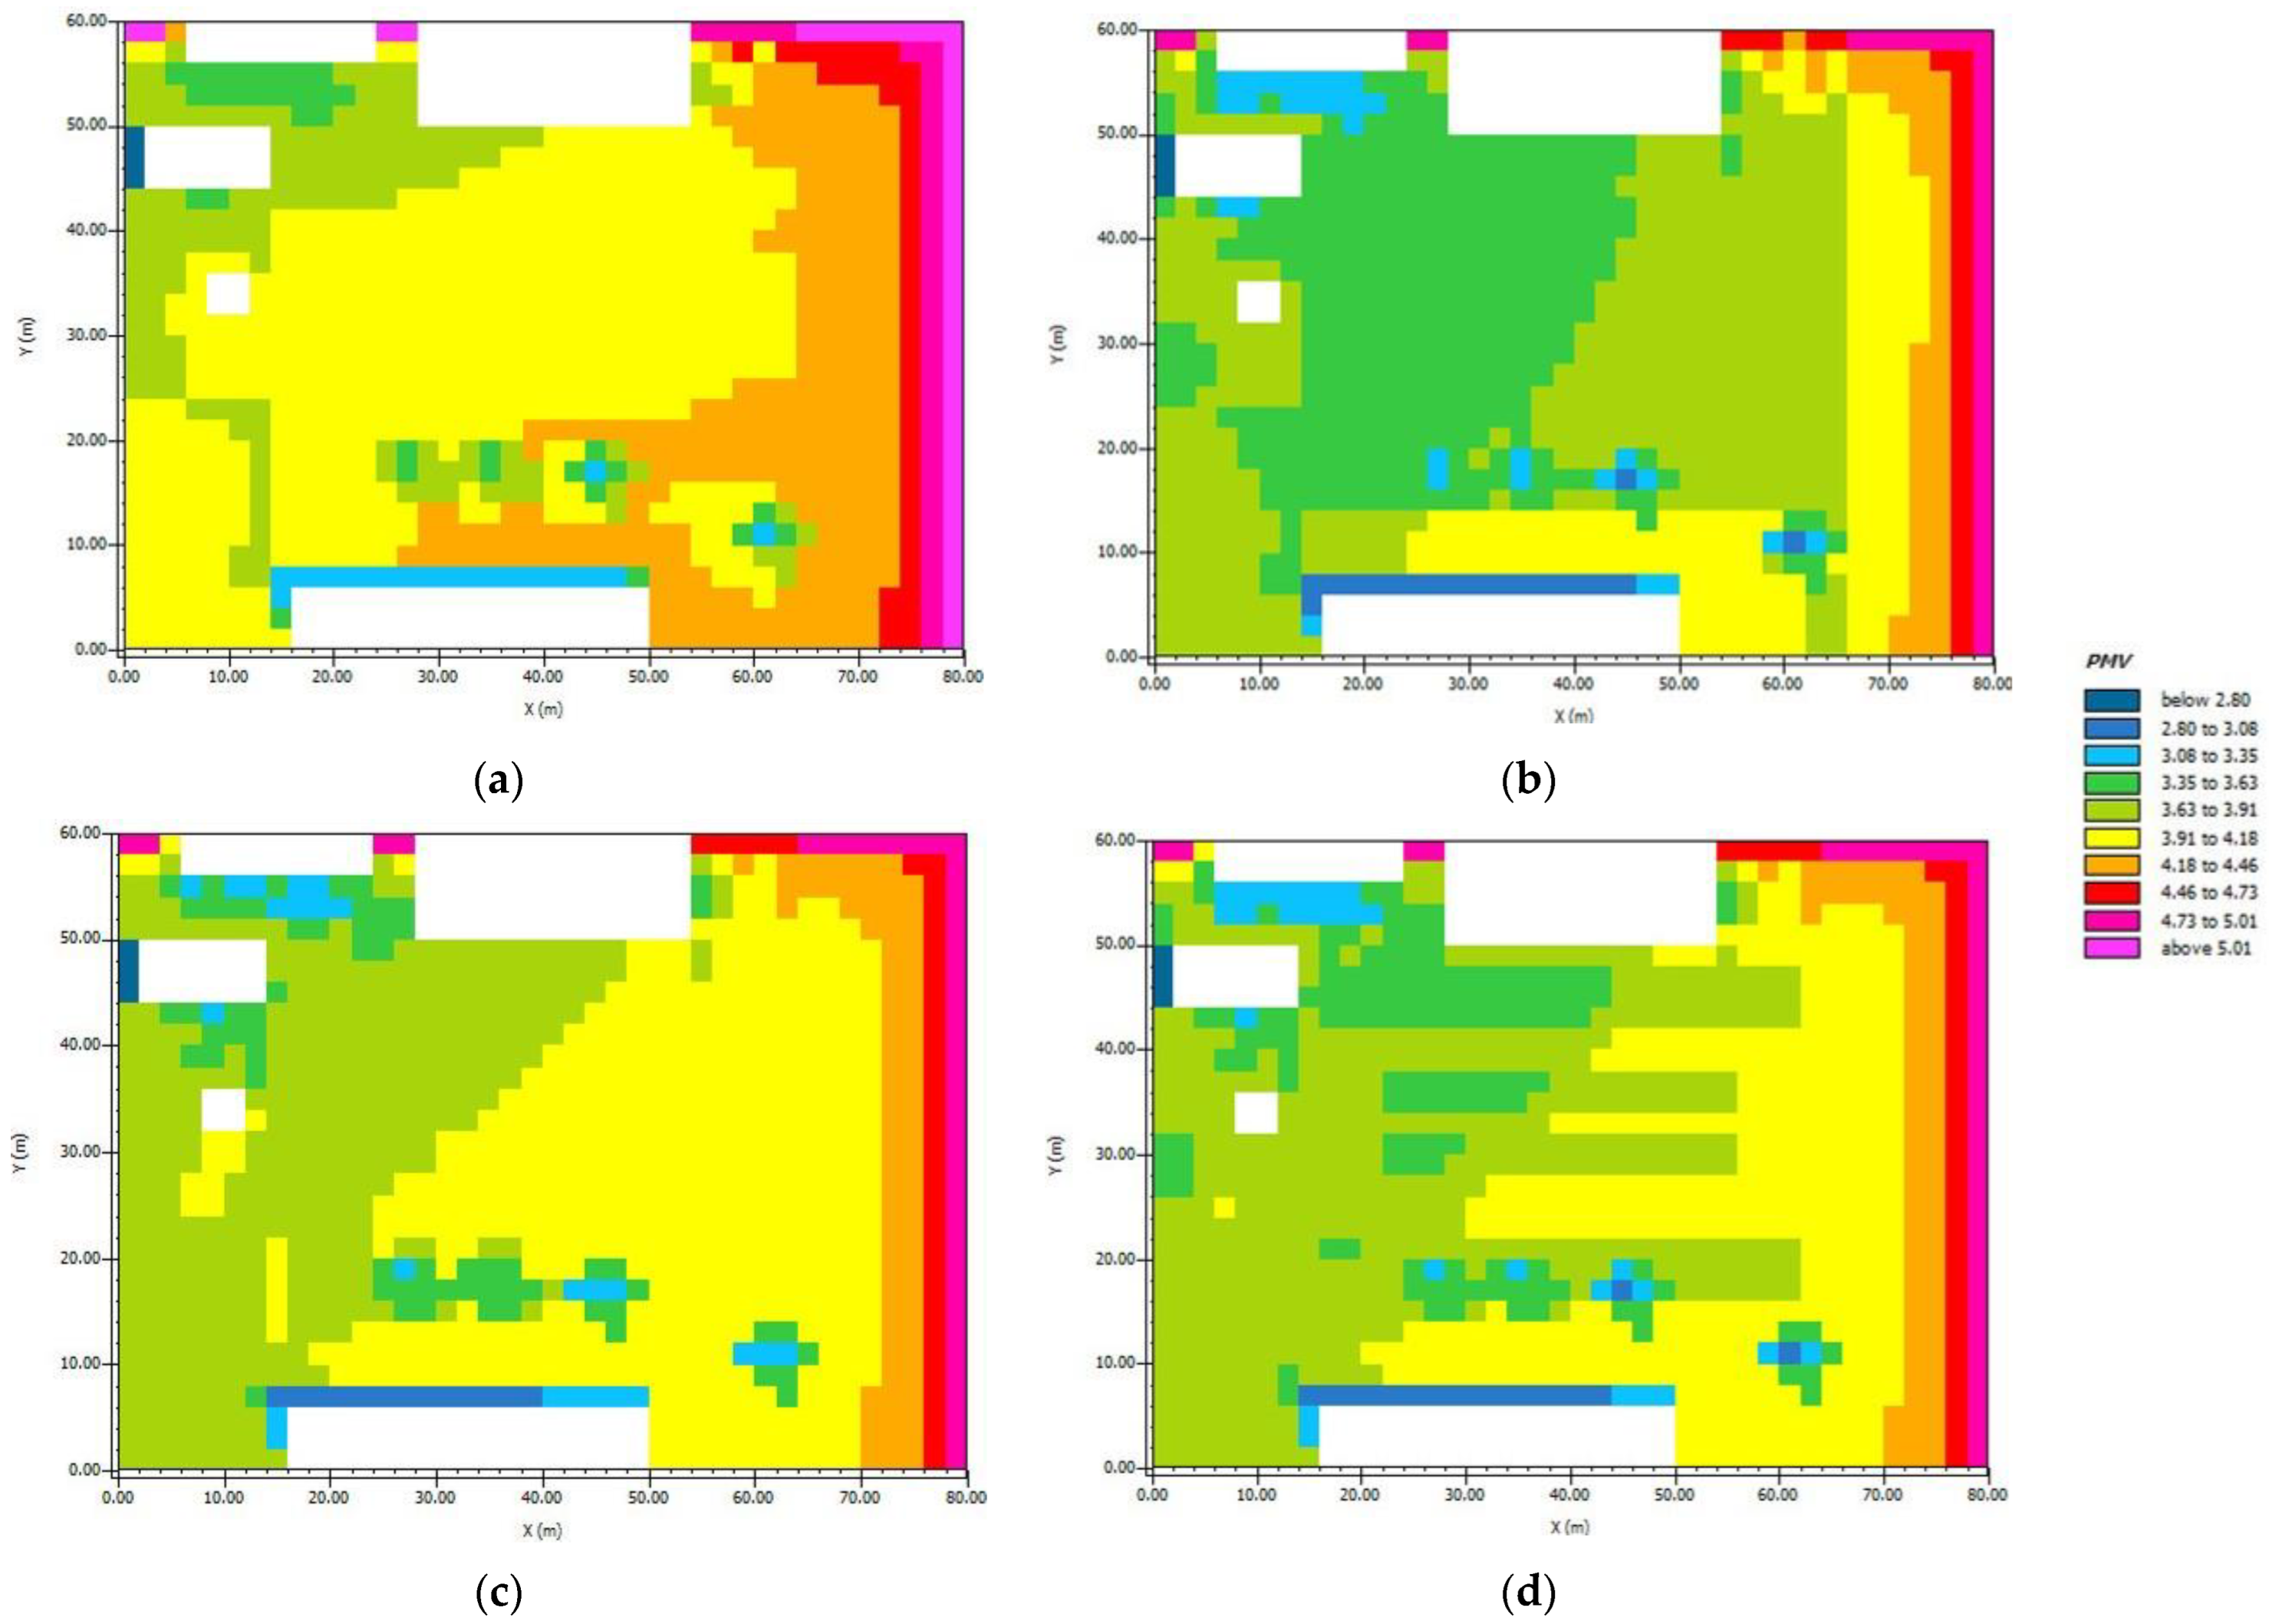
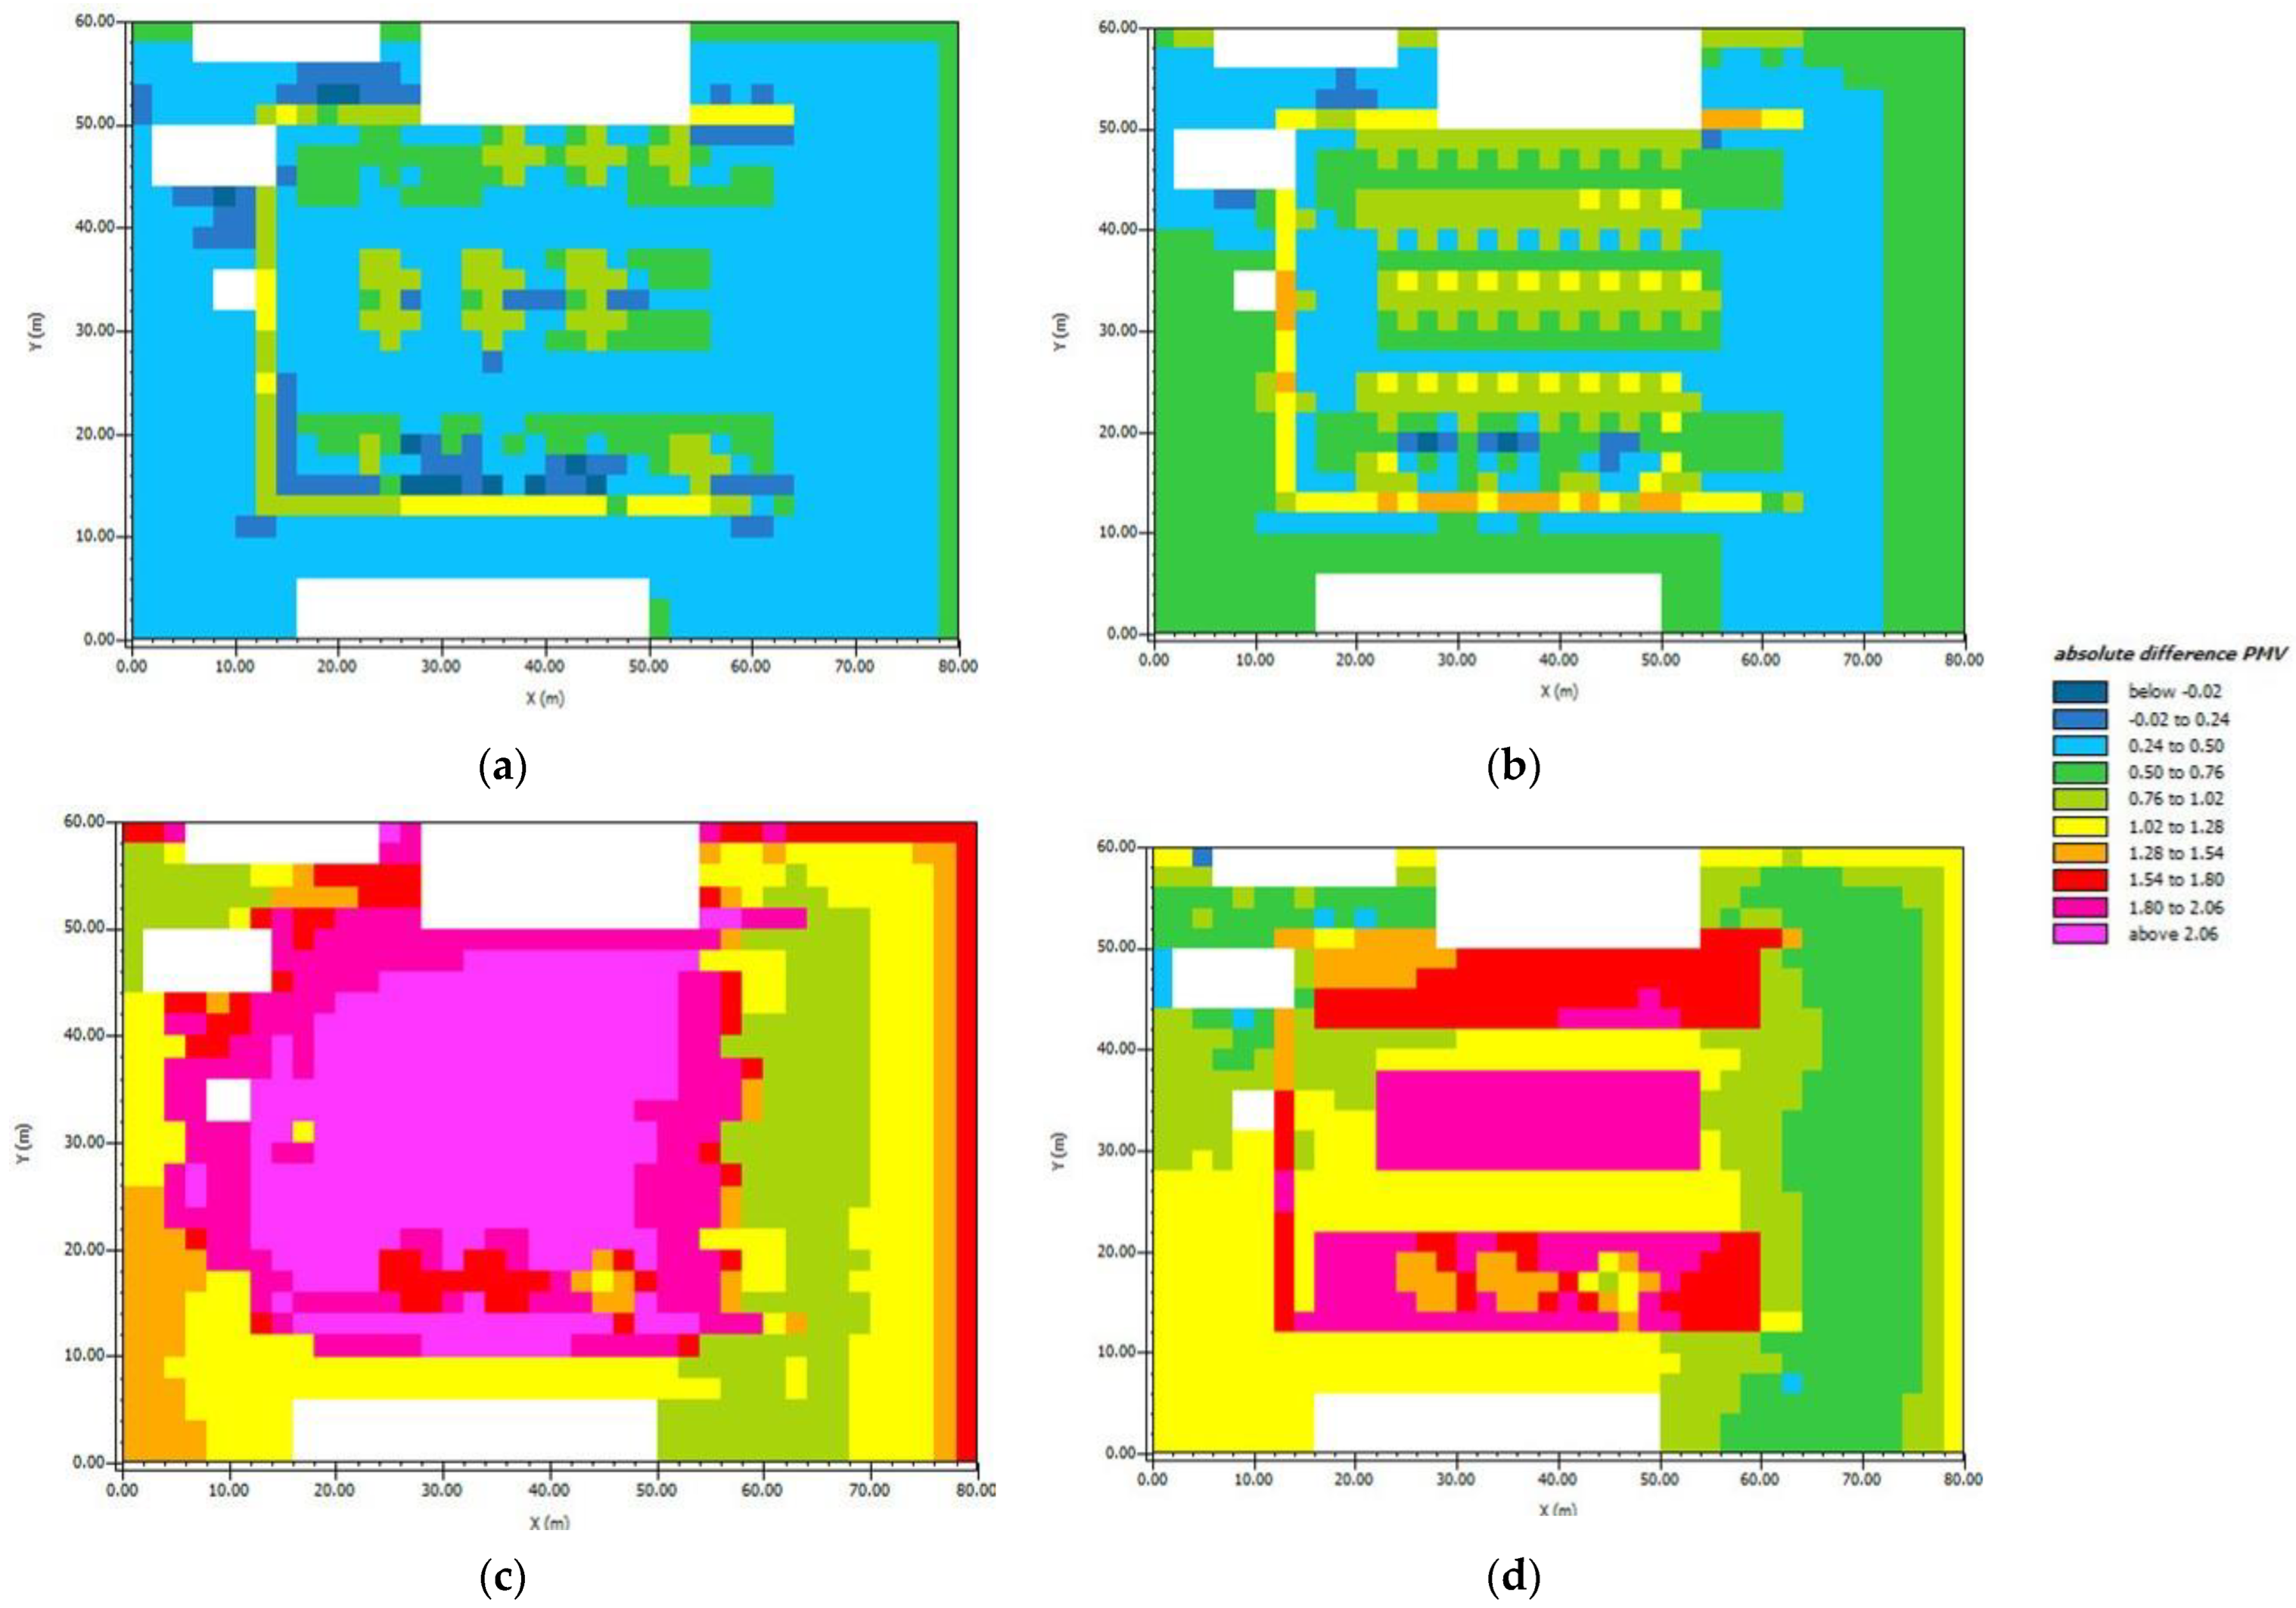
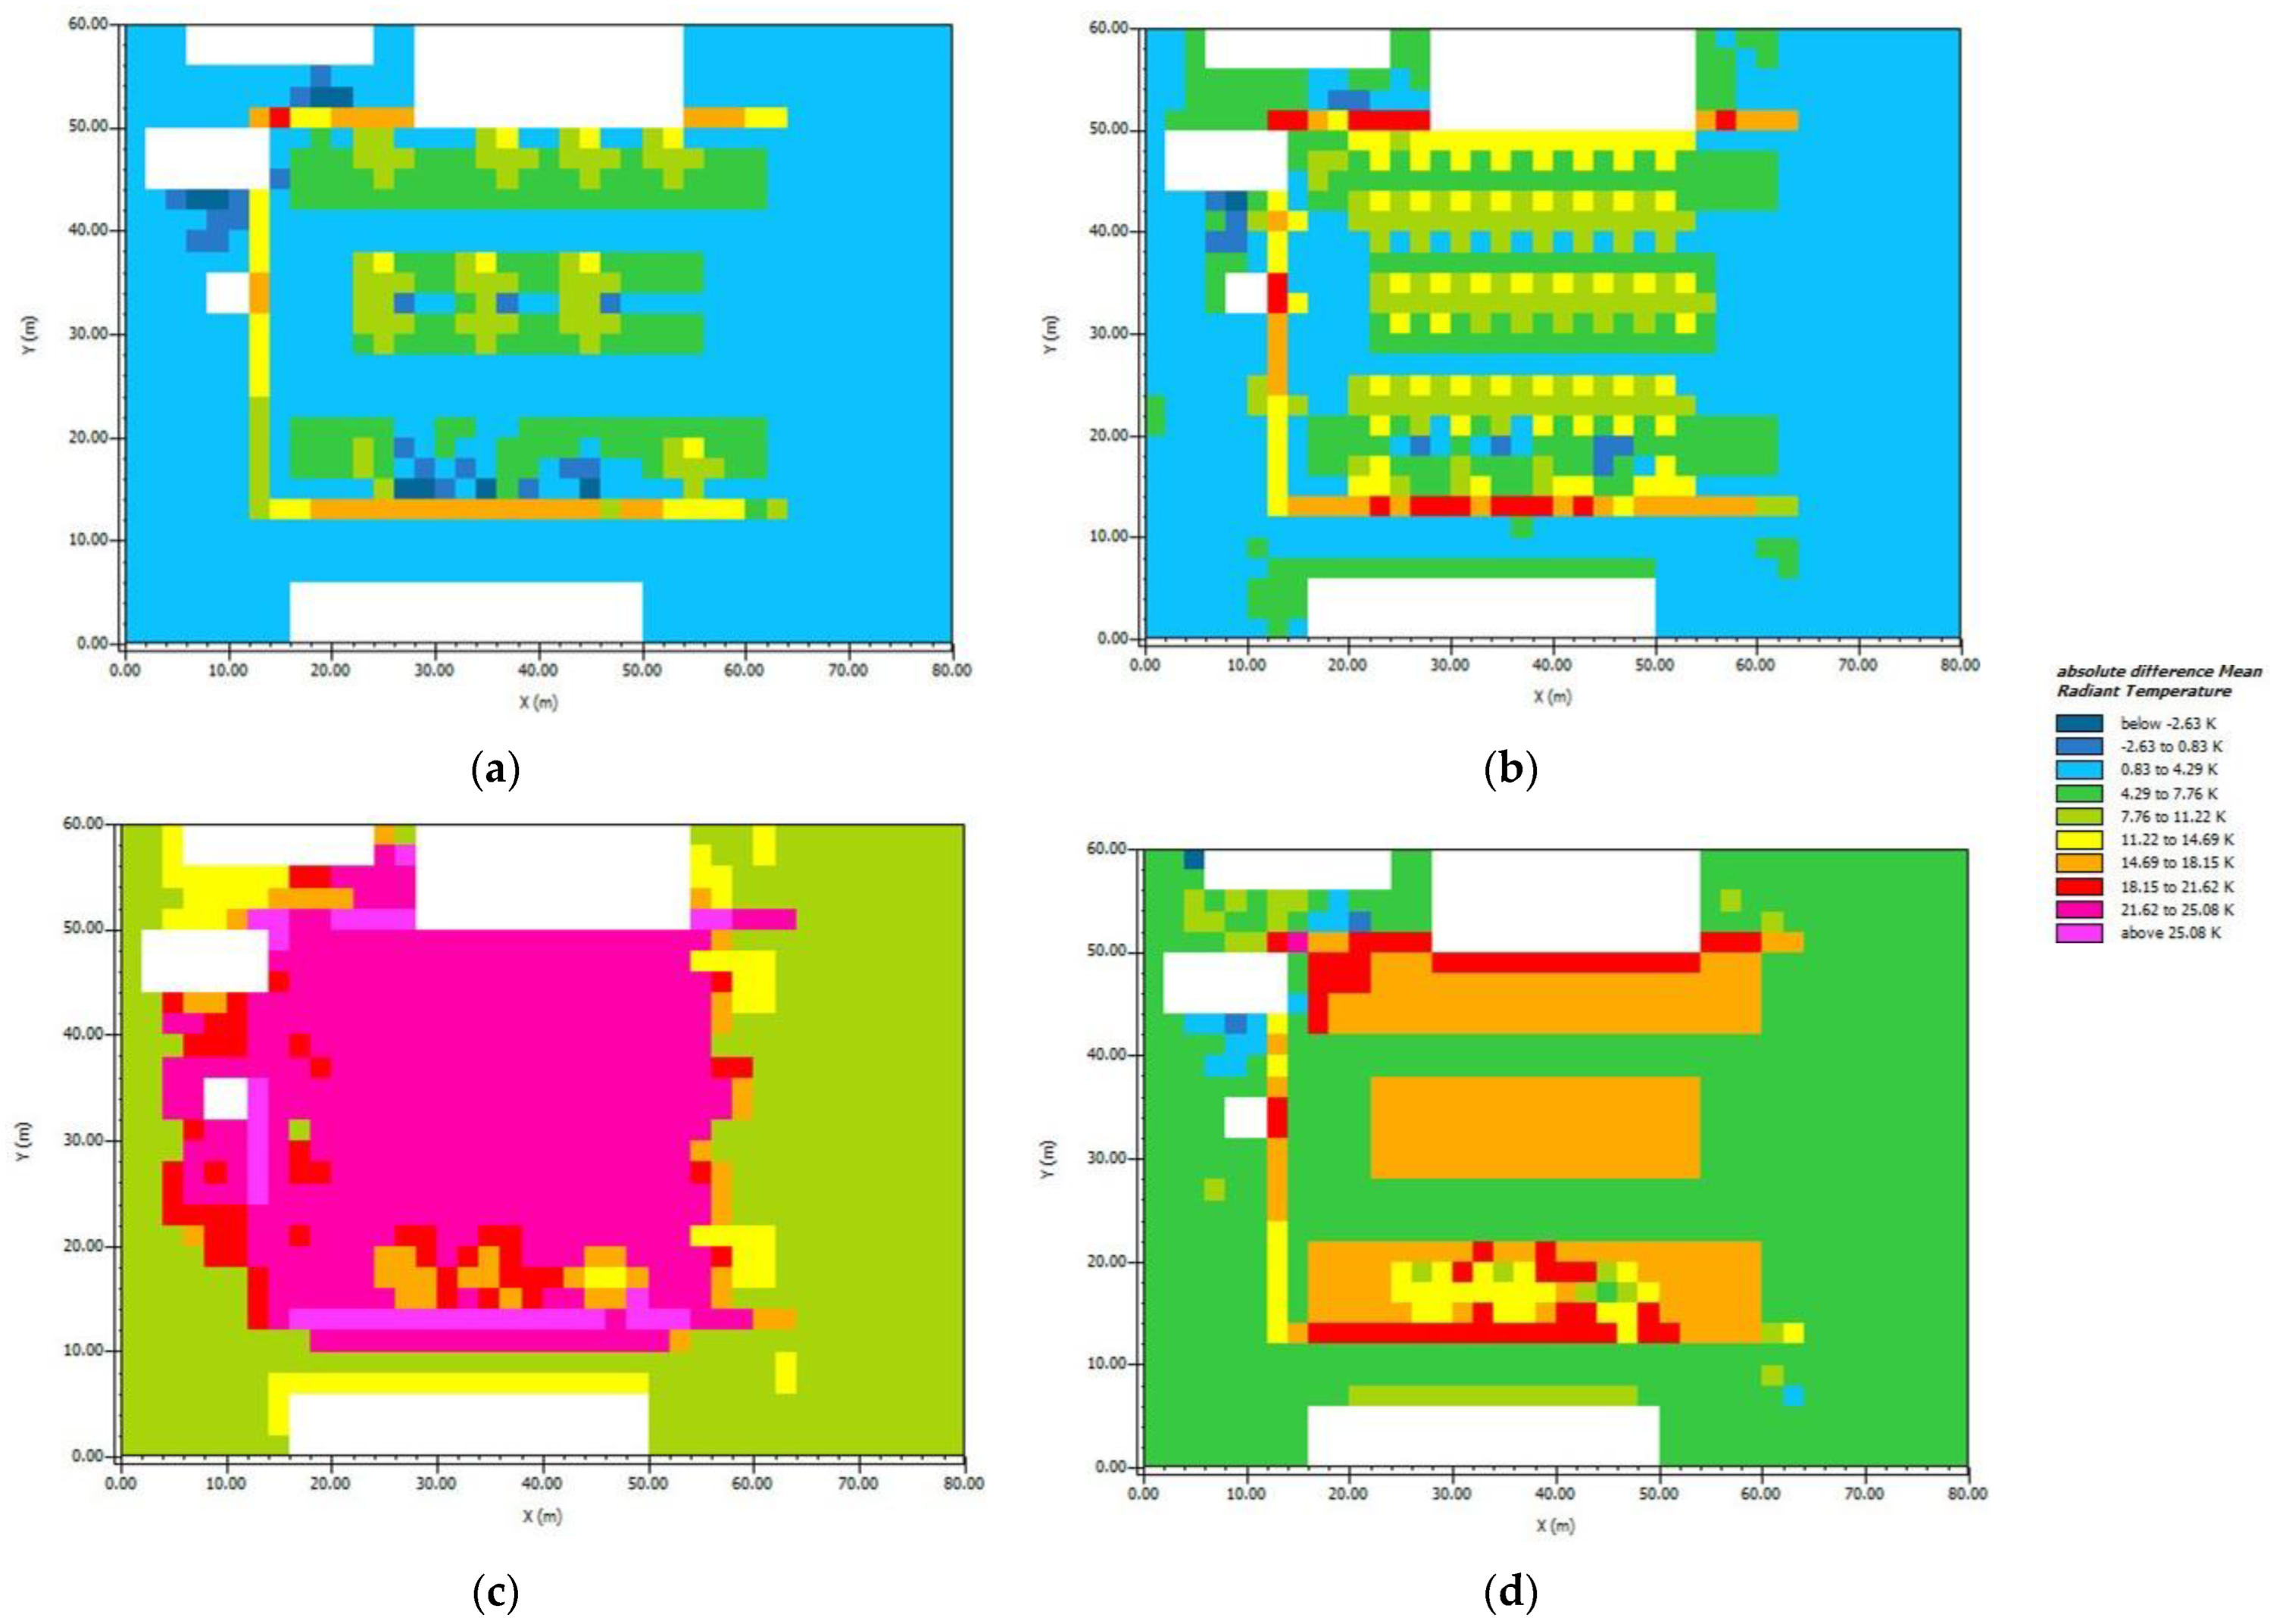
3.4. Case 3.x
4. Discussion
- On average, 7.2 m2 of solar cells are necessary to build a 1-kW power plant if they are correctly positioned and tilted. In S3.4, the cells were horizontal; thus, the efficiency of energy production was reduced by a factor of 0.75 [59];
- A factor of 0.8 takes into account the system losses [60];
- The overall cell surface is 1500 m2.
5. Conclusions
Author Contributions
Funding
Institutional Review Board Statement
Informed Consent Statement
Data Availability Statement
Conflicts of Interest
References
- Oke, T. The Energetic Basis of the Urban Heat Island. Q. J. R. Meteorol. Soc. 1982, 108, 1–24. [Google Scholar] [CrossRef]
- Miner, M.J.; Taylor, R.A.; Jones, C.; Phelan, P.E. Efficiency, Economics, and the Urban Heat Island. Environ. Urban. 2017, 29, 183–194. [Google Scholar] [CrossRef]
- Weng, Q.; Quattrocchi, D.A. (Eds.) Urban Remote Sensing; CRC Press: Boca Raton, FL, USA, 2006; ISBN 9781315166612. [Google Scholar]
- Hoogerbrugge, M.M.; Burger, M.J. Selective Migration and Urban–Rural Differences in Subjective Well-Being: Evidence from the United Kingdom. Urban Stud. 2022, 59, 2092–2109. [Google Scholar] [CrossRef]
- Li, F.; Zheng, W.; Wang, Y.; Liang, J.; Xie, S.; Guo, S.; Li, X.; Yu, C. Urban Green Space Fragmentation and Urbanization: A Spatiotemporal Perspective. Forests 2019, 10, 333. [Google Scholar] [CrossRef] [Green Version]
- Dekić, J.P.; Mitković, P.B.; Dinic Branković, M.M.; Igić, M.Z.; Dekić, P.S.; Mitković, M.P. The Study of Effects of Greenery on Temperature Reduction in Urban Areas. Therm. Sci. 2018, 22, 988–1000. [Google Scholar] [CrossRef] [Green Version]
- Halder, B.; Bandyopadhyay, J.; Khedher, K.M.; Fai, C.M.; Tangang, F.; Yaseen, Z.M. Delineation of Urban Expansion Influences Urban Heat Islands and Natural Environment Using Remote Sensing and GIS-Based in Industrial Area. Environ. Sci. Pollut. Res. 2022, 29, 73147–73170. [Google Scholar] [CrossRef]
- Mohajerani, A.; Bakaric, J.; Jeffrey-Bailey, T. The Urban Heat Island Effect, Its Causes, and Mitigation, with Reference to the Thermal Properties of Asphalt Concrete. J. Environ. Manag. 2017, 197, 522–538. [Google Scholar] [CrossRef]
- Akbari, H.; Kolokotsa, D. Three Decades of Urban Heat Islands and Mitigation Technologies Research. Energy Build. 2016, 133, 834–842. [Google Scholar] [CrossRef]
- Anupam, B.R.; Chandrappa, A.K.; Sahoo, U.C. Sustainable Pavements for Low-Impact Developments in Urban Localities. In Advances in Sustainable Materials and Resilient Infrastructure; Springer: Singapore, 2022; pp. 159–184. [Google Scholar] [CrossRef]
- Ranieri, V.; Coropulis, S.; Berloco, N.; Fedele, V.; Intini, P.; Laricchia, C.; Colonna, P. The Effect of Different Road Pavement Typologies on Urban Heat Island: A Case Study. Sustain. Resilient Infrastruct. 2022, 7, 1–20. [Google Scholar] [CrossRef]
- Cantelli, A.; Monti, P.; Leuzzi, G. Influence of the Urban Heat Island Parameterization on Precipitation Forecasting in Limited Area Model. In Environmental Hydraulics; CRC Press: Boca Raton, FL, USA, 2010; Volume 2, pp. 1151–1156. [Google Scholar] [CrossRef]
- de Martino, A.; Vasselli, S.; D’Argenio, P. Strategies for protecting the elderly from the health-risks of heat-waves: Measures undertaken in Italy in the summer of 2004. Ig. Sanita Pubblica 2005, 61, 293–312. [Google Scholar]
- Santamouris, M. Using Cool Pavements as a Mitigation Strategy to Fight Urban Heat Island—A Review of the Actual Developments. Renew. Sustain. Energy Rev. 2013, 26, 224–240. [Google Scholar] [CrossRef]
- Musco, F.; Fregolent, L.; Magni, F.; Maragno, D.; Ferro, D. Calmierare gli Impatti del Fenomeno Delle Isole di Calore Urbano Con la Pianificazione Urbanistica: Esiti e Applicazioni del Progetto Uhi (Central Europe) in Veneto; Ispra: Rome, Italy, 2014; ISBN 9788844806866. [Google Scholar]
- Shahmohamadi, P.; Cubasch, U.; Sodoudi, S.; Che-Ani, A.I. Mitigating Urban Heat Island Effects in Tehran Metropolitan Area. In Air Pollution-A Comprehensive Perspective; Haryanto, B., Ed.; IntechOpen: London, UK, 2012. [Google Scholar] [CrossRef] [Green Version]
- Italian Ministry of the Environment. Adozione Dei Criteri Ambientali Minimi per l’Affidamento di Servizi di Progettazione e Lavori per la Nuova Costruzione, Ristrutturazione e Manutenzione di Edifici Pubblici; Italian Ministry of the Environment: Rome, Italy, 2017.
- Alves, F.M.; Gonçalves, A.; del Caz-Enjuto, M.R. The Use of Envi-Met for the Assessment of Nature-Based Solutions’ Potential Benefits in Industrial Parks—A Case Study of Argales Industrial Park (Valladolid, Spain). Infrastructures 2022, 7, 85. [Google Scholar] [CrossRef]
- Zheng, T.; Qu, K.; Darkwa, J.; Calautit, J.K. Evaluating Urban Heat Island Mitigation Strategies for a Subtropical City Centre (a Case Study in Osaka, Japan). Energy 2022, 250, 123721. [Google Scholar] [CrossRef]
- Alsaad, H.; Hartmann, M.; Hilbel, R.; Voelker, C. ENVI-Met Validation Data Accompanied with Simulation Data of the Impact of Facade Greening on the Urban Microclimate. Data Brief 2022, 42, 108200. [Google Scholar] [CrossRef]
- Liu, Z.; Cheng, W.; Jim, C.Y.; Morakinyo, T.E.; Shi, Y.; Ng, E. Heat Mitigation Benefits of Urban Green and Blue Infrastructures: A Systematic Review of Modeling Techniques, Validation and Scenario Simulation in ENVI-Met V4. Build. Environ. 2021, 200, 107939. [Google Scholar] [CrossRef]
- Liu, Q.; Wen, J.; Qu, Y.; He, T.; Zhang, X. Broadband Albedo. In Advanced Remote Sensing: Terrestrial Information Extraction and Applications; Liang, S., Wang, J., Li, X., Eds.; Academic Press: San Diego, CA, USA, 2013. [Google Scholar]
- Gui, J.; Phelan, P.; Kaloush, K.; Golden, J. Impact of Pavement Thermophysical Properties on Surface Temperatures. J. Mater. Civ. Eng. 2007, 19, 683–690. [Google Scholar] [CrossRef]
- Wayne Lee, K.; Kohm, S. Cool Pavements as Sustainable Approaches for Green Streets and Highways. Green Energy Technol. 2014, 204, 439–453. [Google Scholar]
- Squyres, S.W.; Veverka, J. Variation of Albedo with Solar Incidence Angle on Planetary Surfaces. Icarus 1982, 50, 115–122. [Google Scholar] [CrossRef]
- Di Maria, V.; Rahman, M.; Collins, P.; Dondi, G.; Sangiorgi, C. Urban Heat Island Effect: Thermal Response from Different Types of Exposed Paved Surfaces. Int. J. Pavement Res. Technol. 2013, 6, 414. [Google Scholar]
- Yang, J.; Wang, Z.H.; Kaloush, K.E.; Dylla, H. Effect of Pavement Thermal Properties on Mitigating Urban Heat Islands: A Multi-Scale Modeling Case Study in Phoenix. Build. Environ. 2016, 108, 110–121. [Google Scholar] [CrossRef]
- Aletba, S.R.O.; Abdul Hassan, N.; Putra Jaya, R.; Aminudin, E.; Mahmud, M.Z.H.; Mohamed, A.; Hussein, A.A. Thermal Performance of Cooling Strategies for Asphalt Pavement: A State-of-the-Art Review. J. Traffic Transp. Eng. 2021, 8, 356–373. [Google Scholar] [CrossRef]
- O’Malley, C.; Kikumoto, H. An Investigation into Heat Storage by Adopting Local Climate Zones and Nocturnal-Diurnal Urban Heat Island Differences in the Tokyo Prefecture. Sustain. Cities Soc. 2022, 83, 103959. [Google Scholar] [CrossRef]
- Moretti, L.; Di Mascio, P.; Fusco, C. Porous concrete for pedestrian pavements. Water 2019, 11, 2105. [Google Scholar] [CrossRef] [Green Version]
- Moretti, L.; Loprencipe, G. Climate Change and Transport Infrastructures: State of the Art. Sustainability 2018, 10, 4098. [Google Scholar] [CrossRef] [Green Version]
- Nwakaire, C.M.; Onn, C.C.; Yap, S.P.; Yuen, C.W.; Onodagu, P.D. Urban Heat Island Studies with Emphasis on Urban Pavements: A Review. Sustain. Cities Soc. 2020, 63, 102476. [Google Scholar] [CrossRef]
- Moretti, L.; Cantisani, G.; Carpiceci, M.; D’andrea, A.; Del Serrone, G.; Di Mascio, P.; Loprencipe, G. Effect of Sampietrini Pavers on Urban Heat Islands. Int. J. Environ. Res. Public Health 2021, 18, 13108. [Google Scholar] [CrossRef]
- Abdulateef, M.F.; Al-Alwan, A.S.H. The Effectiveness of Urban Green Infrastructure in Reducing Surface Urban Heat Island. Ain Shams Eng. J. 2021, 13, 101526. [Google Scholar] [CrossRef]
- Fahed, J.; Kinab, E.; Ginestet, S.; Adolphe, L. Impact of Urban Heat Island Mitigation Measures on Microclimate and Pedestrian Comfort in a Dense Urban District of Lebanon. Sustain. Cities Soc. 2020, 61, 102375. [Google Scholar] [CrossRef]
- Levinson, R.; Akbari, H. Effects of Composition and Exposure on the Solar Reflectance of Portland Cement Concrete; Elsevier: Amsterdam, The Netherlands, 2002; Volume 32. [Google Scholar] [CrossRef] [Green Version]
- UNI EN ISO 7730:2006; Ergonomia Degli Ambienti Termici-Determinazione Analitica e Interpretazione Del Benessere Termico Mediante Il Calcolo Degli Indici PMV e PPD e Dei Criteri di Benessere Termico Locale. UNI (Ente Italiano di Normazione): Milano, Italy, 2006.
- Humphreys, M.A.; Fergus Nicol, J. The Validity of ISO-PMV for Predicting Comfort Votes in Every-Day Thermal Environments. Energy Build. 2002, 34, 667–684. [Google Scholar] [CrossRef]
- Fanger, P. Thermal Comfort: Analysis and Applications in Environmental Engineering; McGraw-Hill: New York, NY, USA, 1972. [Google Scholar]
- ASHRAE Standard 55-2017; Thermal Environmental Conditions for Human Occupancy. ASHRAE: Atlanta, GA, USA, 2017.
- Alfano, G.; Cannistraro, G.; D’Ambrosio, F.R.; Rizzo, G. Notes on the Use of the Tables of Standard ISO 7730 for the Evaluation of the PMV Index. Indoor Built Environ. 1996, 5, 355–357. [Google Scholar] [CrossRef]
- Lau, K.K.L.; Lindberg, F.; Rayner, D.; Thorsson, S. The Effect of Urban Geometry on Mean Radiant Temperature under Future Climate Change: A Study of Three European Cities. Int. J. Biometeorol. 2015, 59, 799–814. [Google Scholar] [CrossRef]
- Liu, K.; You, W.; Chen, X.; Liu, W. Study on the Influence of Globe Thermometer Method on the Accuracy of Calculating Outdoor Mean Radiant Temperature and Thermal Comfort. Atmosphere 2022, 13, 809. [Google Scholar] [CrossRef]
- Luki, M.; Filipovi, D.; Pecelj, M.; Crnogorac, L.; Luki, B.; Divjak, L.; Luki, A.; Vuči, A.; Jänicke, B.; Dzyuban, Y.; et al. Assessment of Outdoor Thermal Comfort in Serbia’s Urban Environments during Different Seasons. Atmosphere 2021, 12, 1084. [Google Scholar] [CrossRef]
- d’Ambrosio Alfano, F.R.; Ficco, G.; Frattolillo, A.; Palella, B.I.; Riccio, G. Mean Radiant Temperature Measurements through Small Black Globes under Forced Convection Conditions. Atmosphere 2021, 12, 621. [Google Scholar] [CrossRef]
- Moretti, L.; Cantisani, G.; Carpiceci, M.; D’Andrea, A.; Del Serrone, G.; Di Mascio, P.; Peluso, P.; Loprencipe, G. Investigation of Parking Lot Pavements to Counteract Urban Heat Islands. Sustainability 2022, 14, 7273. [Google Scholar] [CrossRef]
- Che Tempo Faceva a Roma—Archivio Meteo Roma. Available online: https://www.ilmeteo.it/portale/archivio-meteo/Roma (accessed on 31 July 2022).
- Lawrence, E.O.; Pomerantz, M.; Pon, B.; Akbari, H.; Chang, S.-C. The Effect of Pavements’ Temperatures on Air Temperatures in Large Cities; LNBL-43442; Lawrence Berkeley National Laboratory: Berkeley, CA, USA, 2000. [Google Scholar]
- Ortiz, E.; Del Valle, U. Diseño de una Aplicación Computacional Para el Cálculo de Factor de Visión y Temperatura Media Radiante en Espacios Arquitectónicos; Universidad del Valle: Cali, Colombia, 2017. [Google Scholar]
- Masson, V.; Bonhomme, M.; Salagnac, J.L.; Briottet, X.; Lemonsu, A. Solar Panels Reduce Both Global Warming and Urban Heat Island. Front. Environ. Sci. 2014, 2, 14. [Google Scholar] [CrossRef]
- Tan, C.L.; Wong, N.H.; Jusuf, S.K. Effects of vertical greenery on mean radiant temperature in the tropical urban environment. Landsc. Urban Plan. 2014, 127, 52–64. [Google Scholar] [CrossRef]
- Noro, M.; Lazzarin, R. Urban Heat Island in Padua, Italy: Simulation Analysis and Mitigation Strategies. Urban Clim. 2015, 14, 187–196. [Google Scholar] [CrossRef]
- Li, Y.; Song, Y. Optimization of Vegetation Arrangement to Improve Microclimate and Thermal Comfort in an Urban Park. Int. Rev. Spat. Plan. Sustain. Dev. 2019, 7, 18–30. [Google Scholar] [CrossRef]
- Del Serrone, G.; Peluso, P.; Moretti, L. Evaluation of Microclimate Benefits Due to Cool Pavements and Green Infrastructures on Urban Heat Islands. Atmosphere 2022, 13, 1586. [Google Scholar] [CrossRef]
- Tan, K.; Qin, Y.; Wang, J. Evaluation of the Properties and Carbon Sequestration Potential of Biochar-Modified Pervious Concrete. Constr. Build. Mater. 2022, 314, 125648. [Google Scholar] [CrossRef]
- Wang, J.; Meng, Q.; Zou, Y.; Qi, Q.; Tan, K.; Santamouris, M.; He, B.J. Performance Synergism of Pervious Pavement on Stormwater Management and Urban Heat Island Mitigation: A Review of Its Benefits, Key Parameters, and Co-Benefits Approach. Water Res. 2022, 221, 118755. [Google Scholar] [CrossRef]
- Zhang, G.; He, B.J. Towards Green Roof Implementation: Drivers, Motivations, Barriers and Recommendations. Urban For. Urban Green. 2021, 58, 126992. [Google Scholar] [CrossRef]
- Zhang, G.; He, B.J.; Dewancker, B.J. The Maintenance of Prefabricated Green Roofs for Preserving Cooling Performance: A Field Measurement in the Subtropical City of Hangzhou, China. Sustain. Cities Soc. 2020, 61, 102314. [Google Scholar] [CrossRef]
- Quesada, B.; Sánchez, C.; Cañada, J.; Royo, R.; Payá, J. Experimental results and simulation with TRNSYS of a 7.2 kWp grid-connected photovoltaic system. Appl. Energy 2011, 88, 1772–1783. [Google Scholar] [CrossRef]
- Kim, H.C.; Fthenakis, V.; Choi, J.K.; Turney, D.E. Life Cycle Greenhouse Gas Emissions of Thin-Film Photovoltaic Electricity Generation. J. Ind. Ecol. 2012, 16, S110–S121. [Google Scholar] [CrossRef]
- ENEA. Available online: https://www.enea.it/it (accessed on 28 October 2022).
- PVGIS Photovoltaic Geographical Information System. Available online: https://joint-research-centre.ec.europa.eu/pvgis-photovoltaic-geographical-information-system_en (accessed on 31 July 2022).
- Milev, G.; Hastings, A.; Al-Habaibeh, A. The Environmental and Financial Implications of Expanding the Use of Electric Cars—A Case Study of Scotland. Energy Built Environ. 2021, 2, 204–213. [Google Scholar] [CrossRef]
- Di Mascio, P.; Moretti, L.; Capannolo, A. Concrete block pavements in urban and local roads: Analysis of stress-strain condition and proposal for a catalogue. J. Traffic Transp. Eng. 2019, 6, 557–566. [Google Scholar] [CrossRef]
- Zoccali, P.; Moretti, L.; Mascio, P.D.; Loprencipe, G.; D’Andrea, A.; Bonin, G.; Teltayev, B.; Caro, S. Analysis of natural stone block pavements in urban shared areas. Case Stud. Constr. Mater. 2018, 8, 498–506. [Google Scholar] [CrossRef]


| Material | Photo | Pros | Cons | Albedo | Emissivity | Color |
|---|---|---|---|---|---|---|
| Asphalt |  | Fast construction | UHI Low permeability | 0.08 | 0.80 | |
| Porous light concrete |  | Low surface temperature High albedo and emissivity values High permeability | Low strength High construction and maintenance costs Voids occlusion | 0.80 | 0.94 | |
| Concrete grass grid pavers |  | Evapotranspiration High permeability | Roughness Grass maintenance Noise | 0.20 | --- | |
| Stone (porphyry) |  | Aesthetic value | Roughness Low albedo Noise | 0.20 | 0.85 |
| Scenario | Characteristics |
|---|---|
| S0 | Asphalt carriageable pavements and porphyry pavers for sidewalks |
| S1.1 | Asphalt carriageable pavements and concrete grass grid pavers for sidewalks |
| S1.2 | Asphalt carriageable pavements and light porous concrete for sidewalks |
| S1.3 | Asphalt carriageable pavements and grass for sidewalks |
| S2.1 | Concrete grass grid pavers for carriageable pavements and sidewalks |
| S2.2 | Light porous concrete for carriageable pavements and sidewalks |
| S2.3 | Light porous concrete for carriageable pavements and sidewalks, and concrete grass grid pavers for stalls |
| S3.1 | Light porous concrete for carriageable pavements and sidewalks, and concrete grass grid pavers for stalls + 2-m-high boundary hedge around the area + 11 5-m-high trees |
| S3.2 | Light porous concrete for carriageable pavements and sidewalks, and concrete grass grid pavers for stalls + 2-m-high boundary hedge around the area + 43 5-m-high trees |
| S3.3 | Light porous concrete for carriageable pavements and sidewalks, and concrete grass grid pavers for stalls + 2-m-high boundary hedge around the area + 43 15-m-high trees |
| S3.4 | Light porous concrete for carriageable pavements and sidewalks, and concrete grass grid pavers for stalls + 2-m-high boundary hedge around the area + photovoltaic canopies over the parking stalls |
| Input Data | Value | Unit |
|---|---|---|
| Wind speed | 2.00 | m/s |
| Wind direction | 90 | ° |
| Humidity at 2500 m | 8 | g/kg |
| Initial air temperature | 23 | °C |
| Maximum air temperature | 30 | °C |
| Initial humidity | 70 | % |
| Maximum humidity | 75 | % |
| Receptor | PMV (-) | AT (°C) | MRT (°C) | PMV (-) | AT (°C) | MRT (°C) | PMV (-) | AT (°C) | MRT (°C) | PMV (-) | AT (°C) | MRT (°C) |
|---|---|---|---|---|---|---|---|---|---|---|---|---|
| 12:00 a.m. 2 July | 6:00 p.m. 2 July | 00:00 a.m. 3 July | 06:00 a.m. 3 July | |||||||||
| 1 | 3.96 | 32.39 | 57.99 | 1.89 | 30.10 | 33.13 | 0.28 | 25.25 | 18.44 | 0.07 | 24.12 | 17.80 |
| 2 | 4.15 | 33.99 | 57.86 | 2.94 | 31.31 | 47.56 | 0.28 | 25.40 | 18.29 | 0.69 | 24.36 | 29.78 |
| 3 | 4.12 | 33.25 | 57.79 | 2.92 | 30.71 | 47.50 | 0.26 | 25.13 | 18.18 | 0.65 | 24.10 | 17.56 |
| 4 | 4.20 | 33.93 | 58.16 | 2.33 | 30.78 | 38.78 | 0.29 | 25.27 | 18.68 | 0.73 | 24.32 | 30.06 |
| 5 | 4.17 | 33.99 | 57.52 | 2.91 | 31.04 | 47.21 | 0.23 | 25.09 | 18.03 | 0.70 | 24.18 | 29.51 |
| 6 | 4.21 | 33.87 | 57.62 | 1.87 | 30.72 | 30.89 | 0.26 | 25.13 | 18.19 | 0.74 | 24.22 | 29.63 |
| Scenario | Receptor | PMV (-) | AT (°C) | MRT (°C) | PMV (-) | AT (°C) | MRT (°C) | PMV (-) | AT (°C) | MRT (°C) | PMV (-) | AT (°C) | MRT (°C) |
|---|---|---|---|---|---|---|---|---|---|---|---|---|---|
| 12:00 a.m. 2 July | 6:00 p.m. 2 July | 00:00 a.m. 3 July | 06:00 a.m. 3 July | ||||||||||
| S1.1 | 1 | 3.89 | 31.51 | 60.69 | 1.67 | 29.12 | 32.30 | 0.07 | 24.53 | 16.88 | −0.11 | 23.45 | 16.66 |
| 2 | 4.12 | 32.70 | 60.55 | 2.68 | 29.97 | 47.03 | 0.04 | 24.46 | 16.74 | 0.49 | 23.47 | 29.04 | |
| 3 | 4.03 | 32.18 | 60.49 | 2.69 | 29.56 | 46.97 | 0.03 | 24.32 | 16.63 | −0.13 | 23.35 | 16.43 | |
| 4 | 4.17 | 32.76 | 60.85 | 2.08 | 29.56 | 38.07 | 0.05 | 24.37 | 17.12 | 0.54 | 23.46 | 29.34 | |
| 5 | 4.14 | 32.72 | 60.17 | 2.65 | 29.72 | 46.66 | 0.00 | 24.20 | 16.49 | 0.51 | 23.33 | 28.80 | |
| 6 | 4.14 | 32.71 | 60.26 | 1.61 | 29.52 | 30.00 | 0.03 | 24.25 | 16.65 | 0.56 | 23.37 | 28.92 | |
| S1.2 | 1 | 3.92 | 31.51 | 61.39 | 1.68 | 29.13 | 32.41 | 0.07 | 24.52 | 16.85 | −0.11 | 23.45 | 16.74 |
| 2 | 4.17 | 32.73 | 61.25 | 2.68 | 29.96 | 47.13 | 0.03 | 24.44 | 16.71 | 0.49 | 23.46 | 29.11 | |
| 3 | 4.07 | 32.21 | 61.19 | 2.70 | 29.56 | 47.06 | 0.03 | 24.31 | 16.60 | −0.12 | 23.34 | 16.51 | |
| 4 | 4.21 | 32.79 | 61.55 | 2.08 | 29.56 | 38.17 | 0.05 | 24.36 | 17.09 | 0.54 | 23.49 | 29.42 | |
| 5 | 4.17 | 32.73 | 60.87 | 2.65 | 29.71 | 46.75 | −0.01 | 24.18 | 16.46 | 0.50 | 23.32 | 28.87 | |
| 6 | 4.17 | 32.71 | 60.96 | 1.61 | 29.51 | 30.11 | 0.02 | 24.24 | 16.61 | 0.55 | 23.36 | 28.99 | |
| S1.3 | 1 | 3.81 | 31.78 | 57.65 | 1.64 | 29.24 | 31.43 | 0.06 | 24.51 | 16.80 | −0.12 | 23.46 | 16.46 |
| 2 | 3.98 | 33.11 | 57.52 | 2.67 | 30.17 | 46.27 | 0.03 | 24.42 | 16.65 | 0.49 | 23.49 | 28.85 | |
| 3 | 3.96 | 32.52 | 57.46 | 2.66 | 29.71 | 46.20 | 0.03 | 24.29 | 16.54 | −0.13 | 23.36 | 16.23 | |
| 4 | 4.03 | 33.08 | 57.82 | 2.05 | 29.69 | 37.24 | 0.04 | 24.34 | 17.03 | 0.54 | 23.48 | 29.17 | |
| 5 | 4.02 | 33.22 | 57.18 | 2.64 | 29.92 | 45.90 | −0.01 | 24.15 | 16.40 | 0.51 | 23.35 | 28.62 | |
| 6 | 4.07 | 33.11 | 57.27 | 1.58 | 29.64 | 29.13 | 0.02 | 24.24 | 16.56 | 0.55 | 23.39 | 28.74 | |
| Scenario | Receptor | PMV (-) | AT (°C) | MRT (°C) | PMV (-) | AT (°C) | MRT (°C) | PMV (-) | AT (°C) | MRT (°C) | PMV (-) | AT (°C) | MRT (°C) |
|---|---|---|---|---|---|---|---|---|---|---|---|---|---|
| 12:00 a.m. 2 July | 6:00 p.m. 2 July | 00:00 a.m. 3 July | 06:00 a.m. 3 July | ||||||||||
| S2.1 | 1 | 3.44 | 31.41 | 52.61 | 1.69 | 29.55 | 31.21 | 0.19 | 24.75 | 18.26 | −0.04 | 23.59 | 17.38 |
| 2 | 3.57 | 32.59 | 52.54 | 2.23 | 30.46 | 38.09 | 0.17 | 24.75 | 18.18 | 0.11 | 23.60 | 20.67 | |
| 3 | 3.59 | 32.20 | 52.46 | 2.20 | 30.01 | 38.00 | 0.16 | 24.58 | 18.07 | −0.05 | 23.49 | 17.20 | |
| 4 | 3.65 | 32.69 | 52.80 | 2.01 | 30.12 | 35.10 | 0.18 | 24.65 | 18.52 | 0.14 | 23.56 | 20.97 | |
| 5 | 3.68 | 33.10 | 52.32 | 2.21 | 30.35 | 37.84 | 0.13 | 24.47 | 18.04 | 0.11 | 23.47 | 20.53 | |
| 6 | 3.70 | 32.93 | 52.39 | 1.66 | 30.10 | 29.04 | 0.15 | 24.49 | 18.17 | 0.14 | 23.49 | 20.60 | |
| S2.2 | 1 | 3.75 | 31.76 | 56.61 | 1.74 | 29.62 | 32.01 | 0.13 | 24.74 | 17.27 | −0.09 | 23.58 | 16.61 |
| 2 | 3.89 | 33.10 | 56.49 | 2.77 | 30.61 | 30.06 | 0.10 | 24.72 | 17.13 | 0.51 | 23.62 | 28.96 | |
| 3 | 3.90 | 32.54 | 56.42 | 2.76 | 30.12 | 46.66 | 0.09 | 24.55 | 17.02 | −0.11 | 23.49 | 16.37 | |
| 4 | 3.96 | 33.08 | 56.78 | 2.15 | 30.11 | 37.77 | 0.11 | 24.61 | 17.51 | 0.56 | 23.58 | 29.27 | |
| 5 | 3.95 | 33.29 | 56.16 | 2.74 | 30.38 | 46.37 | 0.06 | 24.43 | 16.88 | 0.52 | 23.48 | 28.73 | |
| 6 | 3.98 | 33.13 | 56.25 | 1.69 | 30.06 | 29.74 | 0.08 | 24.46 | 17.04 | 0.57 | 23.50 | 28.85 | |
| S2.3 | 1 | 3.70 | 31.57 | 56.42 | 1.74 | 29.59 | 32.00 | 0.13 | 24.75 | 17.33 | −0.08 | 23.59 | 16.62 |
| 2 | 3.64 | 32.91 | 52.79 | 2.24 | 30.58 | 38.10 | 0.16 | 24.74 | 18.12 | 0.10 | 23.61 | 20.65 | |
| 3 | 3.87 | 32.38 | 56.23 | 2.77 | 30.09 | 46.65 | 0.10 | 24.56 | 17.07 | −0.10 | 23.49 | 16.39 | |
| 4 | 3.70 | 32.96 | 53.05 | 2.01 | 30.17 | 35.10 | 0.17 | 24.63 | 18.46 | 0.13 | 23.58 | 20.95 | |
| 5 | 3.94 | 33.23 | 56.01 | 2.75 | 30.39 | 46.40 | 0.07 | 24.45 | 16.96 | 0.54 | 23.48 | 28.76 | |
| 6 | 3.73 | 33.08 | 52.63 | 1.65 | 30.10 | 29.03 | 0.14 | 24.48 | 18.10 | 0.13 | 23.49 | 20.60 | |
| Scenario | Receptor | PMV (-) | AT (°C) | MRT (°C) | PMV (-) | AT (°C) | MRT (°C) | PMV (-) | AT (°C) | MRT (°C) | PMV (-) | AT (°C) | MRT (°C) |
|---|---|---|---|---|---|---|---|---|---|---|---|---|---|
| 12:00 a.m. 2 July | 6:00 p.m. 2 July | 00:00 a.m. 3 July | 06:00 a.m. 3 July | ||||||||||
| S3.1 | 1 | 3.63 | 31.44 | 55.48 | 2.71 | 29.64 | 46.28 | 0.13 | 24.75 | 17.33 | −0.08 | 23.59 | 16.62 |
| 2 | 3.61 | 32.84 | 51.82 | 2.21 | 30.41 | 37.54 | 0.16 | 24.74 | 18.12 | 0.10 | 23.61 | 20.65 | |
| 3 | 3.83 | 32.35 | 55.53 | 2.77 | 29.93 | 46.34 | 0.10 | 24.56 | 17.07 | −0.10 | 23.49 | 16.39 | |
| 4 | 3.63 | 33.01 | 51.96 | 1.62 | 30.01 | 28.78 | 0.17 | 24.63 | 18.46 | 0.13 | 23.58 | 20.95 | |
| 5 | 3.87 | 33.04 | 55.12 | 2.69 | 30.14 | 45.84 | 0.07 | 24.45 | 16.96 | 0.54 | 23.48 | 28.76 | |
| 6 | 3.66 | 32.95 | 51.93 | 1.60 | 29.87 | 28.72 | 0.14 | 24.48 | 18.10 | 0.13 | 23.49 | 20.60 | |
| S3.2 | 1 | 3.02 | 30.48 | 47.01 | 1.71 | 29.08 | 31.67 | 0.59 | 25.12 | 23.32 | 0.34 | 23.94 | 22.00 |
| 2 | 3.51 | 31.84 | 51.32 | 2.26 | 29.98 | 38.05 | 0.43 | 25.15 | 20.88 | 0.18 | 23.90 | 19.61 | |
| 3 | 3.21 | 31.39 | 47.65 | 1.76 | 29.17 | 32.47 | 0.60 | 24.85 | 24.45 | 0.36 | 23.77 | 23.01 | |
| 4 | 3.63 | 32.36 | 51.97 | 2.24 | 29.77 | 38.85 | 0.43 | 24.87 | 22.02 | 0.19 | 23.76 | 20.64 | |
| 5 | 3.79 | 32.89 | 53.61 | 1.49 | 29.67 | 27.37 | 0.17 | 24.56 | 17.49 | 0.65 | 23.57 | 29.66 | |
| 6 | 3.53 | 32.86 | 50.32 | 2.10 | 29.91 | 36.83 | 0.22 | 24.57 | 19.17 | 0.19 | 23.57 | 21.40 | |
| S3.3 | 1 | 1.87 | 28.52 | 35.59 | 1.20 | 27.60 | 27.96 | 0.47 | 24.82 | 23.03 | 0.25 | 23.82 | 21.82 |
| 2 | 1.99 | 29.40 | 35.08 | 1.25 | 27.90 | 27.87 | 0.49 | 24.82 | 23.11 | 0.27 | 23.79 | 21.89 | |
| 3 | 1.97 | 29.41 | 35.41 | 1.18 | 27.68 | 27.75 | 0.40 | 24.56 | 22.87 | 0.19 | 23.64 | 21.65 | |
| 4 | 2.05 | 30.22 | 34.87 | 1.19 | 27.90 | 27.69 | 0.38 | 24.55 | 22.97 | 0.17 | 23.63 | 21.75 | |
| 5 | 2.63 | 31.71 | 40.20 | 1.20 | 28.08 | 27.15 | 0.29 | 24.36 | 21.56 | 0.78 | 23.53 | 32.56 | |
| 6 | 3.02 | 32.10 | 45.66 | 1.22 | 28.17 | 27.38 | 0.30 | 24.36 | 21.98 | 0.29 | 23.53 | 24.19 | |
| S3.4 | 1 | 3.00 | 29.23 | 52.21 | 2.15 | 27.77 | 44.00 | 0.03 | 24.60 | 15.92 | −0.13 | 23.62 | 15.67 |
| 2 | 2.22 | 29.47 | 40.16 | 1.14 | 27.90 | 26.82 | −0.01 | 24.68 | 14.88 | −0.15 | 23.67 | 15.34 | |
| 3 | 3.03 | 29.45 | 52.23 | 2.15 | 27.81 | 43.94 | −0.01 | 24.48 | 15.49 | −0.16 | 23.55 | 15.37 | |
| 4 | 2.27 | 29.69 | 40.04 | 1.14 | 27.94 | 26.68 | −0.04 | 24.55 | 14.57 | −0.17 | 23.60 | 15.08 | |
| 5 | 3.17 | 30.31 | 52.13 | 2.18 | 28.01 | 43.85 | −0.03 | 24.23 | 15.74 | 0.48 | 23.41 | 27.93 | |
| 6 | 2.42 | 30.47 | 39.39 | 1.18 | 28.13 | 26.62 | −0.07 | 24.30 | 14.70 | 0.49 | 23.46 | 27.62 | |
Publisher’s Note: MDPI stays neutral with regard to jurisdictional claims in published maps and institutional affiliations. |
© 2022 by the authors. Licensee MDPI, Basel, Switzerland. This article is an open access article distributed under the terms and conditions of the Creative Commons Attribution (CC BY) license (https://creativecommons.org/licenses/by/4.0/).
Share and Cite
Peluso, P.; Persichetti, G.; Moretti, L. Effectiveness of Road Cool Pavements, Greenery, and Canopies to Reduce the Urban Heat Island Effects. Sustainability 2022, 14, 16027. https://doi.org/10.3390/su142316027
Peluso P, Persichetti G, Moretti L. Effectiveness of Road Cool Pavements, Greenery, and Canopies to Reduce the Urban Heat Island Effects. Sustainability. 2022; 14(23):16027. https://doi.org/10.3390/su142316027
Chicago/Turabian StylePeluso, Paolo, Giovanni Persichetti, and Laura Moretti. 2022. "Effectiveness of Road Cool Pavements, Greenery, and Canopies to Reduce the Urban Heat Island Effects" Sustainability 14, no. 23: 16027. https://doi.org/10.3390/su142316027