Article

Impact of Phase Change Materials on Cooling Demand of an Educational Facility in Cairo, Egypt

Department of Construction and Building Engineering, Faculty of Engineering &Technology, Arab Academy for Science, Technology and Maritime Transport, Giza 3650111, Egypt
*
Author to whom correspondence should be addressed.
Sustainability 2022, 14(23), 15956; https://doi.org/10.3390/su142315956
Submission received: 9 October 2022 / Revised: 17 November 2022 / Accepted: 25 November 2022 / Published: 30 November 2022
(This article belongs to the Topic Building Energy Efficiency)

Abstract

:
Heat gains and losses via building envelopes are impacted by varied characteristics such as geometry, orientation, properties of the building materials, and the type of construction and its interface with the exterior environment. Current studies are investigating the use of phase change materials (PCMs) characterized by high latent heat and low thermal conductivity that may cause temperature time lag and reduce amounts of heat transferred through building envelopes. The prime objectives of this research are evaluating zones’ energy consumption by type for an educational facility in a dry arid climate, examining the effects of a PCM (RT28HC) and polyurethane insulating material, comparing these effects to the existing situation with respect to cooling energy savings and CO2 emissions, and studying the effect of varying PCM thicknesses. The working methodology depended on gathering the real status and actual material of the building, constructing models of the building using Design Builder (DB) simulation software, and comparing the insulation effect of incorporating polyurethane and phase change insulating materials. A parametric study evaluated various PCM thicknesses (6, 12, 18, 24, 30, and 36 mm). Validation was performed primarily for a selected year’s energy usage; simulation results complied with field measurements. The results revealed that an 18 mm PCM had a high efficiency regarding thermal comfort attributes, which reduced cooling energy by 17.5% and CO2 emissions by 12.4%. Consequently, this study has shown the significant potential of PCM regarding improved energy utilization in buildings.

1. Introduction

Fossil fuels have been the main energy sources used for electricity production over the past century [1]. The building sector consumes 30–40% of the world’s primary energy, which accounts for one-third of the world’s greenhouse gases [2]. The current building stock is widely acknowledged to be a significant contributor to overall energy consumption and associated carbon emissions worldwide [3]. Energy saving has become an important topic in every county around the world, especially given the global energy crisis. In Egypt, due to the rise in population, there has been a high rate of domestic electricity consumption in recent years [4]. Consequently, Egypt’s GHG emissions, especially CO2 gas, have gradually risen over the last decade as a result of its increasing reliance on fossil fuels. Egypt’s CO2 emissions reached 250 million tons in 2018 according to the European Commission et al. [5]. If no initiatives to minimize CO2 and other greenhouse gas emissions are taken, it is estimated that the average surface temperature of the Earth will increase 1.1–6.4 °C by the end of 2100 [6]. These indications motivated researchers to reduce buildings’ energy consumption, which has become a critical problem worldwide.
One of the primary techniques for conserving energy in buildings is to use thermal insulation materials as a building envelope due to their low thermal conductivity. Different materials, such as solid panels, solid buckles, particles, sandwiches, and coils are widely utilized in various building components, such as external walls, roofs, floors, and doors. Not only are these materials used in conventional buildings, but they can also be used in other types of buildings. Other substances. such as fiberglass [7], glass wool, polyethylene, expanded polystyrene, extruded polystyrene, cellulose [8], polyisocyanurate [9], mineral wool [10], wood wool [11], wood fiber [12], rock wool [13], and a variety of alternative materials can be used to improve building components’ insulation. Despite preventing heat transmission, thermal insulation materials are unable to improve building envelopes’ capacity for storing heat due to their poor thermal energy storage efficiency.
Recent studies showed the promising effect of using phase change materials (PCMs) to improve thermal performance and energy efficiency as an efficient energy conservation technique, given the significant quantity of latent heat absorbed/released [14]. This significantly lowers buildings’ cooling/heating demands, enhances thermal comfort for occupants, and plays a significant role in shifting the peak load [15]. Khan et al. [16] studied the effects of PCM placement variation; their results showed optimum energy saving when it was inserted on the inner side of building elements.
PCMs are commonly integrated in different ways into building envelopes; their uses include sandwiching between outer and inner walls, filling brick absorption into concrete, impregnation in plaster boards, and embedding in plaster and mortar [17,18,19]. Based on their chemical composition, PCMs can be divided into three subcategories: organic, inorganic, and non-organic eutectic compounds [20]. Castell et al. [21] conducted a study in Spain, which has a hot arid climate similar to the weather in Cairo, Egypt. This study induced PCMs between brick wall layers; results showed savings in electrical consumption of 15% and reduced peak temperature throughout the building. In another study, Ascione et al. [22] were able to reduce overall energy consumption in summer by 11.7% as well as decrease summer discomfort hours by 215 using a PCM layer inside the external walls of an educational building. Xie et al. [23] proposed a precise thermodynamic investigation of five PCM wallboards in Beijing, China. They concluded that increasing the latent heat does not decrease energy consumption obtained by using PCM wallboard in the summer if the phase change melting and freezing points are less than that of interior air temperature. Saffari et al. [24] used a generic optimization technique to determine an optimal melting temperature for PCM placed inside a drywall structure in climate conditions that required cooling and heating. The results showed that in climates that require a high cooling load, a PCM melting point of approximately 26 °C (a range of 24–28 °C) saves more energy, whereas in heating dominated climates, the optimal melting point is closer to 20 °C (a range of 18–22 °C).
This research aimed to study the effect of a façade’s thermal performance improvement on energy consumption for a large educational building located in a dry arid climate using polyurethane insulation material; compare its effect with that of various thicknesses of an organic PCM (RT28HC) [25]; and simulate the building using a DB simulation tool to evaluate the saving potentials for the PCM different thicknesses examined. As roofs can account for up to 32% of the horizontal surface of built-up areas and make a significant contribution to the heat gain in buildings [26], the effect of the PCM thickness in the walls and the roof on energy consumption for this building type were also analyzed in the facility under study. The building’s energy savings and CO2 emissions were subsequently studied regarding the incorporation of two types of insulation materials.

2. Materials and Methods

This study evaluated the energy consumption of the whole building at full capacity, followed by validation of actual energy consumption for the whole facility using a DB simulation tool. Next, the effects of using different thicknesses of PCM instead of traditional insulation material (50 mm thick) installed in walls were examined, followed by a parametric study of various PCM thicknesses installed in the walls and the roof. Figure 1 demonstrates the methodology implemented to reach the aim of this study.

2.1. Weather Data for the Case Study

An educational facility was used as a case study for the proposed assessment of PCM (RT28HC)’s and polyurethane insulation’s abilities to decrease heat transfer into the building and thereby decrease its energy consumption and CO2 emissions. The building is located in Cairo, one of the largest cities in Africa, and the capital city of Egypt, which lies at longitude 31°14′58.81″ E and latitude 30°3′45.47″ N [27]. According to Koeppen’s classification of climate, Egypt generally has a hot, arid desert climate, with hot steppe climate features in the northern and eastern narrow coastal sections [26]. The city of Cairo is typical of cities with arid, dry climates. Hourly weather data from the TMY (Typical Meteorological Year) prepared for Cairo, provided by ASHRAE, were used in the simulation to better represent the local weather.

2.2. Building Components

An educational building of the Arab Academy for Science, Technology and Maritime Transport (AASTMT), located in Cairo, was selected for analysis in this study (Figure 2). The case study was modeled and edited using DB software V6.1, as presented in Figure 3. All necessary data were inserted into the program. The building consists of five stories, each with a set of classrooms, offices, laboratories, and bathrooms, as demonstrated in Figure 4, Figure 5, Figure 6, Figure 7 and Figure 8. According to the actual state of the building, all design data were established using a specific inspection and selection process, and were then used as input data for the simulation model.

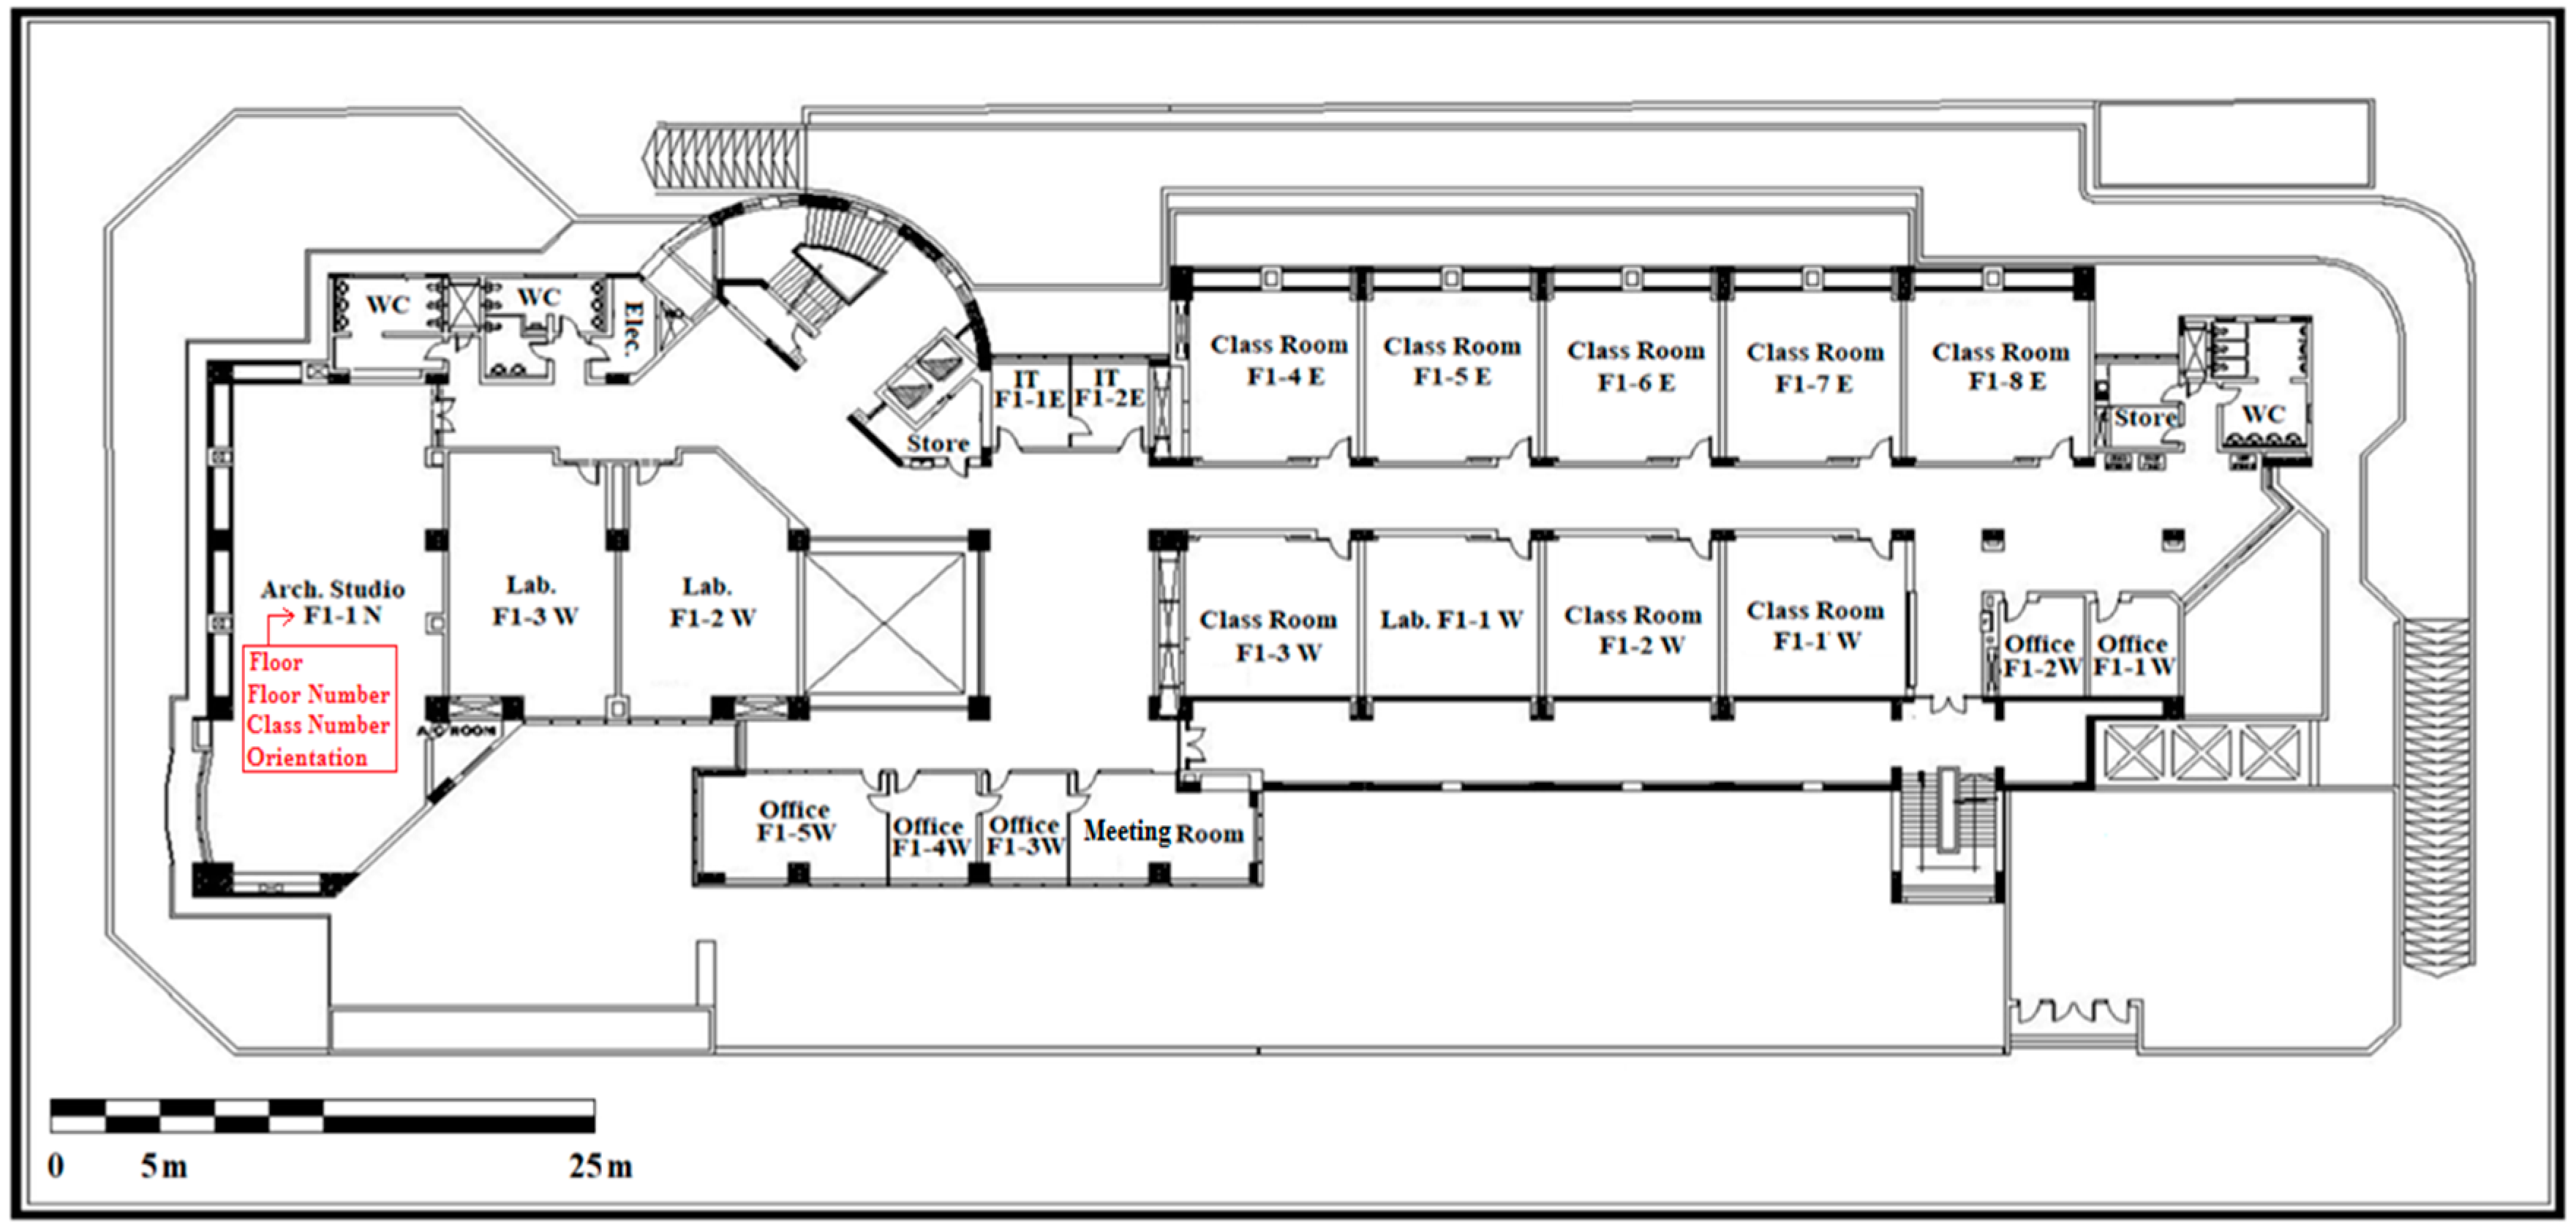
2.3. Model Data and Occupancy

The construction layers of the most effective elements of the simulated building are presented in Table 1. The glazed facades varied between a 6 mm single blue layer and 6 mm double blue layers filled with air.
The following building input data and assumptions were confirmed to be accurate. Population densities were 0.5 person per square meter for lecture rooms, 0.2 for laboratories, 0.55 for drawing halls, and 0.3 for administrative zones. The average floor area was 2400 m2. Metabolic rates differed based on location; for example, studying was assumed to have a standard metabolic rate or a light office work metabolic rate. A minimum fresh air of 12 L/s per person was available for all areas. The lighting units were set as fluorescent with a power density of 3.3 W/100 Lux. The office equipment was set to be on only in secretarial offices and printing rooms with power densities of 2.3 and 4.7 w/m2, respectively. The computers were set to be on in offices and computer labs with power densities of 5 and 30 w/m2, respectively. Energy demands differed based on a room’s function; primary, for high-use computer laboratories; medium, for office areas; and comparatively low, for lecture rooms. The HVAC device used was separated into split air conditioning units as per the specific case study situation. The time step was 5 min, the cooling temperature was 24 °C, the cooling set back temperature was 28 °C, and the infiltration rate was 0.5 ac/h. Table 2 presents the occupancy for most zones in the building.

2.4. Material Used

The first building simulation used current construction materials to validate energy consumption compared to the actual recorded readings from the measuring meters installed. The second simulation used polyurethane insulating material (one of the local materials available and approved by the Egyptian Code of practice (ECP-2010)). The PCM was placed on the innermost layers of external walls and the roof. This was followed by a set of simulations that used different thicknesses of the chosen PCM. To investigate the impact of PCM thickness (on the walls and the roof) on the building’s energy consumption, six thicknesses (6 mm, 12 mm, 18 mm, 24 mm, 30 mm, and 36 mm) were tested. The PCM was selected based on the weather conditions in Cairo that allowed melting to occur; the paraffin PCM RT28HC® is an organic PCM that is non-corrosive and compatible with other common building materials. The physical and thermal properties of this PCM are presented in Table 3.

3. Results and Discussion

Design Builder 6.1 was used to simulate different insulating materials, including current construction material, polyurethane insulating material, and PCM RT28HC with the thicknesses mentioned above. Simulation results were used to detect favorable and reliable means to reduce heat transfer into the educational building under study, and consequently reduce the electricity used and generated from non-renewable resources to try to achieve sustainability within the building’s vicinity.

3.1. Model Evaluation and Validation

It was necessary to evaluate and validate the performance of the building under investigation before testing the effect of insulating materials for energy consumption saving purposes.
Figure 9, Figure 10, Figure 11 and Figure 12 present the types of rooms and their associated energy consumptions as recorded for each floor to evaluate the full capacity scenario of the building and compare the energy consumption of each zone type. Despite having the same capacity and area, Figure 9 shows that classrooms used various amounts of energy due to variations in orientation; as a result, it is proposed that the scheduling of classes should prioritize classrooms with lower energy consumption.
Despite the fact that all drawing halls had roughly equal capacities and areas, given the electrical consumption displayed in Figure 10, it is suggested that scheduling units prioritize drawing halls that had lower energy consumption due to their orientation towards the north, such as F1-1N, F2-1N, and F3-2N.
Various laboratory activities had a substantial influence on the amount of energy consumed due to different electrical devices present and according to their purposes (electrical, mechanical, chemical, and computer labs). Consequently, it would be advisable to locate labs with higher energy consumption (such as computer labs) in rooms F4-2W, F4-3E, and F1-1W, which used less energy, as shown in Figure 11.
Facilities located on the ground floor received less natural lighting. For that reason, electrical lamps could be turned on for over 12 h; thus, ground floor facilities consumed the highest amount of energy compared to the rest of the building’s facilities. Figure 12 demonstrates the annual energy consumed per area for facilities located on the ground floor and the consumption percentage of the building’s total energy consumption. The results show that the conference hall used less energy while having a large occupancy capacity, whereas the indoor restaurant, kitchen, library, and teaching assistant rooms used more electricity because they were used more frequently throughout the year and had highly powered electrical devices.

Model Validation

Several tests were carried out to ensure the accuracy of the building model with respect to interior spaces to prevent errors during the simulation. The reference building was modeled first for validation before testing the effect of the other proposed insulating materials.
The total energy consumption of the base model, which depends fully on electricity, was determined for validation using actual electricity bills and the building’s schedules for 2021, as shown in Figure 13, which presents acceptable monthly errors that did not surpass 9% of the actual values. Any experimental study must include error analysis; therefore, it was essential to calculate the error for all measures. The computed root mean square error (RMSE) was 0.2364, which was considered acceptable.

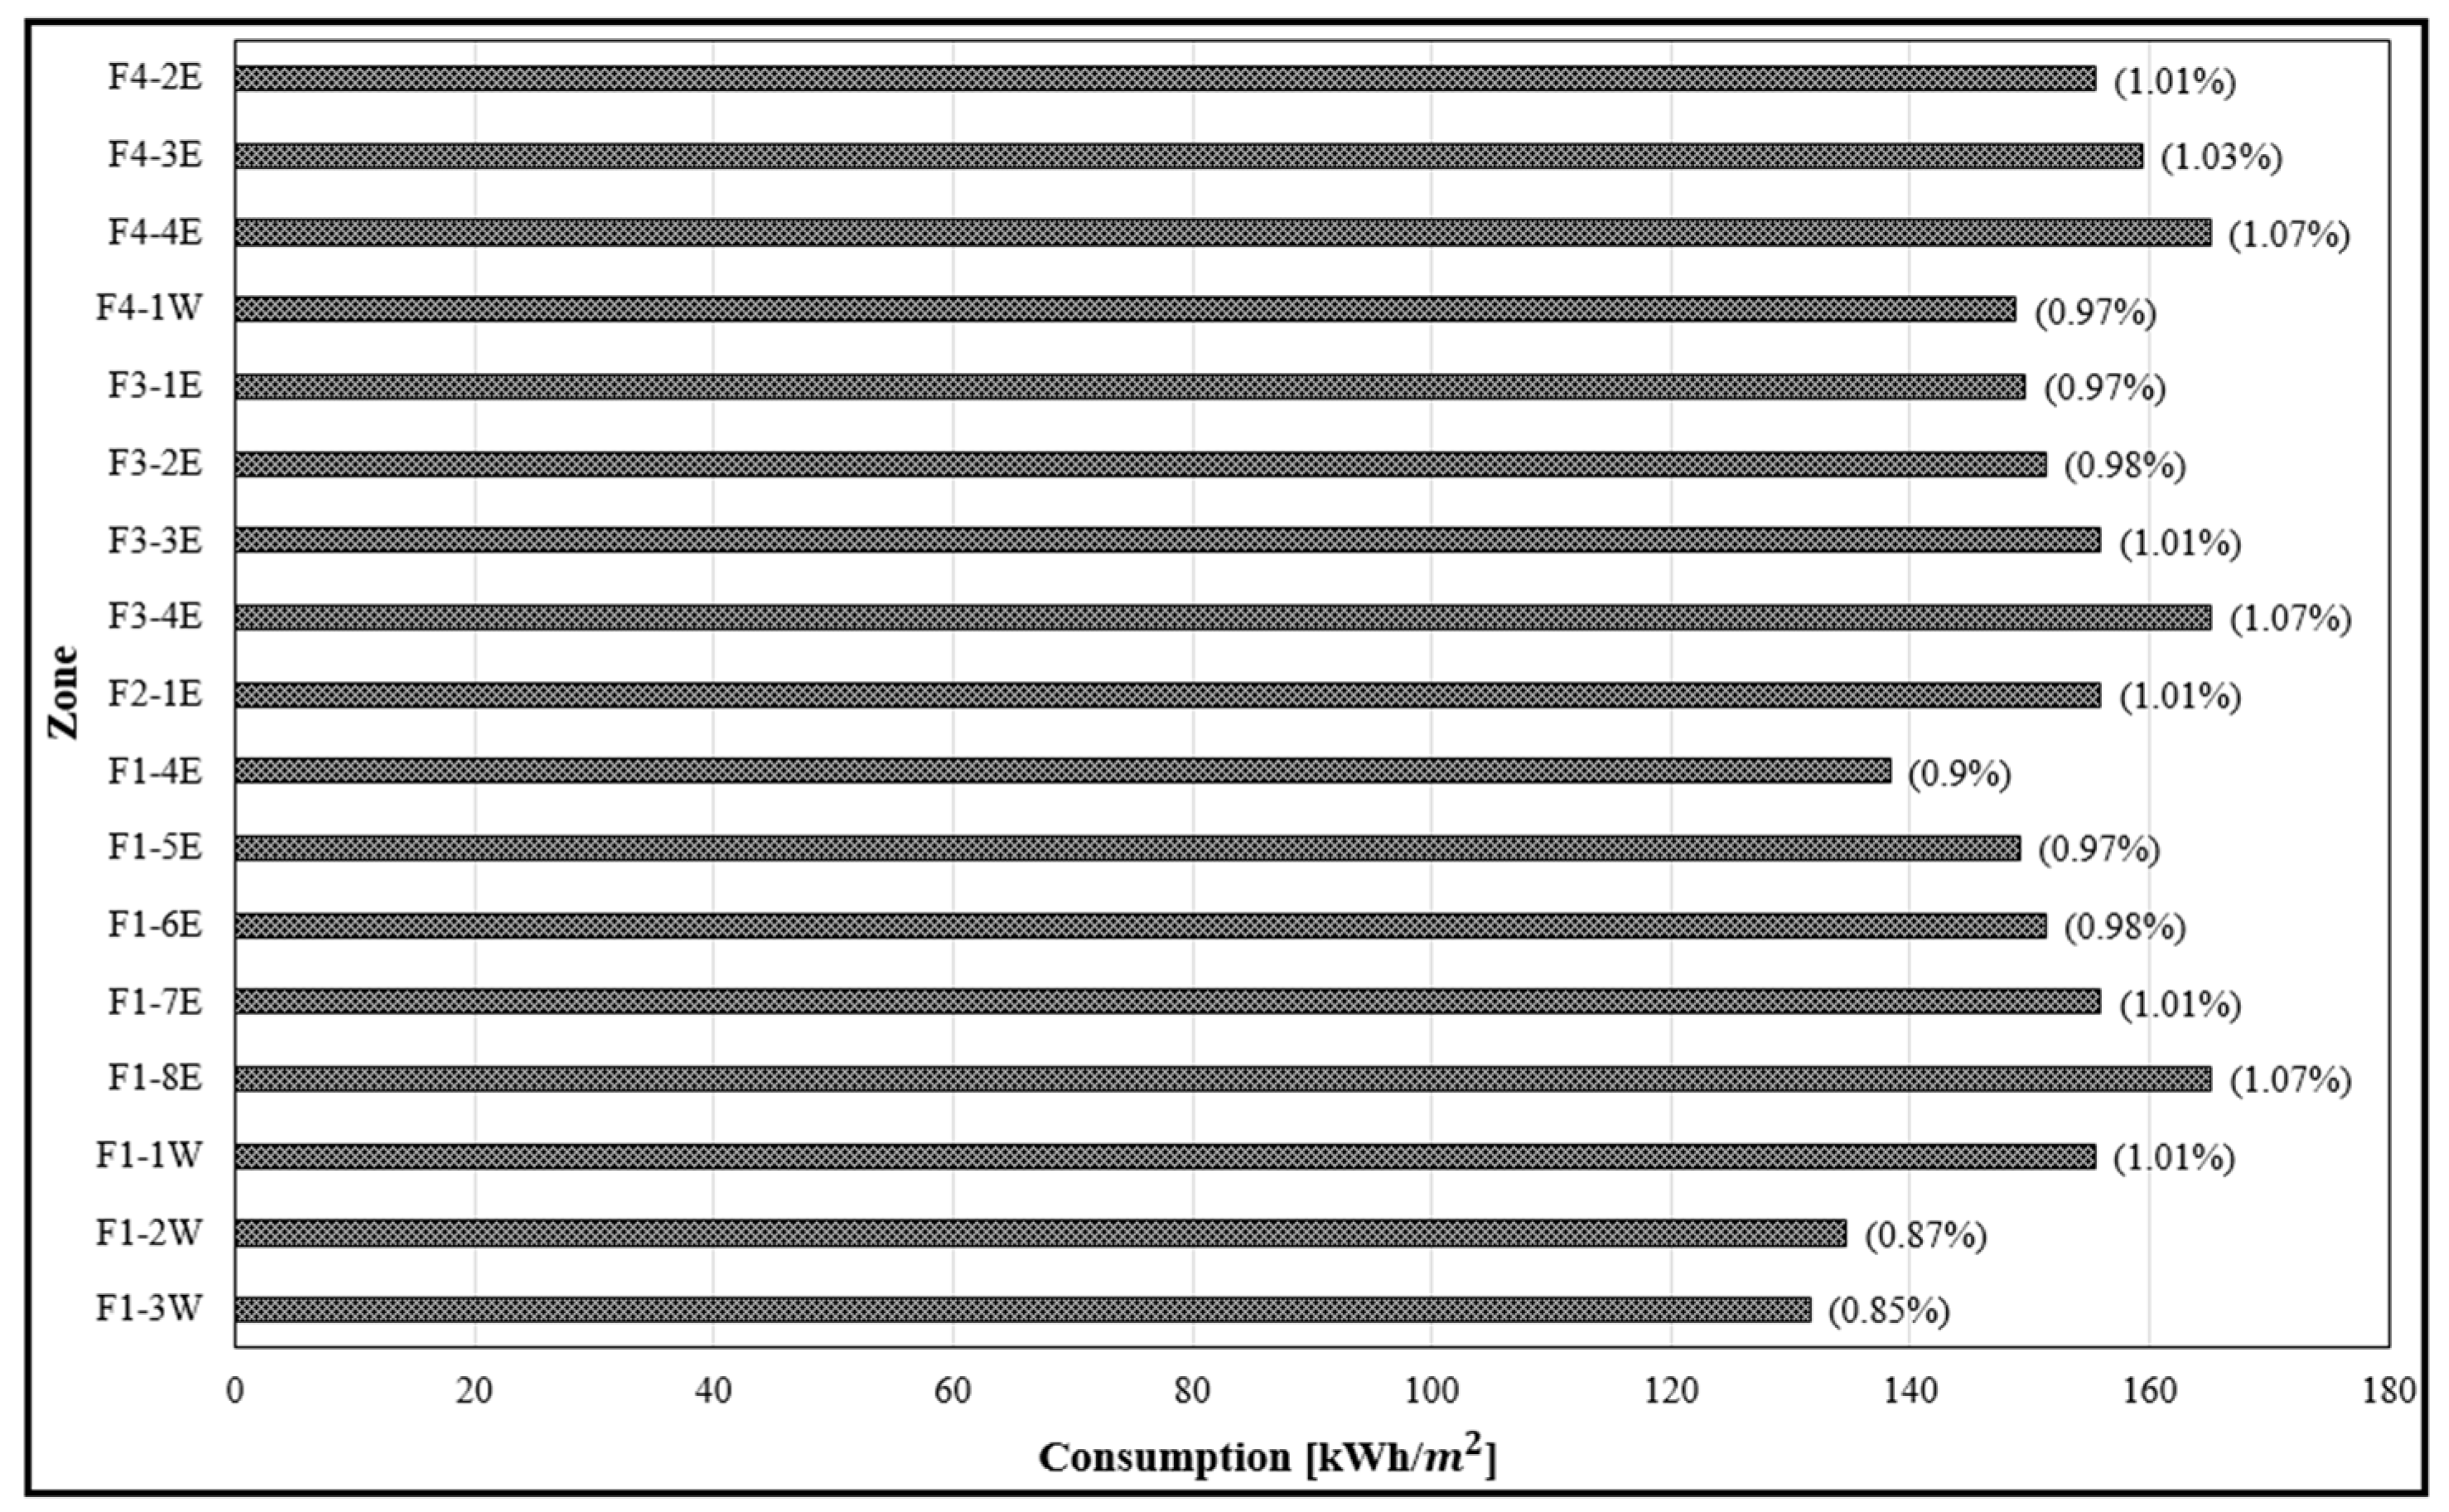
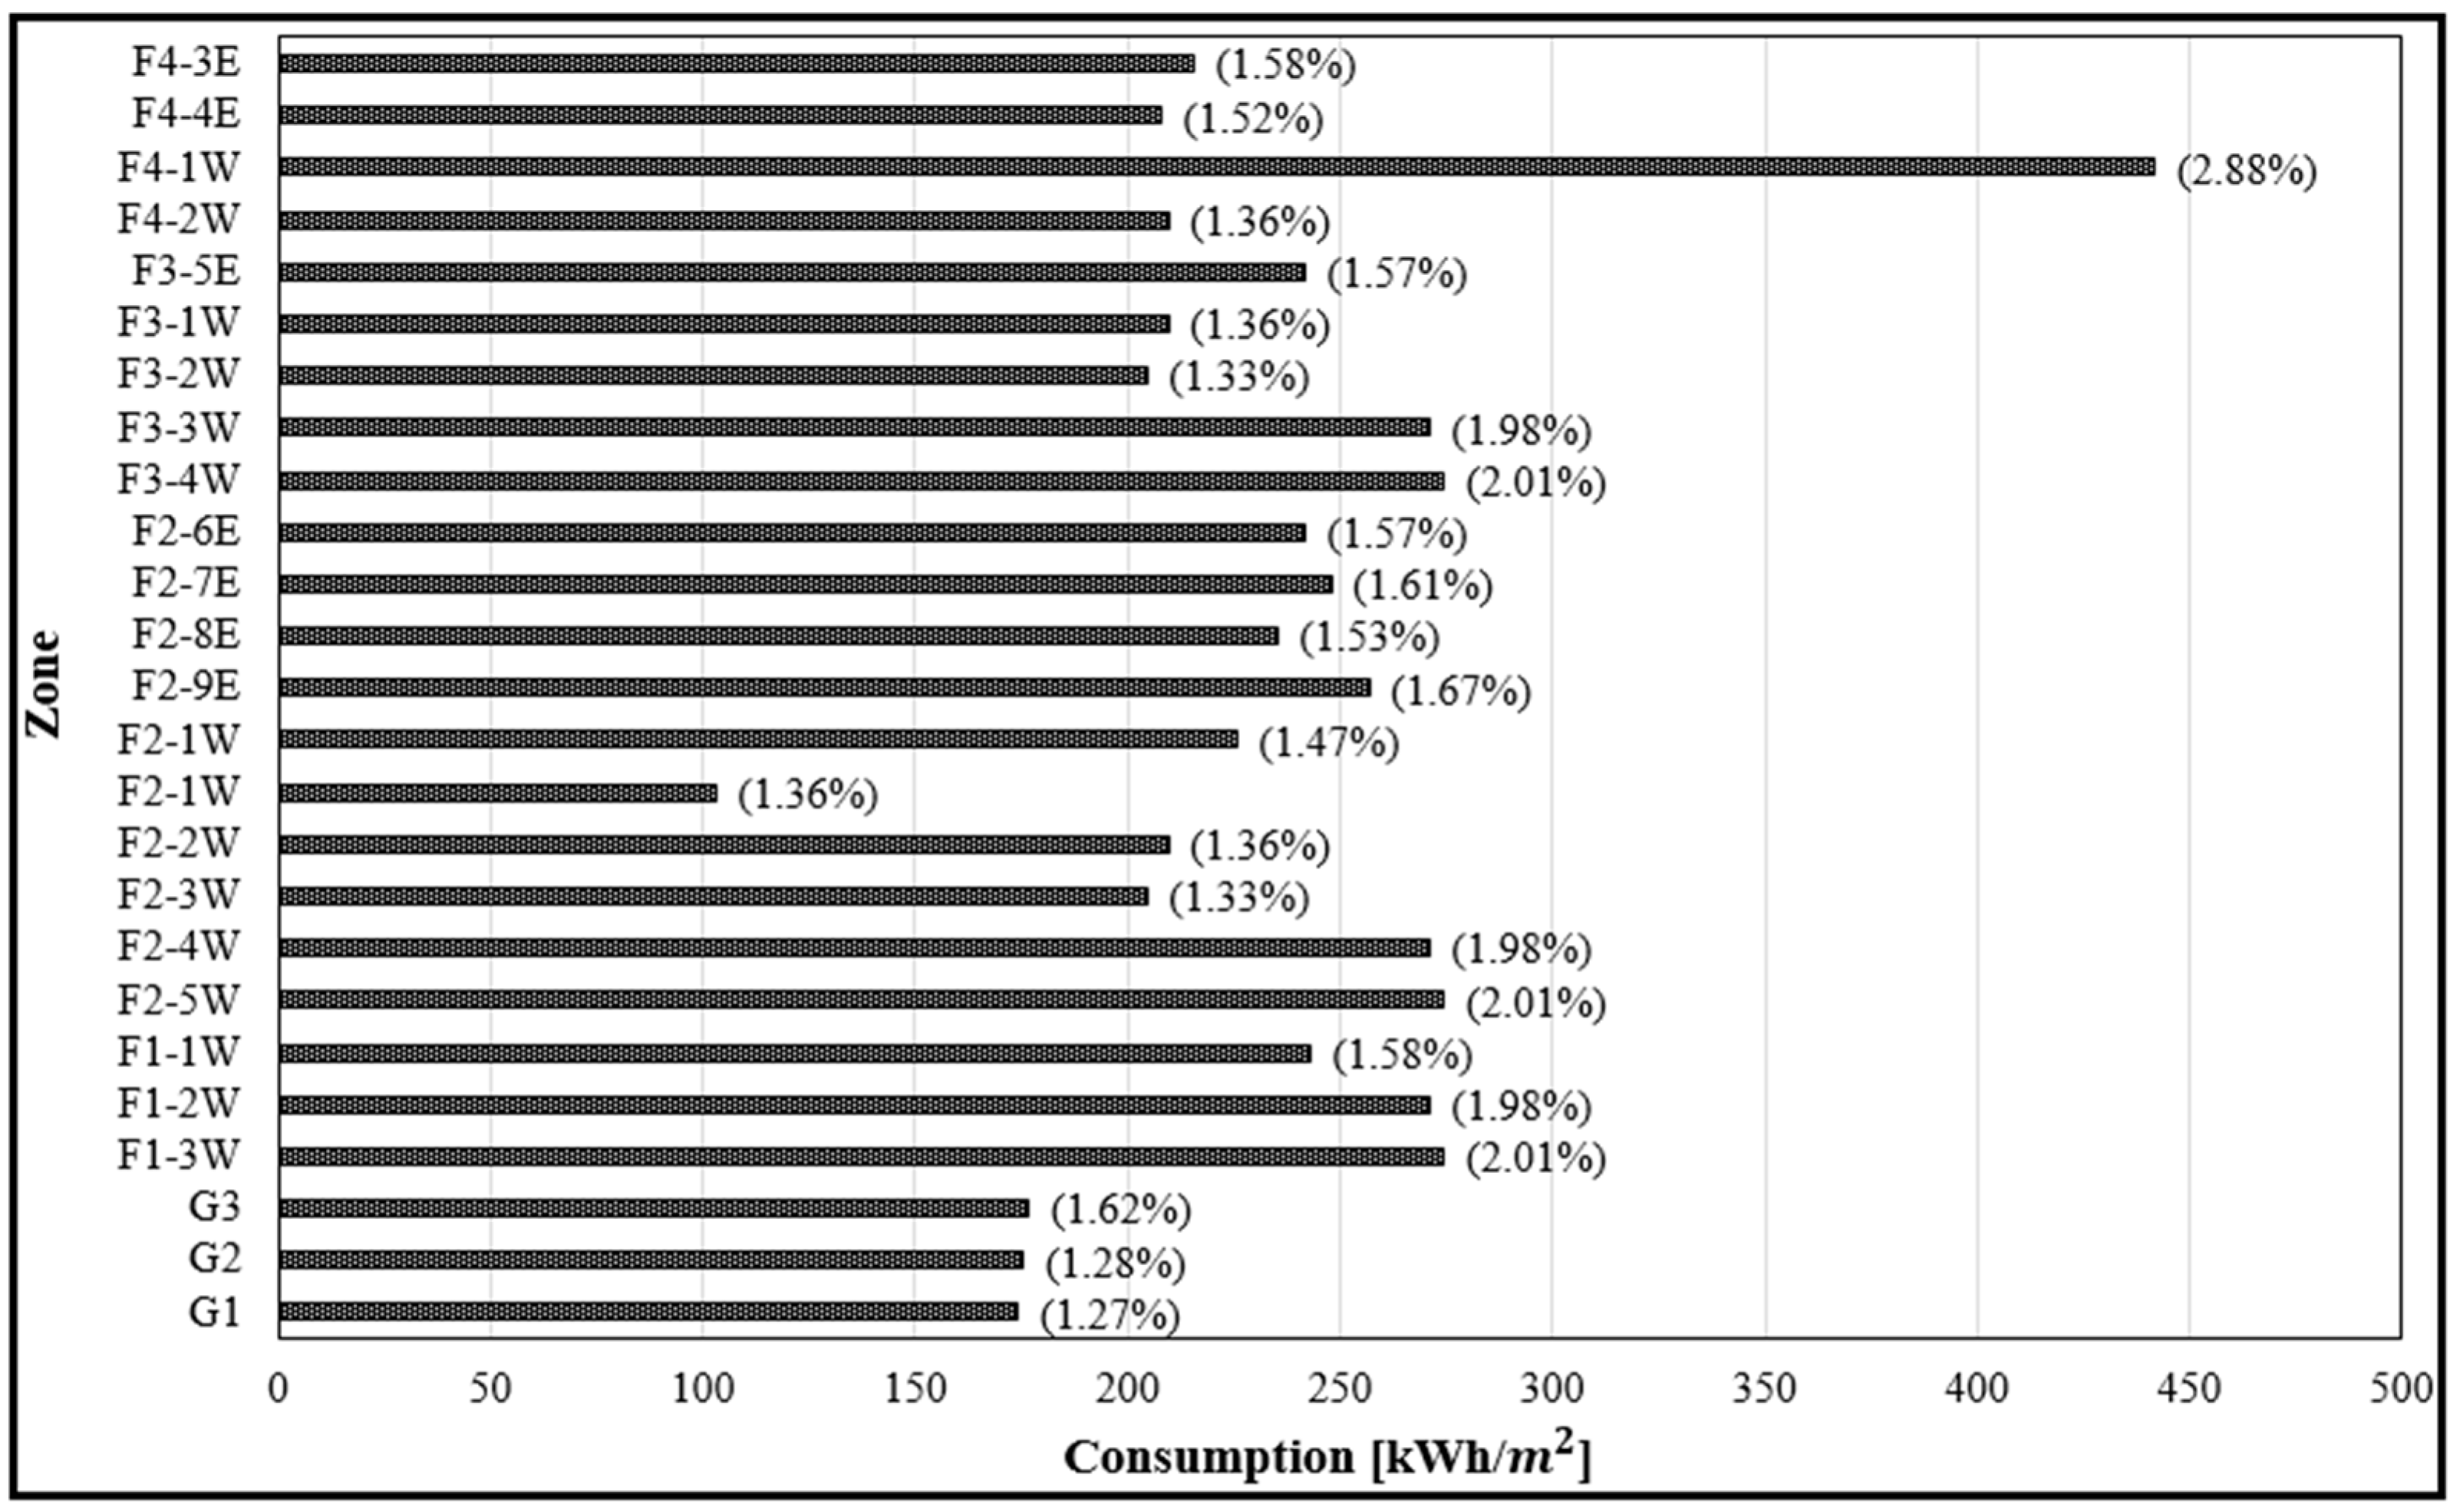
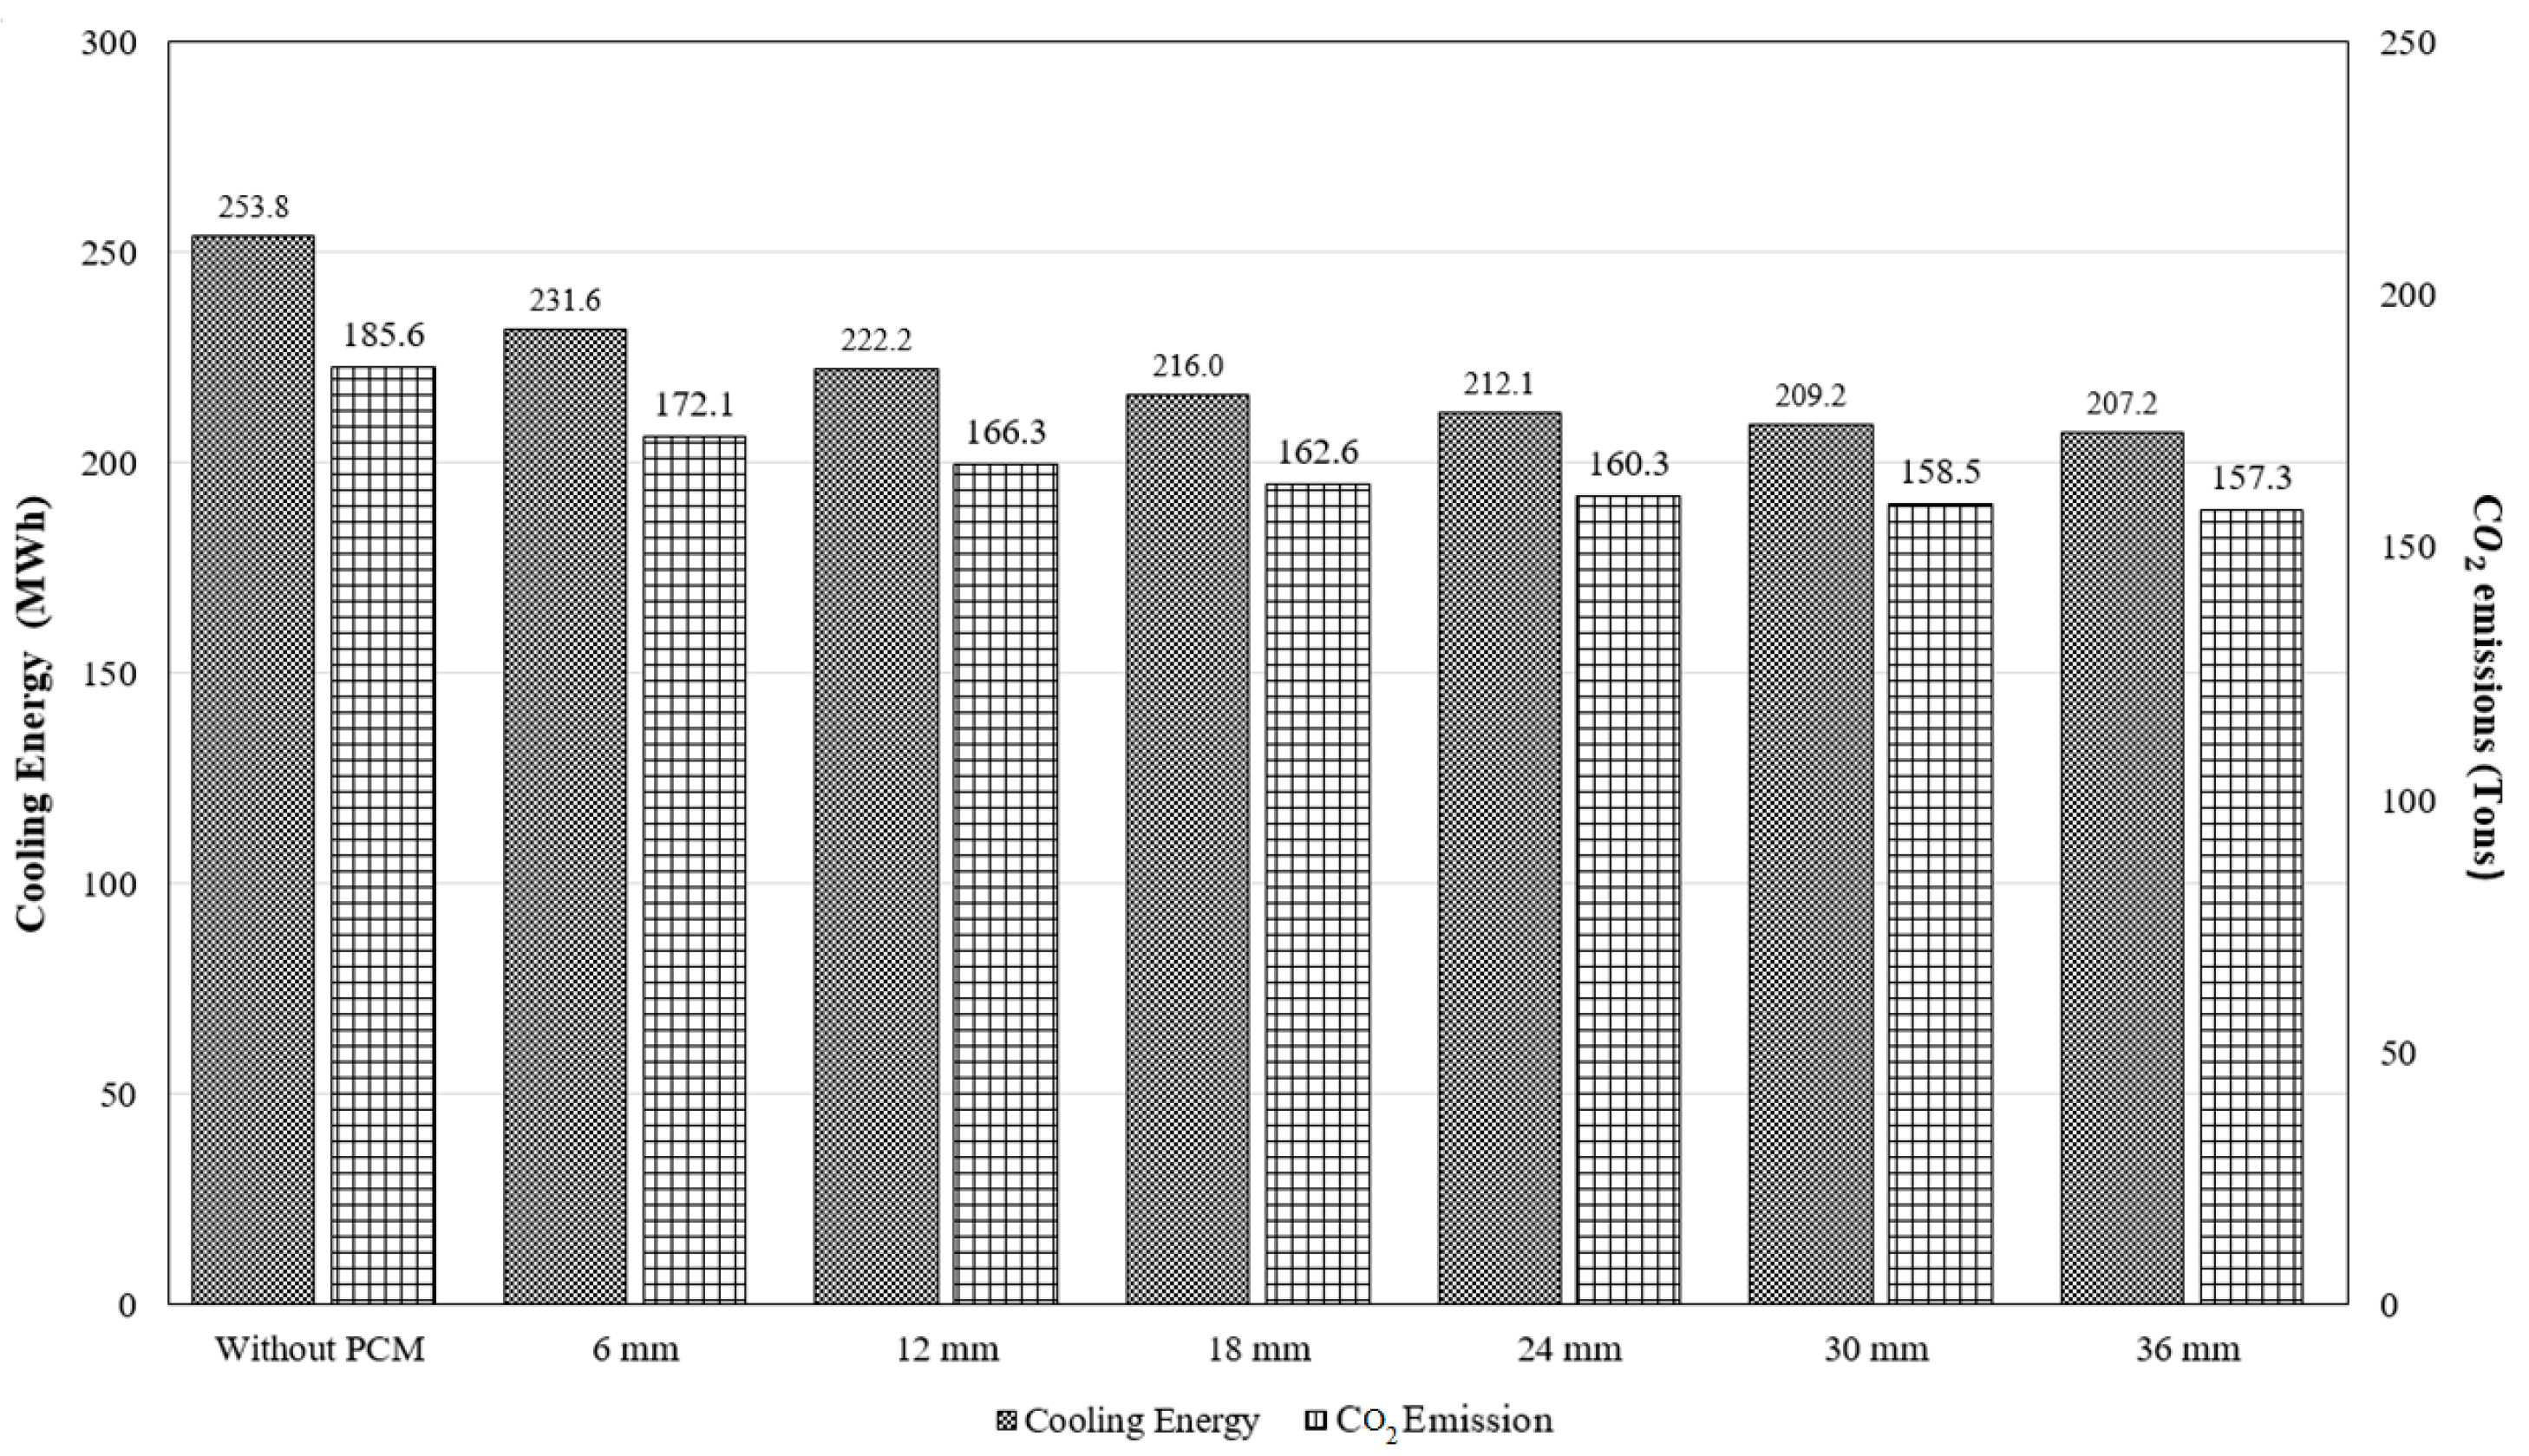
3.2. Cooling Demand Efficiency and CO2 Emissions

Energy consumed by the building, which depends on electricity, was validated before using official recorded electricity bills to ensure accuracy. Although total energy consumption was validated, this paper focused on calculating cooling demand, which shows the thermal effect of the studied wall profile in compliance with the nature of Egypt’s climatic conditions. Cooling demand was calculated for the three wall profiles (Figure 14) and different thicknesses of PCM used for both walls and the roof (Figure 15) over the four hot months (June–September) using the VAV system, which is a module of Energy Plus. The VAV system improved the indoor temperature to meet the indoor thermal comfort level by changing the supplied air temperature; Design Builder software can model and simulate PCMs directly, and owns Energy Plus as a computation kernel. Energy Plus can calculate the performance of a PCM using a finite difference algorithm. As shown in Figure 14, the PCM had a better performance compared to the polyurethane insulation material due to the PCM’s thermal energy storage. For the PCM, the ambient temperature range was crucial to the effectiveness of energy conservation. In order to increase energy efficiency in summer, when latent heat affects the temperature time lag, it was necessary to lower the rates of heat transfer through PCM-integrated elements.
CO2 emissions are often a significant result of burning fossil fuels to generate energy. Each material’s use was measured in terms of the building’s CO2 emissions in tons, as shown in Figure 14 and Figure 15. Figure 14 presents the significant effect of using PCM to reduce energy consumption. The cooling energy consumed without a PCM was 253.8 MWh, versus 207 MWh when 36 mm thick PCM was used. Moreover, CO2 emissions decreased from 185.6 tons to 157.3 tons. Notably, increasing the PCM’s thickness more than 18 mm added almost no value, as the increase in the PCM utilization ratio was unnoticeable.
Figure 16 shows the cooling energy saving efficiency for the studied wall profiles in the summer months, and Figure 17 shows the cooling energy saving efficiency for the studied PCM thicknesses in the walls and roof; energy saving efficiency was calculated using Equation (1).
Energy   saving   efficiency = E base   case E selected   case   E base   case
where E base case = energy consumption of the reference model, and E selected case = energy consumption of the various cases.
A PCM applied to an exterior wall improved energy saving efficiency, which reached up to 20% in June. However, the efficiency of polyurethane integrated with a wall profile was only 15.7% during same month, a slightly good efficiency given the large size of the building. For varied thicknesses of PCM in opaque elements (wall profiles and the roof), the 30 mm thickness’ efficiency almost equaled that of 50 mm thick PCM in walls during summer, as roofs transmit a significant amount of heat.

4. Conclusions

The objectives of this study were to evaluate the energy consumption of an educational facility in a dry, arid climate; recommend occupancy priorities by scheduling unit; compare the efficiency of three wall profiles in Cairo during the summer season; and obtain the maximum thermoregulation and energy efficiency measured using Design Builder to provide thermal comfort. These investigations provided an exhaustive study in the summer months depending on energy cooling, cooling energy consumption reductions, and CO2 emissions for the building as a whole. Often this led to a potential reduction in energy consumption for the entire building using the selected PCM.
The results show the importance of considering the energy evaluation of each zone in the building at full capacity status. The obtained results could be a guide for future academic scheduling; thus, more energy savings for the educational facility could be achieved.
Moreover, different thicknesses of PCM were investigated in wall profiles and the roof. Compared to the reference model, the cooling demand efficiency at 6 mm, 12 mm, 18 mm, 24 mm, and 36 mm PCM thicknesses were 9.20%, 13.3%, 16.00%, 17.50%, 18.8%, and 19.70%, respectively; this highlights the effect of PCM thickness on the cooling energy consumed.
Our results indicated that increasing PCM thickness more than 18 mm added almost no value, as the increase in the PCM utilization ratio was unnoticeable. However, increasing the PCM thickness increased the cooling energy efficiency. To help make a reliable recommendation, this study was followed up with an environmental impact (CO2) assessment, which validated our results. Therefore, a PCM thickness up to 18 mm is recommended for educational facilities in Cairo.

5. Recommendation and Future Work

PCMs have shown very promising results in energy reduction in various types of buildings in different climatic conditions. In Egypt, various trials have produced such a material; however, further research is needed to produce a product with efficient energy reduction capabilities that can help reduce carbon dioxide emissions (especially in hot, arid regions) and achieve a sustainable environment. On the other hand, to lower investment costs and make using this insulation material economically viable, further research should concentrate on the industrial development of a low-cost PCM.

Author Contributions

Conceptualization, A.M.B. (Ahmed M. Bolteyaand) and M.A.E.; Methodology, A.M.B. (Ahmed M. Bolteyaand); Software, A.M.B. (Ahmed M. Bolteyaand); Validation, A.M.B. (Ahmed M. Bolteyaand); Formal analysis, O.D.E.M.; Investigation, A.M.B. (Ahmed M. Bolteyaand); Data curation, M.A.E.; Writing—original draft, A.M.B. (Ahmed M. Bolteyaand) and O.D.E.M.; Writing—review & editing, M.A.E., O.D.E.M. and A.M.B. (Adel M. Belal); Supervision, M.A.E., O.D.E.M. and A.M.B. (Adel M. Belal). All authors have read and agreed to the published version of the manuscript.

Funding

This research received no external funding.

Institutional Review Board Statement

Not applicable.

Informed Consent Statement

Not applicable.

Data Availability Statement

Data are available from the corresponding author with the permission of the College of Engineering and Technology, Arab Academy for Science, Technology and Maritime Transport.

Conflicts of Interest

The authors declare no conflict of interest.

Abbreviations

PCMPhase Change Material
ASHRAEAmerican Society of Heating, Refrigerating and Air-Conditioning Engineers
AASTMTArab Academy for Science, Technology and Maritime Transport
CO2Carbon Dioxide
GHGsGreenhouse Gases
°CDegree(s) Celsius
TMYTypical Meteorological Year
DBDesign Builder
GGround
FFloor
ECPEgyptian Code of Practice
ac/hAir Changes Per Hour
kWhKilowatt-hour
RMSERoot Mean Square Error

References

  1. Where does Our Electricity Come From? World Nuclear Association. Available online: https://www.world-nuclear.org/nuclear-essentials/where-does-our-electricity-come-from.aspx (accessed on 10 November 2022).
  2. Waqas, A.; Ud Din, Z. Phase change material (PCM) storage for free cooling of buildings—A review. Renew. Sustain. Energy Rev. 2013, 18, 607–625. [Google Scholar] [CrossRef]
  3. Nitu, M.A.; Gocer, O.; Wijesooriya, N.; Vijapur, D.; Candido, C. A Biophilic Design Approach for Improved Energy Performance in Retrofitting Residential Projects. Sustainability 2022, 14, 3776. [Google Scholar] [CrossRef]
  4. Egypt|Economic Indicators, Historic Data & Forecasts|CEIC. Available online: https://www.ceicdata.com/datapage/en/country/egypt (accessed on 10 November 2022).
  5. Monforti-Ferrario, F.; Oreggioni, G.; Schaaf, E.; Guizzardi, D.; Olivier, J.G.J.; Solazzo, E.; Lo Vullo, E.; Crippa, M.; Muntean, M.; Joint Research Centre (European Commission); et al. Fossil CO2 and GHG Emissions of All World Countries: 2019 Report; LU: Publications Office of the European Union: Luxembourg, 2019. [Google Scholar] [CrossRef]
  6. Solomon, S. Intergovernmental Panel on Climate Change, and Intergovernmental Panel on Climate Change. In Climate Change 2007: The Physical Science Basis: Contribution of Working Group I to the Fourth Assessment Report of the Intergovernmental Panel on Climate Change; Cambridge University Press: Cambridge, NY, USA, 2007. [Google Scholar]
  7. Al-Sallal, K.A. Comparison between polystyrene and fiberglass roof insulation in warm and cold climates. Renew. Energy 2003, 28, 603–611. [Google Scholar] [CrossRef]
  8. Hill, C.; Norton, A.; Dibdiakova, J. A comparison of the environmental impacts of different categories of insulation materials. Energy Build. 2018, 162, 12–20. [Google Scholar] [CrossRef]
  9. Makaveckas, T.; Bliūdžius, R.; Burlingis, A. Determination of the impact of environmental temperature on the thermal conductivity of polyisocyanurate (PIR) foam products. J. Build. Eng. 2021, 41, 102447. [Google Scholar] [CrossRef]
  10. Miskinis, K.; Dikavicius, V.; Buska, A.; Banionis, K. Influence of EPS, mineral wool and plaster layers on sound and thermal insulation of a wall: A case study. Appl. Acoust. 2018, 137, 62–68. [Google Scholar] [CrossRef]
  11. Prakash, D. Transient analysis and improvement of indoor thermal comfort for an air-conditioned room with thermal insulations. Ain Shams Eng. J. 2015, 6, 947–956. [Google Scholar] [CrossRef] [Green Version]
  12. Fornés, I.V.; Vaičiukynienė, D.; Nizevičienė, D.; Tamošaitis, G.; Pupeikis, D. The improvement of the thermal and acoustic insulation properties of phosphogypsum specimens by adding waste wood fibre. Constr. Build. Mater. 2022, 331, 127341. [Google Scholar] [CrossRef]
  13. Yilmaz, E.; Aykanat, B.; Çomak, B. Environmental life cycle assessment of rockwool filled aluminum sandwich facade panels in Turkey. J. Build. Eng. 2022, 50, 104234. [Google Scholar] [CrossRef]
  14. Du, K.; Calautit, J.; Wang, Z.; Wu, Y.; Liu, H. A review of the applications of phase change materials in cooling, heating and power generation in different temperature ranges. Appl. Energy 2018, 220, 242–273. [Google Scholar] [CrossRef]
  15. De Gracia, A.; Cabeza, L.F. Phase change materials and thermal energy storage for buildings. Energy Build. 2015, 103, 414–419. [Google Scholar] [CrossRef] [Green Version]
  16. Khan, M.; Khan, M.M.; Irfan, M.; Ahmad, N.; Haq, M.A.; Khan, I.; Mousa, M. Energy performance enhancement of residential buildings in Pakistan by integrating phase change materials in building envelopes. Energy Rep. 2022, 8, 9290–9307. [Google Scholar] [CrossRef]
  17. De Gracia, A. Dynamic building envelope with PCM for cooling purposes—Proof of concept. Appl. Energy 2019, 235, 1245–1253. [Google Scholar] [CrossRef]
  18. Tyagi, V.; Kaushik, S.; Tyagi, S.; Akiyama, T. Development of phase change materials based microencapsulated technology for buildings: A review. Renew. Sustain. Energy Rev. 2011, 15, 1373–1391. [Google Scholar] [CrossRef]
  19. Ručevskis, S.; Akishin, P.; Korjakins, A. Parametric analysis and design optimisation of PCM thermal energy storage system for space cooling of buildings. Energy Build. 2020, 224, 110288. [Google Scholar] [CrossRef]
  20. Baetens, R.; Jelle, B.P.; Gustavsen, A. Phase change materials for building applications: A state-of-the-art review. Energy Build. 2010, 42, 1361–1368. [Google Scholar] [CrossRef] [Green Version]
  21. Castell, A.; Martorell, I.; Medrano, M.; Pérez, G.; Cabeza, L.F. Experimental study of using PCM in brick constructive solutions for passive cooling. Energy Build. 2010, 42, 534–540. [Google Scholar] [CrossRef]
  22. Ascione, F.; Bianco, N.; De Masi, R.F.; Mastellone, M.; Vanoli, G.P. Phase Change Materials for Reducing Cooling Energy Demand and Improving Indoor Comfort: A Step-by-Step Retrofit of a Mediterranean Educational Building. Energies 2019, 12, 3661. [Google Scholar] [CrossRef] [Green Version]
  23. Xie, J.; Wang, W.; Liu, J.; Pan, S. Thermal performance analysis of PCM wallboards for building application based on numerical simulation. Sol. Energy 2018, 162, 533–540. [Google Scholar] [CrossRef]
  24. Saffari, M.; de Gracia, A.; Fernández, C.; Cabeza, L.F. Simulation-based optimization of PCM melting temperature to improve the energy performance in buildings. Appl. Energy 2017, 202, 420–434. [Google Scholar] [CrossRef] [Green Version]
  25. Bolteya, A.M.; Elsayad, M.A.; Belal, A.M. Thermal efficiency of PCM filled double glazing units in Egypt. Ain Shams Eng. J. 2021, 12, 1523–1534. [Google Scholar] [CrossRef]
  26. Oberndorfer, E.; Lundholm, J.; Bass, B.; Coffman, R.R.; Doshi, H.; Dunnett, N.; Gaffin, S.; Köhler, M.; Liu, K.K.Y.; Rowe, B. Green Roofs as Urban Ecosystems: Ecological Structures, Functions, and Services. Bioscience 2007, 57, 823–833. [Google Scholar] [CrossRef]
  27. Cairo Latitude Longitude. Available online: https://latitudelongitude.org/eg/cairo/ (accessed on 14 September 2022).
  28. Rubitherm GmbH. Available online: https://www.rubitherm.eu/en/index.php/productcategory/organische-pcm-rt (accessed on 10 September 2022).
Figure 1. Research methodology flowchart.
Sustainability 14 15956 g001
Figure 2. The investigated educational facility in Cairo, Egypt.
Sustainability 14 15956 g002
Figure 3. A 3D model of the educational facility under study.
Sustainability 14 15956 g003
Figure 4. Ground floor plan.
Sustainability 14 15956 g004
Figure 5. First floor plan.
Sustainability 14 15956 g005
Figure 6. Second floor plan.
Sustainability 14 15956 g006
Figure 7. Third floor plan.
Sustainability 14 15956 g007
Figure 8. Fourth floor plan.
Sustainability 14 15956 g008
Figure 9. Annual energy consumption per area for all classrooms and consumption percentage of the building’s total energy consumption.
Sustainability 14 15956 g009
Figure 10. Annual energy consumption per area for drawing halls and consumption percentage of the building’s total energy consumption.
Sustainability 14 15956 g010
Figure 11. Annual energy consumption per area for laboratories and consumption percentage of the building’s total energy consumption.
Sustainability 14 15956 g011
Figure 12. Annual energy consumption per area for facilities and consumption percentage of the building’s total energy consumption.
Sustainability 14 15956 g012
Figure 13. Simulated and actual electricity consumption of the building.
Sustainability 14 15956 g013
Figure 14. Cooling energy consumption and CO2 emissions during the summer months.
Sustainability 14 15956 g014
Figure 15. Cooling energy consumption and CO2 emissions during the summer months.
Sustainability 14 15956 g015
Figure 16. Cooling energy efficiency of the investigated wall profiles during the summer.
Sustainability 14 15956 g016
Figure 17. Cooling energy efficiency of the investigated PCM in walls and the roof during the summer.
Sustainability 14 15956 g017
Table 1. Construction of the building envelope’s main components.
LayersRoof (cm)Typical Slab (cm)External Walls (cm)
Layer No. 15 concrete tiles5 concrete tiles3 plaster (light weight)
Layer No. 23 sand stone6 sand stone10 brick
Layer No. 35 extruded polystyrene25 concrete cast5 cavity
Layer No. 425 concrete cast3 gypsum plastering10 brick
Layer No. 53 gypsum plastering-3 plaster (light weight)
U Value(w/m2 k)0.391.180.5
Table 2. Total number of hours of occupancy per room type in the building.
Working h/Month
Classes250
Laboratories134
Drawing Halls288
Library192
Offices192
Cafeteria288
T.A. Room208
Conference Hall and Meeting Rooms64
Table 3. Physical and thermal properties of the PCM [28].
PropertyValue
Melting/Congealing area27–29 °C
Latent heat capacity ± 7.5%250 kJ kg−1
Specific heat capacity2 kJ kg−1 K−1
Solid phase density880 kg m−3
Liquid phase density770 kg m−3
Thermal conductivity0.2 W m−1 K−1
Volume expansion %12.5
Flash point165 °C
Kinematic viscosity at 50 °C25.71 × 10−6 m s−1
Publisher’s Note: MDPI stays neutral with regard to jurisdictional claims in published maps and institutional affiliations.

