Article

Sustainable Power Generation Using Archimedean Screw Turbine: Influence of Blade Number on Flow and Performance

by
Erinofiardi Erinofiardi
1,2,
Ravi Koirala
2,
Nirajan Shiwakoti
2,* and
Abhijit Date
2,*
1
Department of Mechanical Engineering, Faculty of Engineering, University of Bengkulu, Bengkulu 38171, Indonesia
2
School of Engineering, RMIT University, Melbourne, VIC 3001, Australia
*
Authors to whom correspondence should be addressed.
Sustainability 2022, 14(23), 15948; https://doi.org/10.3390/su142315948
Submission received: 27 October 2022 / Revised: 17 November 2022 / Accepted: 24 November 2022 / Published: 30 November 2022
(This article belongs to the Section Energy Sustainability)

Abstract

:
Hydropower has been one of the mature renewable energy systems encompassing a major fraction of renewable energy. Archimedean screw turbines are gaining new interest in hydropower generation that are suitable for low head applications. This paper empirically and experimentally studies the flow inside Archimedean screw turbines along with the influence of blade numbers on their performance. The major objective of this work is to investigate performance and conduct design optimization of a screw turbine operating under ultra-low head (<0.2 m) conditions. Experimentally verified empirical results show its reliability in estimating the performance of turbines at low operational speeds. Further, the results show that with the increasing number of blades, the efficiency and power generation capacity can be increased, but the overall performance improvement relative to one blade turbine peaks at around 7 blades. Increasing the power generation capacity can in turn make the turbine compact and could be fabricated at a low-cost.

1. Introduction

Abundant sources of renewable energy and decreasing sources of fossil fuels encourage the switching of our power generation to renewable energies. Hydropower is a clear example of renewable energy, and its possible usage for future power generation cannot be overlooked. Energy from moving water is cheap, environmentally friendly, and very important for the future. However, most of the available hydro energy potential is under-utilized. The high initial investment required is recognized as the main reason for the lack of development of large reservoirs and power plants, and the second major justification is that the construction of dams is not ecologically sustainable [1,2]. Micro-hydropower could be a viable alternative to solve this problem. Micro hydropower is the power generation from flowing water by using turbines, with a capacity range from 10 kW to 500 kW. Micro hydropower generation in rural areas would help to decentralize power supply and energy needs. It is often the most economical choice for electrification of remote areas, particularly in developing countries [3].
Electricity use plays a significant role in economic development and in raising living standards [4]. Renewable energy should be an optimal source of electricity and should have a minimal environmental impact [5]. It was shown that one-third of the population around the world does not have reliable electricity but does have access to moving water. Many rural communities have a low standard of living, poor education, and no access to information. Despite the efforts to electrify remote areas, development and success rate remain poor. Bad preparation, lack of study, and negligence are among the factors that lead to the delay in the deployment of rural electrification [6].
The provision of electricity is crucial in improving the living standards of rural residents. However, the energy demands for amenities such as lighting, television, etc., required by small remote communities are relatively low. Some simple approaches, including diesel generators, grid extension, or small green energy systems, maybe a solution for rural electrification. Owing to low demand and low load factors, however, the grid-extension solution for remote areas is not considered economical. This is an unattractive choice in terms of supply, as most rural communities are poor and thus unable to fund electricity [7]. Diesel power generation is currently the most popular in remote communities. However, this choice remains more unsustainable for remote area residents because of high fuel prices and problems in fuel distribution to rural locations.
Indonesia is one of the countries around the globe that faces an electricity supply shortage in rural villages. Meanwhile, the gross hydropower potential of Indonesia is in the top 10 countries around the world (number 8th on the list, between Columbia and India), with 477 TWh of hydropower potential [8]. Indonesia has many rural areas with renewable energy sources, but it still has problems meeting the demand for energy for sustainable development. Indonesia heavily depends on energy from fossil fuels which is around 89% (16.7% fuel, 49% coal, and 23% gas), and the use of renewable energy resources in electricity production is only in a limited amount [9]. A large amount of micro hydro potential is still unexploited in Indonesia [1,10]. Meanwhile, many rivers in Indonesia can generate hydroelectric power [1,10].
Screw turbines are one of the oldest hydropower technologies for micro-hydro applications. Due to simple design, low head application, and aquatic-friendly operation [11,12,13], they have been used for isolated power generation in rivers and creeks. The first attempt to model the power output of an Archimedes Screw turbine used a simplified two-dimensional geometry of the screw’s helical planes [14]. Disregarding losses of hydraulic energy and mechanical frictional losses from rotational motion, the model was assumed to have steady-state flow conditions. In the model, the torque generation was due to the hydrostatic pressure difference between the upstream and downstream sides of the blade created by the water trapped in the buckets. They developed a simple model for the screw turbine, idealizing the blades of the turbine as transfer weirs. They concluded that screw turbine performance is influenced by mechanical losses and the geometry of the turbine. The efficiency of the turbine will increase with an increased number of blades (N) and at a lower installation angle (β).
Rorres [15] sets out an analytical approach to optimize the configuration for pumping applications of an Archimedes screw geometry. This issue is described as optimizing the amount of water that can be raised at any turn of the Archimedes screw pumps. He claimed that the geometry of the screw pump consists of certain external parameters typically determined by the position of the screw and how much water is to be raised. It also includes some internal parameters, such as the number of blades, the inner radius, and the pitch of the screw. By combining the inner radius and pitch, he developed a method for optimizing the volume of water raised in one turn of the screw. The blades were considered to have negligible thickness.
Nuernbergk and Rorres developed analytical models of Archimedes screw turbine water inflow to achieve the optimum value of the parameters for the inflow [16]. They followed some of the Archimedes screw pump formulae described by Rorres (2000): the ratio of radius, pitch ratio, volume ratio, and volume per turn ratio. They found that the performance is influenced by the leakage between the blade and the housing and the overflow leakage. The study compares their analytical model with experimental analysis.
Rohmer et al. (2016) studied Archimedes screw turbines through simulation and experimental performance analysis. They developed a quasi-static numerical model to determine the ideal screw. A study was performed on a prototype Archimedes screw that delivered a torque of 250 Nm and had a 0.84 m diameter [17]. They used a three-blade screw turbine with an inclination angle of 30°. The model attempted to correctly predict the efficiency and energy production of the screw based on its rotational speed, geometry, and fill height. The model included leakage, friction, and overfilling losses. It was concluded that frictional losses change with the size of a screw, and frictional losses should be scaled using the Darcy-Weisbach friction factor.
Delinger et al. (2016) did Archimedes screw turbine experimental analysis. Their analysis demonstrates that the efficiency decreases when the tilt of the screw increases [18]. Their experiments showed the downstream water level effect on screw efficiency. Variation of inclination angle influenced the optimal point of screw immersion.
Delinger et al. developed a methodology based on computational fluid dynamics for predicting screw turbine performance. In their experiments, they operated the turbine’s rotational speed with a DC motor which is directly connected to the axis of the screw. The value of efficiency from their model was in reasonably good agreement with their experimental results [19]. They also developed computational modelling to simulate the gap and overfill phenomenon of leakages. They compared simulation and experimental measurements. It was calculated at a constant flow rate with variable rotational speed and a fixed rate of rotation with a variable flow rate.
Kozyn et al. developed a model to predict the friction and outlet losses associated with a screw turbine [20]. They stated that drag losses are minimum while the outlet of the screw turbine is not in submersion. As the outlet is progressively submerged, the total wetted area within the screw may increase, resulting in hydraulic drag.
Shahverdi et al. proposed a model of the screw system to calculate the optimal design for a specific site. The tilt angle, number of blades, and length of the screw were varied. In their results, the highest efficiency was 91% for a screw with a 6 m length, a tilt angle of 20°, one blade, and a rotational speed of 9.54 rad/s [21].
Lubitz et al. [22] developed models to theoretically examine the efficiency of screw turbines for different fill levels. They compared the experimental test with model prediction to predict performance through the full range of acceptable levels of fill by using 3 blades screw turbine. Their comparison demonstrated broad agreement with low and moderate operating speeds, however, the model overpredicted performance and power at higher speeds. Further, in the more recent review, a paper by YoosefDoost et al. [23] presents a detailed review of the potential of screw turbines and the design procedures. It should be noted that all literature neglects the effect of blade thickness on the flow pitch.
The literature study shows that screw turbines can be used in very low head locations. The literature presents the advantages and limitations of screw turbines for micro-hydropower generation and suggests further research into geometrical optimization. Literature shows that the following geometrical parameters can significantly influence the performance of screw turbines: diameter ratio (between outside and inside diameter—shaft diameter), pitch (distance between blades), fill factor, and the number of blades. The literature lacks research on the effect of the number of blades and the blade thickness on the power output of a nano-scale screw turbine, and this warrants further research on such devices. Further, no work is available in the literature on the design optimization of nano-scale screw turbines (diameters below 0.05 m) operating under an ultra-low head of less than 0.2 m. So, this study aims to conduct a design optimization study of ultra-low head nano scale screw turbines and understand how the number of blades affects power output. Experimental and analytical method has been used to achieve this objective. The main contribution of this research is to provide a guide for selecting an optimum number of blades for a nano-scale screw turbine.

2. Screw Turbine Design

Screw turbines are described as a set of helical blades fastened to a central shaft. The screw lies in a housing, and a gap exists between the housing and screw blades. This enables the screw to spin easily while water flows through the screw, however, it also causes water to leak past the screw as well. Water flows from the higher channel to the inlet of the screw, through along the screw blades, and out at the lower end of the screw blades. Water is caught between two adjacent screw blades moving downward from the screw inlet to the downstream outlet. The hydrostatic pressure from the water that hits the blades is transformed into a mechanical operation to turn the screw and produce torque. Tiny, very low-headed storage of flowing water is a possible location for screw turbines such as rivers, irrigation systems, water delivery systems, drinking water systems, drainage systems, cooling systems, and even desalination plants, with almost nil to 6.5 m head and a flow rate of 6.5 m3/s and less being the most popular sites [24].
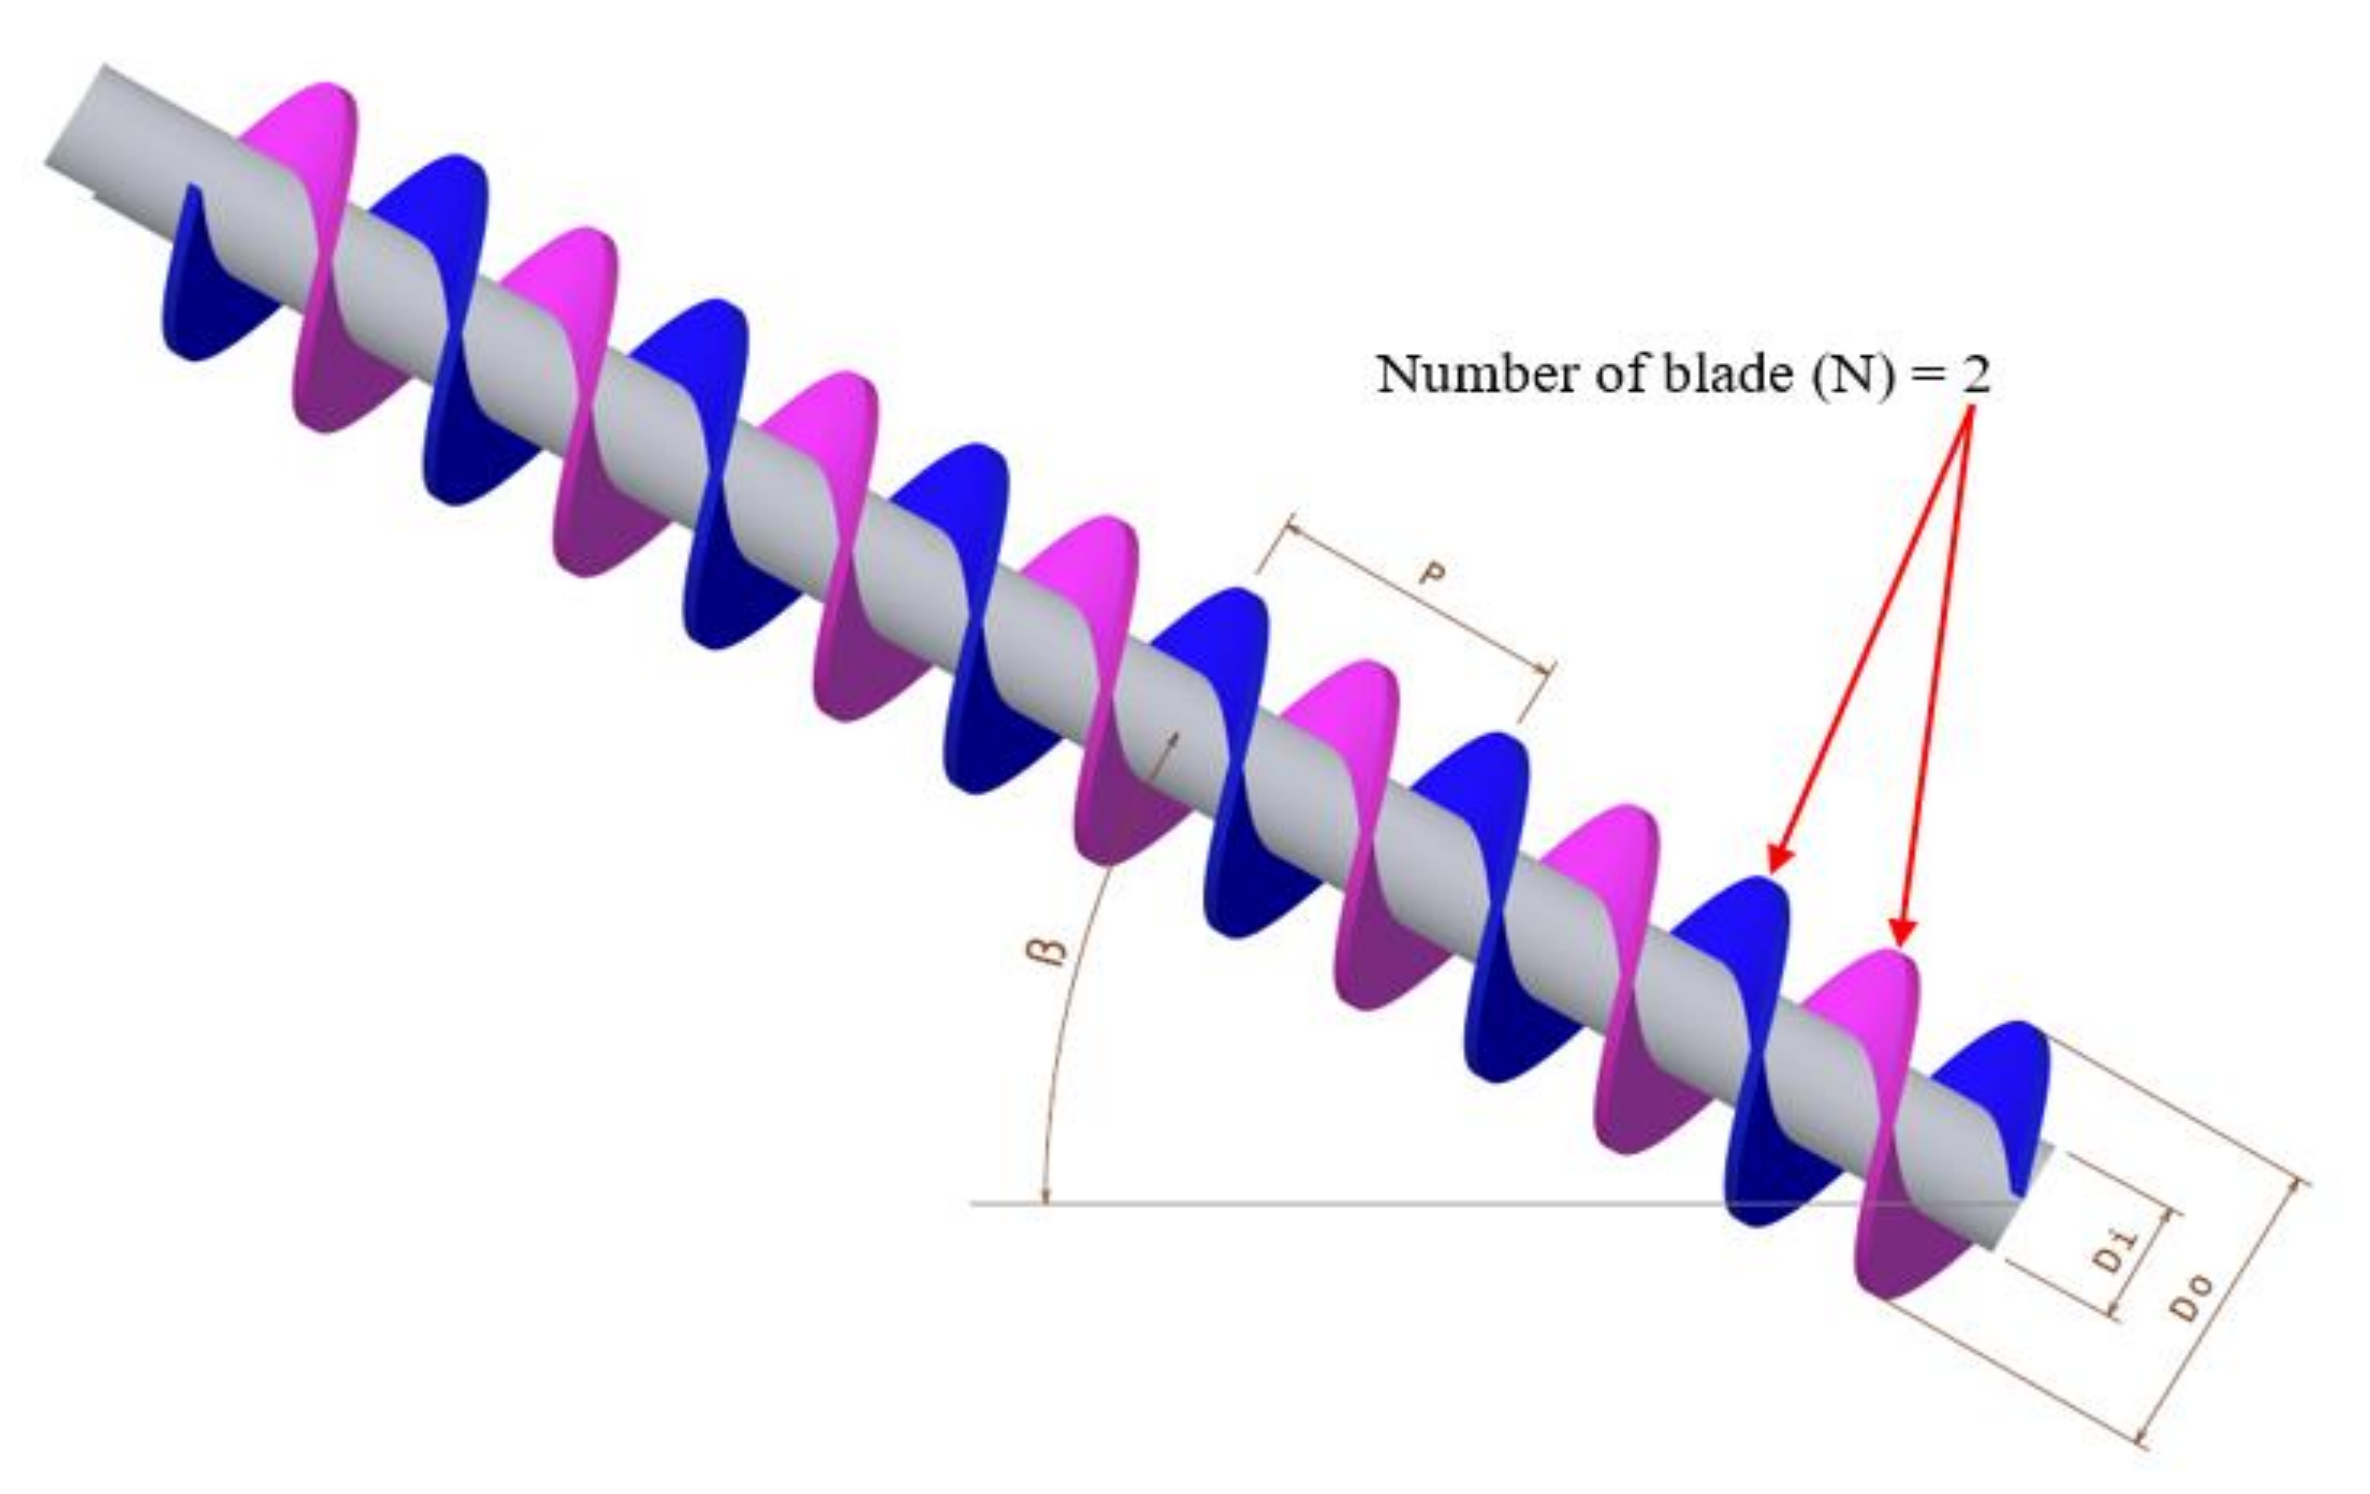
The main geometry parameters of the screw turbine are outer diameter (Do), inner diameter (Di), pitch (P), number of blades (N), and length of the screw (L). Outer diameter is the diameter of the screw blades, inner diameter is the diameter of the shaft, and pitch is the distance between one rotation of the blade. The screw is put in a slope of the central axis relative to the horizontal (β). Figure 1 shows the geometric parameters of the screw turbine.
In this study, a screw turbine is designed with one blade, two blades and three blades. Figure 2 shows the inner diameter, outer diameter, and pitch of the screw turbine prototype.
Additionally, in this study, the diameter ratio is the same for all screws, which is the ratio between the inner and outer diameter, taken as 0.4. It can be seen from Table 1 that pitch is 20 mm for one blade, while the pitch is designed to be two times for two blades, and three times for three blades (to keep the number of buckets the same for all turbines).

3. Screw Turbine Model Development

The analytical model aims to determine the performance in terms of the mechanical efficiency (η) of the screw turbine according to the available volume flow rate (Q) and the angular rotational speed (ω) of the turbine for a given sizing. Several steps must be performed to estimate the mechanical efficiency of the turbine. This model, therefore, includes mass, momentum, and energy balance applied to the turbine with a rotational speed (ω) and torque (T).
Consider a screw turbine, as shown in Figure 3, with a horizontal axis angle of β and a cylindrical coordinate scheme. The screw centerline is annotated as y, the distance from centerline in the radial position of the considered element is defined as r, which is started from the inner radius (Ri) to the outer radius (Ro). The angular position of the element from the centerline in the y-axis is defined as θ and is started from an upward normal at θ = 0 through one rotation of the screw until θ = . It is shown for a single bucket of water. The volume of water trapped inside one rotation of the blade is called a bucket. There are several buckets in the total length (L) of the screw turbine. Steady-state flow conditions, which are constant rotational speed ω and volume flow rate Qt, are assumed for the hydraulic modelling. To calculate torque and volume using numerical integration, an individual bucket is considered. The results are then multiplied by the number of buckets to give the total torque and volume flow rate. It is assumed that all buckets have the same behavior.
For any specific position along the y-axis, the radial and angular positions on the leading plane are described by the geometry of the helicoid of pitch P. All the governing equations provided in this paper are adapted from the work of, Kozyn et al. [20], Shahverdi et al. [21] and Lubitz et al. [22].
r y = r ,
θ y = 2 π y P f ,
It should be noted that the thickness of the blade will reduce the actual pitch in a multiblade turbine. The blade thickness puts a physical limit on the number of blades that can be accommodated within the constant diameter turbine. Even if the blade thickness is kept to a practical minimum, increasing the number of blades will result in reduced flow due to increased turbine solidity. This reduction in the flow will reduce the power generation capacity without considering the additional fluid frictional effects that the increased solid to liquid contact will induce. So, it is important to replace standard pitch P with flow pitch Pf. Flow pitch is defined as P f = P N × t b , where N is the number of blades and t b is the blade thickness. For a single bucket, θ ranges from 0 to 2π and r ranges from Di/2 to Do/2. At any point (r, θ), Z1 and Z2 are defined as the vertical position on the downstream and upstream surfaces of the blade. This means, at any point (r, θ), the leading helical plane surface Z1 and the upstream helical plane, Z2 are described as:
z 1 = r cos θ cos β P f θ 2 π sin β ,
z 2 = r cos θ cos β P f θ 2 π P f N sin β ,
This is used to determine the minimum and maximum points in a bucket. The minimum point occurs while the water level is at θ = π and r = Do/2, which is at the bottom of a bucket. The maximum point occurs while the water level is at θ = and r = Di/2.
Figure 4 shows the height of the water level in the bucket and is defined as a nondimensional fill factor f. If the water is about to flow over the top surface of the screw shaft into the next bucket, it means a full bucket, i.e., f equal to 1. If the water level reaches the bottom edge of the downstream surface, it is assumed to be zero, and fill factor f is equal to zero.
The fill factor f shall then be converted into a water surface relative to the z-axis. The bucket is filled completely, and a surface level is defined as Zmax when the water level coincides with the point θ = 2π, and at r= Ri on the downstream blade surface. The minimum depth possible of Zmin is the point at which the water surface level is at point θ = π and r = Ro on the downstream blade surface. It can be said that Zmin occurs when θ = π, r = Ro in equation Z1, and Zmax occurs when θ = 2π, r = Ri in equation Z2.
z m i n = R o cos β P f 2 sin β = D o 2 cos β P f 2 sin β ,
z m a x = R i cos β P f sin β = D i 2 cos β P f sin β ,
Fill factor f is introduced as a relative depth in the screw section, which is the ratio of water depth and maximum available water depth in a bucket. The difference between Zmin and Zmax is used as the overall water level needed for a full bucket.
f = Z w l Z m i n Z m a x Z m i n ,
The actual water level can therefore be defined as follows:
Z w l = Z m i n + f Z m a x Z m i n ,
The volume of water in a bucket is calculated by numerical integration of those water level relations. The same point (r, θ) connected in a bucket between the downstream blade surface (Z1) and the upstream blade surface (Z2) is defined as a volume element. The element volume dV is zero while no part of the element is submerged, and both points are above the water level. For a bucket where θ ranges between 0 and 2π, and r ranges between Di/2 and Do/2, the element volume is calculated using the following conditional equation:
d V =   0                                                                     Z 2 > Z w l ,   Z 1 > Z w l   Z w l Z 1 Z 2 Z 1 P f N r d r d θ                                   Z 2 Z w l ,   Z 1 P f N r d r d θ                                       Z 2 < Z w l ,   Z 1 < Z w l     ,
From here, the total volume of a bucket can be determined by numerical integration of the volume of the element.
V = r = D i / 2 r = D o / 2 θ = 0 θ = 2 π d V ,
To predict the power and efficiency for the model, the torque experienced by the helical planes of the screw needs to be calculated. As the buckets of water fill, the hydrostatic pressure of water in the bucket drives the screw and generates torque. The hydrostatic pressure at points Z1 and Z2 is calculated as follows:
p 1 = ρ g Z w l Z 1           Z 1 < Z w l 0                                                         Z 1 Z w l ,
p 2 = ρ g Z w l Z 2           Z 2 < Z w l 0                                                         Z 2 Z w l ,
The hydrostatic pressure at the downstream surface of the blade is defined as p 1 and at the upstream surface is defined as p 2 . The pressure difference between the upstream and downstream portion of the screw can then be used to determine the change in torque for the surface area, which can then be used to determine the torque for a full bucket. The bucket torque can be calculated as:
d T = p 1 p 2 P f 2 π r d r d θ ,
T = r = D i / 2 r = D o / 2 θ = 0 θ = 2 π d T = r = D i / 2 r = D o / 2 θ = 0 θ = 2 π p 1 p 2 P f 2 π r d r d θ ,
Due to the hydrostatic pressure on the entire screw, the total torque produced is the torque on a single bucket multiplied by the number of buckets along the length of the screw. The total torque is adjusted for a particular bucket in a specific screw.
T t o t a l = T N L P f ,
This is used to find the output power for a screw, in which no flow leakages are considered.
P o u t = ω T t o t a l ,
The volume of water in a single bucket is then used to calculate the volume flow rate Q through the screw with a given rotational speed of the screw:
Q = N V ω 2 π ,
The volume flow rate Q is used to predict available power for the available head of the screw. The available head of the screw depends on the length of the screw and the inclination angle.
h = L sin β ,
P a v a i l = ρ g Q L sin β ,
A comparison between the power output generated by the screw and the available power of the screw is defined as the predicted efficiency of the screw (neglecting the flow leakages).
η = P o u t P a v a i l ,
As mentioned earlier, a gap between the screw blades and the housing of the screw allows free rotation of the screw turbine while water enters through the screw. However, leakage occurring at this gap also causes power loss. An empirical model suggested by Nagel (1968) is the most common model used in previous research to estimate gap leakage when the fill factor is equal to 1 [25].
Q l = 2.5 G w D o 1.5 ,
where
Q l is the leakage volume flow rate through the screw (m3/s), G w is the width of the gap between the blade edge and housing (m), and D o is screw diameter (m). The gap width is usually varied at different locations along the screw so that it is not easily measured in practice. The model that is often used to estimate gap width (m) [14,16,25] is:
G w = 0.0045 D o ,
This leakage model was originally derived for a screw pump that always operates at a fill factor equal to 1. Leakage flow at other fill factors (more or less than 1) cannot be predicted by this model [22]. The wetted length of the gap and the pressure head across the gap will vary nonlinearly while the fill level changes. Therefore, the Lubitz model that can estimate gap leakage for different fill factors is used in this research [22].
Q l = C G w l w P 1 P 2 ¯ ,
where C = 0.04 m1.5 kg−0.5. It is based on a calculated 0.1 L/s leakage which is suitable for a small screw turbine. The pressure difference under the square root sign is the average around the wetted area of the gap. The wetted gap perimeter length is l w . While the torque calculations are performed, at the same time, those values are calculated numerically.
Another loss considered is overflow leakage. When the screw turbine operates with a fill factor of more than 1, overflow leakage occurs as water flows over the top of the shaft of the screw turbine (inner diameter) into the bucket below. The overflow leakage is predicted based on the relation of V-notch overflow, according to Nuernbergk and Rorres [16].
Q o = 4 15 μ 2 g 1 tan β + tan β z w l z m a x 5 / 2 ,
where μ is a constant of 0.537. The addition of this formula to the model enables the volume of water to rise well above a fill factor of 1, with the penalty of overflow leakage. When the water begins to spill over the top of the screw shaft, no additional torque is provided to the screw.
The total flow rate, considering both forms of leakage through the screw, is defined as
Q t = Q + Q o + Q l ,
This equation is used when calculating efficiency, including leakage effects. The volume flow rate Q (Equation (17)) is then substituted by the total flow rate through the turbine Q t (Equation (25)) in determining available power and hence the predicted efficiency.

4. Experimental Method

In this section, the stages of the experiments and the instrumentation for the screw turbine test are explained. The objective of the experiment is to measure the performance of the screw turbine prototypes. This part explains the principles of the screw turbine test setup, including the instrumentation that is used in the experiment.
Figure 5 shows the schematic of the screw turbine test setup. There are two main sections in this test setup. The hydraulic input unit consists of a flow meter, a supply pipe, a water pump, and a flow stabilizer which is used to control laminar flow into the turbine. The power output unit consists of a screw turbine with a level indicator, the torque transducer, including the electric load, and the tachometer.
As shown in Figure 5, the water stored in the sump is supplied to the upper reservoir by using a water pump. Two valves are used to control the flow rate of water delivered to the upper reservoir, and hence the water level at the inlet of the turbine is maintained. The flow rate of the water passing through the turbine is measured by the bucket and stopwatch method. This was confirmed with a flow meter, as shown in Figure 5. The inlet water level of the turbine is monitored by a level indicator. After the turbine absorbs the mechanical torque from the flowing water, it is discharged back through the system into the sump for recirculation. The mechanical torque produced by the turbine is measured with a torque arm connected to a load cell and data logger. A tachometer is used to measure the speed of the turbine as this helps to estimate the mechanical power output. A picture of the turbine test rig is shown in Figure 6.
These screw turbine blades are made by using a 3D printer with ABS material. 3D printing can make screw blades and a tubular core (as the inner diameter of the screw) in one part. The production of a very small screw blade is difficult to manufacture from an industrial point of view. It needs milling, cutting, and soldering or welding. This can be expensive for a small, customized turbine. An aluminium rod with a diameter of 8 mm is connected inside the tubular core as a shaft (Figure 7). Bearing housings are also made by 3D printing for the inlet and outlet of the turbine to minimize misalignment. Glass pipe with an inner diameter of 44 mm is used as the housing of the screw. The aim of using a pipe is to prevent any spilling of water when the turbine operates in a fully flowing condition. The screw turbine blades used in this research are shown in Figure 7.

5. Results and Discussion

5.1. Experimental Result

In this section experimental results have been discussed for three different configurations of the screw turbine: one blade, two blades, and three blades. A comparative study between each of these sets of results has been presented. The results are categorized based on the water level in the forebay (flow channel at turbine inlet) termed as WL15, WL20, WL25, WL30, WL35 & WL40. This value of water level is in increasing order such that performance characteristics from the start of rotation to full fill conditions are achieved.

5.1.1. One Blade Screw Turbine

This section discusses the observed result from the screw turbine with one blade. The inlet water level and its influence on the performance of the turbine have been graphically shown in Figure 8. The figure shows the relation between flow rate and turbine rotational speed for the stationary test, power test with the gradual addition of load, and the free spin test. As predicted by the theory, as the turbine is allowed to rotate faster, the flow rate of water passing through the turbine increases. Additionally, by increasing the water level in the forebay tank, the head of water is increased, and hence a greater amount of water is able to enter the turbine. This leads to an increase in rotational speed and hence further increase in the flow rate. The minimum flow rate was measured when the turbine was in the stationary condition, with the fill factor less than 1. This flow represents the leakage through the gap between the turbine screws and the housing. The value of leakage increases with an increase in fill factor, i.e., water level in the forebay. Once the fill factor is more than 1, the flow rate in the stationary condition represents the leakage flow plus the overflow from one screw bucket to the next. This stationary flow represents the minimum flow rate that can pass through the turbine, and it was measured to be 0.67, 0.96, 1.95, 3.51, 3.73 & 3.74 LPM for the single blade turbine at water levels WL15, WL20, WL25, WL30, WL35 & WL40, respectively.
The maximum flow rate was noted at the free spin condition, when the speed of the turbine was 192, 266, 317, 329, 368 & 375 rpm at WL15, WL20, WL25, WL30, WL35 & WL40, respectively. The corresponding value of maximum flow rates are 3.13, 4.81, 6.78, 8.42, 11.6 & 12.66 LPM. Figure 8 differentiates between no flow, no load, and power transmission modes. The difference in the start and end points of these bands is because of the different minimum torque requirements in the system due to static friction at different water levels.
Figure 9 is the plot for torque against speed for the one blade screw turbine at different water levels. Speed and torque are in an inverse relationship with each other. The maximum value of torque was measured when the turbine was held stationary. The maximum measured value of torque is 1.21, 1.5, 1.74, 2.27, 2.4 and 3.16 for water levels WL15, WL20, WL25, WL30, WL35 and WL40, respectively. The turbine will produce no power while it is operating under a free spin condition; hence the corresponding torque value is 0. At higher water levels, i.e., WL30, WL35 and WL40, which correspond to fill factors of more than 1, the increase in the water flow rate due to increased water level does not necessarily contribute to an increase in torque.
Figure 10 presents the results of the turbine energy conversion efficiency with respect to the speed of the turbine. The overall trend for a given water level shows an increase in efficiency with speed up to a maximum value and then gradually decreases. The peak efficiency values at WL15, WL20, WL25, WL30, WL35 & WL40 are 66%, 65.5%, 55%, 39%, 32% & 29%, respectively. The highest value was measured while at WL15, in which case the highest value of 66% was noted when the turbine rotated at 140 rpm. The turbine operates close to the peak value of efficiency over a larger speed range when operated at a higher water level, whereas near peak efficiency is obtained over a narrower speed range when operating at a low water level. Although at different water levels, the maximum efficiency point appears at slightly different rotational speeds, at around 150 rpm most of the water levels present efficiency values that are very close to the corresponding peak values. So, it can be said that a single blade turbine of the configuration in this study has an optimum operating speed of around 150 rpm. It can also be seen that as the water level goes beyond WL20, the efficiency starts to drop much faster as the fill factor is over 1. Additionally, the peak efficiency point moves to a higher rotational speed with a higher water level.

5.1.2. Two Blades Screw Turbine

This section discusses the performance of the two blades screw turbine at various operating conditions (Figure 11). The value of the flow rate has a significant effect on speed. It increases with an increasing flow rate. The minimum flow rate was observed when the turbine is in a stationary condition, which represents the leakage flow rate of the turbine. The minimum flow values of 1.4, 3.2, 6.7, 12.0, 17.8 & 25.4 LPM were measured at water levels WL15, WL20, WL25, WL30, WL35 & WL40, respectively. At fill factors less than 1, these minimum flow rates are due to leakage flow between the blades and the housing, while for fill factors more than 1, it is due to a combination of both leakage and overflow. The maximum flow rates of 5.7, 10.1, 14.2, 17.3, 22.3 & 29.3 LPM occurred at WL15, WL20, WL25, WL30, WL35 & WL40 with a free spin speed of 309, 411, 469, 505, 535 & 570, respectively. The difference in speed between the stationary mode and power mode is relatively high. The reason is due to the rotational mass of the turbine. The difference between power transmission mode and runaway mode is higher at low water levels and eventually decreases with increasing levels. A small variation in flow rate results in a significant change in the speed of the turbine at all water levels, as the surface area of contact between water and screw blades is higher compared to the single blade turbine.
Figure 12 plots transmitted torque versus turbine speed at various water levels. At a constant water level, torque decreases with increasing water speed. The maximum torque was measured when the turbine was in a stationary condition. The value of maximum torque is 2.1, 2.5, 3.6, 3.9, 4.1 & 4.2 mN m for water levels WL15, WL20, WL25, WL30, WL35 & WL40, respectively. The difference between the maximum torque and torque produced during power transmission increases with the increasing water level. This is due to the increasing static torque & overflow losses in the turbine. The values and variation in the amount of torque produced during power transmission remain almost constant regardless of water level since the loads being applied during this band are the same for all water levels.
Figure 13 is the efficiency curve at different water levels with respect to the speed for the two blades screw turbine. The curve shows an increasing turbine efficiency with decreasing water levels. The overall trend for any given water level shows an increasing efficiency with speed up to the optimum value of efficiency and then a gradual decrease. The peak efficiency values at WL15, WL20, WL25, WL30, WL35 & WL40 are 76%, 70%, 56%, 46%, 33% & 28%, respectively. The best efficiency of 76% is measured at WL15 when the turbine was rotating at 236 rpm. As the peak value of efficiency occurs over a much greater range of speeds depending on the water level compared to the single bladed turbine, the optimum speed of a turbine suitable for all operational conditions (water levels) is tricky to identify. Additionally, since a small variation in flow rate has such a significant effect on the other operational characteristics, a turbine with two blades should be developed/chosen with a strong knowledge of the maximum and minimum water levels that are likely to occur in the forebay for a given application site.

5.1.3. Three Blades Screw Turbine

This section discusses the observed results from the screw turbine with three blades. Inlet water level and its influence on the performance of the turbine has been described. Figure 14 shows the relation between flow rate and speed for the stationary test, power test with the gradual addition of load, and free spin test. The flow rate and speed have a direct relationship with each other. With increasing water levels, the water flow rate increases which also increases the speed of the turbine. A small variation in flow rate results in a significant change in the speed of the turbine, as the surface area of contact between the water and the screw blades is higher compared to both the one & two bladed turbines. When the turbine is in a stationary state, the minimum flow rate is determined when the fill factor is less than 1. This flow reflects the leakage through the gap between the turbine screws and the housing. Leakage value increases with fill factor rise, i.e., water level. If the fill factor is greater than 1 the flow rate reflects the leakage flow plus the overflow from one bucket to the next. This stationary flow reflects the minimum flow rate that the turbine can reach has been calculated to be 1.5, 3.3, 6.8, 12.11, 17.9 & 26.3 LPM for the three bladed turbine at water levels WL15, WL20, WL25, WL30, WL35 & WL40, respectively. While the maximum flow rates of 5.78, 10.18, 15.04, 19.36, 26.84 & 32.6 LPM were measured at WL15, WL20, WL25, WL30, WL35 & WL40 with corresponding runaway speeds of 327, 432, 500, 540, 582 & 606 rpm, respectively. The maximum volume flow rate measured is 32.6 LPM at 606 rpm with water level WL40. The figure clearly distinguishes between the operational modes of no flow, no-load, and power transmission.
Figure 15 shows transmitted torque versus turbine speed at various water levels. The torque of the turbine decreases with increasing water speed at the same water level. The maximum torque was measured when the turbine was in a stationary condition. The value of maximum torque is 1.7, 3.4, 5.2, 6.2, 6.4 & 6.7 mN m at WL15, WL20, WL25, WL30, WL35 & WL40, respectively. When the turbine is rotating at no load condition, there is no power transmission, hence torque is zero. There is a large variation in static torque and operational torque due to the large variation in the requirement to overcome static friction. The increasing water level increases the flow rate to the turbine, and hence increases the speed for a given torque produced. Since the range of loads applied were always the same, the corresponding value of torque transmitted at a given load remains similar regardless of water level. The only significant difference is the speed at which the torque can be produced.
The efficiency at different inlet water levels for the three blades screw turbine is shown in Figure 16. The plot shows that for a given water level, there is an increasing trend in efficiency up to an optimum speed, increasing the speed beyond this point results in a gradual decrease in efficiency. Peak efficiencies of 88%, 78%, 76%, 57%, 46% & 38% were measured for WL15, WL20, WL25, WL30, WL35 & WL40, respectively. The maximum noted efficiency for the turbine with three blades is 88%, measured at WL15 when the turbine was rotating at 262 rpm. Peak efficiency at other water levels is found to keep decreasing as water levels increase. Like the two bladed turbine, the speed at which the optimum efficiency is obtained varies much more noticeably with the water level in comparison to the single bladed turbines. This means that there is not an easily definable optimum speed that is valid for all water levels/fill ratios. Hence, care should be taken to properly match turbine and electrical component selection with installation site characteristics, i.e., maximum, and minimum forebay levels.

5.2. Comparative Study of Flow

Figure 17 is a summarized visual study of the flow in one blade, two blades, and three blades turbine. This is one of the important findings of this work related to flow inside a screw turbine. Images in columns are classified according to blade number, i.e., one blade, two blades, and three blades from left to right, respectively. The images in each row are ordered by water level, i.e., WL15, WL20, WL25, WL30, WL35 & WL40, from top to bottom, respectively.
Optimum efficiency is obtained if a screw turbine operates with a fill factor of 1, regardless of the number of blades. Figure 17 shows that the turbine with one blade achieves this fill factor at WL15, two blade achieves it at WL20, and three blade achieves it at WL25. This means that at a lower water level, higher speed and power transmission can be achieved in the turbine with a higher number of blades. Another important flow phenomenon is leakage and overflow, which can be well explained with the available images. There exists a water level difference between the pressure and suction side of the turbine, this pressure difference allows the overflow in the turbine to occur. The difference is comparatively less in a two bladed turbine and even less in a three bladed turbine system. Leakage flow occurs through the clearance gap between rotor (turbine blades) and the stator (turbine housing).
At a fill factor of around two, air bubbles are being trapped within the turbine. During operation, it was observed that this resulted in additional noise and vibration within the turbine housing and runner. WL35 for one and two blades and WL40 for three blades clearly visualize these circumstances. Further detailed CFD investigation is needed to gain a better understanding of this phenomenon.

5.3. Comparison with Analytical Modelling of Screw Turbine

Figure 18, Figure 19, Figure 20 and Figure 21 are the plots for the comparative study of results from the analytical model and experimental data. Analytical modelling of performance was obtained using the model presented in Section 2 for the same operating/input parameters used in the experiments. The major significance of this comparative study is to propose a suitable design process for wider application.
Figure 18, Figure 19 and Figure 20 are the comparative results of flow rate (Q) with respect to the angular velocity at WL15, WL20, WL25, WL30, WL35 & WL40. For the cases of one, two, and three bladed systems, the experimental data are in good agreement with the theoretical model results. Hence, it can be summarized that hydraulic parameters can be reliably estimated by this technique, and that, based on these parameters other operational parameters can be estimated.
Figure 21 is the plot of the efficiency against the angular velocity of one, two & three blades turbine at WL15 and WL30, respectively. It was found that there is an acceptable agreement of around 10% in all three cases when operated at WL15. However, the variation is higher at a higher angular velocity. In contrast to at WL15, when the turbine operates at WL30 the difference is significantly higher. At a higher water level, the fill factor of the turbine increases, and so does the optimal operational speed range. Hence, there is expected to be a rapid increase in fluid friction under these conditions, which has not been considered by the model. The over prediction of performance is the result of this limitation in the model. In addition to this, the value of drag on the turbine bearing is expected to increase with increasing water load, which is difficult to estimate. At higher water levels, for a turbine of this small size, both dynamic water load and fluid friction vary rapidly; hence the analytical model is unable to make performance predictions as accurately as it can at lower fill levels.
Based on this comparison, it is suggested that this model can have conditional use in both industry and research. It can perform preliminary sizing of a screw turbine and make a comparative study between blade numbers. Simple modifications to the modelling method, based on the screw pitch, can further extend the horizon for both research and practical applications. Another effective application would be in sizing the forebay system, by predicting the flow requirement of a proposed turbine. The values of the experimental and theoretical show reasonable comparison around a fill factor of 1 and rotational speed of around 150 rpm. While there is a significant difference in fill factors above 1, this is contributed to the experimental uncertainty.

5.4. Design Optimization Study

The analytical model was used to study the effects of the number of blades on the screw turbine performance under a constant head of 0.12 m with a constant inclination angle of 24.9°. The screw geometry used in the model had a turbine outer diameter of 0.043 m, an inner diameter of 0.017 m (shaft diameter), and a length of the screw of 0.28 m. The fill factor of 1 was used for this optimization study, while the angular velocity was varied from 1 rad/s to 40 rad/s. The number of blades was also varied from 1 blade to 15 blades, while the blade thickness was kept constant at 0.002 m.
Figure 22 and Figure 23 show the effects of the number of blades and angular velocity on the energy conversion efficiency and the power output capacity of a screw turbine under a constant head of 0.12 m. Highest step improvement in the efficiency and the power output capacity is achieved when the number of blades of a screw turbine is increased from one blade to two blades; there onwards, the relative improvement is smaller. Although the efficiency continues to increase with the increased number of blades, the power output stops increasing beyond 5 blades. The decrease in the power output is expected due to the reduced flow rate, which is due to increased turbine solidity. It should be noted that the present modelling does not consider any irreversibilities that are introduced due to the increased fluid-solid interactions, and hence the efficiency continues to increase.
Figure 24 shows the combined improvement achieved by increasing the number of blades relative to one blade turbine at a constant angular velocity of 40 rad/s and constant head of 0.12 m. The combined improvement is calculated as a product of the percentage improvement in the power output and efficiency relative to one blade screw turbine. It can be seen from Figure 24 that combined improvement is higher at a lower angular velocity, and the peak improvement is achieved around 7 to 8 blades. Further from Figure 24, it can be seen that the combined improvement is reasonably high for a turbine with 5 to 9 blades. This can be considered the optimum range of blades for an operating head of 0.12 m and 0.043 m of the outer diameter of the turbine.

6. Conclusions

This study explains the experimental performance of one, two, and three blades screw turbines with the comparative study of flow and comparison with analytical modelling. The experimental trends of the interrelationships between flow rate, speed, torque, and efficiency have been examined. In addition, visual methods have been used to examine the internal flow characteristics of each turbine under different fill conditions.
A comparison of the experimental performance shows that the screw turbine has higher performance with three blades compared to one, provided there are no manufacturing constraints. At low-speed operation, a turbine with three blades exhibited far better performance than one blade; hence it could be a better operational selection in most cases. The prime influencing parameter that affects the performance and overall operation of the turbine is the fill factor. The fill factor is directly related to the speed and flow rate of the turbine. At a constant water level, if the speed of the turbine is increased (by reducing the load), the fill factor decreases. This affects efficiency, which first increases and then decreases. The best performance (highest efficiency) in the case of all turbines was measured when it was operating at a fill factor of 1. It should be noted that the experimental results presented have got large standard deviations in some instances; this is attributed to the small scale of the system, so the average value of the experimental performance should be used as a reference for designing. The instrumentation uncertainty related to the experimental setup was estimated to be between ±6% to ±8%.
A theoretical model has been used to conduct a simple design optimization study that examined the effects of the number of blades on the turbine power output and energy conversion efficiency. It is observed that the energy conversion efficiency increases with an increase in the number of blades. The power output increases up to 7 blades and then starts to drop. The combined (power and efficiency) improvement achieved with an increase in the number of blades shows that this trend remains similar for a wide range of rotational speeds between 10 rad/s to 40 rad/s. The combined improved predictions show that a screw turbine with 5 to 9 blades should have close to optimum performance. To make the research practical, further investigations into the economics of such turbines for remote off-grid operation should be conducted by researchers in the future.

Author Contributions

Conceptualization, E.E. and A.D.; methodology, E.E. and A.D.; software, E.E., R.K. and A.D.; writing—original draft preparation, E.E. and R.K.; supervision, A.D. and N.S.; writing—review and editing, E.E., R.K., N.S. and A.D. All authors have read and agreed to the published version of the manuscript.

Funding

This research received no external funding.

Institutional Review Board Statement

Not applicable.

Informed Consent Statement

Not applicable.

Data Availability Statement

Data can be made available by contacting the first coauthor, Erinofiardi Erinofiardi (erinofiardi@unib.ac.id).

Conflicts of Interest

The authors declare no conflict of interest.

Nomenclature

The following symbols are used in this paper:
βAngle of inclination of screw (°)
DiInner diameter of screw turbine (m)
DoOuter diameter of screw turbine (m)
dTDifferential torque(Nm)
dVVolume of the element of a bucket(m3)
FForce of turbine shaft(N)
fFill factor(-)
gGravitational acceleration(m/s2)
GwGap width(m)
hAvailable head as function of screw length and slope(m)
LLength of screw(m)
lwWetted gap perimeter length(m)
NNumber of blades(-)
ηEfficiency(%)
PPitch, distance of one turn helicoid blade(m)
p1Hydrostatic pressure at point Z1(Pa)
p2Hydrostatic pressure at point Z2(Pa)
PavailTheoretical power(Watt)
PoutOutput power of a screw(Watt)
QVolume flow rate(m3/s)
QlGap leakage(m3/s)
QoVolume of overflow leakage(m3/s)
QtThe total flow rate considering leakages(m3/s)
RRadial position of element from centerline(m)
RiInner radius of screw turbine(m)
RoOuter radius of screw turbine(m)
ρDensity of water (kg/m3)
TTorque of a bucket(Nm)
TtotalTorque of buckets in a screw length(Nm)
θAngular position of element from centerline(rad)
VVolume of a bucket(m3)
WLInlet water level of screw turbine experiment(mm)
ωAngular velocity of the screw(rad/sec)
Z1Vertical position downstream surface of the blade(m)
Z2Vertical position upstream surface of the blade(m)
ZmaxMaximum possible depth in the bucket(m)
ZminMinimum possible depth in the bucket(m)
ZwlActual water level in the bucket(m)

References

  1. Erinofiardi; Gokhale, P.; Date, A.; Akbarzadeh, A.; Bismantolo, P.; Suryono, A.F.; Mainil, A.K.; Nuramal, A. A Review on Micro Hydropower in Indonesia. Energy Procedia 2017, 110, 316–321. [Google Scholar]
  2. Baidar, B.; Chitrakar, S.; Koirala, R.; Neopane, H.P. Selection of Optimal Number of Francis Runner Blades for a Sediment Laden Micro Hydropower Plant in Nepal. Int. J. Fluid Mach. Syst. 2015, 8, 294–303. [Google Scholar] [CrossRef] [Green Version]
  3. Laghari, J.A.; Mokhlis, H.; Bakar, A.H.A.; Muhammad, H. A comprehensive overview of new designs in the hydraulic, electrical equipments and controllers of mini hydro power plants making it cost effective technology. Renew. Sustain. Energy Rev. 2013, 20, 279–293. [Google Scholar] [CrossRef]
  4. Vermaak, H.J.; Kusakana, K.; Koko, S.P. Status of micro-hydrokinetic river technology in rural applications: A review of literature. Renew. Sustain. Energy Rev. 2014, 29, 625–633. [Google Scholar] [CrossRef]
  5. Güney, M.S.; Kaygusuz, K. Hydrokinetic energy conversion systems: A technology status review. Renew. Sustain. Energy Rev. 2010, 14, 2996–3004. [Google Scholar] [CrossRef]
  6. Anyi, M.; Kirke, B. Hydrokinetic turbine blades: Design and local construction techniques for remote communities. Energy Sustain. Dev. 2011, 15, 223–230. [Google Scholar] [CrossRef]
  7. Zomers, A. The challenge of rural electrification. Energy Sustain. Dev. 2003, 7, 69–76. [Google Scholar] [CrossRef]
  8. Zhou, Y.; Hejazi, M.; Smith, S.; Edmonds, J.; Li, H.; Clarke, L.; Thomson, A. A comprehensive view of global potential for hydro-generated electricity. Energy Environ. Sci. 2015, 8, 2622–2633. [Google Scholar] [CrossRef]
  9. International Energy Agency. Indonesia 2015, Energy Policies Beyond IEA Countries; International Energy Agency: Paris, France, 17 February 2015. [Google Scholar]
  10. Purwanto, W.W. Indonesia Energy Outlook & Statistic 2006; Pengkajian Energi Universitas Indonesia: Jakarta, Indonesia, 2006. [Google Scholar]
  11. Havn, T.B.; Saether, S.A.; Thorstad, E.B.; Teichert, M.A.K.; Heermann, L.; Diserud, O.H.; Okland, F. Downstream migration of Atlantic salmon smolts past a low head hydropower station equippped with Archimedes screw and Francis turbines. Ecol. Eng. 2017, 105, 262–275. [Google Scholar] [CrossRef]
  12. Pauwels, I.S.; Baeyens, R.; Toming, G.; Schneider, M.; Buysse, D.; Coeck, J.; Tuhtan, J. AMulti-Species Assessment of Injury, Mortality, and Physical Conditions during Downstream Passage through a Large Archimedes Hydrodynamic Screw (Albert Canal, Belgium). Sustainability 2020, 12, 8722. [Google Scholar] [CrossRef]
  13. Piper, A.T.; Rosewarne, P.J.; Wright, R.M.; Kemp, P.S. The impact of an Archimedes screw hydropower turbine on fish migration in a lowland river. Ecol. Eng. 2018, 118, 31–42. [Google Scholar] [CrossRef]
  14. Müller, G.; Senior, J. Simplified theory of Archimedean screws. J. Hydraul. Res. 2009, 47, 666–669. [Google Scholar] [CrossRef]
  15. Rorres, C. The turn of the screw: Optimal design of an Archimedes screw. J. Hydraul. Eng. 2000, 126, 72–80. [Google Scholar] [CrossRef] [Green Version]
  16. Nuernbergk, D.M.; Rorres, C. Analytical model for water inflow of an archimedes screw used in hydropower generation. J. Hydraul. Eng. 2013, 139, 213–220. [Google Scholar] [CrossRef]
  17. Rohmer, J.; Knittel, D.; Sturtzer, G.; Flieller, D.; Renaud, J. Modeling and experimental results of an Archimedes screw turbine. Renew. Energy 2016, 94, 136–146. [Google Scholar] [CrossRef]
  18. Dellinger, G.; Terfous, A.; Garambois, P.A.; Ghenaim, A. Experimental investigation and performance analysis of Archimedes screw generator. J. Hydraul. Res. 2016, 54, 197–209. [Google Scholar] [CrossRef]
  19. Dellinger, G.; Garambois, P.A.; Dufresne, M.; Terfous, A.; Vazquez, J.; Ghenaim, A. Numerical and experimental study of an Archimedean Screw Generator. IOP Conf. Ser. Earth Environ. Sci. 2016, 49, 102002. [Google Scholar] [CrossRef] [Green Version]
  20. Kozyn, A.; Lubitz, W.D. A power loss model for Archimedes screw generators. Renew. Energy 2017, 108, 260–273. [Google Scholar] [CrossRef]
  21. Shahverdi, K. Modeling for prediction of design parameters for micro-hydro Archimedean screw turbines. Sustain. Energy Technol. Assess. 2021, 47, 101554. [Google Scholar] [CrossRef]
  22. Lubitz, W.D.; Lyons, M.; Simmons, S. Performance model of Archimedes screw hydro turbines with variable fill level. J. Hydraul. Eng. 2014, 140, 04014050. [Google Scholar] [CrossRef]
  23. YoosefDoost, A.; Lubitz, W.D. Archimedes Screw Turbines: A Sustainable Development Solution for Green and Renewable Energy Generation—A Review of Potential and Design Procedures. Sustainability 2020, 12, 7352. [Google Scholar] [CrossRef]
  24. Shahverdi, K.; Loni, R.; Ghobadian, B.; Gohari, S.; Marofi, S.; Bellos, E. Numerical Optimization Study of Archimedes Screw Turbine (AST): A case study. Renew. Energy 2020, 145, 2130–2143. [Google Scholar] [CrossRef]
  25. Nagel, G. Archimedean Screw Pump Handbook; RITZ Pumpenfabrik OHG: Schwäbisch Gmünd, Germany, 1968. [Google Scholar]
Figure 1. Geometric parameters of a screw turbine.
Sustainability 14 15948 g001
Figure 2. Diameter and pitch of screw turbine prototype (a) side view (b) one blade (c) two blade (d) three blade.
Sustainability 14 15948 g002
Figure 3. Coordinate system of a rotating screw.
Sustainability 14 15948 g003
Figure 4. Water level in bucket description.
Sustainability 14 15948 g004
Figure 5. Schematic diagram of the test rig.
Sustainability 14 15948 g005
Figure 6. Picture of the turbine test rig.
Sustainability 14 15948 g006
Figure 7. Screw turbine prototypes.
Sustainability 14 15948 g007
Figure 8. Effect of inlet water level (WL) on flow rate and speed for one blade screw turbine.
Sustainability 14 15948 g008
Figure 9. Effect of inlet water level (WL) on torque and speed for one blade screw turbine.
Sustainability 14 15948 g009
Figure 10. Efficiency of one blade screw turbine.
Sustainability 14 15948 g010
Figure 11. Effect of inlet water level (WL) on volume flow rate and speed for two blades screw turbine.
Sustainability 14 15948 g011
Figure 12. Effect of inlet water level (WL) on torque and speed for two blades screw turbine.
Sustainability 14 15948 g012
Figure 13. Efficiency of two blades screw turbine.
Sustainability 14 15948 g013
Figure 14. Effect of inlet water level (WL) on volume flow rate and speed for three blades screw turbine.
Sustainability 14 15948 g014
Figure 15. Effect of inlet water level (WL) on torque and speed for three blades screw turbine.
Sustainability 14 15948 g015
Figure 16. Efficiency of three blades screw turbine.
Sustainability 14 15948 g016
Figure 17. Photos of water level for all screw turbine prototypes.
Sustainability 14 15948 g017
Figure 18. Comparative study of model and experimental flow for 1 blade.
Sustainability 14 15948 g018
Figure 19. Comparative study of model and experimental flow for 2 blades.
Sustainability 14 15948 g019
Figure 20. Comparative study of model and experimental flow for 3 blades.
Sustainability 14 15948 g020
Figure 21. Comparative study of model and experimental efficiency of 1, 2 & 3 blades turbine at WL15 & WL30.
Sustainability 14 15948 g021
Figure 22. Effect of the number of blades and angular velocity on the efficiency.
Sustainability 14 15948 g022
Figure 23. Effect of number of blades and angular velocity on the power output.
Sustainability 14 15948 g023
Figure 24. Effect of number of blades on combined improvement relative to one blade.
Sustainability 14 15948 g024
Table 1. Geometric parameters of three test screws.
ParameterSymbolValue
Inner diameterDi17 mm (0.017 m)
Outer diameterDo43 mm (0.043 m)
Number of bladesN1, 2, 3
PitchP20 mm (0.02 m) for N = 1
40 mm (0.04 m) for N = 2
60 mm (0.06 m) for N = 3
Inclination angleβ25°
Publisher’s Note: MDPI stays neutral with regard to jurisdictional claims in published maps and institutional affiliations.

