Article

The 3D Printing Potential for Heat Flow Optimization: Influence of Block Geometries on Heat Transfer Processes

Department of Industrial and Information Engineering and Economics, University of L’Aquila, 67100 L’Aquila, Italy
*
Author to whom correspondence should be addressed.
Sustainability 2022, 14(23), 15830; https://doi.org/10.3390/su142315830
Submission received: 28 October 2022 / Revised: 20 November 2022 / Accepted: 23 November 2022 / Published: 28 November 2022
(This article belongs to the Collection Sustainable Buildings and Energy Performance)

Abstract

:
The building envelope is a crucial element in the regulation of thermal energy in the indoor environment, from which comfortable living inevitably depends. Designing a low-dispersion envelope represents a fundamental strategy to minimize the energy demand and HVAC systems’ consumption. To this end, the need to select suitable insulation has become increasingly important, and the search for new solutions is constantly evolving. This justifies the great interest in the study of energy-efficient and sustainable insulation materials that are able to provide the low thermal transmittance values of multilayer components. To date, 3D printing has experienced a growing popularity for the research of alternative building materials (e.g., concrete). Conversely, it still appears to be very uncommon for the research of purely energy-efficient solutions. The aim of this work is to compare the thermal performance of three 3D-printed PLA (polylactic acid) blocks, characterized by different internal geometries and air cavities: (i) a multi-row structure; (ii) a square structure; (iii) a honeycomb structure. The study was conducted theoretically, with two-dimensional heat transfer modeling, and experimentally, by means of a heat flow meter and infrared thermography. The results showed that the configurations of the 3D-printed blocks reduced the flow of heat exchange. In addition, as the complexity of the blocks’ internal structure increased, a heat flow reduction could be observed. In particular, the honeycomb structure showed a better behavior than the other two blocks did, with an experimental transmittance value that was equal to 1.22 ± 0.04 W/m2K. This behavior, which was mainly due to an attenuation of convective and radiative internal heat exchanges, suggests that the 3D printing has great potential in this field.

1. Introduction

To date, achieving energy efficiency in buildings is one of the main objectives of energy policies at the national and global levels. In fact, the construction sector represents approximately 36% of total global primary energy consumption, contributing to almost 40% of the total CO2 emissions worldwide [1].
These percentages could increase, respectively, by 12% and 37% due to the growth of space heating and cooling energy consumption, and this is expected to happen by 2050 [2]. This scenario may be alarming, but at the same time, it could offer a good opportunity for sustainable energy planning to be conducted in the construction sector. The efforts to seek energy-efficient solutions play an important role in reducing the consumption and costs, guaranteeing high indoor comfort levels [3].
The complexity of the buildings is increasing more and more to meet regulatory requirements that are even more cogent [4]. However, the construction methods have only evolved to a limited extent [5]. For this reason, it is necessary to adopt innovative systems and techniques aimed at considerably reducing the amount of energy consumption, carbon emissions, and consequently, the environmental impact.
Therefore, the design of low-energy buildings represents one of the main issues worldwide. The energy saving goal can be pursued with multiple interventions ranging from renewable energy systems to the use of high-performance insulation materials. For this reason, in the last decade, the development of sustainable energy applications in the building industry has received widespread attention among researchers [6,7,8,9,10,11,12,13,14,15].
The building envelope is certainly a theme that should not be underestimated. In fact, it constitutes the “skin” of the building, and as it is being in direct contact with both the external and internal environment, it regulates the energy exchanges. The more the envelope is able to reduce the heat transmission losses, the more efficient it can be considered. In fact, the construction of a low-dispersing envelope guarantees a net reduction of energy consumption, contributing to lowering the costs of it and to minimizing the CO2 emissions as much as possible. Therefore, an adequate choice of the insulating material is fundamental.
Moreover, in recent years, the attention of researchers has particularly focused on the influence that the geometric configuration of the envelope can have on its thermal performance. The structures that are inspired by the biomimicry concept have aroused particular interest [16,17,18,19,20]. Among these, for example, honeycomb structures have proven to be successful for thermal management applications, both as thermal barriers and as heat sinks [21,22,23].
Three-dimensional printing (3D-printing) has proven to be a suitable manufacturing technology for making models from complex shapes in a short amount of time [22]. Industries are being modernized and revolutionized with the help of 3D printing. The mode of manufacturing is gradually shifting from traditional to non-conventional processes. Currently, 3D printing has had a wide range of applications in various fields, such as in medicine, the fashion industry, automotives, textiles, pharmaceuticals, the food industry, etc., [24,25,26,27,28].
In recent years, there has been increasing research on Additive Manufacturing (AM) in the construction industry, however, these developments are still in the early stages. However, the full success of 3D printing in the construction sector is still a long way off because, currently, there are still no guidelines or design and construction procedures to follow for its applicability [29,30,31,32,33,34].
Unlike the other manufacturing processes, 3D printing has emerged as a viable technology for manufacturing engineering components. In addition, many aspects associated with 3D printing, such as there being less material waste, the ease of production, less human involvement, very little post-processing, and energy efficiency, make the process suitable for industrial use [24]. Although this technology is still under development, particularly for applications in the construction sector, its potential to influence the energy and environmental imprint of buildings is promising [35]. Three-dimensional printing has all of the necessary requirements to replace traditional production processes to manufacture lightweight cellular structures with a superior energy absorption performance [23].
Currently, there are many studies aimed at analyzing the thermal performance of different wall configurations.
Suntharalingam et al. [36] compared several samples of concrete walls which were realized with 3D printing with and without cavity insulation by validating finite element models (FEMs), with the aim of evaluating the thermal properties offered by the various geometric configurations. The study showed that walls with multiple rows of cavities and with multiple internal partitions are significantly higher performing ones.
Marais et al. [37] numerically analysed the thermal performance of 3D-printed lightweight foam concrete and high-performance concrete structures with macrostructural cavity arrangements. The results obtained showed that the thermal performance depends on the geometric configuration and the type of material chosen for the model.
Al-Tamimi et al. [38] developed a finite element model to locate the optimal geometry of the cavities and their arrangement in the masonry concrete blocks to reduce the thermal heat flow. Subsequently, some insulating materials were inserted into the concrete mixtures with the aim of reducing the thermal conductivity. Experimentally, the results of the new block with optimal geometry without the insulation materials showed a thermal insulation improvement of up to 71% compared to the other cable models, including those available on the market. The thermal resistance of concrete and masonry blocks with insulating materials (rubber, polyethylene, etc.) is interesting and significant. The study found that the “optimal” geometry designed for hollow blocks is better than the geometry of the hollow blocks that are currently available on the market.
Grabowska et al. [39] designed and printed multilayer materials, with quadrangular, hexagonal, and triangular cavities. Developing a mathematical model, they experimentally analysed the thermal conductivity of such materials. From their study, the quadrangular and hexagonal structures resulted the highest performances at the thermal level.
de Rubeis [40] studied the thermal performance of a 3D-printed PLA block by conducting theoretical and experimental analyses. The aim of the work was to show the potential of additive manufacturing in the field of insulation systems. The experimental analyses were conducted through the use of the heat flow meter in the Hot Box, together with infrared thermography. To implement the circular economy concept, the internal cavities of the block were subsequently filled with various recovered waste materials: polystyrene and wool. In this way, it was possible to understand how much the introduction of insulation materials affects the thermal performance of the blocks.
Despite the research that is already underway for the energy evaluation of 3D-printed objects, there is still much work to be conducted to make additive manufacturing widely applied in the building sector.
This work, whose starting point is represented by the work in [40], aims to compare three PLA blocks characterized by different types of internal cavities and to understand how their thermal performances change according to their configuration. To carry out the study, the potential of 3D printing, which has already been demonstrated by the previous work, was further exploited. Additionally, in this case, the analyses were carried out by numerical and experimental approaches.

2. Materials and Methods

The economic and technical advantages offered by 3D printing make it a potential substitute for conventional manufacturing processes, particularly for the development of complex and optimized products. Regardless of the type of manufacturing sector, the adoption of 3D printing can be a great asset as this production system can offer innovative solutions that are capable of making this technology sustainable for industrial use [24].
Based on the aforementioned reasons, in this work, different 3D-printed blocks were designed and fabricated. To this aim, the FDM (Fused Deposition Modeling) process was employed. This process is based on the extrusion of thermoplastics, such as ABS (Acrylonitrile Butadiene Styrene) or PLA (Polylactic Acid), by means of a heated nozzle. The designed object was then fabricated through an overlay of layers. The first phase of the printing process was to geometrically design the object that was to be printed. Therefore, an STL (Standard Tessellation Language) file was created to provide all of the geometric information of the object, which was required by a 3D printer. Then, a slicing software provided all of the necessary printing information (e.g., layer height, extrusion nozzle positioning, etc.) for the object realization.

2.1. Methodology

The objective of the proposed work is essentially twofold: (i) exploring the 3D printing technology and its potential, pushing towards the creation of increasingly complex forms, and (ii) analyzing the 3D-printed blocks characterized by different internal geometries to understand their effects on heat transfer modes.
To pursue these goals, the applied methodology, which is described in Figure 1, is divided into two macro-phases. The first phase is represented by the design, modeling, and creation of the blocks:
  • The 3D models were designed with AutoCAD Inventor®, a three-dimensional modeling software (Autodesk Inc., San Rafael, CA, USA); then, the G-Codes were generated using the slicer software Creality Slicer 4.2 (Creality 3D Technology Co., Shenzhen, China) to assign all of the printing properties.
  • The simulation heat transfer models were carried out on THERM software [41] to perform the theoretical analysis of the blocks.
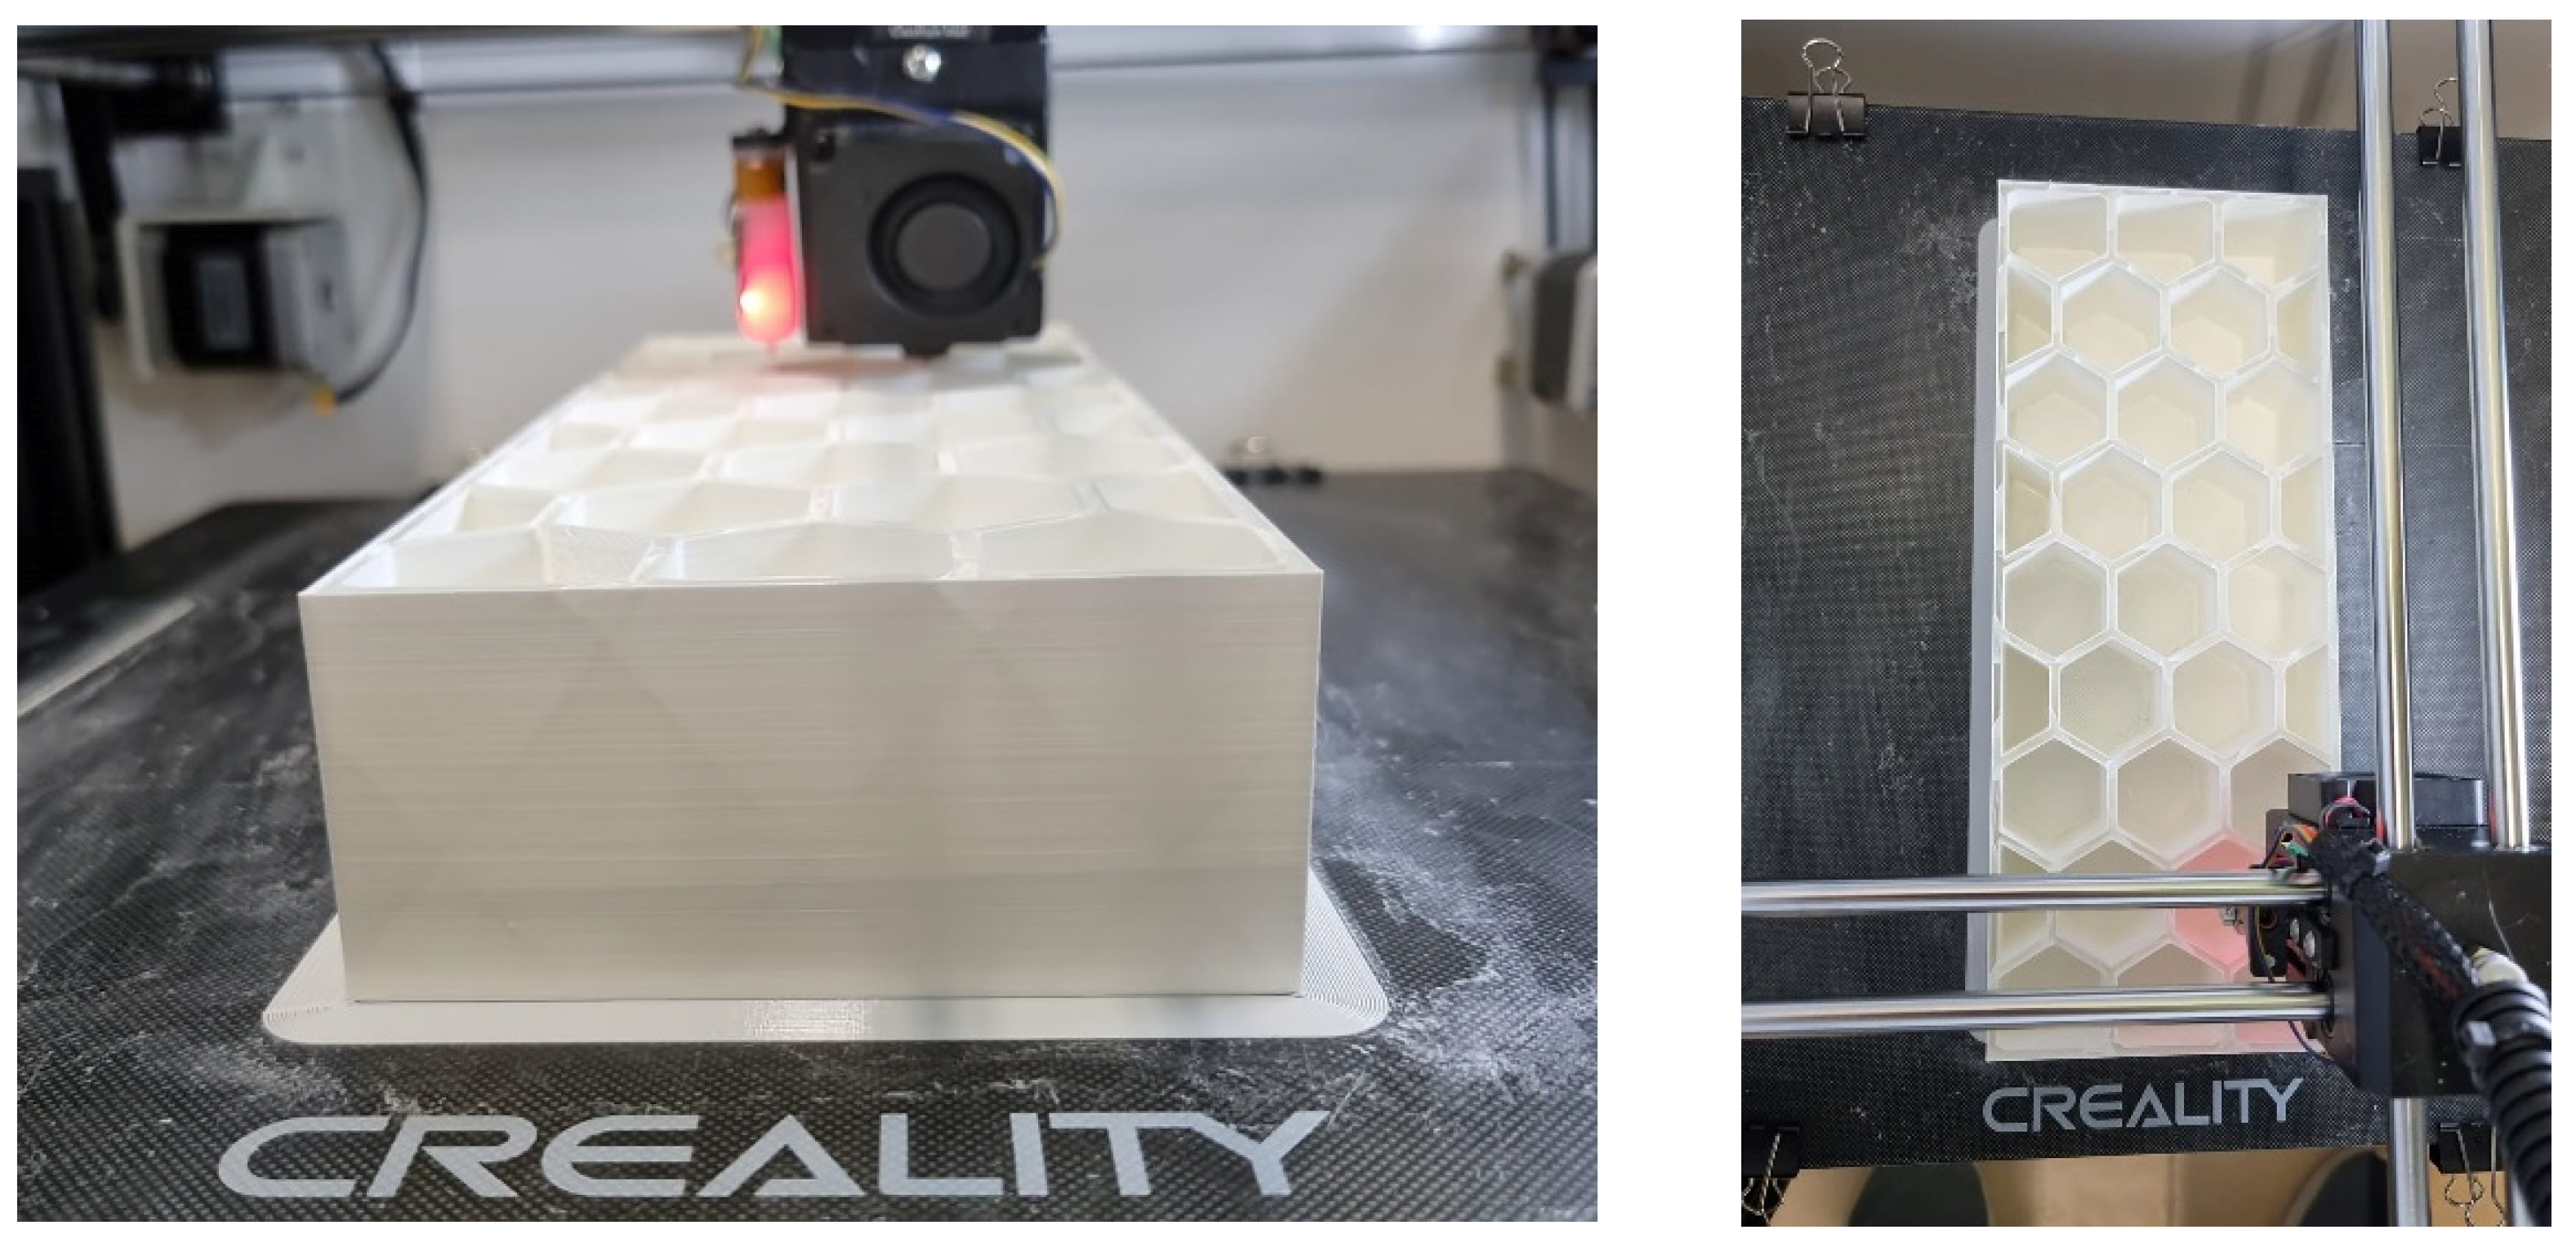
  • Thus, the designed blocks were realized using the Creality CR-3040 PRO 3D printer, (Shenzen Creality 3D Technology Co., Ltd., Shenzhen, China), after having chosen Polylactic Acid as the printing material. PLA was chosen because it is an ecological, biodegradable, and economical material with exceptional properties, and it can be easily printed with the FDM technique [42,43,44]. The printing temperature of the PLA used is 200–225 °C, and the filament diameter is 1.75 mm.
The second phase focuses on the thermal performance analysis of the blocks. An experimental analysis was conducted using heat flux meter (HFM) method and infrared thermography (IRT) technique.
In this work, the mechanical properties of the 3D-printed blocks were not analysed, although this topic is a potential future development.

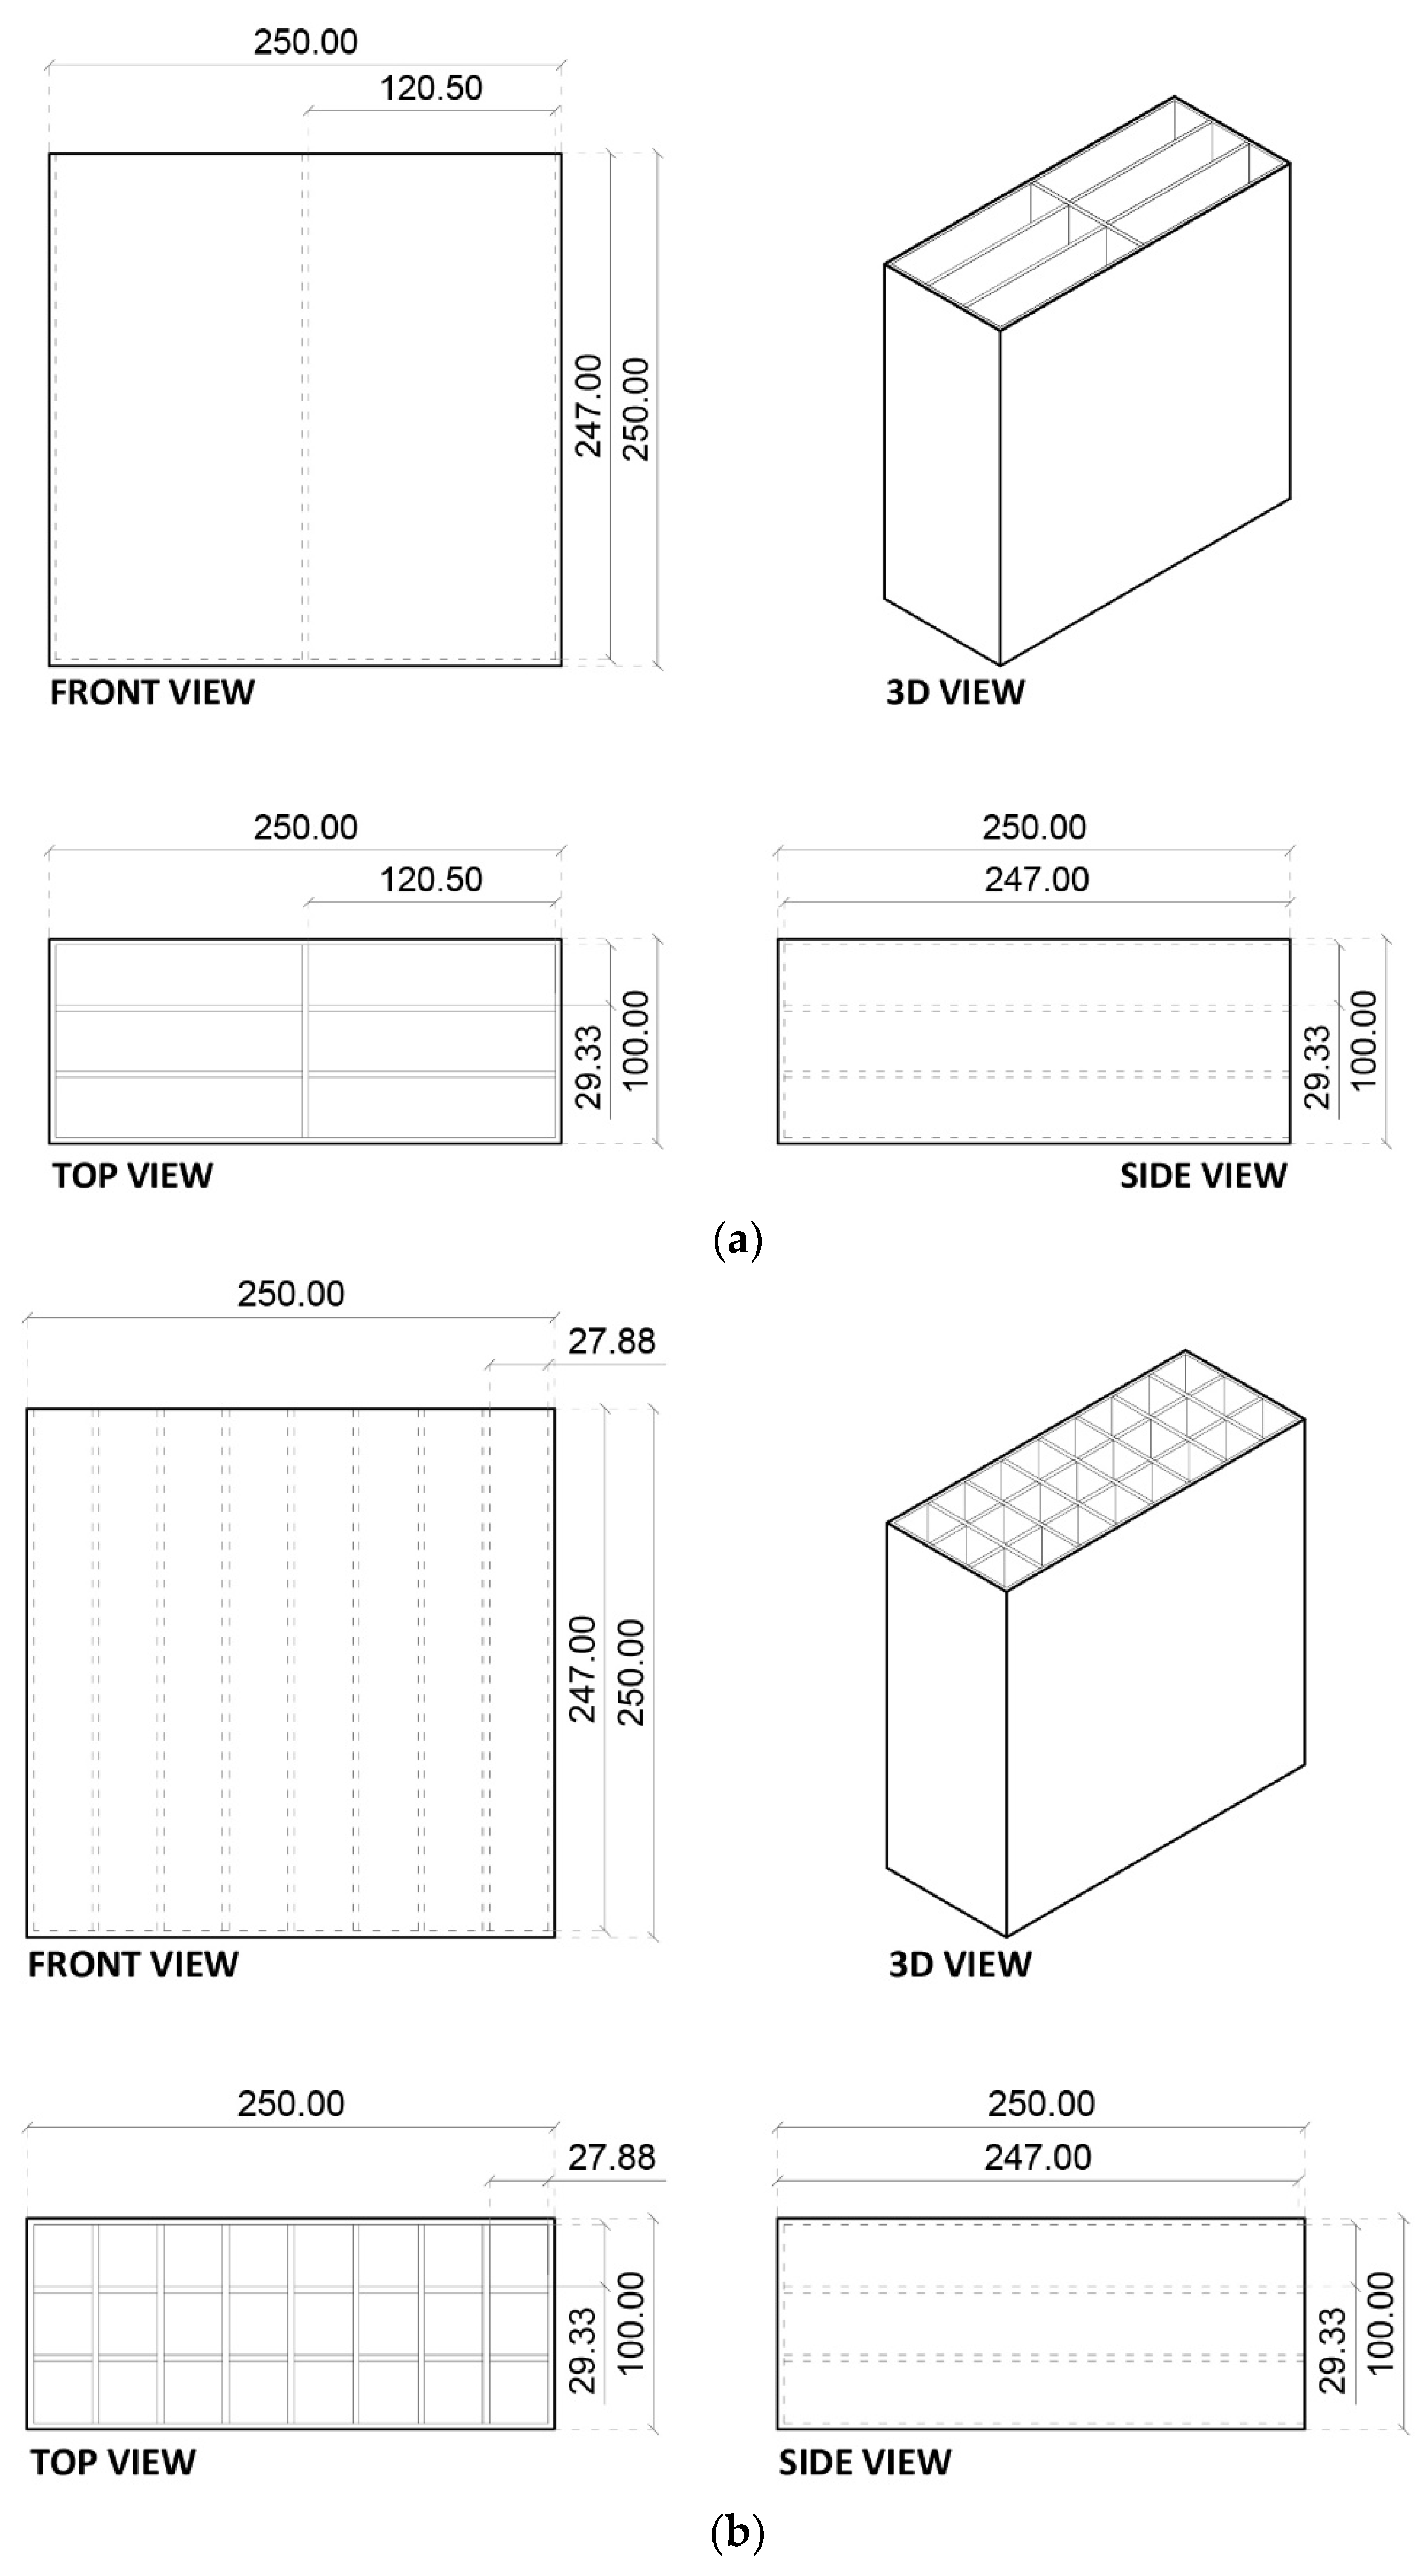
2.2. Design, Modeling and Printing Phase

Firstly, the blocks were designed, taking into account the size limits imposed by the printer, and they were equal to 300 × 300 × 400 mm. Then, three blocks with different internal structures and air cavities were drawn using AutoCAD® 2D and 3D-design software: (i) a multi-row structure, (ii) a square structure, and (iii) a honeycomb structure. All of the blocks had the same dimensions of 250 × 250 × 100 mm (width × height × depth). The first block (Figure 2a) was characterized by longitudinal partitions to form six rectangular cavities with dimensions equal to 120.5 × 247.0 × 29.3 mm (width × height × depth). The second block (Figure 2b) had an internal square structure characterized by twenty-four rectangular cavities each with dimensions equal to 27.9 × 247.0 × 29.3 mm (width × height × depth). The third block (Figure 2c), finally, was characterized by a honeycomb structure, formed by hexagonal cavities, with sides of 16.9 mm and a height of 247.0 mm, which were arranged in three rows.

2.2.1. Numerical Heat Transfer Modeling

The designed blocks were analysed using THERM software, a Lawrence Berkeley National Laboratory (LBNL) software for analyzing two-dimensional heat transfer through building components, which is based on the finite element method [45]. Clearly, the thermal phenomena under the real conditions developed in three dimensions. However, the two-dimensional numerical simulation was carried out with the sole objective of preliminarily evaluating the thermal behavior of the designed blocks. Since PLA was chosen for the block printing and the software library does not contain the thermophysical properties of this material, the PLA’s thermal characteristics were manually entered (e.g., the thermal conductivity λ was equal to 0.28 W/mK).
The cavities of the blocks (Figure 3) have been modeled as “Frame Cavity” by inserting air as a filling gas. The cavity model employed by the simulation software refers to the ISO 15099 standard [46].
According to the standard ISO 15099, an unventilated frame cavity can be evaluated as though it contains an opaque solid. So, an “effective conductivity” can be assigned to this frame cavity, which accounts for both the radiative and convective heat transfer. The “effective conductivity” can be determined with Equation (1).
λ e f f = h c v + h r × d W / mK
where λ e f f is the effective conductivity, h c v is the convective heat transfer coefficient [W/m2K], h r is the radiative heat transfer coefficient [W/m2K], and d is the thickness of the air cavity in the direction of the flow [m].
The convective heat transfer coefficient, h c v (Equation (2)), is calculated from the Nusselt number, Nu, which can be determined from various correlation depending on aspect ratio, orientation, and direction of the heat flow.
h c v = N u λ a i r d
where λ a i r is the thermal conductivity of the air.
The radiative heat transfer coefficient, h r , can be calculated using Equation (3), by assuming a radiant heat flow in the horizontal direction.
h r = 4 σ T a v e r a g e 3 1 ε c c + 1 ε c h 2 + 1 1 2 1 + L h L v 2 1 2 L h L v + 1
where T a v e r a g e = T c c + T c h 2 [K], whereby T c c and T c h are the temperatures on the cold and hot sides, respectively, σ is the Stefan–Boltzmann constant [W/m2K4], ε c c is the total hemispherical emissivity on the cold side, ε c v is the total hemispherical emissivity on the hot side, and L v and L h are the cavity dimensions in the vertical and horizontal directions, respectively.
Finally, the boundary conditions were defined, i.e., the relative temperature and film coefficient. In particular, the temperature assigned to the external surface of the block was 25 °C. The external film coefficient was 25 W/m2K, resulting from the inverse of the external surface thermal resistance, which according to EN ISO 6946 [47] is equal to 0.04 m2K/W. For the internal surface of the blocks, the boundary conditions were the surface temperature being equal to 40 °C and a film coefficient of 7.69 W/m2K, deriving from the inverse of the internal surface thermal resistance which was equal to 0.13 m2K/W [47].
Once the geometry of the section, the properties of the materials, and the boundary conditions were defined, the THERM software automatically generated the mesh of the section to perform the 2D heat transfer analysis.
The results obtained by the THERM simulations are shown in Table 1.

2.2.2. Blocks’ Realization

With the aim of carrying out the pre-established experimental analyses, the blocks were realized using a 3D printer. To this end, the blocks were first modeled three-dimensionally with an AutoCAD Inventor® (Figure 4).
Subsequently, with the Creality Slicer 4.2 slicing software, all of the printing parameters were defined, including the quality, the characteristics of the shell, those of the filling, the type of material used, the printing temperature and that of the print bed, the print speed, and the nozzle size. For the realization of the blocks, it was decided to use a brass nozzle with a diameter of 0.4 mm. The printing temperature, which was set at 210 °C, was defined based on the selected material, namely PLA, whose extrusion temperature varies between 200 °C and 230 °C. The print bed temperature, on the other hand, was set at 60 °C.
After entering all the necessary parameters, the slicing software has calculated the amount of material and the printing time necessary for the realization of the three blocks. In particular:
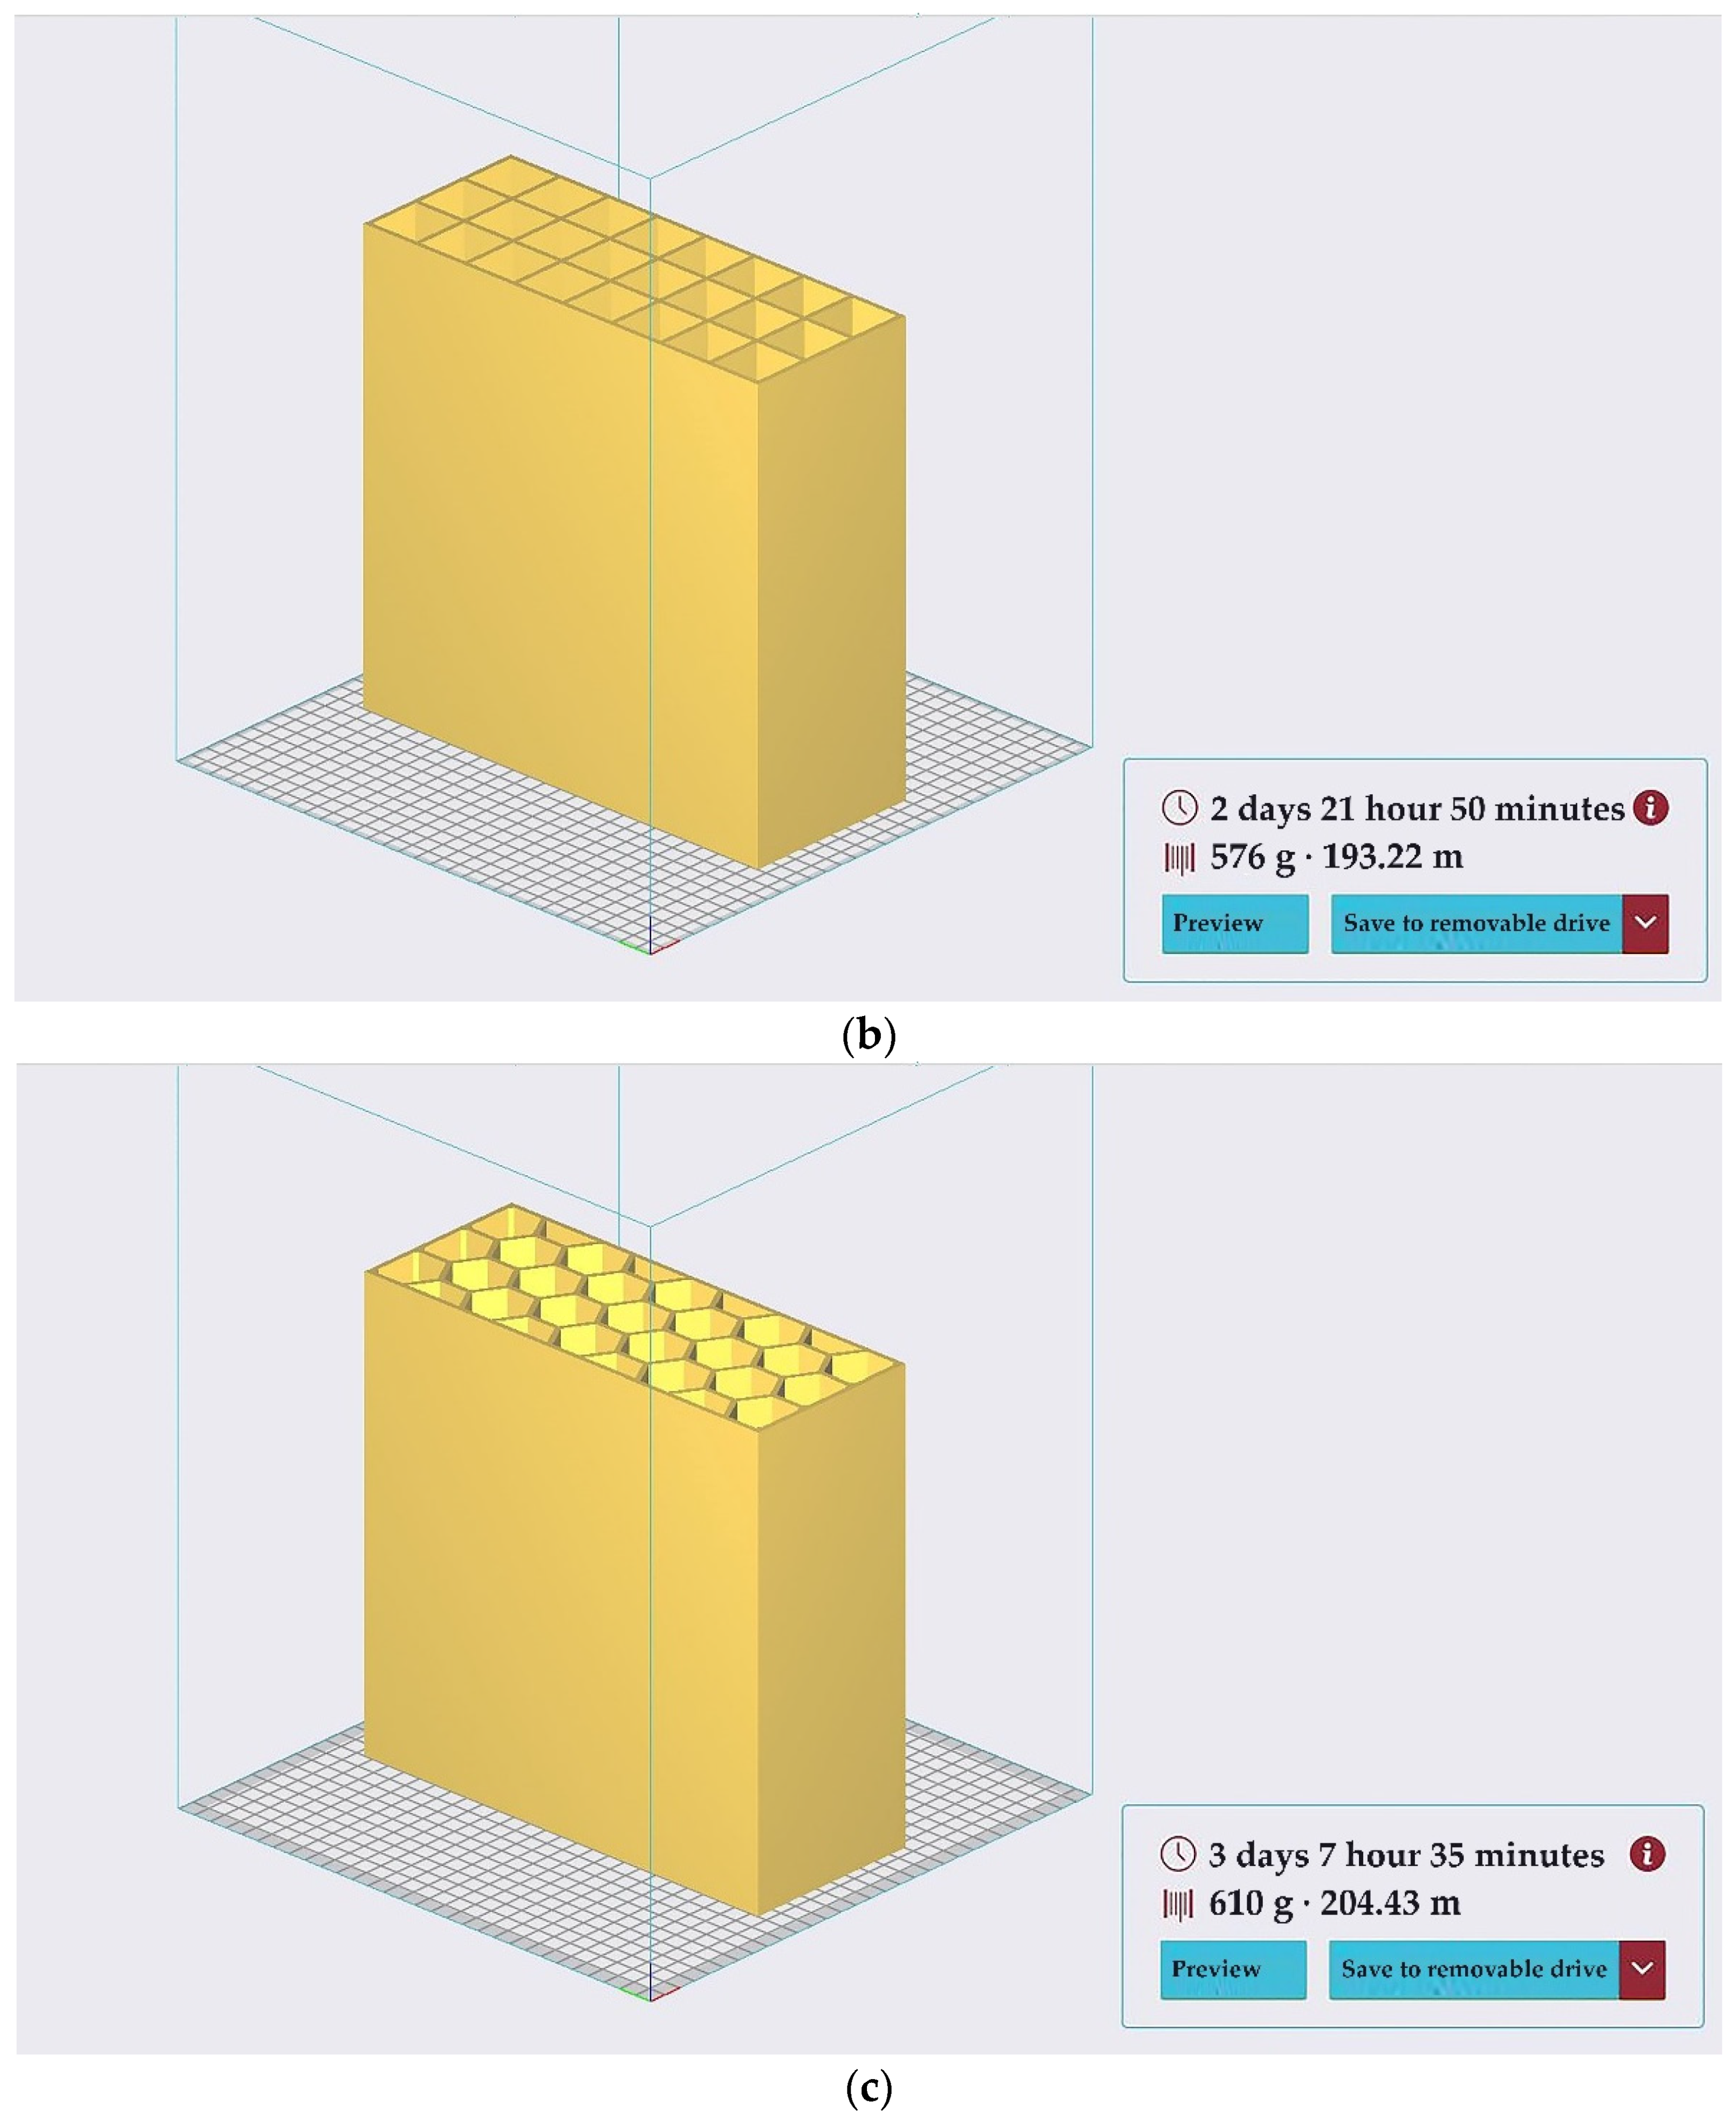
  • The multi-row block (Figure 5a) required 2 days, 1 h, 31 min to be produced and 438 g of material.
  • The square structure block (Figure 5b) needed 2 days, 21 h, 50 min to be produced and 576 g of material.
  • The honeycomb structure block (Figure 5c) required 3 days, 7 h, 35 min to be produced and 610 g of PLA.
The G-Code file generated by Creality Slicer 4.2 provided the data that were needed by the Creality CR-3040 PRO 3D printer for the realization of the three blocks (Figure 6).

2.3. Analysis Phase

The analysis phase was performed with the aim of having a continuous comparison between the data that were obtained through THERM simulations and those obtained by the HFM method and IRT technique during the Hot Box experimental campaigns.
The HFM experimental analysis was conducted in the Hot Box that was designed and built by the “G. Parolini Laboratory of Applied and Technical Physics” of the University of L’Aquila based on the established knowledge in the field [48,49].
The Hot Box employed in this work, which is shown in Figure 7, has been thoroughly described in a previous work by de Rubeis [40]. The Hot Box analysis was carried out with the use of two surface temperature probes, one air temperature probe inside the Hot Box, and one heat flow sensor (Figure 7a). The temperature probes were installed on both the surfaces of the block, both the internal and external ones, while the heat flow sensor was applied on the internal side of the object.
The measurements were conducted in the laboratory, where the temperature was about 25 °C. Therefore, the temperature of the hot chamber has been set at 52 °C to ensure a sufficient temperature difference of at least 15–20 °C, which is in accordance with the provisions of the ISO 9869 standard [50].
The data logger has been set to record the values of the heat flow, the internal and external surface temperatures, and the air temperature inside the Hot Box. Ten-hour measurements with an acquisition time of 10 min were carried out for each block. All of the measured data were then processed using the progressive average method, as indicated in the ISO 9869 standard [50], to obtain the conductance (Λ) and the thermal resistance (R) values, using Equations (4) and (5), respectively:
Λ =   j = 1 n q j j = 1 n T s , i n , j   T s , o u t , j       W / m 2 K
R = j = 1 n T s , i n , j   T s , o u t , j   j = 1 n q j       m 2 K / W
where:
-
j = 1 n T s , i n , j   T s , o u t , j is the progressive sum of the differences between the internal and external surface temperatures [°C];
-
j = 1 n q j is the progressive sum of the density of the heat flux [W/m2].
Finally, the transmittance value was calculated according to Equation (6):
U = 1 R t o t         W / m 2 K  
where ( R t o t ) is the total thermal resistance which also includes ( R s , i )   the internal and external ( R s , e ) thermal resistances, which were taken from the EN ISO 6946 standard [47], which are equal to 0.13 m2K/W and 0.04 m2K/W, respectively.
Then, the IRT technique was performed using a FLIR T1020 IR camera, according to the configuration schematized in Figure 8, after reaching a steady-state condition between the surfaces of the block. The survey was carried out at a distance of 1.50 m from the blocks.
The measuring instruments used for the experimental analyses are shown in Table 2.

3. Results

The experimental analyses were carried out by use of the Hot Box apparatus. The analysis of each block lasted for three days from 11:00 a.m. to 7:30 p.m. During the night, however, the machine was turned off for safety reasons. Each of the experimental campaigns were elaborated separately using the progressive averages method [50] to obtain the conductance (Λ), the thermal resistance (R), and finally, the transmittance (U) values, using, respectively, Equations (4)–(6).
The results obtained from the HFM experimental campaigns of each block are summarized in Table 3.
It is worth noting that the results of the three tests for each of the blocks are similar, and that the best thermal behavior was obtained with the honeycomb structure block. Due to this similarity, only the results obtained from the third HFM experimental campaign for each block are shown in Figure 9. The uncertainty analysis and propagation of uncertainty were carried out following Holman’s method [51].
To better understand the thermal performance differences between the three blocks, U-value comparative graphs are shown in Figure 10.
The results obtained show that the U-value decreases as the internal geometry of the blocks becomes more complex and the air cavities become smaller. In fact, by comparing the U-values of the blocks with square and honeycomb structures with the multi-row block, reductions that are equal to −12.6% and −14.7%, respectively, can be observed. Although the percentage difference between the square structure and the honeycomb structure blocks is small (about 2.5%), the same result was obtained both in the preliminary numerical study (about 4.9%) and in the experimental results.
This result turns out to be very interesting, since the main goal of the work is to evaluate the potential of 3D printing for the creation of blocks that have progressively more complex geometries and optimized thermal performances. When stable and steady thermal conditions between the two surfaces of the blocks were achieved, the IRT surveys allowed for a more detailed examination of the thermal behavior of the blocks (Figure 11). The thermograms show that the third block has less thermal stratification and a more homogeneous temperature trend on the external surface.
For a more detailed explanation of the effects of different internal geometries on the heat transfer pattern, infrared images of top and bottom of the three blocks were acquired to show the thermal distribution within the blocks as their geometry changes (Figure 12).
From a performance point of view, the 3D-printed blocks showed values that are still far from the thermal resistance values of the commonly used insulation materials (Table 4). However, this preliminary study is only aimed at evaluating the thermal effects resulting from the internal geometries of the blocks, leaving the air cavities devoid of thermal insulating materials.
Finally, the results obtained for the three blocks analysed were compared with the thermal performance of other blocks proposed in the literature [40], as shown in Table 5. It is worth noting that, although the blocks here proposed were analysed without insulating materials in the air cavities, when the internal geometries became more complex (i.e., square and honeycomb), their thermal performance was comparable to that of the polystyrene-filled blocks. This result highlights that 3D printing, thanks to its great realization potential, allows for the study of solutions that maximize the thermal performance, even by reducing the use of common insulating materials.

4. Conclusions

Three-dimensional printing is an innovative technique that allows for a high design freedom. Complex geometric shapes, which are impossible to make using conventional methods, can be created by attempting to implement biomimetic architecture to sustainable designs.
In this paper, three different blocks, characterized by different internal geometries and fabricated by 3D printing, are presented. The main findings showed that increased internal geometric complexity of the blocks enabled a thermal performance improvement. In fact, the best performance was obtained with the honeycomb structure block, for which a thermal transmittance of 1.22 W/m2K was obtained, i.e., it was 14.7% lower than it was for the simpler multi-row block. Even in terms of thermal stratification, which was evaluated by the IRT technique on the external surface of the blocks, the honeycomb structure block showed better behavior. Conversely, complicating the block geometry resulted in more realization time to make the block and more material which was needed.
These results open the way to a long series of experiments related to this technology and its production potential. The ability of 3D printing to create a wide range of shapes could also represent an interesting opportunity for research in the field of buildings thermal performance optimization. However, the shortcomings of using 3D printing to create thermal insulation blocks, basically due to the printing time and size, must also be pointed out.
New geometries and insulating materials that are to be used to fill air cavities represent potential future developments of great interest, as well as the study of the blocks’ mechanical properties and their potential application in real operating conditions.

Author Contributions

Conceptualization, T.d.R.; methodology, T.d.R. and D.A.; software, A.C. and L.G.; validation, T.d.R., A.C. and L.G.; formal analysis, T.d.R., A.C. and L.G.; investigation, A.C. and L.G.; resources, T.d.R., A.C. and L.G.; data curation, T.d.R., A.C. and L.G.; writing—original draft preparation, A.C. and L.G.; writing—review and editing, T.d.R. and D.A.; visualization, T.d.R., A.C., L.G. and D.A.; supervision, T.d.R. and D.A.; funding acquisition, T.d.R. and D.A. All authors have read and agreed to the published version of the manuscript.

Funding

This research was partially funded by “Progetti di Ateneo per Avvio alla Ricerca, Decreto del Rettore n. 786 del 13.07.2021” of the University of L’Aquila, for the Project titled “BIT-3D”.

Institutional Review Board Statement

Not applicable.

Informed Consent Statement

Not applicable.

Data Availability Statement

Not applicable.

Acknowledgments

T.d.R. thanks the University of L’Aquila for the financial support. All of the authors thank Giovanni Pasqualoni for the fundamental technical support.

Conflicts of Interest

The authors declare no conflict of interest. The funders had no role in the design of the study; in the collection, analyses, or interpretation of data; in the writing of the manuscript; or in the decision to publish the results.

References

  1. European Commission. Clean Energy for all Europeans Package; Publications Office of the European Union: Luxembourg, 2019.
  2. Suresh, C.; Kumar Hotta, T.; Saha, S.K. Phase change material incorporation techniques in building envelopes for enhancing the building thermal Comfort—A review. Energy Build. 2022, 268, 112225. [Google Scholar] [CrossRef]
  3. Abu Bakar, N.N.; Hassan, M.Y.; Abdullah, H.; Rahman, H.A.; Abdullah, M.P.; Hussin, F.; Bandi, M. Energy efficiency index as an indicator for measuring building energy performance: A review. Renew. Sustain. Energy Rev. 2015, 44, 1–11. [Google Scholar] [CrossRef]
  4. European Commission. “Fit for 55” Package; Publications Office of the European Union: Luxembourg, 2021.
  5. Pajonk, A.; Prieto, A.; Blum, U.; Knaack, U. Multi-material additive manufacturing in architecture and construction: A review. J. Build. Eng. 2022, 45, 103603. [Google Scholar] [CrossRef]
  6. Cárdenas-Ramírez, C.; Gómez, M.A.; Jaramillo, F.; Cardona, A.F.; Fernández, A.G.; Cabeza, L.F. Experimental steady-state and transient thermal performance of materials for thermal energy storage in building applications: From powder SS-PCMs to SS-PCM-based acrylic plaster. Energy 2022, 250, 123768. [Google Scholar] [CrossRef]
  7. Pielichowska, K.; Pielichowski, K. Phase change materials for thermal energy storage. Prog. Mater. Sci. 2014, 65, 67–123. [Google Scholar] [CrossRef]
  8. Keshteli, A.N.; Sheikholeslami, M. Nanoparticle enhanced PCM applications for intensification of thermal performance in building: A review. J. Mol. Liq. 2019, 274, 516–533. [Google Scholar] [CrossRef]
  9. Hasse, C.; Grenet, M.; Bontemps, A.; Dendievel, R.; Sallée, H. Realization, test and modelling of honeycomb wallboards containing a Phase Change Material. Energy Build. 2011, 43, 232–238. [Google Scholar] [CrossRef]
  10. Zhou, B.; Chen, Z.; Cheng, Q.; Xiao, M.; Bae, G.; Liang, D.; Hasan, T. Controlling surface porosity of graphene-based printed aerogels. NPJ 2D Mater. Appl. 2022, 34, 34. [Google Scholar] [CrossRef]
  11. Heier, J.; Bales, C.; Martin, V. Combining thermal energy storage with buildings—A review. Renew. Sustain. Energy Rev. 2015, 42, 1305–1325. [Google Scholar] [CrossRef]
  12. Castell, A.; Martorell, I.; Medrano, M.; Pérez, G.; Cabeza, L.F. Experimental study of using PCM in brick constructive solutions for passive cooling. Energy Build. 2010, 42, 534–540. [Google Scholar] [CrossRef]
  13. Al-Yasiri, Q.; Szabò, M. Thermal performance of concrete bricks based phase change material encapsulated by various aluminium containers: An experimental study under Iraqi hot climate conditions. J. Energy Storage 2021, 40, 102710. [Google Scholar] [CrossRef]
  14. Rathore, P.K.S.; Kumar Gupta, N.; Yadav, D.; Kumar Shukla, S.; Kaul, S. Thermal performance of the building envelope integrated with phase change material for thermal energy storage: An updated review. Sustain. Cities Soc. 2022, 79, 103690. [Google Scholar] [CrossRef]
  15. Aditya, L.; Mahlia, T.M.I.; Rismanchi, B.; Hasan, M.H.; Metselaar, H.S.C.; Muraza, O.; Aditiya, H.B. A review on insulation materials for energy conservation in buildings. Renew. Sustain. Energy Rev. 2017, 73, 1352–1365. [Google Scholar] [CrossRef]
  16. du Plessisa, A.; Broeckhoven, C.; Yadroitsava, I.; Yadroitsev, I.; Handsd, C.H.; Kunju, R.; Bhate, D. Beautiful and Functional: A Review of Biomimetic Design in Additive Manufacturing. Addit. Manuf. 2019, 27, 408–427. [Google Scholar] [CrossRef]
  17. Chaturvedi, I.; Jandyal, A.; Wazir, I.; Raina, A.; Haq, M.I.U. Biomimetics and 3D printing—Opportunities for design applications. M.I. Sens. Int. 2022, 3, 100191. [Google Scholar] [CrossRef]
  18. Gu, G.X.; Chen, C.T.; Richmond, D.J.; Buehler, M.J. Bioinspired hierarchical composite design using machine learning: Simulation, additive manufacturing, and experiment. Mater. Horiz. 2018, 5, 939–945. [Google Scholar] [CrossRef]
  19. Mahmoud, R.; El-Zeiny, A. Biomimicry as a Problem Solving Methodology in Interior Architecture. Procedia Soc. Behav. Sci. 2012, 50, 502–512. [Google Scholar]
  20. Müller, R.; Abaid, N.; Boreyko, J.B.; Fowlkes, C.; Goel, A.K.; Grimm, C.; Jung, S.; Kennedy, B.; Murphy, C.; Cushing, N.D.; et al. Biodiversifying bioinspiration. Inspir. Biomim. 2018, 13, 053001. [Google Scholar] [CrossRef]
  21. Zhang, Q.; Yang, X.; Li, P.; Huang, G.; Feng, S.; Shen, C.; Han, B.; Zhang, X.; Jin, F.; Xu, F.; et al. Bioinspired engineering of honeycomb structure—Using nature to inspire human innovation. Prog. Mater. Sci. 2015, 74, 332–400. [Google Scholar] [CrossRef]
  22. Panda, B.; Leite, M.; Biswal, B.B.; Niu, X.; Garg, A. Experimental and numerical modelling of mechanical properties of 3D printed honeycomb structures. Measurement 2018, 116, 495–506. [Google Scholar] [CrossRef]
  23. Zeng, C.; Liu, L.; Bian, W.; Leng, J.; Liu, Y. Compression behavior and energy absorption of 3D printed continuous fiber reinforced composite honeycomb structures with shape memory effects. Addit. Manuf. 2021, 38, 101842. [Google Scholar] [CrossRef]
  24. Jandyal, A.; Chaturvedi, I.; Wazir, I.; Raina, A.; Ul Haq, M.I. 3D printing –A review of processes, materials and applications in industry 4.0. Sustain. Oper. Comput. 2022, 3, 33–42. [Google Scholar] [CrossRef]
  25. Pan, Y.; Zhang, Y.; Zhang, D.; Song, Y. 3D printing in construction: State of the art and applications. Int. J. Adv. Manuf. Technol. 2021, 115, 1329–1348. [Google Scholar] [CrossRef]
  26. Evans, M.A.; Campbell, R.I. A comparative evaluation ofindustrial design models produced using rapid prototyping and workshop-based fabrication techniques. Rapid Prototyp. J. 2003, 9, 344–351. [Google Scholar] [CrossRef]
  27. Wegrzyn, T.F.; Golding, M.; Archer, R.H. Food layered manufacture: A new process for constructing solid foods. Trends Food Sci. Technol. 2012, 27, 66–72. [Google Scholar] [CrossRef]
  28. Attaran, M. The rise of 3-D printing: The advantages of additive manufacturing over traditional manufacturing. Bus. Horiz. 2017, 60, 677–688. [Google Scholar] [CrossRef]
  29. Labonnote, N.; Rønnquist, A.; Manum, B.; Rüther, P. Additive construction: State-ofthe-art, challenges and opportunities. Autom. Constr. 2016, 72, 347–366. [Google Scholar] [CrossRef]
  30. Wu, P.; Wang, J.; Wang, X. A critical review of the use of 3-D printing in the construction industry. Autom. Constr. 2016, 68, 21–31. [Google Scholar] [CrossRef]
  31. Gosselin, C.; Duballet, R.; Roux, P.; Gaudillière, N.; Dirrenberger, J.; Morel, P. Largescale 3D printing of ultra-high performance concrete—A new processing route for architects and builders. Mater. Des. 2016, 100, 102–109. [Google Scholar] [CrossRef]
  32. Berman, B. 3-D printing: The new industrial revolution. Bus. Horiz. 2012, 55, 155–162. [Google Scholar] [CrossRef]
  33. Buswell, R.A.; Thorpe, A.; Soar, R.C.; Gibb, A.G.F. Design, data and process issues for mega-scale rapid manufacturing machines used for construction. Autom. Constr. 2008, 17, 923–929. [Google Scholar] [CrossRef] [Green Version]
  34. Bos, F.; Wolfs, R.; Ahmed, Z.; Salet, T. Additive manufacturing of concrete in construction: Potentials and challenges of 3D concrete printing. Virtual Phys. Prototyp. 2016, 2759, 1–17. [Google Scholar] [CrossRef]
  35. M K Dixit. 3-D Printing in Building Construction: A Literature Review of Opportunities and Challenges of Reducing Life Cycle Energy and Carbon of Buildings. IOP Conf. Ser. Earth Environ. Sci. 2019, 290, 012012. [Google Scholar] [CrossRef]
  36. Suntharalingam, T.; Upasiri, I.; Gatheeshgar, P.; Poologanathan, K.; Nagaratnam, B.; Santos, P.; Rajanayagam, H. Energy Performance of 3D-Printed Concrete Walls: A Numerical Study. Buildings 2021, 11, 432. [Google Scholar] [CrossRef]
  37. Marais, H.; Christen, H.; Cho, S.; De Villiers, W.; Van Zijl, G. Computational assessment of thermal performance of 3D printed concrete wall structures with cavities. J. Build. Eng. 2021, 41, 102431. [Google Scholar] [CrossRef]
  38. Al-Tamimi, A.S.; Al-Amoudi, O.S.B.; Al-Osta, M.A.; Ali, M.R.; Ahmad, A. Effect of insulation materials and cavity layout on heat transfer of concrete masonry hollow blocks. Constr. Build. Mater. 2020, 254, 119300. [Google Scholar] [CrossRef]
  39. Grabowska, B.; Kasperski, J. The Thermal Conductivity of 3D Printed Plastic Insulation Materials—The Effect of Optimizing the Regular Structure of Closures. Materials 2020, 13, 4400. [Google Scholar] [CrossRef]
  40. de Rubeis, T. 3D-Printed Blocks: Thermal Performance Analysis and Opportunities for Insulating Materials. Sustainability 2022, 14, 1077. [Google Scholar] [CrossRef]
  41. Windows & Daylighting. THERM Software Downloads. Available online: https://windows.lbl.gov/tools/therm/software-download (accessed on 2 August 2022).
  42. Atakok, G.; Kam, M.; Koc, H.B. Tensile, three-point bending and impact strength of 3D printed parts using PLA and recycled PLA filaments: A statistical investigation. J. Mater. Res. Technol. 2022, 18, 1542–1554. [Google Scholar] [CrossRef]
  43. Menezes, O.; Roberts, T.; Motta, G.; Patrenos, M.H.; McCurdy, W.; Alotaibi, A.; Vanderpool, M.; Vaseghi, M.; Beheshti, A.; Davami, K. Performance of additively manufactured polylactic acid (PLA) in prolonged marine environments. Polym. Degrad. Stab. 2022, 199, 109903. [Google Scholar] [CrossRef]
  44. Rodríguez-Reyna, S.L.; Mata, C.; Díaz-Aguilera, J.H.; Acevedo-Parra, H.R.; Tapia, F. Mechanical properties optimization for PLA, ABS and Nylon + CF manufactured by 3D FDM printing. Mater. Today Commun. 2022, 33, 104774. [Google Scholar] [CrossRef]
  45. Windows & Daylighting. Heat-Transfer Analysis. Available online: https://windows.lbl.gov/tools/knowledge-base/articles/therm-components (accessed on 12 September 2022).
  46. ISO 15099:2003; Thermal Performance of Windows, Doors and Shading Devices—Detailed Calculations. Technical Committee ISO/TC 163: Geneva, Switzerland, 2003.
  47. EN ISO 6946:2017; Building Components and Building Elements—Thermal Resistance and Thermal Transmittance—Calculation Methods. European Committee for Standardization: Brussels, Belgium, 2017.
  48. de Rubeis, T.; Muttillo, M.; Nardi, I.; Pantoli, L.; Stornelli, V.; Ambrosini, D. Integrated Measuring and Control System for Thermal Analysis of Buildings Components in Hot Box Experiments. Energies 2019, 12, 2053. [Google Scholar] [CrossRef]
  49. de Rubeis, T.; Nardi, I.; Muttillo, M. Development of a low-cost temperature data monitoring. An upgrade for hot box apparatus. J. Phys. Conf. Ser. 2017, 923, 012039. [Google Scholar] [CrossRef]
  50. EN ISO 9869-1:2014; Thermal Insulation—Building Elements—In-Situ Measurement of Thermal Resistance and Thermal Transmittance, Part 1: Heat Flow Meter Method. European Committee for Standardization: Brussels, Belgium, 2014.
  51. Holman, J.P. Experimental Methods for Engineers, 8th ed.; McGraw-Hill Series in Mechanical Engineering; McGraw-Hill: New York, NY, USA, 2012; ISBN 13: 9780073529301. [Google Scholar]
Figure 1. Methodology flowchart representing the various work phases.
Sustainability 14 15830 g001
Figure 2. 2D and 3D blocks’ design. (a) Multi-row structure. (b) Square structure. (c) Honeycomb structure. (Measurements in millimeters). PLA thickness is equal to 3 mm.
Sustainability 14 15830 g002aSustainability 14 15830 g002b
Figure 3. 2D Modeling of the blocks on THERM. (a) Multi-row structure. (b) Square structure. (c) Honeycomb structure. Legend: (Blue) is the outer surface, (Red) is the inner surface, (Green) is the PLA, (Cyan) is the air, and (Black) the adiabatic surfaces.
Sustainability 14 15830 g003
Figure 4. 3D models of the blocks on AutoCAD Inventor®. (a) Multi-row structure. (b) Square structure. (c) Honeycomb structure.
Sustainability 14 15830 g004
Figure 5. Definition of the printing parameters on Creality Slicer 4.2. (a) Multi-row structure. (b) Square structure. (c) Honeycomb structure.
Sustainability 14 15830 g005aSustainability 14 15830 g005b
Figure 6. An example of printing process for the honeycomb structure block.
Sustainability 14 15830 g006
Figure 7. Hot box configuration scheme used for the HFM analysis (a) and setup pictures (b). Legend: (HF) is the heat flux sensor, (Ts) and (Tair) are surface and air temperature probes, respectively. (Measurements in millimeters).
Sustainability 14 15830 g007aSustainability 14 15830 g007b
Figure 8. Configuration scheme used for the thermographic survey.
Sustainability 14 15830 g008
Figure 9. Conductance and transmittance experimental results. (a) Multi-row block. (b) Square structure block. (c) Honeycomb structure block.
Sustainability 14 15830 g009
Figure 10. Comparison of the blocks’ thermal transmittance.
Sustainability 14 15830 g010
Figure 11. IR thermography results. (a) Multi-row block. (b) Square structure block. (c) Honeycomb structure block. (Data are in °C).
Sustainability 14 15830 g011aSustainability 14 15830 g011b
Figure 12. Infrared thermal images of the three blocks (from the top left column; from the bottom right column). (a) Multi-row block. (b) Square-structured block. (c) Honeycomb-structured block.
Sustainability 14 15830 g012
Table 1. Theoretical U-values obtained by the THERM simulations.
Block TypeTransmittance [W/m2K]
Multi-row block1.52
Square structure block1.29
Honeycomb structure block1.23
Table 2. Characteristics of the measuring instruments used for the experimental analyses.
SensorTypeMeasuring RangeResolution
Heat flow meterHukseflux HFP01From −2000 to 2000 W/m260 × 10 6 V/(W/m2)
Surface temperatureLSI Lastem DLE 124From −40 to 80 °C0.01 °C
Air TemperatureLSI Lastem DLA 033From −40 to 80 °C0.01 °C
DataloggerLSI Lastem M-Log ELO008From –300 to 1200 mV40 µV
IR cameraFLIR T1020From −40 to 2000 °C<20 mK @ 30 °C
Table 3. Results of the HFM experimental campaigns (values in [W/m2K]).
Block TypeTest 1Test 2Test 3
Λ U Λ U Λ U
Multi-row1.94 ± 0.051.46 ± 0.051.89 ± 0.051.43 ± 0.051.89 ± 0.051.43 ± 0.05
Square structure1.66 ± 0.041.30 ± 0.041.58 ± 0.041.25 ± 0.041.58 ± 0.041.25 ± 0.04
Honeycomb structure1.55 ± 0.041.22 ± 0.041.54 ± 0.041.22 ± 0.041.53 ± 0.041.22 ± 0.04
Table 4. Comparison between insulating materials commonly employed and the 3D-printed blocks.
MaterialThermal Resistance Value [m2K/W]
Multi-row 3D-printed block0.66
Square structure 3D-printed block0.78
Honeycomb structure 3D-printed block0.81
Expanded Polystyrene with graphite (Thk. 10 cm, λ = 0.031 W/mK)3.40
Mineral wool (Thk. 10 cm, λ = 0.039 W/mK)2.73
Table 5. Comparison between thermal performance of different 3D printed blocks.
MaterialU-Value [W/m2K]
Multi-row 3D block1.43 ± 0.05
Square structure 3D block1.25 ± 0.04
Honeycomb structure 3D block1.22 ± 0.04
3D block with air cavities [40]2.19 ± 0.07
3D block with polystyrene [40]1.24 ± 0.04
3D block with wool [40]0.69 ± 0.02
Publisher’s Note: MDPI stays neutral with regard to jurisdictional claims in published maps and institutional affiliations.

