
Evaluating Pedestrian Environment Using DeepLab Models Based on Street Walkability in Small and Medium-Sized Cities: Case Study in Gaoping, China


Abstract
:1. Introduction
2. Literature Review
3. Related Theories and Methods
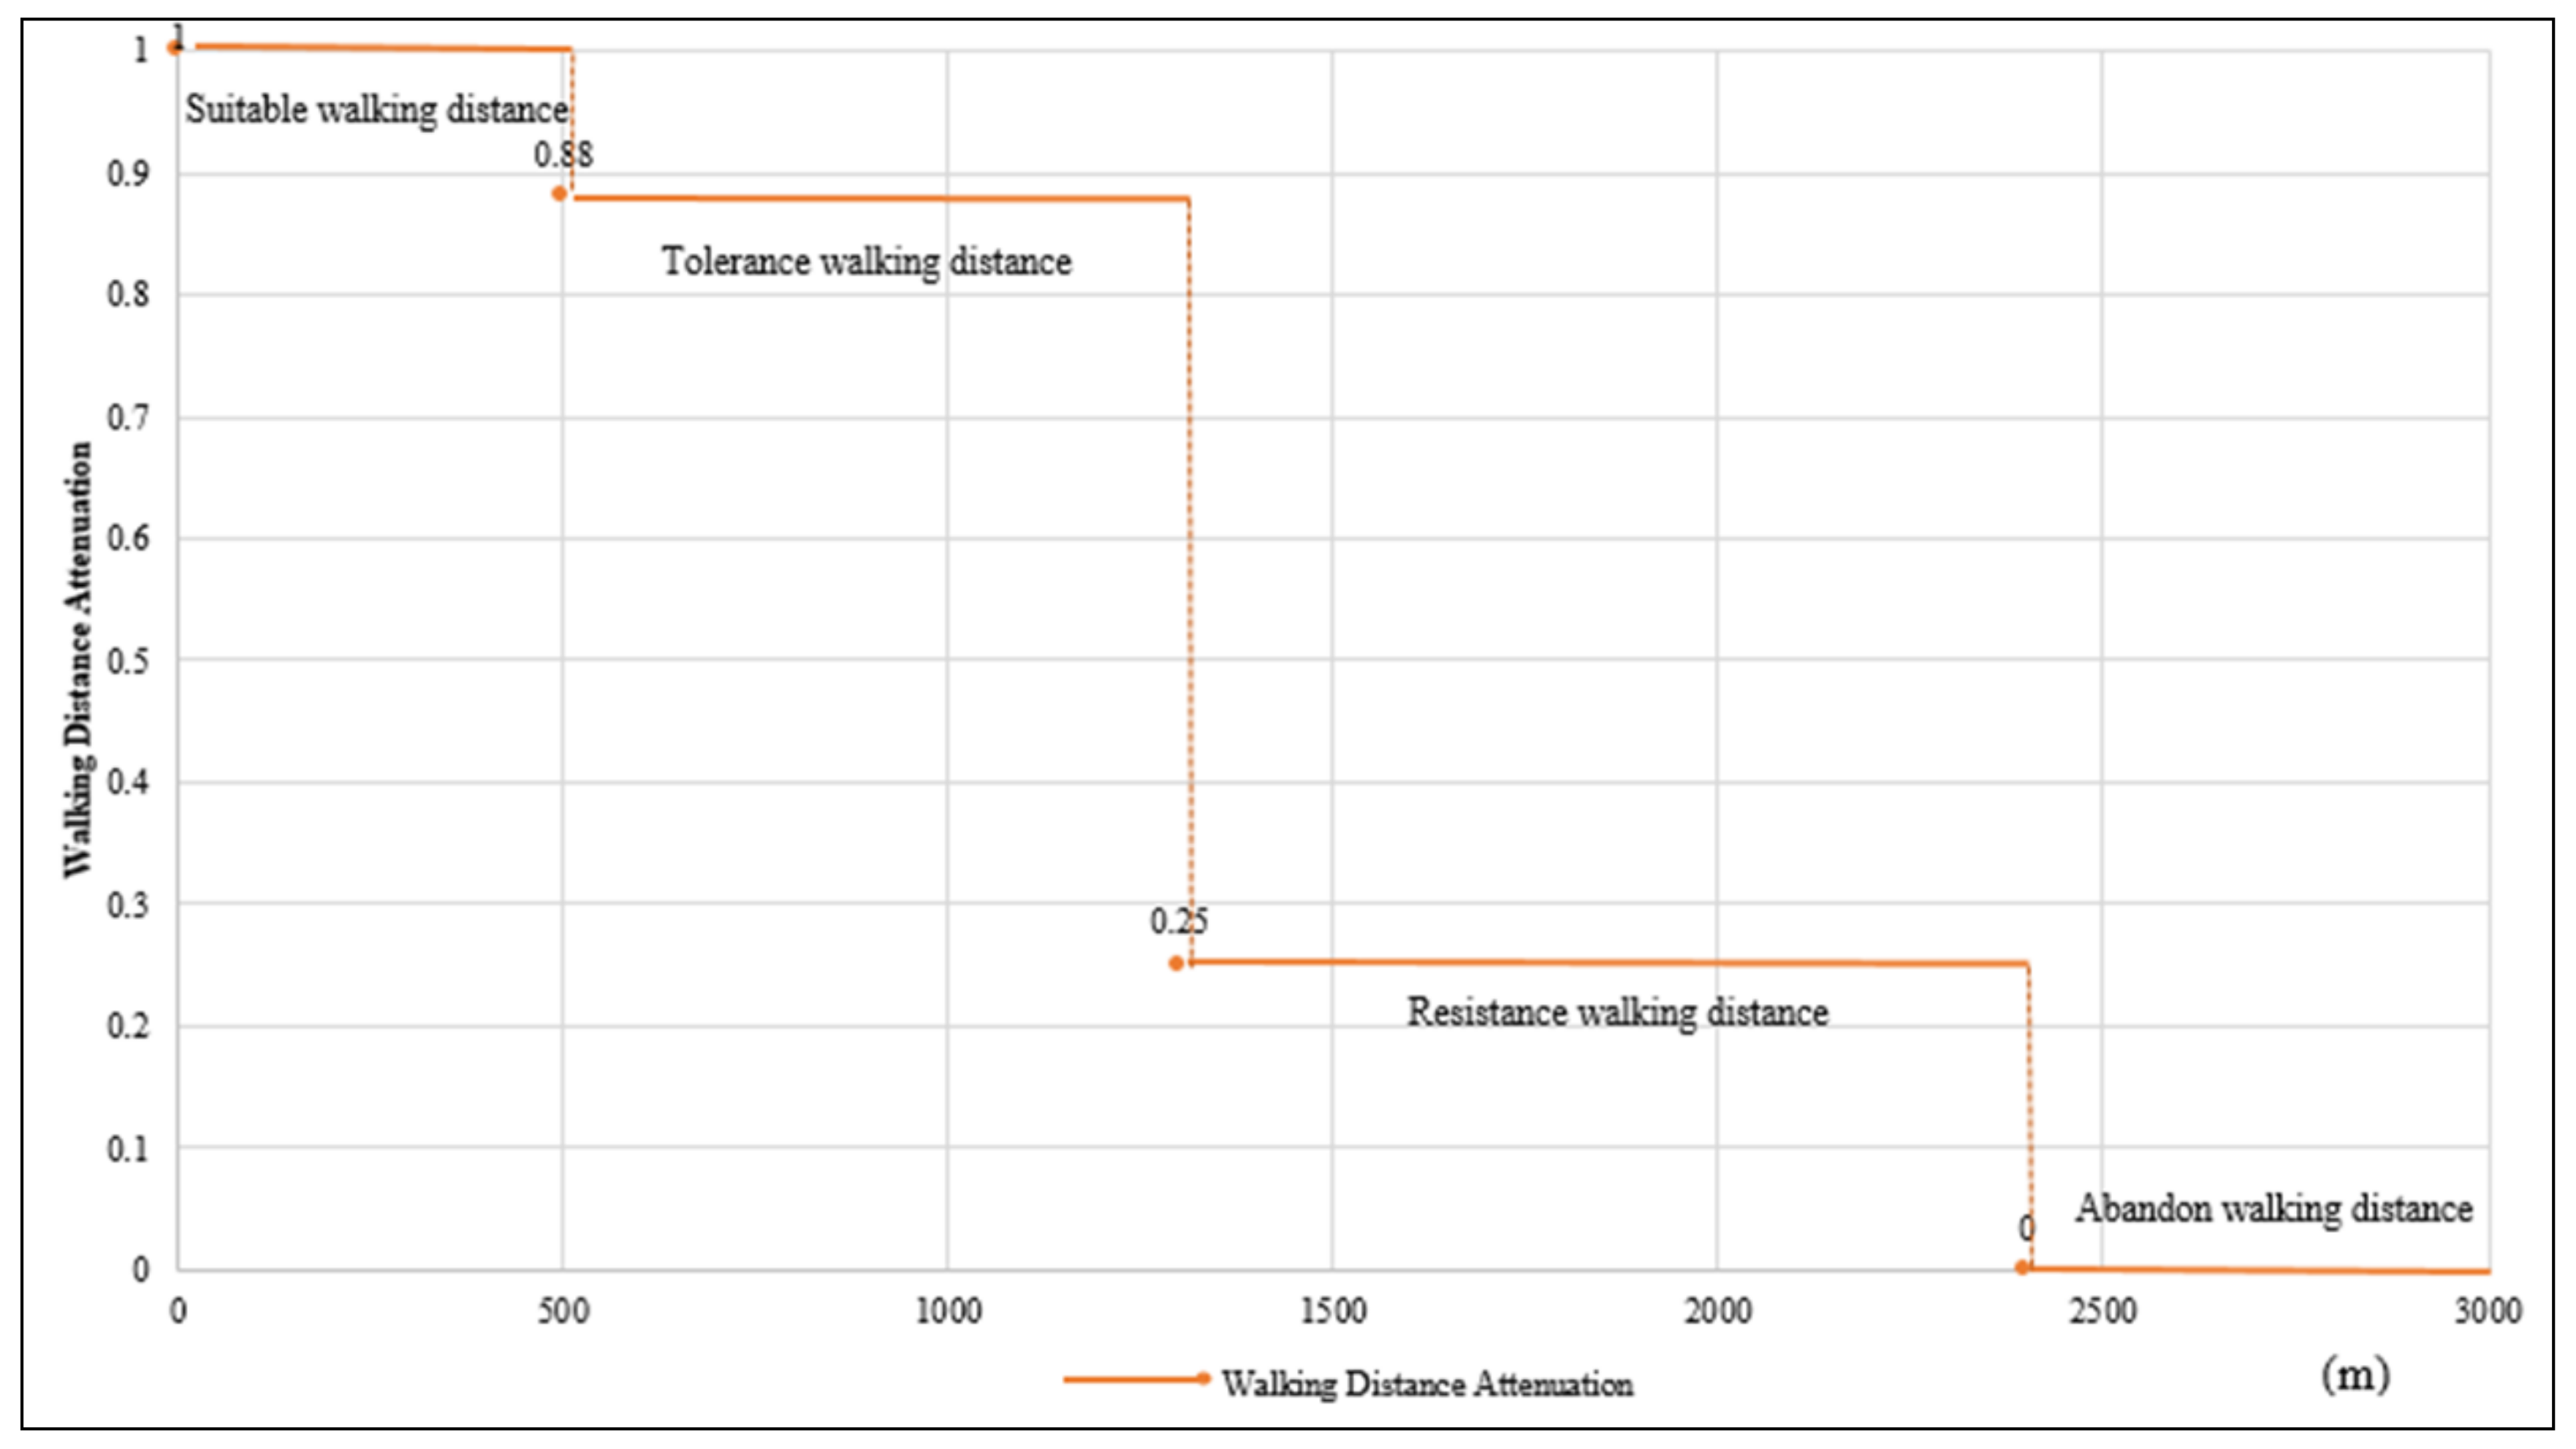
3.1. Walking Distance Attenuation Effect in Street Functional Elements
3.2. Semanteme Division for Visual Construction Elements
3.3. Overall Integration for Walking Scale Elements
4. Methodology
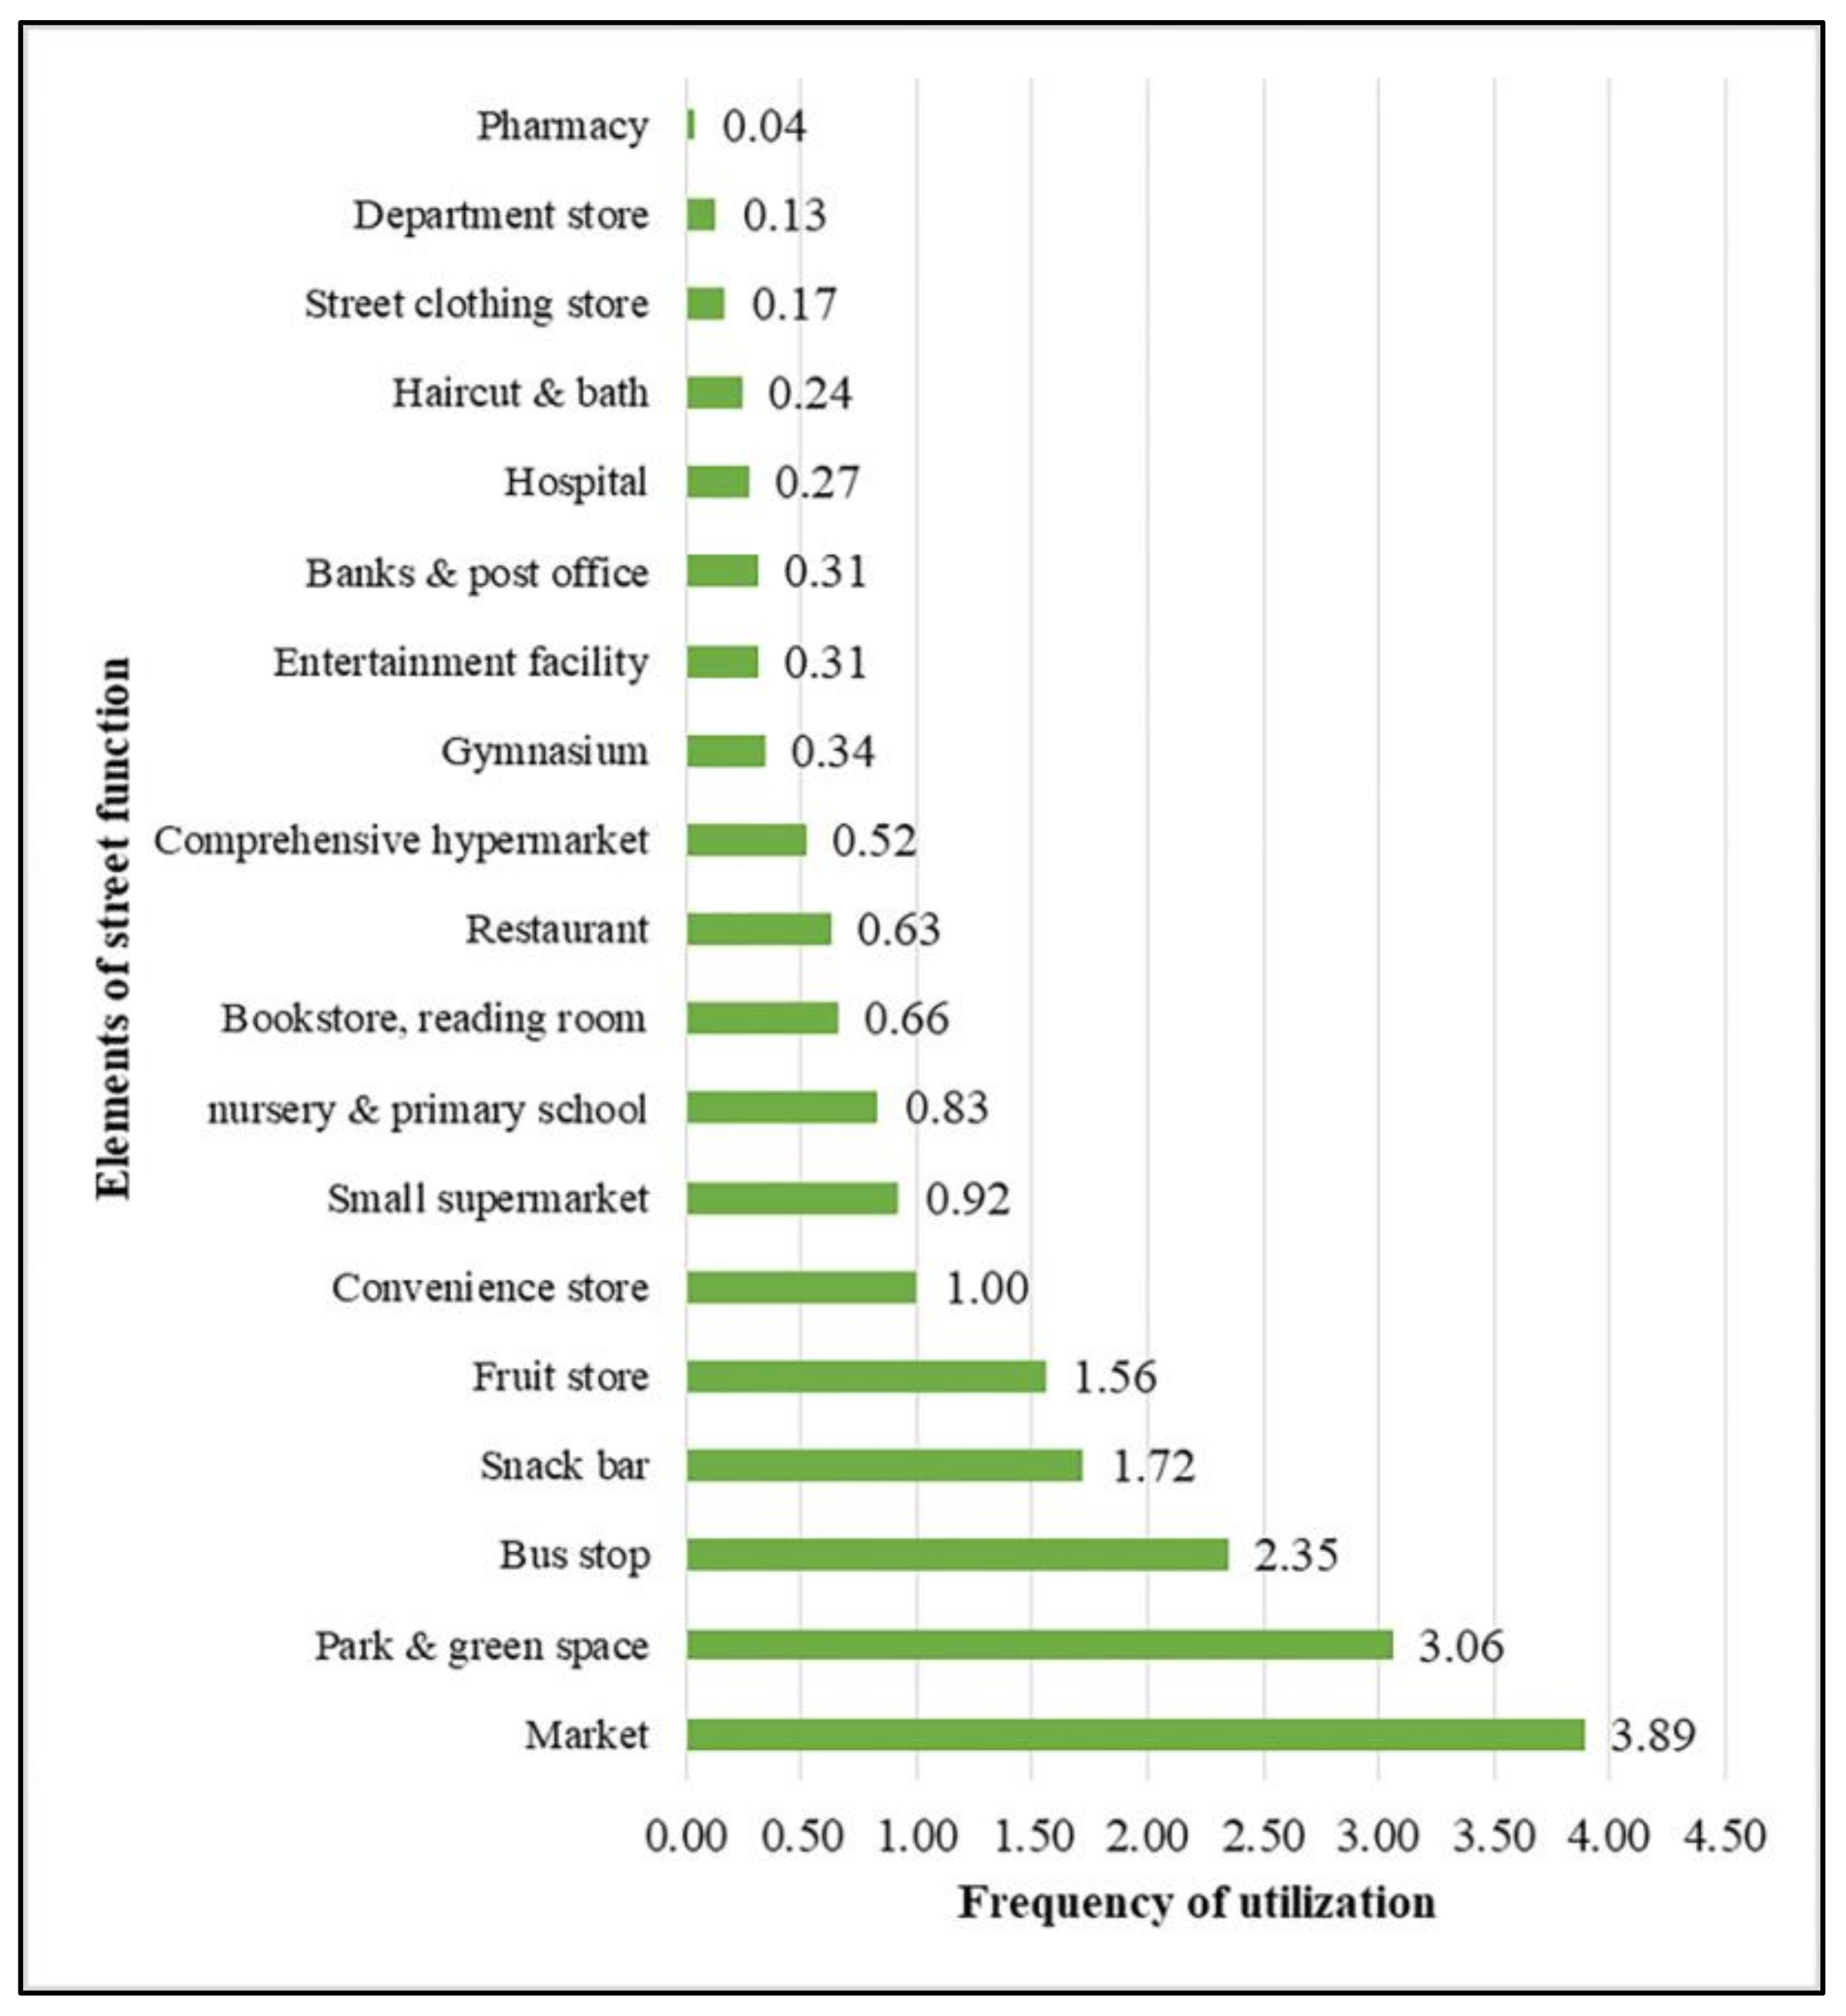
4.1. Pedestrian Street Functional Elements
4.1.1. Classification Weighting
4.1.2. Distance Attenuation Rate of Walking Facilities
4.2. Visual Construction Elements
4.3. Walking Scale Elements
4.3.1. Walkway Width
4.3.2. Street Aspect Ratio
4.3.3. Walking Scale Weight
5. Case Study
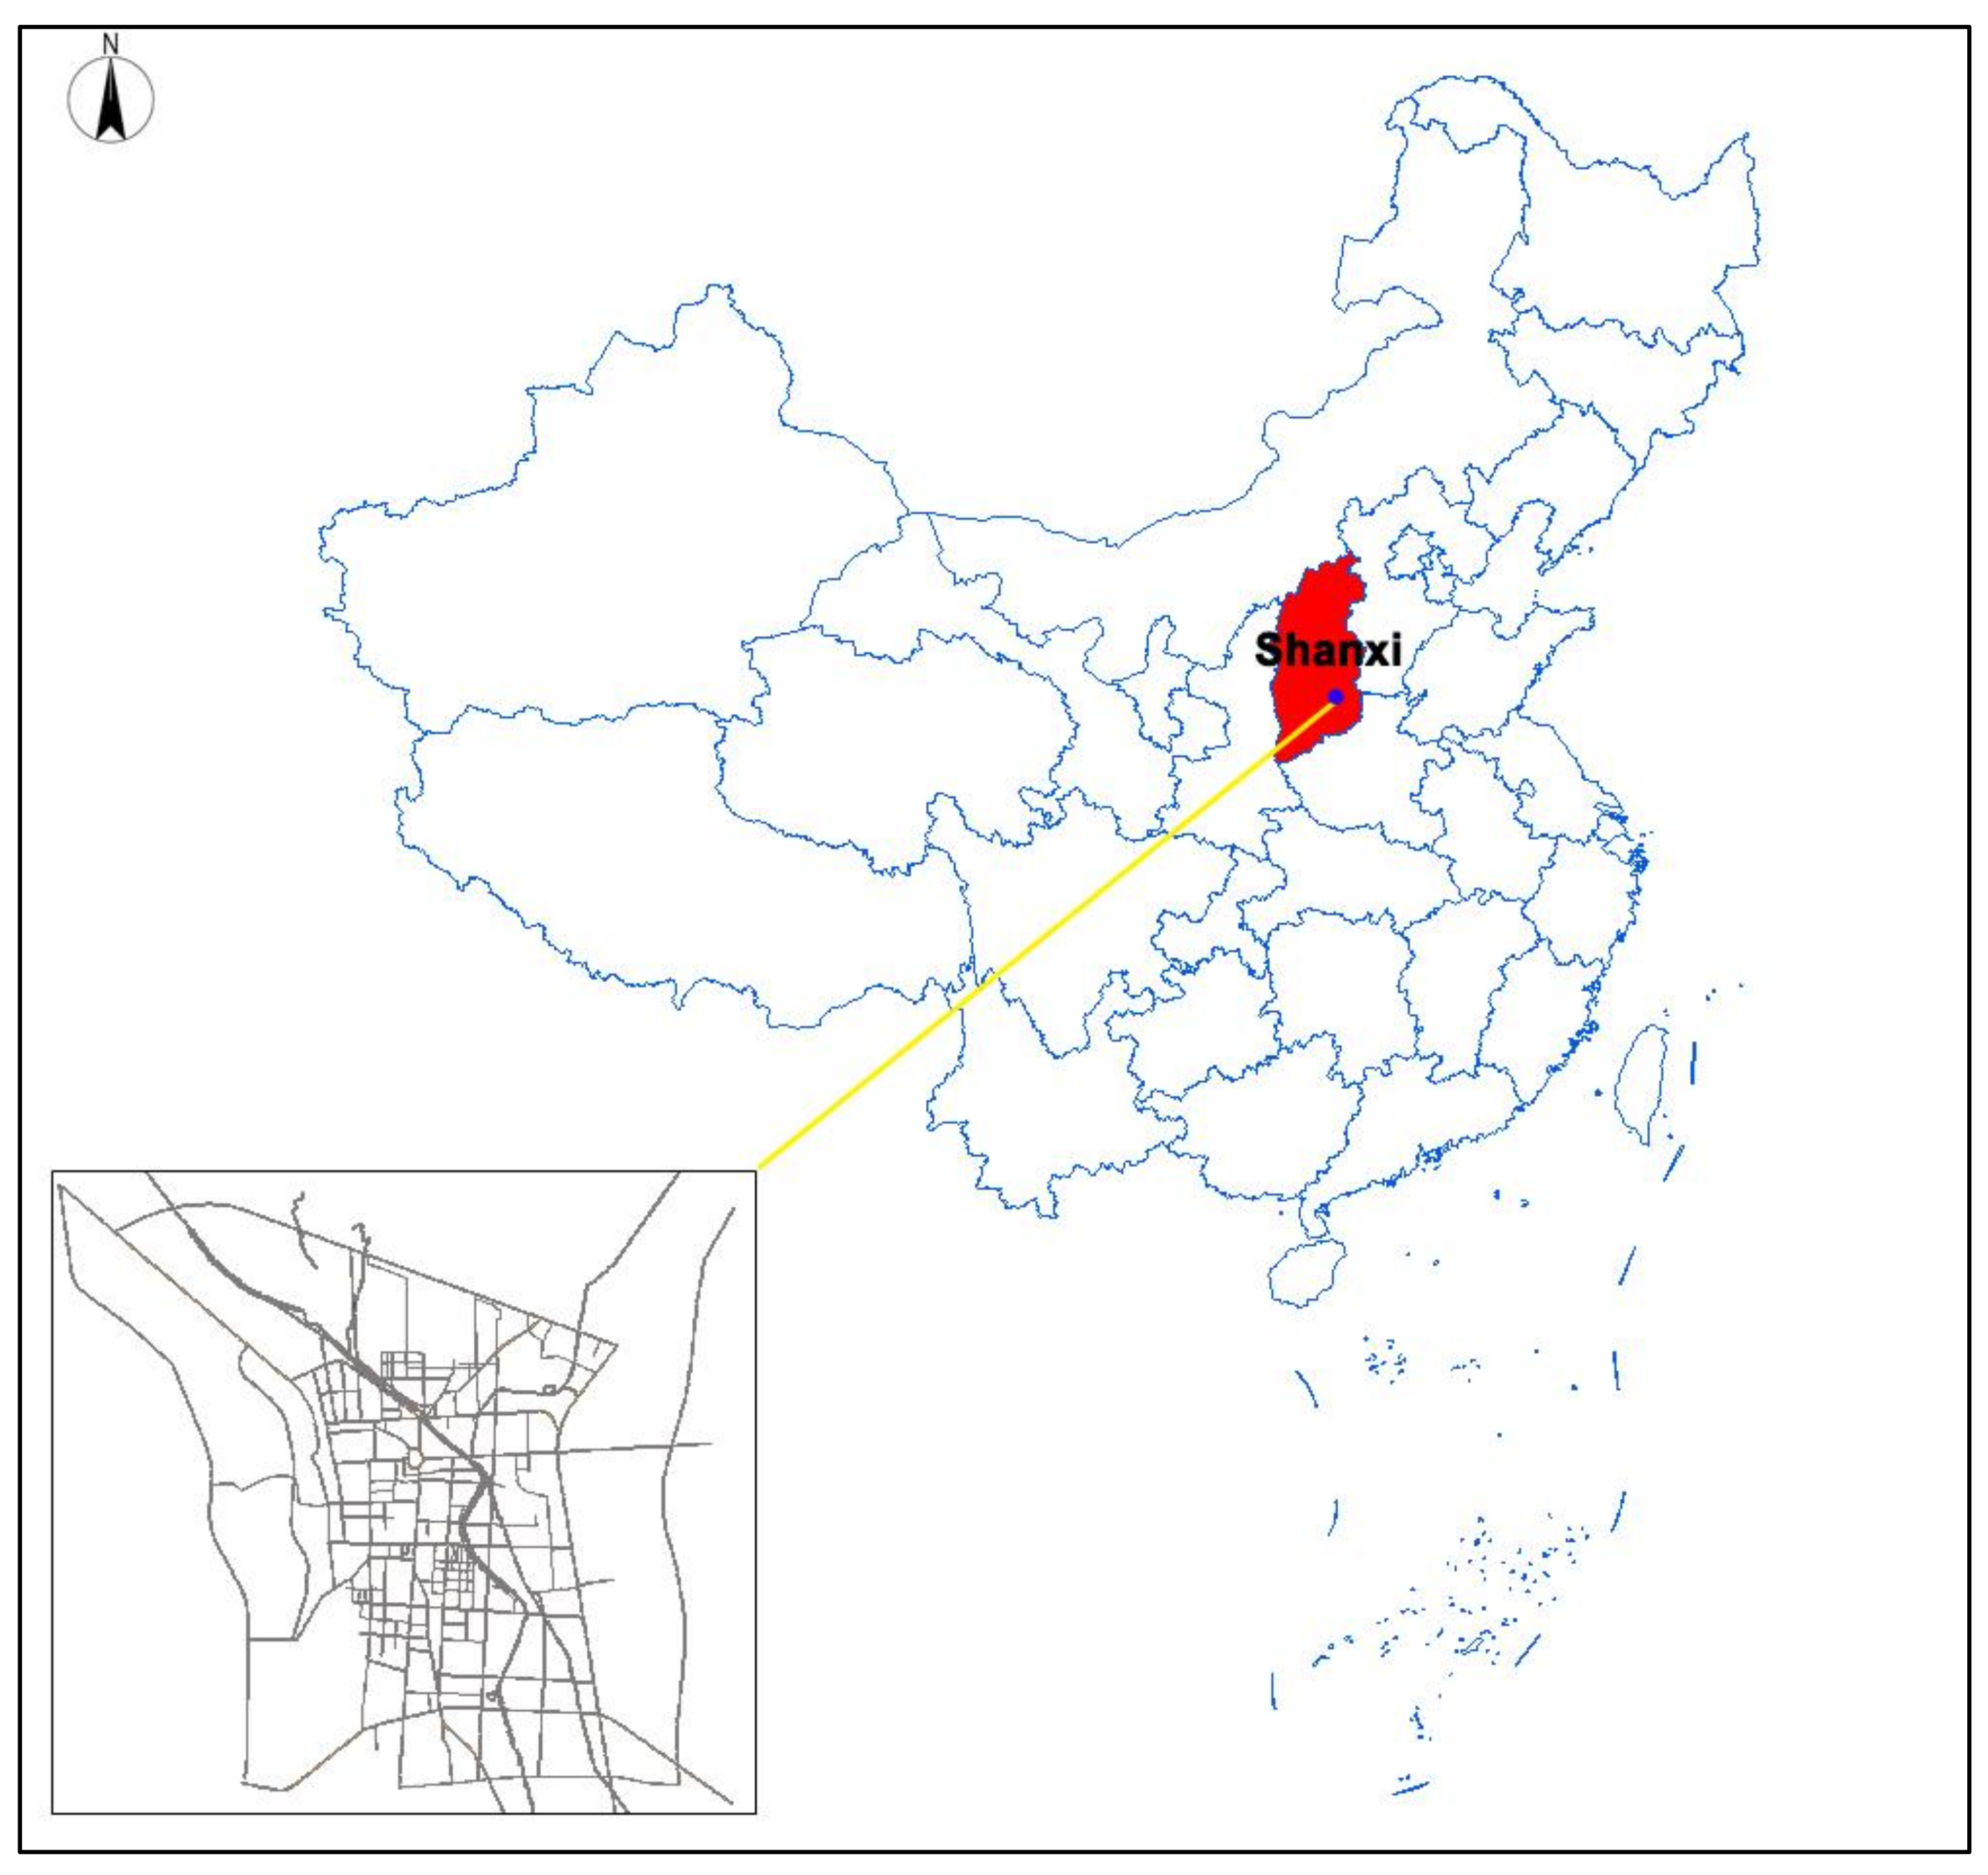
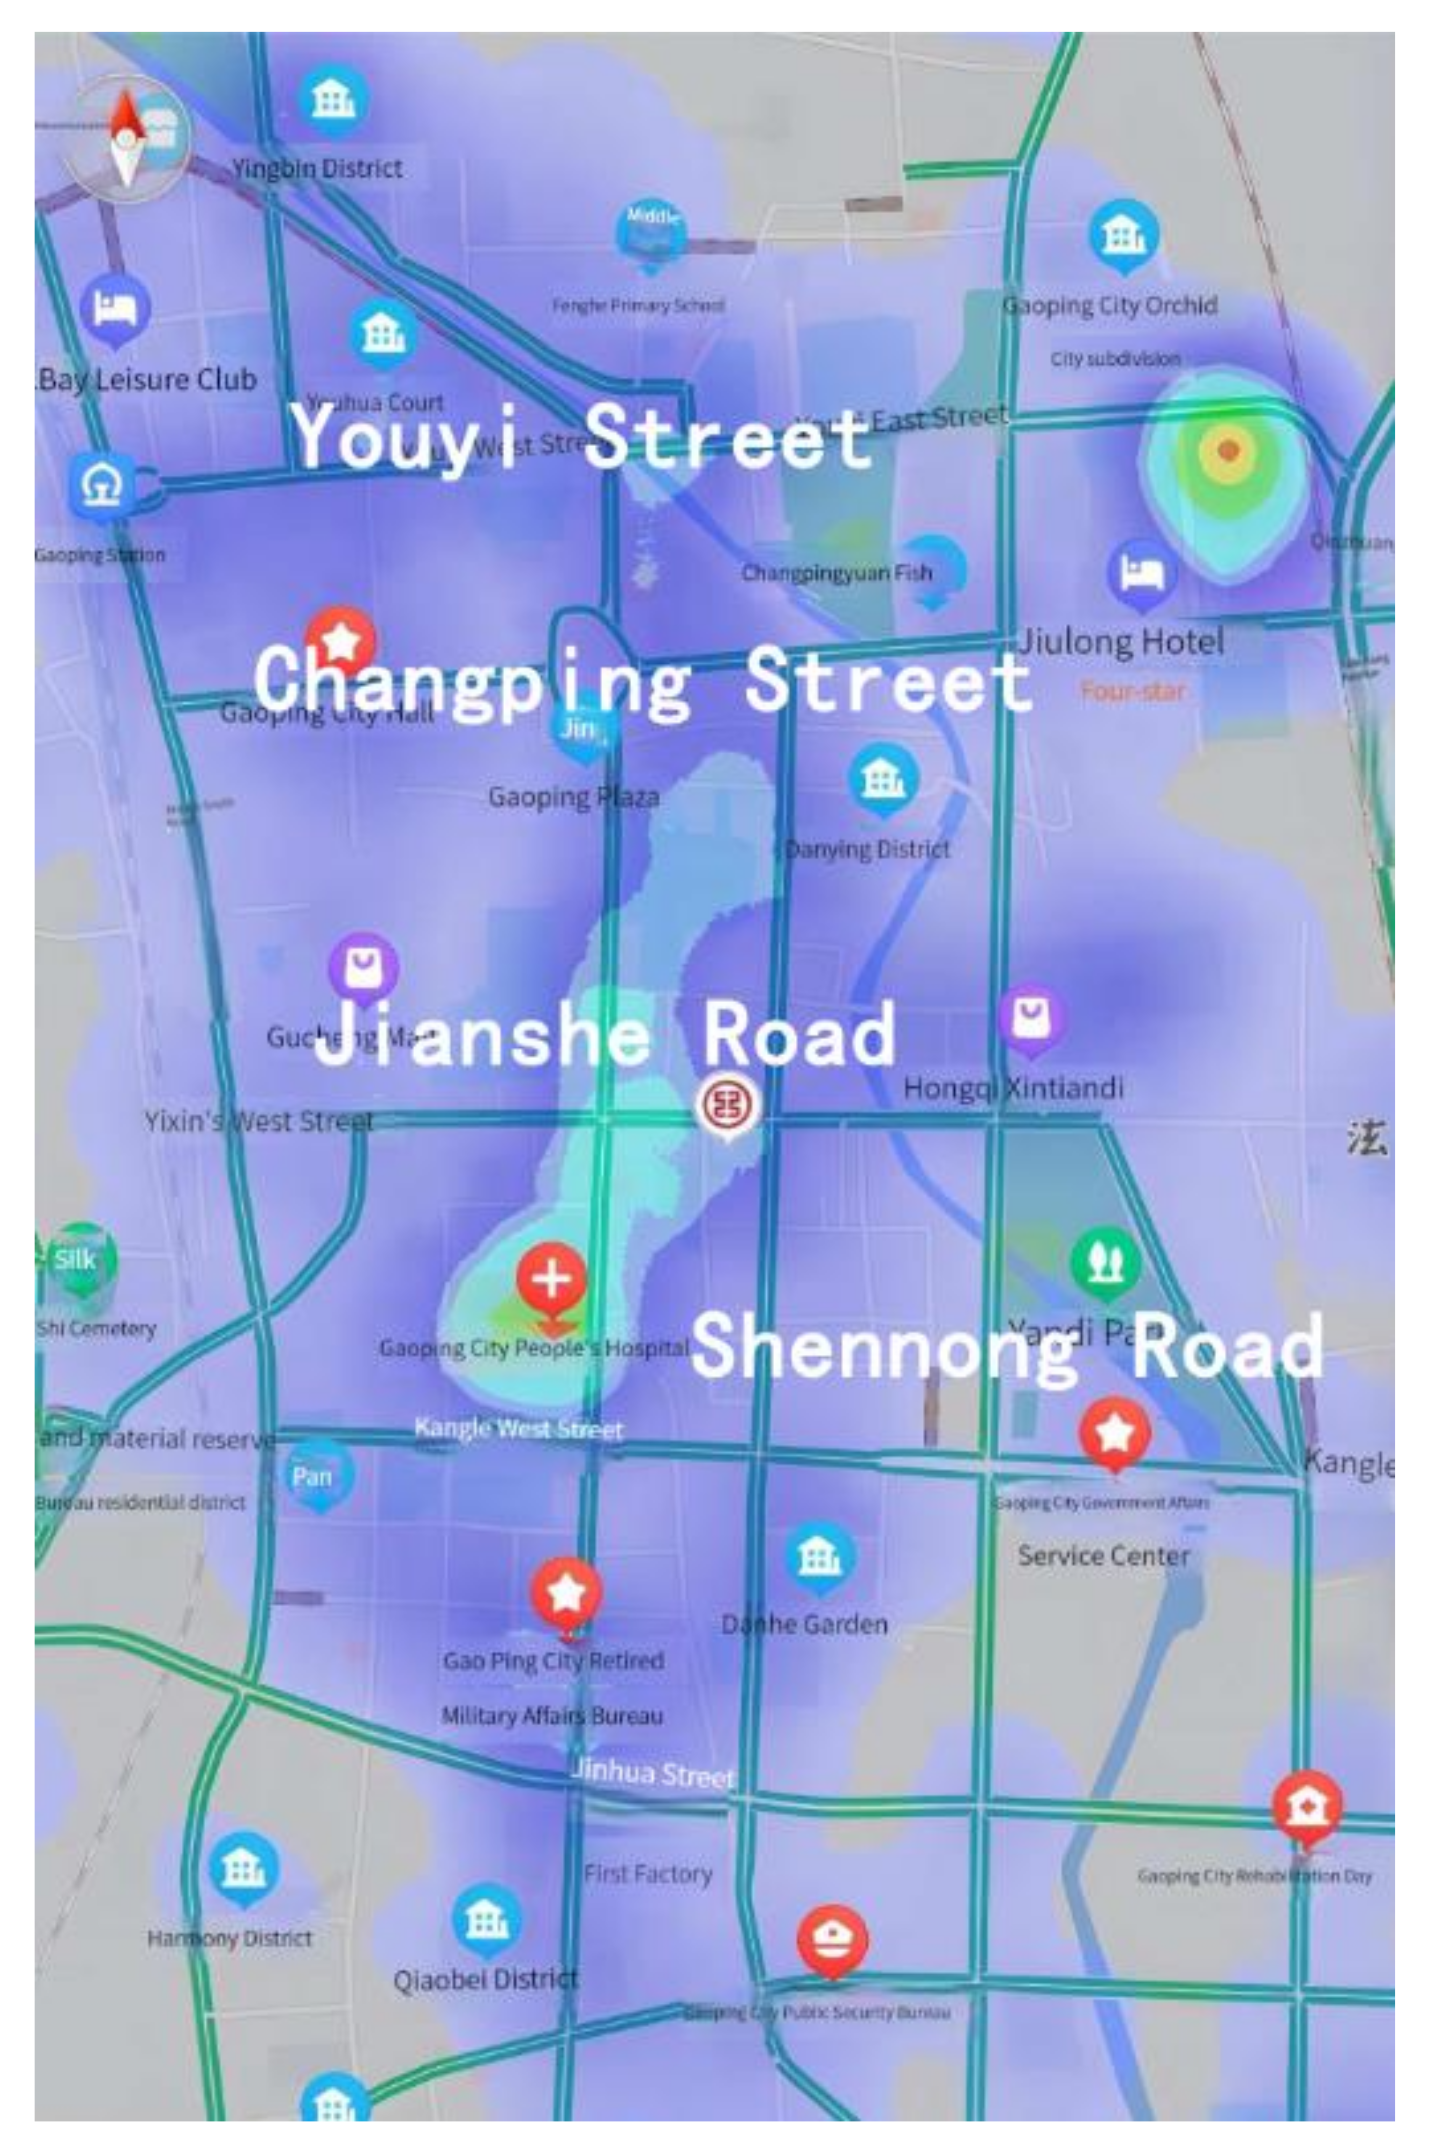
5.1. Study Area
5.2. Data and Processing
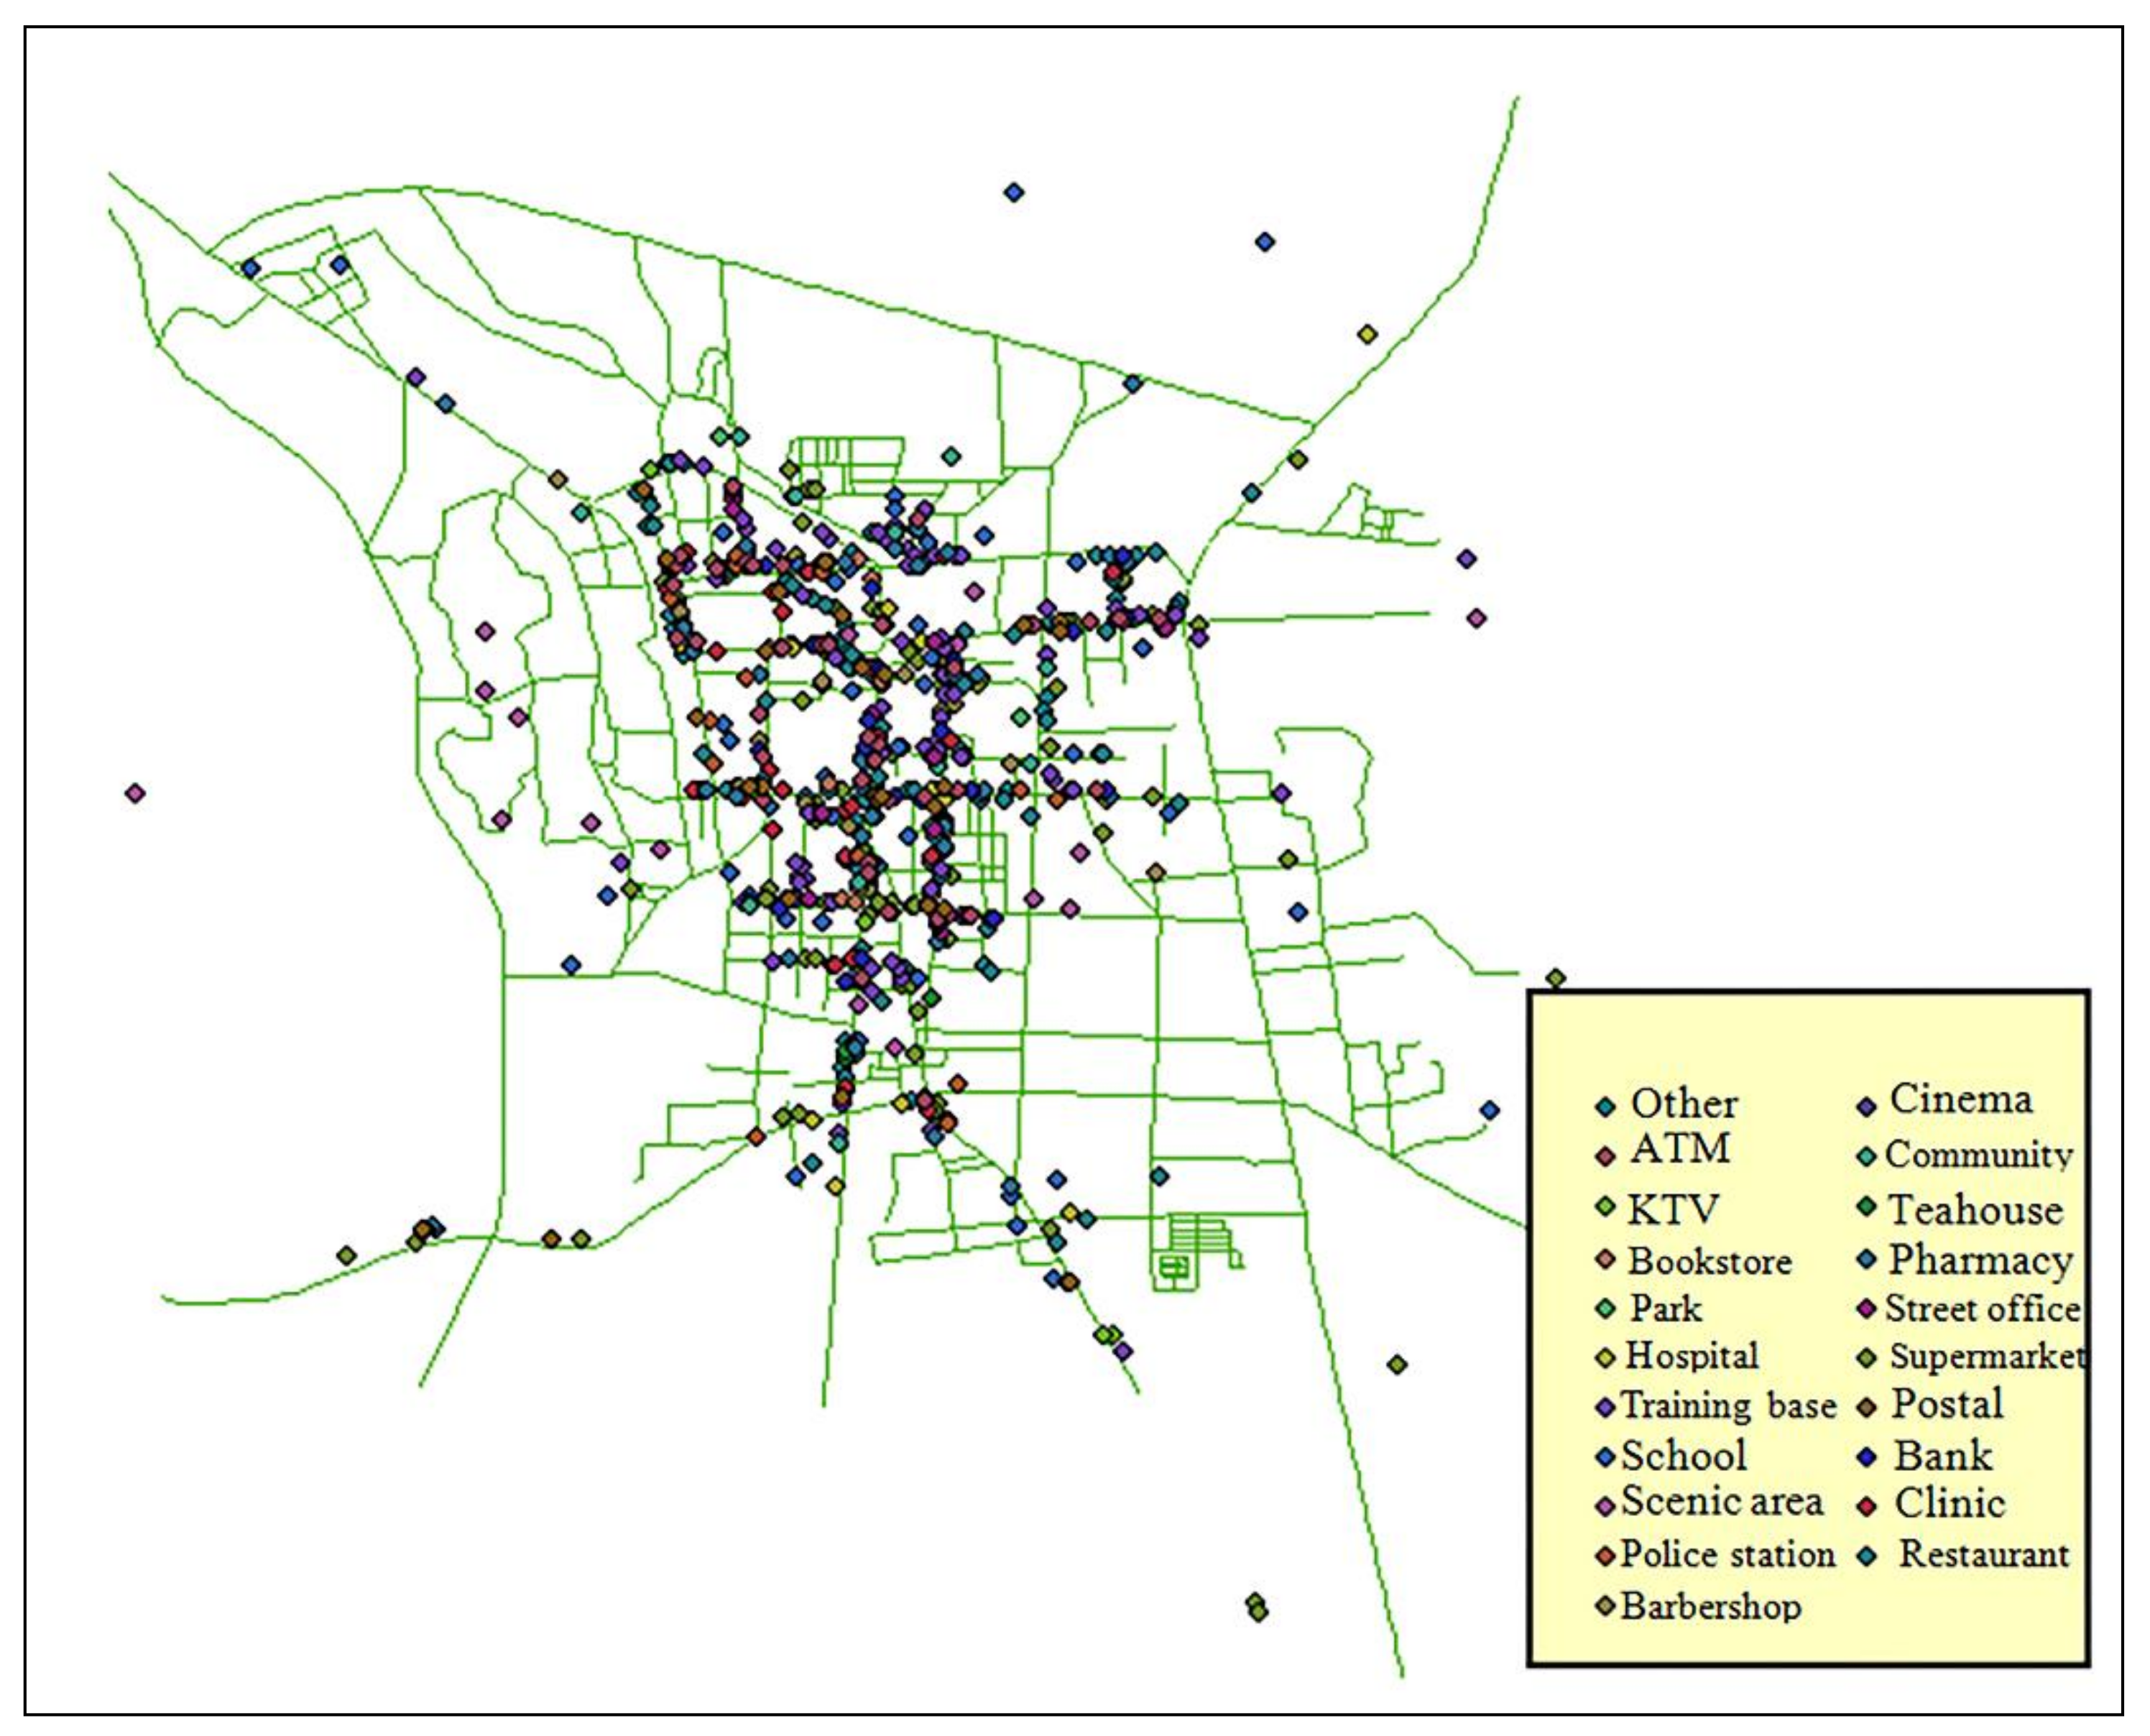
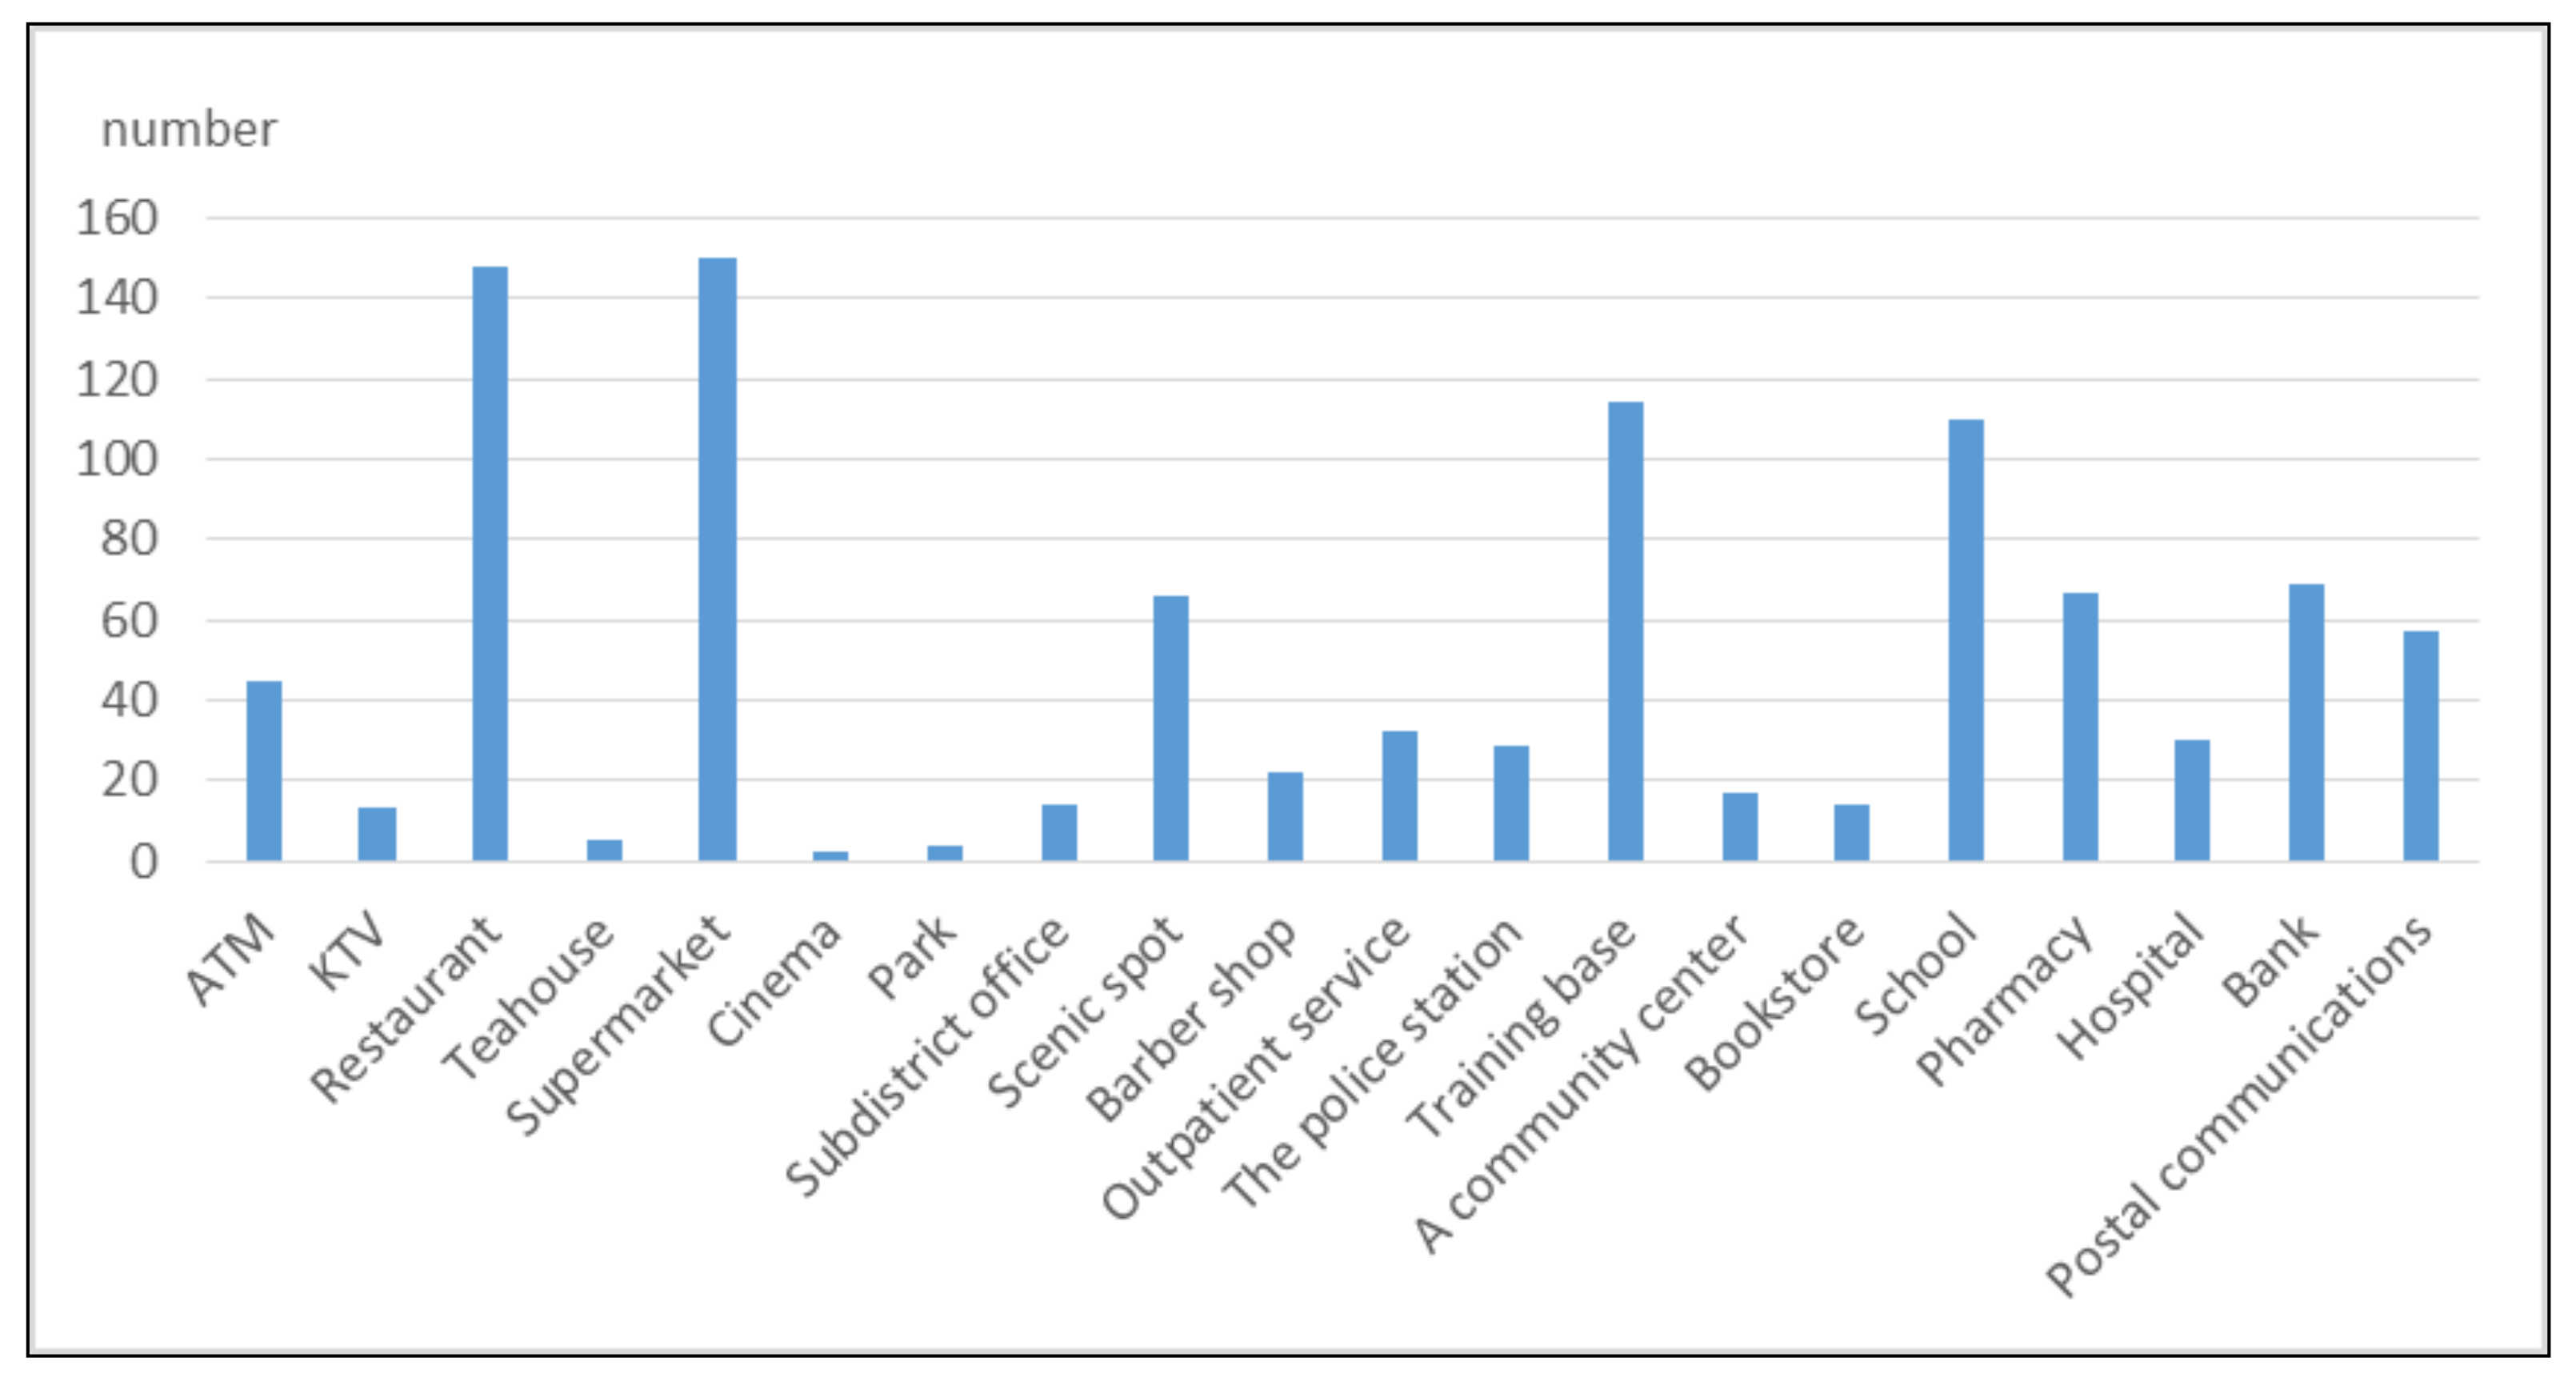
5.2.1. Street Functional Elements
5.2.2. Visual Construction Elements
5.2.3. Walking Scale Elements
6. Results and Discussion
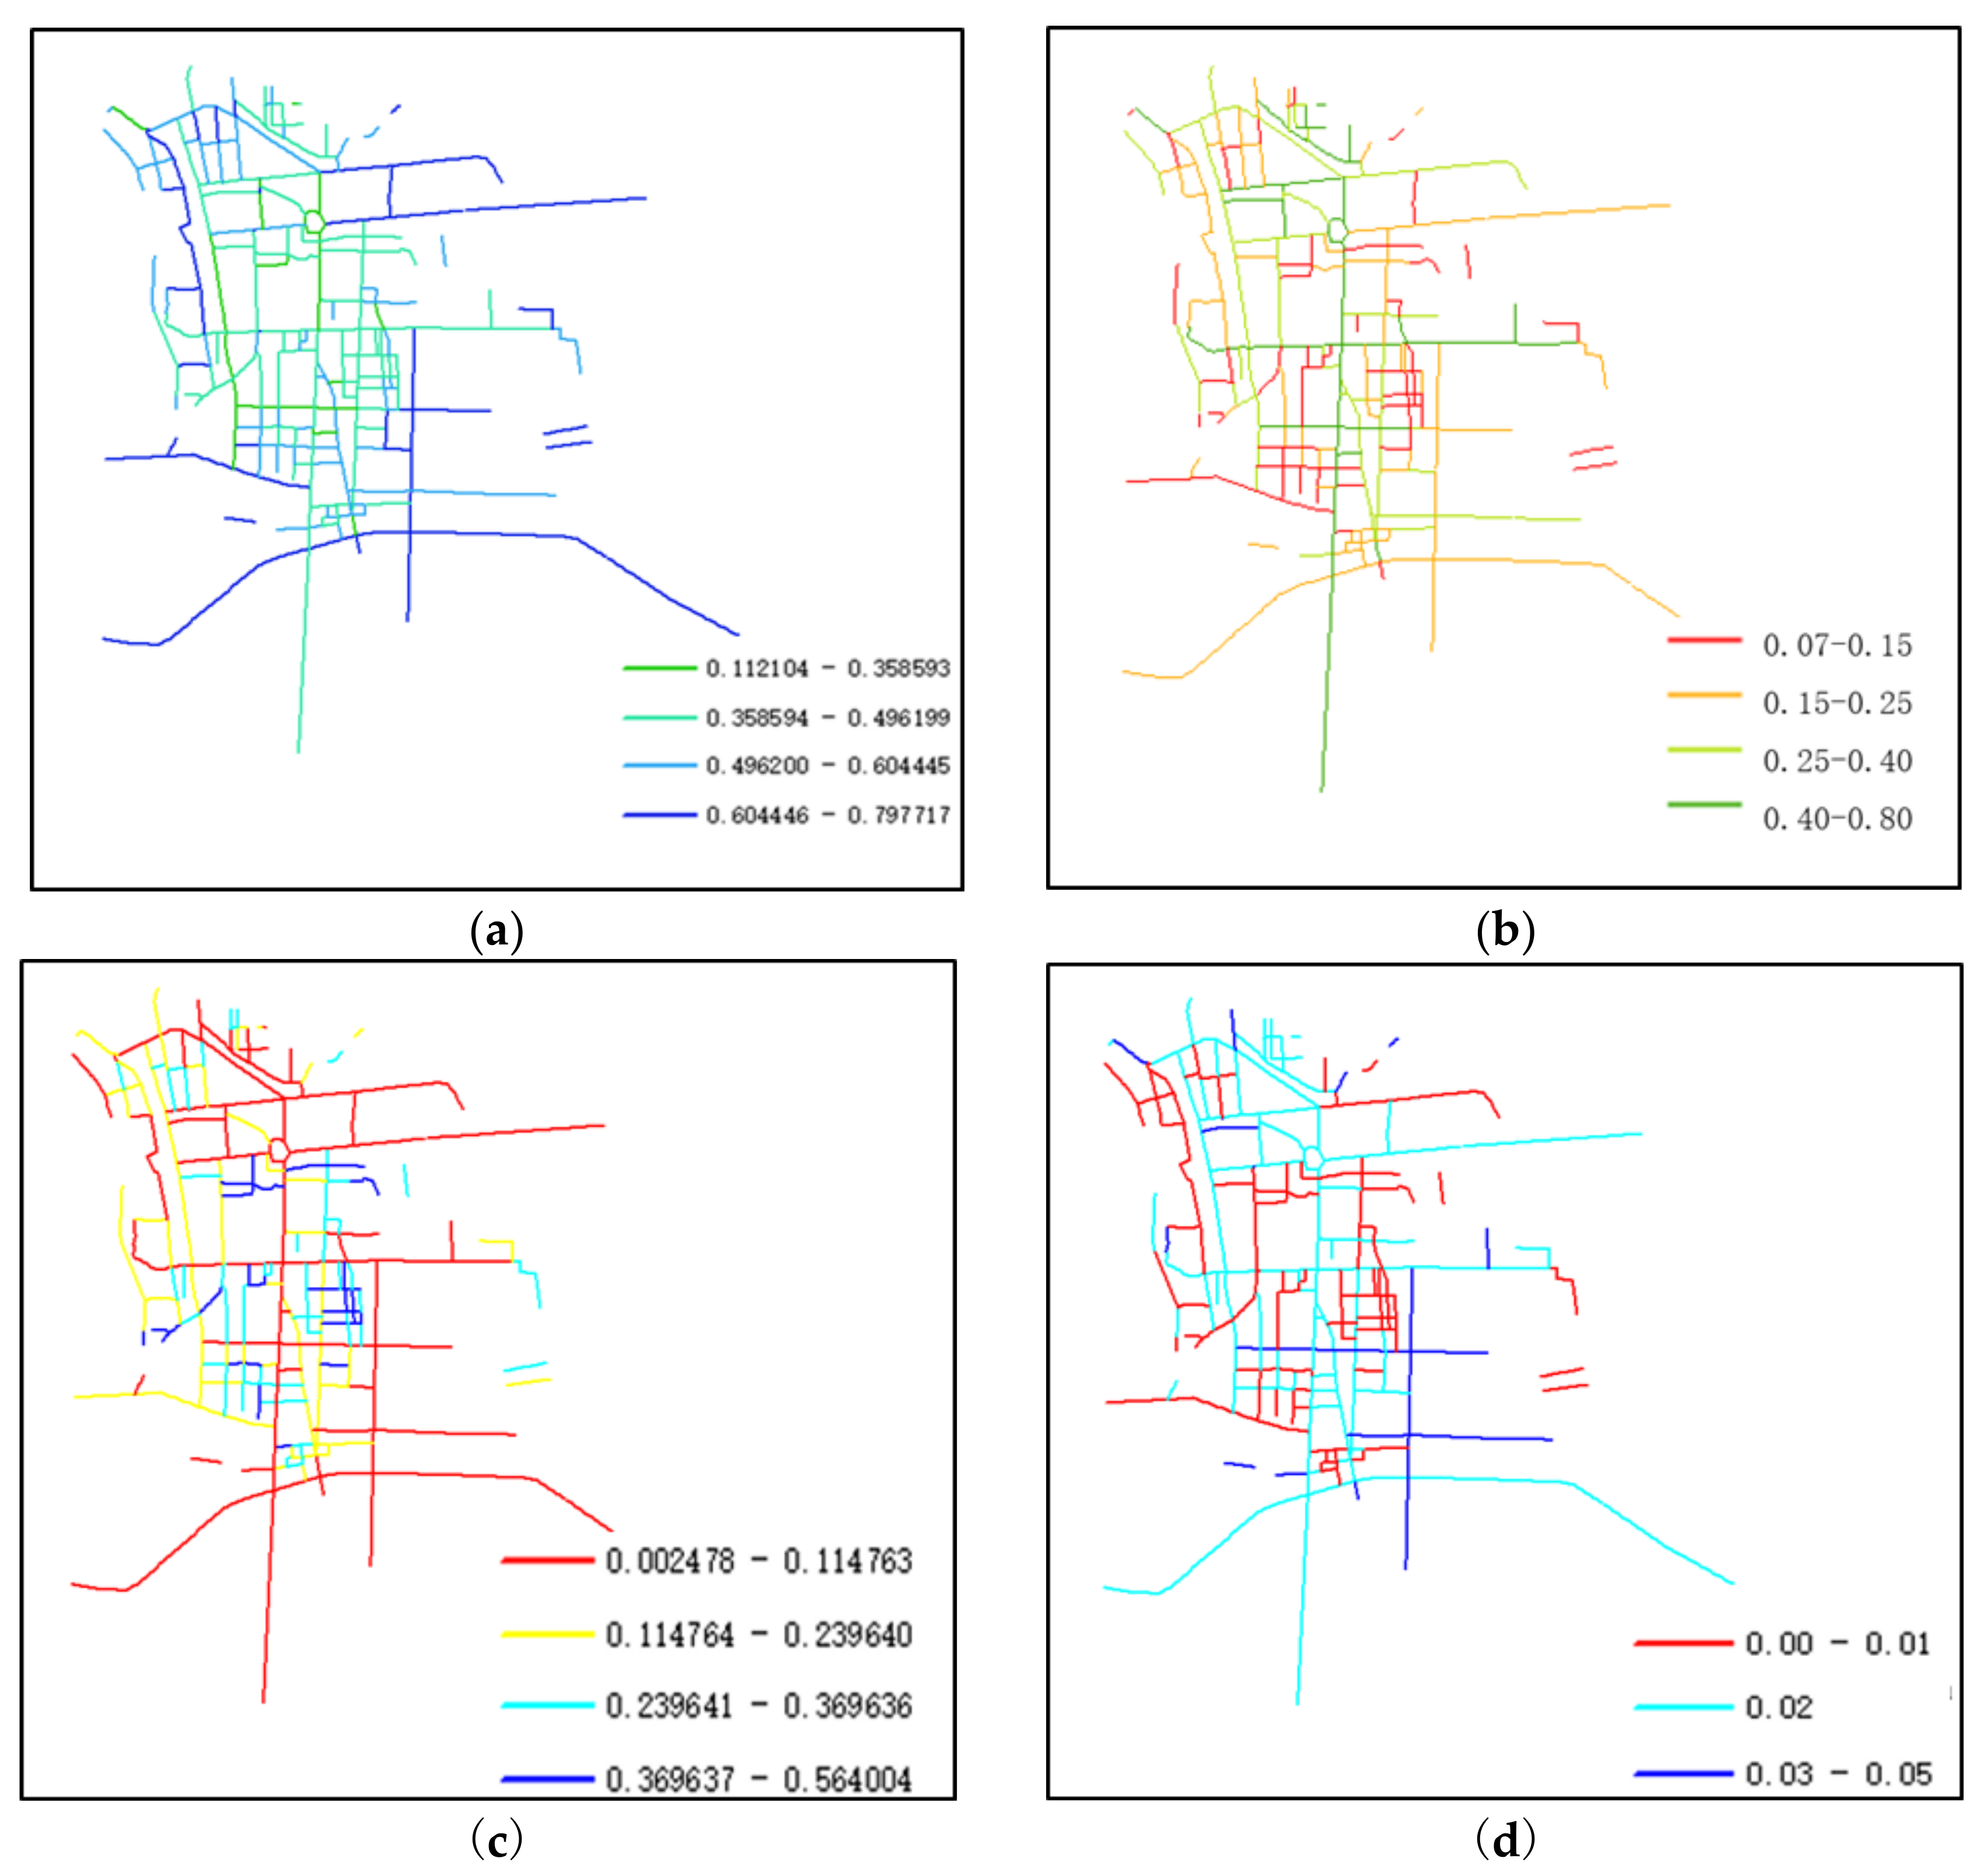
6.1. Function-Oriented Pedestrian Path Design
6.2. Visually Oriented Pedestrian Path Design
6.3. Scale Deviation Pedestrian Path Design
7. Conclusions
Author Contributions
Funding
Institutional Review Board Statement
Informed Consent Statement
Data Availability Statement
Acknowledgments
Conflicts of Interest
References
- Small and Medium-Sized City Development Strategy Research. Institute Small and Medium-Sized City Index Research Institute. 2019. Available online: http://www.csmcity.com/luntan/bbs2019/2019-bg.html (accessed on 15 March 2022).
- Freudendal-Pedersen, M. Sustainable urban futures from transportation and planning to networked urban mobilities. Transp. Res. D Transp. Environ. 2020, 82, 102310. [Google Scholar] [CrossRef]
- Sarkar, C.; Webster, C.; Pryor, M.; Tang, D.; Melbourne, S.; Zhang, X.H.; Liu, J.Z. Exploring associations between urban green, street design and walking: Results from the Greater London boroughs. Landsc. Urban Plan. 2015, 143, 112–125. [Google Scholar] [CrossRef]
- Lee, S.; Han, M.; Rhee, K.; Bae, B. Identification of factors affecting pedestrian satisfaction toward land use and street type. Sustainability 2021, 19, 10725. [Google Scholar] [CrossRef]
- Thomson, G.; Newman, P. Urban fabrics and urban metabolism—From sustainable to regenerative cities. Resour. Conserv. Recycl. 2018, 132, 218–229. [Google Scholar] [CrossRef]
- Niu, S.; Tong, H. Analysis of the pedestrian system indicators of city blocks based on the real walking network: A case study of Jinan, China. J. Urban Plan. Dev. 2021, 147, 05021015. [Google Scholar] [CrossRef]
- Lan, J.; Wei, L.; Sun, P. Preference for street environment based on route choice behavior while walking. Front. Public Health 2022, 10, 880251. [Google Scholar] [CrossRef]
- Rankavat, S.; Tiwari, G. Pedestrians perceptions for utilization of pedestrian facilities—Delhi, India. Transp. Res. F Traffic Psychol. Behav. 2016, 42, 495–499. [Google Scholar] [CrossRef]
- Xia, Z.; Li, H.; Chen, Y. Assessing neighborhood walkability based on usage characteristics of amenities under Chinese metropolises context. Sustainability 2018, 10, 3879. [Google Scholar] [CrossRef] [Green Version]
- Wei, Y.D.; Xiao, W.; Wen, M.; Wei, R. Walkability, Land use and physical activity. Sustainability 2016, 8, 65. [Google Scholar] [CrossRef] [Green Version]
- Park, S.; Choi, K.; Lee, J.S. To walk or notto walk: Testing the effect of path walkability on transit users’ access mode choices to the station. Int. J. Sustain. Transp. 2015, 9, 529–541. [Google Scholar] [CrossRef]
- Blecic, I.; Canu, D.; Cecchini, A.; Congiu, T.; Fancello, G. Walkability and street intersections in rural-urban fringes: A decision aiding evaluation procedure. Sustainability 2017, 9, 883. [Google Scholar] [CrossRef] [Green Version]
- Zunigateran, A.A.; Barron, J.O.; Randy, H.G.; Nader, V.C.; Stuart, E.M.; David, P.G.; Scott, B.G. Designing healthy communities: Testing the walkability model. Front. Archit. Res. 2017, 6, 63–73. [Google Scholar] [CrossRef] [Green Version]
- Southworth, M. Designing the walkable city. J. Urban Plan. Dev. 2005, 131, 246–257. [Google Scholar] [CrossRef]
- Leslie, E.; Coffee, N.; Frank, L.; Owen, N.; Bauman, A.; Hugo, G. Walkability of local communities: Using geographic information systems to objectively assess relevant environmental attributes. Health Place 2007, 13, 111–122. [Google Scholar] [CrossRef]
- Moura, F.; Cambra, P.; Gongcalves, A.B. Measuring walkability for distinct pedestrian groups with a participatory assessment method: A case study in Lisbon. Landsc. Urban Plan. 2017, 157, 282–296. [Google Scholar] [CrossRef]
- Westerdijk, P.K. Pedestrian and Pedal Cyclist Route Choice Criteria; Institute of Transport Studies, University of Leeds: Leeds, UK, 1990. [Google Scholar]
- Jaskiewicz, F. Pedestrian Level of Service Based on Trip Quality; Transportation Research Board: Washington, DC, USA, 2000. [Google Scholar]
- Park, S.; Choi, K.; Lee, J.S. Operationalization of path walkability for sustainable transportation. Int. J. Sustain. Transp. 2017, 11, 471–485. [Google Scholar] [CrossRef]
- Blecic, I.; Cecchini, A.; Congiu, T.; Fancello, G.; Trunfio, G.A. Evaluating walkability: A capability-wise planning and design support system. Int. J. Geogr. Inf. Sci. 2015, 29, 1350–1374. [Google Scholar] [CrossRef]
- Fan, P.; Wan, G.; Xu, L.; Park, H.; Xie, Y.; Liu, Y.; Yue, W.; Chen, J. Walkability in urban landscapes: A comparative study of four large cities in China. Landsc. Ecol. 2018, 33, 323–340. [Google Scholar] [CrossRef]
- Shashank, A.; Schuurman, N. Unpacking walkability indices and their inherent assumptions. Health Place 2019, 55, 145–154. [Google Scholar] [CrossRef]
- Hirsch, J.A.; Moore, K.A.; Evenson, K.R.; Rodriguez, D.A.; Roux, V.D. Walk score (R) and Transit score (R) and walking in the multi-ethnic study of Atherosclerosis. Am. J. Prev. Med. 2013, 45, 158–166. [Google Scholar] [CrossRef]
- Koohsari, M.J.; Sugiyamac, T.; Hanibuchi, T.; Shibata, A.; Ishii, K.; Liao, Y.; Oka, K. Validity of walk score as a measure of neighborhood walkability in Japan. Prev. Med. Rep. 2018, 9, 114–117. [Google Scholar] [CrossRef] [PubMed]
- Tuckel, P.; Milczarski, W. Walk score (TM), Perceived neighborhood walkability, and walking in the US. Am. J. Health Behav. 2015, 39, 241–255. [Google Scholar] [CrossRef] [PubMed]
- Yusuf, A. Measuring and evaluating urban walkability through walkability indexes: A case of Murree. Eur. Transp. Trasp. Eur. 2015, 2, 1825–3997. [Google Scholar]
- Ball, K.; Timperio, A.; Salmon, J.; Corti, B.G.; Roberts, R.; Crawfords, D. Personal, social and environmental determinants of educational inequalities in walking: A multilevel study. J. Epidemiol. Community Health 2007, 61, 108–114. [Google Scholar] [CrossRef] [PubMed] [Green Version]
- Owen, N.; Cerin, E.; Leslie, E.; Dutoit, L.; Coffee, N.; Frank, L.D.; Bauman, A.E.; Hugo, G.; Saelens, B.E.; Sallis, J.F. Neighborhood walkability and the walking behavior of Australian adults. Am. J. Prev. Med. 2007, 33, 387–395. [Google Scholar] [CrossRef]
- Manaugh, K.; El-Geneidy, A. Validating walkability index: How do different households respond to the walkability of their neighborhood? Transp. Res. D Transp. Environ. 2011, 16, 309–315. [Google Scholar] [CrossRef]
- Duncan, D.T.; Aldstadt, J.; Whalen, J.; Melly, S.J.; Gortmaker, S.L. Validation of walk score (r) for estimating neighborhood walkability: An analysis of four us metropolitan areas. Int. J. Environ. Res. Public Health 2011, 8, 4160–4179. [Google Scholar] [CrossRef]
- Carr, L.J.; Dunsiger, S.I.; Marcus, B.H. Walk score (tm) as a global estimate of neighborhood walkability. Am. J. Prev. Med. 2010, 39, 460–463. [Google Scholar] [CrossRef] [Green Version]
- Rgallagher, M.; Ziyu, W. To pursue delicate street design-discussion on streetscape guidance: A guide to better london streets. China Acad. J. Electron. Publ. House 2015, 13, 56–64. [Google Scholar] [CrossRef]
- San Francisco Better Streets Planning. Available online: https://www.sfbetterstreets.org/why-better-streets/san-franciscos-guiding-policies/ (accessed on 8 August 2022).
- Street Design Manual. Available online: http://www.nyc.gov/html/dot/downloads/pdf/sdm_lores.pdf (accessed on 8 August 2022).
- Lin, W.; Chen, Q.B.; Jiang, M.Y.; Tao, J.Y.; Liu, Z.F.; Zhang, X.X.; Wu, L.J.; Xu, S.; Kang, Y.S.; Zeng, Q.Y. Sitting or walking? Analyzing the neural emotional indicators of urban green space behavior with mobile EEG. J. Urban Health-Bull. N. Y. Acad. Med. 2020, 97, 191–203. [Google Scholar] [CrossRef]
- Yang, C.H.; Conroy, D.E. Feasibility of an outdoor mindful walking program for reducing negative affect in older adults. J. Aging Phys. Act. 2019, 27, 18–27. [Google Scholar] [CrossRef]
- Zhu, Z.; Chen, H.; Ma, J.; He, Y.; Chen, J.; Sun, J. Exploring the relationship between walking and emotional health in China. Int. J. Environ. Res. Public Health 2020, 17, 8804. [Google Scholar] [CrossRef]
- Koohsari, M.J.; McCormack, G.R.; Nakaya, T.; Shibata, A.; Ishii, K.; Yasunaga, A.; Liao, Y.; Oka, K. Walking-friendly built environments and objectively measured physical function in older adults. J. Sport Health Sci. 2020, 9, 651–656. [Google Scholar] [CrossRef]
- Blecic, I.; Congiu, T.; Fancello, G.; Trunfio, G.A. Planning and design support tools for walkability: A guide for urban analysts. Sustainability 2020, 12, 4405. [Google Scholar] [CrossRef]
- Tsiompras, A.B.; Photis, Y.N. What matters when it comes to “Walk and the city”? Defining a weighted GIS-based walkability index. Transp. Res. Procedia 2017, 24, 523–530. [Google Scholar] [CrossRef]
- Ozbil, A.; Gurleyen, T.; Yesiltepe, D.; Zunbuloglu, E. Comparative associations of street network design, Streetscape attributes and land-use characteristics on pedestrian flows in peripheral neighbourhoods. Int. J. Environ. Res. Public Health 2019, 16, 1846. [Google Scholar] [CrossRef] [Green Version]
- Sun, G.; Wallace, D.; Webster, C. Unravelling the impact of street network structure and gated community layout in development-oriented transit design. Land Use Policy 2020, 90, 104328. [Google Scholar] [CrossRef]
- Doescher, M.P.; Lee, C.; Berke, E.M.; Adachi, M.; Anna, M.; Lee, C.K.; Stewart, O.; Patterson, D.G.; Hurvitz, P.M.; Carlos, H.A.; et al. The built environment and utilitarian walking in small US towns. Prev. Med. 2014, 69, 80–86. [Google Scholar] [CrossRef] [Green Version]
- Ferrer, S.; Ruiz, T. Comparison of the factors of the built environment influencing the decision to walk for short trips in two Spanish cities: Valencia and Granada. In Proceedings of the CIT2016: 12. Congress of Transport Engineering, Valencia, Spain, 7–9 June 2016; pp. 143–163. [Google Scholar] [CrossRef] [Green Version]
- Haybatollahi, M.; Czepkiewicz, M.; Laatikainen, T.; Kyttä, M. Neighbourhood preferences, active travel behaviour, and built environment: An exploratory study. Transp. Res. F Traffic Psychol. Behav. 2015, 29, 57–69. [Google Scholar] [CrossRef]
- Kim, H.J.; Heinrich, K.M. Built environment factors influencing walking to school behaviors: A comparison between a small and large us city. Front. Public Health 2016, 4, 77. [Google Scholar] [CrossRef]
- Pinna, F.; Murrau, R. Age factor and pedestrian speed on sidewalks. Sustainability 2018, 10, 4084. [Google Scholar] [CrossRef] [Green Version]
- Zhang, F.; Zhang, D.; Liu, Y.; Lin, H. Representing place locales using scene elements. Comput. Environ. Urban Syst. 2018, 71, 153–164. [Google Scholar] [CrossRef]
- Liangchieh, C.; Papandreou, G.; Kokkinos, I.; Murphy, K.; Yuille, A.L. Deeplab: Semantic image segmentation with deep convolutional nets, atrous convolution, and fully connected CRFs. IEEE Trans. Pattern Anal. Mach. Intell. 2014, 40, 357–361. [Google Scholar] [CrossRef] [Green Version]
- Koohsari, M.J.; Owen, N.; Cerin, E.; Billie, G.C.; Takemi, S. Walkability and walking for transport: Characterizing the built environment using space syntax. Int. J. Behav. Nutr. Phys. Act. 2016, 13, 121. [Google Scholar] [CrossRef] [PubMed] [Green Version]
- Hillier, B.; Leaman, A.; Stansall, P. Space syntax. Environ. Plan. B 1976, 3, 147–185. [Google Scholar] [CrossRef]
- Penn, A. Space syntax and spatial cognition: Or why the axial line? In Proceedings of the 3rd International Space Syntax Symposium, Atlanta, GA, USA, 7–11 May 2001; pp. 11.1–11.17. [Google Scholar]
- Zhang, Y.X.; Zhang, J.Z.; Xu, K.; Tang, D.M.; Li, Y.; Wang, X.C.; Zhang, K. An improved method for urban walk score calculation considering perception of the street environment. Trans. GIS 2022, 3, 1399–1420. [Google Scholar] [CrossRef]
- Yintao, L. Walkability evaluation based on people’s use of facilities by walking. Urban Plan. 2013, 5, 113–118. [Google Scholar]
- Walkability Evaluation of Chinese Cities. Natural Resource Defense Council. 2019. Available online: http://www.nrdc.cn/Public/uploads/2019-10-23/5db00acc2661c.pdf (accessed on 12 August 2022).
- Yencha, C. Valuing walkability: New evidence from computer vision methods. Transp. Res. A Policy Pract. 2019, 130, 689–709. [Google Scholar] [CrossRef]
- Liu, Y.N.; Yang, D.J.; Timmermans, J.P.; de Vries, B. Analysis of the impact of street-scale built environment design near metro stations on pedestrian and cyclist road segment choice: A stated choice experiment. J. Transp. Geogr. 2020, 82, 102570. [Google Scholar] [CrossRef]
- Yao, G.; Yuan, T.T.; Rui, Y.; Chen, W.J.; Duan, Z.C.; Sun, L.; Si, X.Z.; Zhang, M.; Chen, K.Y.; Zhu, Y.S.; et al. Research on the scale of pedestrian space in underground shopping streets based on VR experiment. J. Asian Archit. Build. Eng. 2021, 20, 138–153. [Google Scholar] [CrossRef]
- Tang, J.; Long, Y. Measuring visual quality of street space and its temporal variation: Methodology and its application in the Hutong area in Beijing. Landsc. Urban Plan. 2018, 191, 103436. [Google Scholar] [CrossRef]
- Li, S.J.; Ma, S.; Tong, D.; Jia, Z.M.; Li, P.; Long, Y. Associations between the quality of street space and the attributes of the built environment using large volumes of street view pictures. Environ. Plan. B Urban Anal. City Sci. 2021, 4, 1197–1211. [Google Scholar] [CrossRef]
- Ruiz-Padillo, A.; Oestreich, L.; Torres, T.B.; Rhoden, P.S.; Larranaga, A.M.; Cybis, H.B. Weighted assessment of barriers to walking in small cities: A Brazilian case. Transp. Res. D Transp. Environ. 2022, 109, 103392. [Google Scholar] [CrossRef]
- Yu, Y.C.; Zhao, X.; Zhou, Z.; Zhang, S.; Zhai, D.; Li, J. The associations of built environment with older people recreational walking and physical activity in a Chinese small-scale city of Yiwu. Int. J. Environ. Res. Public Health 2021, 18, 2699. [Google Scholar] [CrossRef]
- Yu, J.; Yang, C.; Zhang, S.; Zhai, D.; Wang, A.; Li, J. The effect of the built environment on older men2019s and women2019s leisure-time physical activity in the mid-scale city of Jinhua, China. Int. J. Environ. Res. Public Health 2021, 18, 1039. [Google Scholar] [CrossRef]
- Ye, Y.; Zeng, W.; Shen, Q.; Zhang, X.; Lu, Y. The visual quality of streets: A human-centred continuous measurement based on machine learning algorithms and street view images. Environ. Plan. B Urban Anal. City Sci. 2019, 46, 1439–1457. [Google Scholar] [CrossRef]
- Arellana, J.; Saltarín, M.; Larrañaga, A.M.; Alvarez, V.; Henao, C.A. Urban walkability considering pedestrians’ perceptions of the built environment: A 10-year review and a case study in a medium-sized city in Latin America. Transp. Rev. 2020, 40, 183–203. [Google Scholar] [CrossRef]


| Age Group | Average Walking Speed (m/s) |
|---|---|
| 13–19 | 2.7 |
| 20–49 | 1.8 |
| 50–74 | 1.5 |
| >75 | 1.1 |
| Standard | |
|---|---|
| 0–24 | Very low walkability: unfriendly |
| 25–49 | Low walkability: few supporting facilities for walking |
| 50–69 | Medium walkability: some walkability facilities are within the walkability range |
| 70–89 | High walkability: meets basic daily walking needs |
| 90–100 | Very high walkability: supportive of daily walking trips |
| Type of Functional Elements | Service Content | Element Types |
|---|---|---|
| Homogeneous functional elements | No significant difference in service quality | Financial posts and telecommunications, administrative management, leisure, medical and health (pharmacy, clinic) |
| Heterogenous functional elements | The quality of service is determined by the elements’ properties | Business services, entertainment, health care (hospitals), education |
| Classification | Weight | Total Weight | |
|---|---|---|---|
| Commercial Service | Supermarket | 2 | 6 |
| Restaurant | 3 | ||
| Barber Shop | 1 | ||
| Entertainment | KTV | 1 | 4 |
| Teahouse | 2 | ||
| Cinema | 1 | ||
| Leisure | Park | 1 | 2 |
| Scenic | 1 | ||
| Education | School | 1 | 2 |
| Training Base | 0.5 | ||
| Bookstore | 0.5 | ||
| Health Care | Hospital | 3 | 6 |
| Clinic | 2 | ||
| Pharmacy | 1 | ||
| Administration | Police Station | 0.5 | 2.5 |
| Subdistrict Office | 1 | ||
| Community Center | 1 | ||
| Finance and Telecommunications | Bank | 1 | 2.5 |
| ATM | 0.5 | ||
| Postal Communication | 1 | ||
| Total | 25 | 25 | |
| Index | Value Range | ||
|---|---|---|---|
| Overall integration | <0.8 | 0.8–1.5 | >1.5 |
| Walkway width | mixed traffic flow | Separate walkway but its width is not recommended | Separate walkway and its width recommended |
| D/H | >3 | (0, 1) or (2, 3) | (1, 2) |
| Weight | 1 | 3 | 5 |
| Road Name | Origin | Destination | The Pavement Width (m) | |
|---|---|---|---|---|
| Changping East Street | Square | Danhe North Road | 13 | 6.5 |
| Changpingyuan Road | Changping East Street | Youyi East Road | 1.75 | 1.75 |
| Youyi East Road | Jianshe | Shennong | 10 | 6.5 |
| Shennong North Road | Beiwaihuan | Youyi | 4.5 | 4.5 |
| Changping East Street | Shennong | Shiji | 10 | 8 |
| Qingquan Road | Youyi | Taihua | 3 | 4 |
| Dinglin Road | Youyi | Taihua | 1.5 | 1.5 |
| Taihua West Road | Railway Bridge | Qingquan | 2 | 2.5 |
| Xinjian North Road | Taihua | The Railway Station | 3.5 | 3.5 |
| Yuhong Street | Danhe North Road | Danhe (Bridge) | 3 | 2 |
| Xuanshi East Street | Jianshe Road | Danhe (Bridge) | 6.5 | 4.5 |
| Kangle East Street | Danhe Road | Shennong | 6 | 6 |
| Jingwei Road | Jianghua | Kangle | 5 | 5 |
| Jinghua Street | Taiuo Road | Shennong | 2.5 | 0.5 |
| Gucheng Road | Nanduan | Xuanshi West Street | 2 | 1 |
| Jinfeng East Road | Kangle | Jinghua | 2.5 | 2.5 |
| Xinjian South Road | Jinfeng West Road | Jinghua | 0.75 | 0.75 |
| Jianshe North Road | Youyi Street | Square | 5.5 | 5 |
| Jianshe South Road | Xuanshi Street | Kangle Street | 10 | 12.6 |
| Tailuo Road | Jianshe Road | Shennong Road | 7 | 7 |
| Jianshe South Road | Xinhua Street | Nanwaihuan | 5 | 5 |
| Danhe South Road | Kangle Street | Xinhua Street | 4.5 | 4.5 |
| Yuying Street | Jinshe Road | Danhe Road | 4.5 | 4.5 |
| Xuanshi Street | Jingwei Road | Down Through Century Avenue | 1 | 1 |
| Number | Road Number | Pedestrian Path Type | Street Function Score | Visual Perception Score | Walking Scale Score | Total Spatial Environment Score |
|---|---|---|---|---|---|---|
| 1 | Yonghua East Road | Scale bias type | 24 | 12 | 20 | 56 |
| 2 | Yingbin East Road | Scale bias type | 28 | 9 | 21 | 58 |
| 3 | Nanda Street | Scale bias type | 24 | 8 | 17 | 49 |
| 4 | Yingbin Road | Functional bias type | 30 | 5 | 9 | 44 |
| 5 | Jingwei Road | Functional bias type | 32 | 9 | 12 | 53 |
| 6 | Jinghua Street | Visual bias type | 20 | 9 | 12 | 41 |
| 7 | Jianshe Road | Visual bias type | 16 | 13 | 9 | 38 |
| 8 | Youyi Street | Environmental equilibrium bias type | 38 | 11 | 17 | 66 |
| 9 | Xuanshi Street | Functional bias type | 35 | 13 | 9 | 57 |
| 10 | Kangle Street | Visual bias type | 19 | 10 | 12 | 41 |
| 11 | Taihua Road | Visual bias type | 20 | 13 | 11 | 44 |
| 12 | Jianshe Road | Environmental equilibrium bias type | 45 | 11 | 24 | 80 |
| 13 | Changping Street | Functional bias type | 36 | 17 | 23 | 75 |
| 14 | Shennong Road | Functional bias type | 35 | 15 | 17 | 66 |
| 15 | Yandi Avenue | Scale bias type | 20 | 6 | 20 | 46 |
| 16 | Xinhua Street | Visual bias type | 21 | 7 | 9 | 37 |
| 17 | Fu East Road | Visual bias type | 18 | 15 | 11 | 43 |
| 18 | Gucheng Road | Functional bias type | 21 | 11 | 14 | 45 |
| 19 | Jinfeng East Road | Functional bias type | 27 | 5 | 15 | 47 |
Publisher’s Note: MDPI stays neutral with regard to jurisdictional claims in published maps and institutional affiliations. |
© 2022 by the authors. Licensee MDPI, Basel, Switzerland. This article is an open access article distributed under the terms and conditions of the Creative Commons Attribution (CC BY) license (https://creativecommons.org/licenses/by/4.0/).
Share and Cite
Zhang, Y.; Zou, Y.; Zhu, Z.; Guo, X.; Feng, X. Evaluating Pedestrian Environment Using DeepLab Models Based on Street Walkability in Small and Medium-Sized Cities: Case Study in Gaoping, China. Sustainability 2022, 14, 15472. https://doi.org/10.3390/su142215472
Zhang Y, Zou Y, Zhu Z, Guo X, Feng X. Evaluating Pedestrian Environment Using DeepLab Models Based on Street Walkability in Small and Medium-Sized Cities: Case Study in Gaoping, China. Sustainability. 2022; 14(22):15472. https://doi.org/10.3390/su142215472
Chicago/Turabian StyleZhang, Yibang, Yukun Zou, Zhenjun Zhu, Xiucheng Guo, and Xin Feng. 2022. "Evaluating Pedestrian Environment Using DeepLab Models Based on Street Walkability in Small and Medium-Sized Cities: Case Study in Gaoping, China" Sustainability 14, no. 22: 15472. https://doi.org/10.3390/su142215472