1. Introduction
Travel satisfaction is a fundamental good in urban life and is also linked with modal choice. As travel mode choices increase, travel satisfaction plays an increasing role in mode choice. Enhancing travel satisfaction may aid in the effort for a better environment by adding value to low-energy systems while making daily life more agreeable. The potential for improvement in public transport (PT) and non-motorized transport is considerable and touches on several areas for improvement, in contrast with private car travel which is more constrained by the limits of infrastructure.
There has been considerable attention to the intrinsic qualities and services of public transport service for its effects on mode choice [
1,
2]. Operations management, pricing, and service quality figure prominently in the efforts of transit operators to address the modal shift to PT [
3]. Crowding, long waiting times, and service unreliability all lowered satisfaction levels in the main commute transport mode in Dublin [
4]. The remembered experiences of travel, including service courtesies, have direct effect on the decision to travel by PT. Cumulative satisfaction with the transport service is highly related to the accumulation of negative, critical incidents remembered from the past. Factors figuring into those critical negative incidents include treatment by an employee of the service, simplicity of information, and design [
5]. The intention to maintain use of urban rail for routine journeys is heavily dependent on impressions of service quality in cases from Spain [
6] and Portugal [
7]. The attention to the internal operations of PT that dominates the literature is understandable given the purview of operators and the much greater difficulties in dealing with the urban context in which PT operates. This literature demonstrates that passengers are sensitive to a wide variety of service attributes for PT that have direct impact on the decision to use the service.
There is much less attention in the literature to the effects of linked parts of the journey and, in particular, access and egress from the central part of the journey, in this case on urban rail. The concern with distance accessibility is often related to network characteristics [
8] and obstacles to movement. The built environment of the station catchment area [
9] and land uses [
10] have been studied with regard to mode choice, but very rarely with regard to travel satisfaction with the access trip. A limited number of studies have examined traveler evaluations of certain qualities of the access trip [
11,
12,
13,
14]. We have yet to link these evaluations with specific elements of the access and egress urban rail trips.
Trip satisfaction generally declines with increasing distance and time of the main commute. This decline in satisfaction is linked with activities in other life domains that may be curtailed or rescheduled after introducing the fixed parameters of travel [
15]. It is not yet clear that satisfaction is uniformly a negative linear response to travel time. The comfort of the experience before the main transport mode results in lower travel time estimates, for example [
16]. The sensed time and dimensions of experienced space vary according to cognitive and spatial abilities of individuals, but also as a function of direct experience of the space. The great differences in satisfaction between travel by active and by motorized modes, as well as substantial variation in the order and amplitude of responses among studies, suggest that the effect of distance might be further modified. As a result, distance and time should also be retained in satisfaction studies as control variables.
In this research, we hypothesize that the evaluation of the access trip has impact on the evaluation of the whole origin–destination journey, as well as on the PT portion of the journey. Why would the experience of the access trip have impact on satisfaction with the main PT part of the trip? Why in particular might walking in the access trip have a positive impact on subsequent travel satisfaction? A brief review of the physiological and psychological outcomes of walking provides explanations why evaluations of the first walking stage of travel may have direct impact on evaluations of the public carrier. Improved mood while walking may be partly attributed to physiological and biochemical mechanisms, including the production of endorphins [
17]. Normal walking is also associated with lowered blood pressure but also with the increased production of beta-endorphin [
18], which is known to activate opioid receptors that bring about feelings of general wellbeing. Many of these physiological responses are maintained for some time after the walk. Psychological mechanisms may include responses to moderate levels of stimulus, as an abundance of literature has shown, but also heightened feelings of self-efficacy. Self-efficacy is linked to improved performance [
19]. The physiological outcomes may be transitory but are sustained into the main part of the trip when the legs of the journey are chained. Psychological effects tend to have longer duration and are variable [
20].
The general finding that travel by public transport is evaluated as less pleasant than being at home, while walking is often evaluated as more pleasant, prompts investigation of the potential of the earlier travel stage influencing the second. The majority of access trips to the metro station are by walking. Given the conditioning of the walk sequence and heightened state of awareness and wellbeing, we might expect a more positive assessment of PT. Similarly, we might examine the relative effect of other modes, such as the bus, on the subsequent travel experience. Consistent with the first hypothesis concerning transfers from walking to PT, we could expect a decline in evaluations of PT when the access trip is by bus, in light of generally lower levels of appreciation for this mode. Such a focus is consistent with the general lines of work on travel as an integrated spatial and temporal entity, defined by purpose, others, and physical context.
In the next section, we examine these hypotheses in greater detail and with reference to the literature. This reading informs our research instrument, which is presented in
Section 3. Firstly, we present the three-factor model (
Section 3.1) and the Beijing case study areas (
Section 3.2). The commuter survey instrument is then introduced (
Section 3.3) followed by the mystery consumer survey (
Section 3.4). The analytical approach is outlined (
Section 3.5). The results are in five parts: the descriptive results (
Section 4.1); the comparison between the mystery consumer survey results and the commuter survey results (
Section 4.1); the multivariate analysis for all environmental attributes; and the commuter assessments of those environmental attributes by mode of access (
Section 4.2). Finally, we interpret these results in terms of the three-factor model.
2. Literature Supporting the Hypotheses
There are three topics that relate directly to the hypotheses, beginning with the superior psychological wellbeing in active modes. The presumed relation between access and egress with respect to the main mode is discussed with the relevant findings. The relation between satisfaction and travel distance or time is reviewed, which can then be related to the trade-off between access time and public transport level of service. Finally, we review the evidence for positive affect from specific features of the environment of experience while walking.
Studies that have directly compared active and motorized travel modes generally find higher levels of travel satisfaction with active travel modes [
21,
22,
23]. While it is possible that dedicated pedestrians and cyclists are acting out deep-seated life constructs, even to the choice of habitats that allow them to play out these preferences, improved psychological wellbeing is also observed for those who switched from car driving to active commutes [
24]. Some of the higher ratings for walking and cycling, when compared with public transport, may relate to the greater logistical simplicity of the active modes. Such trips are monomodal, which are generally preferred over multimodal trips [
25]. Trips on urban rail are by definition multimodal, such that we could expect lower satisfaction than for similar distance trips executed on foot or bicycle. In a Beijing study, 11% of pedestrians walked to their destination when it was more than 2 km away on a corridor where metro and bus services were available [
26]. Travelers value aspects of their experience that weigh in favor of the non-motorized choice, where it is possible to do so.
Studies tend to support the view that longer commutes are associated with lower overall life satisfaction [
23,
27,
28,
29,
30]. With longer duration travel, individuals are less enthusiastic about their travel, less relaxed, and tend to evaluate the quality and efficiency of the trip as lower. Travel time is not always regarded as wasted time, however, and may be perceived as positive experience [
31,
32]. The very long commutes experienced by suburban Beijingers or Tokyoites are assessed negatively. In the Beijing case, long commutes by rail accompany intentions by the great majority of such commuters to switch to private car [
33].
To the extent that travel is a disruption of routines in a variety of purpose settings and travel results in lowered levels of satisfaction [
20]. Active travel might be perceived even more positively than some elective sedentary activity for the physiological and psychological reasons mentioned above. Just as service reliability of PT figures prominently in many studies of its desired qualities, the accommodation and realizability of a day schedule may also be key factors in raising appreciation of the walk cycle. The wide range of responses to the environments of such movement suggest that such satisfaction is highly related to the conditions of the environment [
14], which is addressed in the last part of this section.
The body’s response to walking or cycling by producing more endorphins [
17] is experienced during the walk cycle but also has residual effect. The walk also results in lowered blood pressure among other signs of relaxation [
34]. Essentially, we feel better physically and psychologically by virtue of exercise in the first stage of the journey, which may have spill-over effects when evaluating subsequent experience. Few studies examine the relationship between access and travel by the main mode with regard to satisfaction [
13,
14,
29,
35]. In a study of bicycle and public transport access to the train in the Netherlands, access conditions and management of the station space had significant effects on the evaluation of the rail portion of the trip [
11]. In a Swedish study, overall satisfaction with public transport was related to satisfaction with access (0.684,
p < 0.01) and egress (0.522,
p < 0.01) [
13]. Based on these insights from multiple sources, we could expect a positive spin-off from the first leg of the journey onto the second but our knowledge of the details of the walk or bicycle environment that relate positively to overall satisfaction is partial and fragmentary.
An additional element entering into the evaluation of time is the weight of external benefits that derive from comfort and frequency of service for a reduced, higher-quality network. It is well recognized that pedestrians are willing to walk farther to urban rail [
14] because of greater comfort, reliability, and frequency of service when compared with bus service. The operational advantages of urban rail might be tempered by higher volumes of passenger traffic that lead to crowding or even delays while waiting to enter an overcrowded station. For these reasons, as well as possible others, walked distance is not clearly related to satisfaction with the walk portion of the trip.
Finally, our experience of walking is complex because it is multisensory and within an environment that is constantly changing as we move. The literature demonstrates the ability of individuals to globally assess the comfort and convenience of their walk to PT although it is more difficult to relate these assessments to particular features of the environment. Positive affects in walking may relate to higher concentrations of human activity but are also observed in naturalistic environments with trees and water bodies [
28]. Safety and security figure prominently in many studies on access to urban rail [
14], although we need to know more about the specific elements in the public environment triggering these assessments. Some of the concern with safety relates to features of the physical environment, including interactions with motor traffic, quality of walking surfaces, clarity of movement priority, lighting, and the presence of others. Pedestrians walking to urban rail are highly sensitive to details of sidewalks, stairways, and other pedestrian facilities. When pedestrians have available path choices, they will tend to choose routes with certain physical attributes that might include services, whether used or not [
36]. The availability of path choice may also have effects on satisfaction levels, given that choice confers a measure of control.
The literature on access to urban rail merits development, particularly with regard to the interaction between stages of travel. Although much has been done to investigate the co-variates of walking for leisure, commuting, and other purposes, we need specific investigation of the access trip to urban rail.
3. Materials and Methods
3.1. The Three-Factor Model
The model relates performance factors to satisfaction. The three groups of factors are described in
Table 1 following the literature [
37,
38].
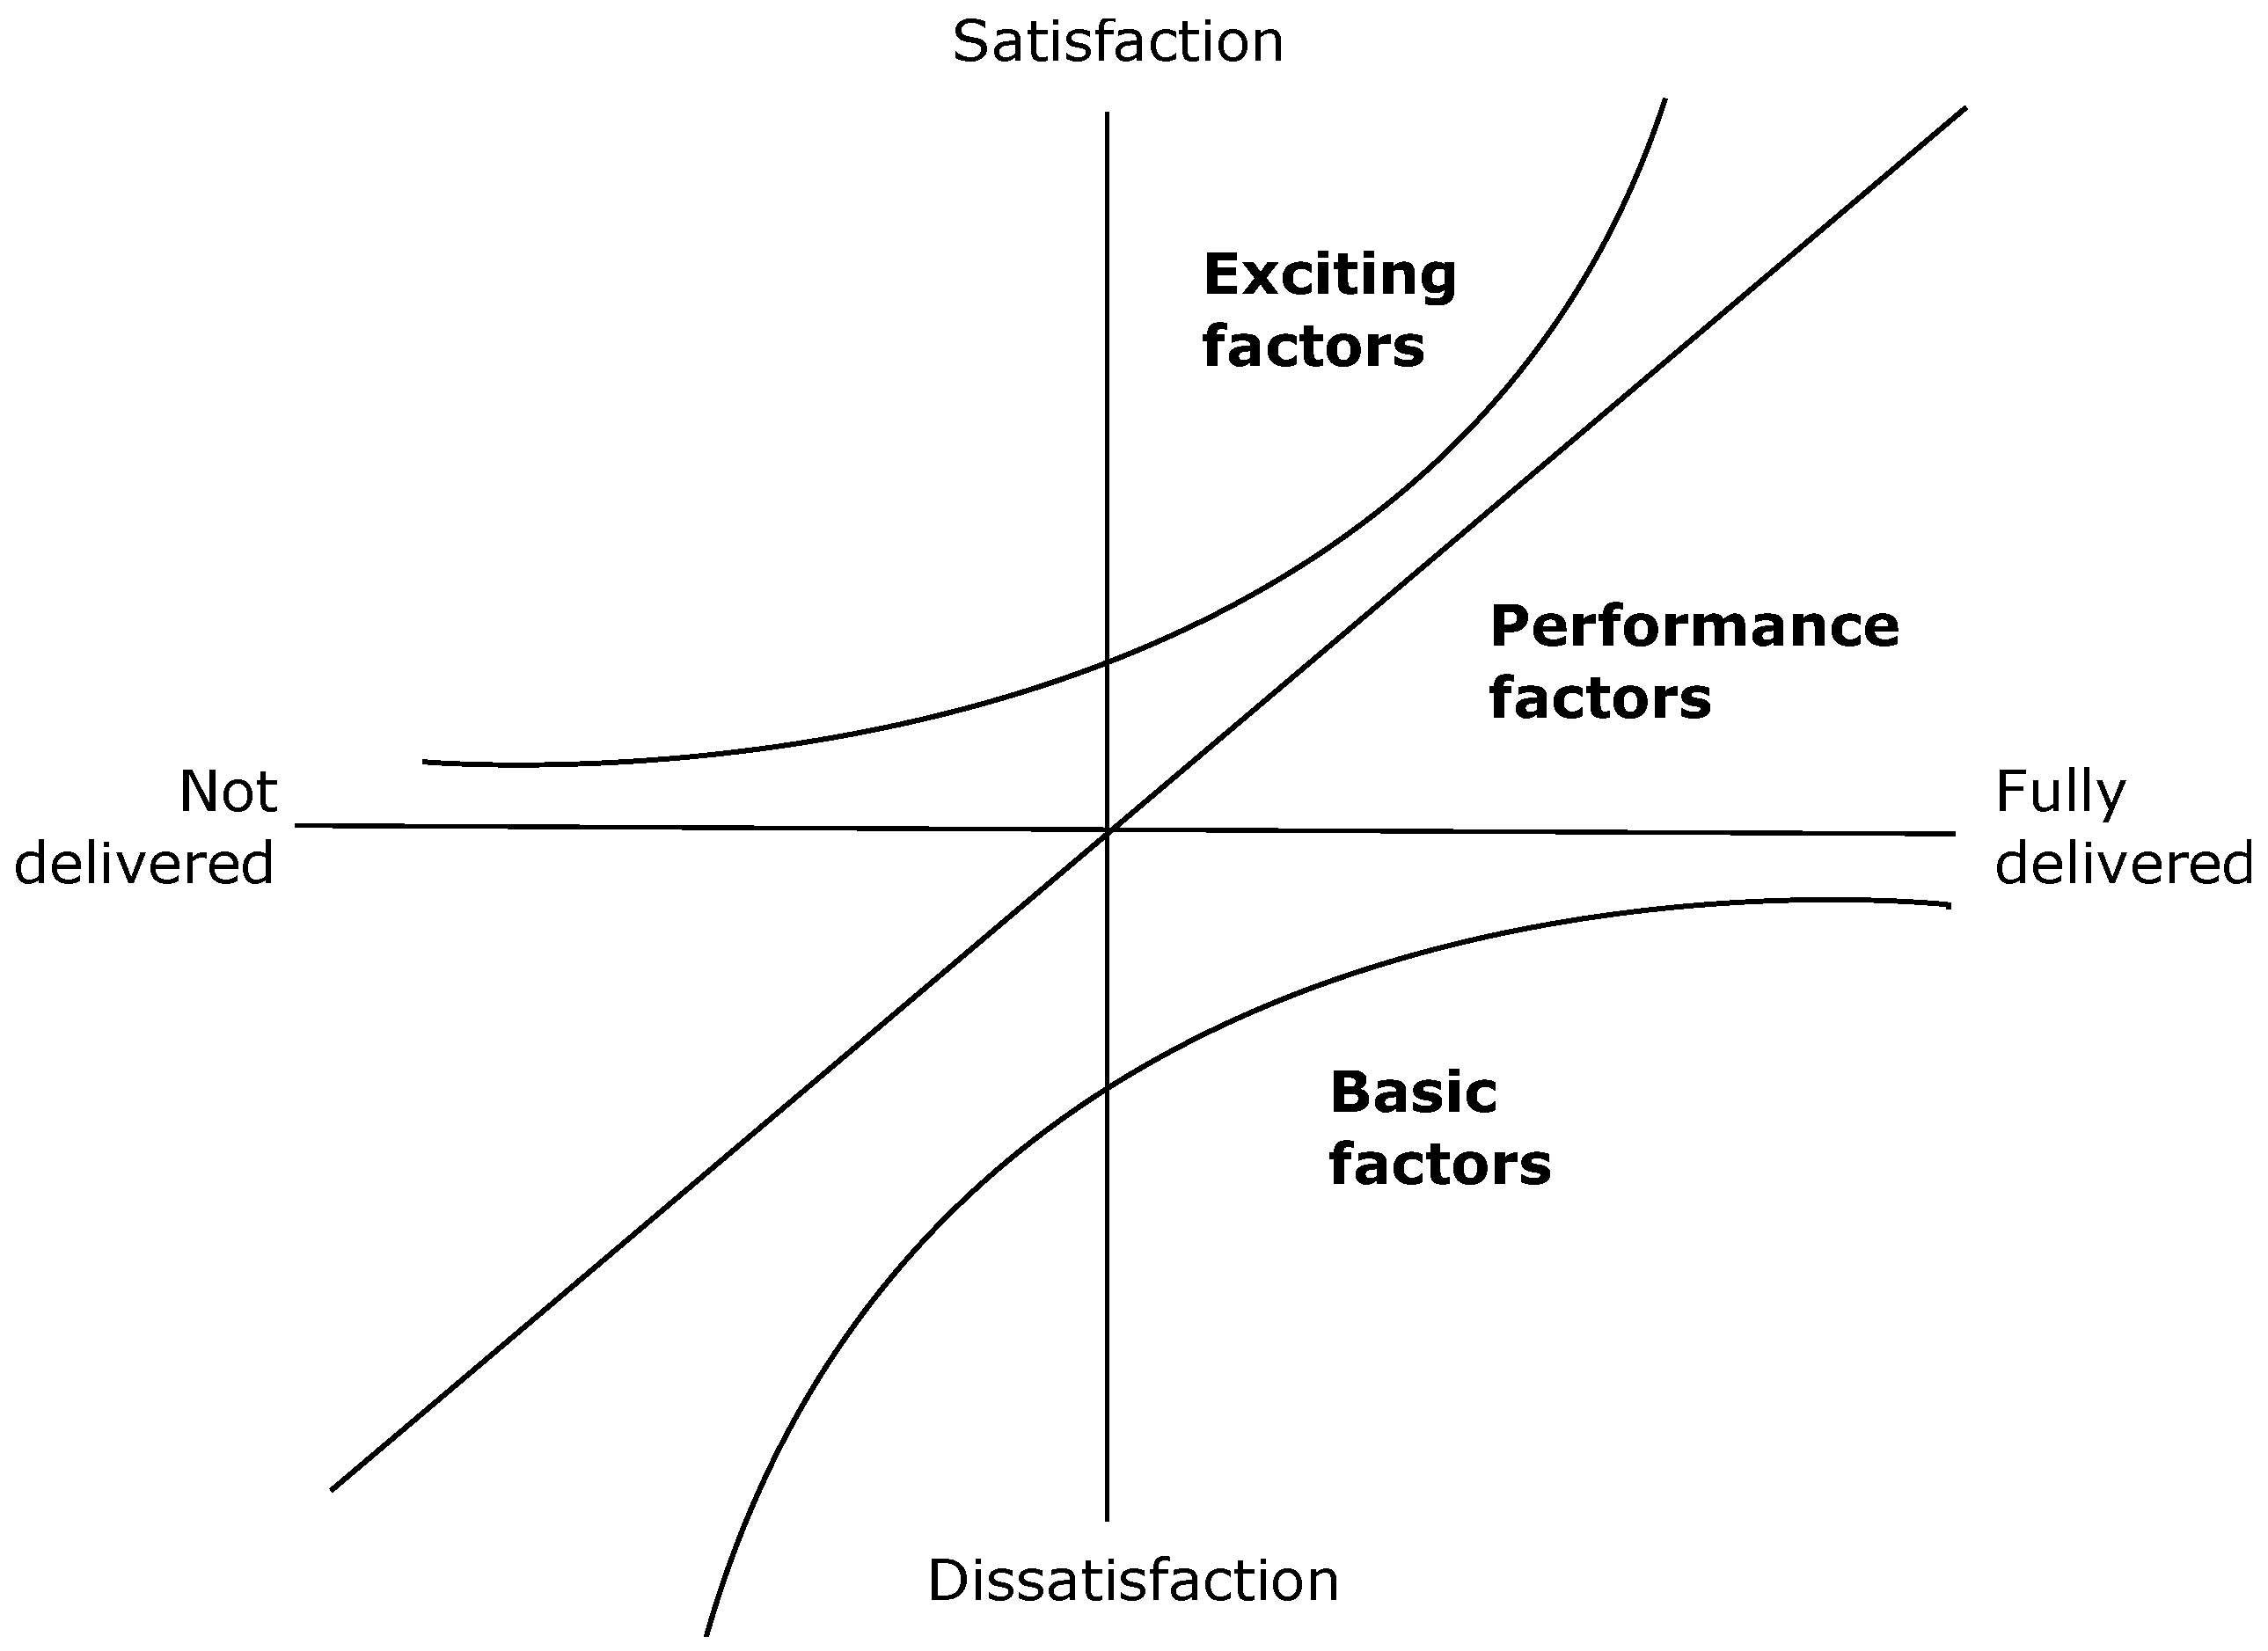
The basic factors have a negative impact on overall satisfaction if their performance is low, but have no material impact on overall satisfaction if they perform well (
Figure 1). In contrast, exciting factors increase overall satisfaction during high performance, but do not affect overall satisfaction during low performance. These two factors represent the nonlinear and asymmetric effects of service attributes on overall satisfaction. On the other hand, performance factors have a linear effect on overall satisfaction. When the basic factors are not performing well, they need to be taken seriously, because passengers want these factors to be satisfied. Exciting factors have the lowest priority, because passengers do not expect them, even if they may make passengers happy [
38]. Zhang et al. [
39] found that customer service, ride comfort, safety while waiting, and cost constituted basic factors, while performance factors included safety while riding, reliability, convenience, travel time, and ease of use. Busacca and Padula [
37] detail how the three factors interact and recommend regression analysis with the dummy variables of high and low performance, which is the approach taken in this study.
3.2. Study Areas
Beijing has invested heavily in its metro system in the last twenty years to respond to mobility demands. In 2019, before the onset of the pandemic, 21.5 m inhabitants generated a total of 3.95 billion metro-based trips [
40]. The planned extensions to the existing system of 700 km of lines and 405 stations are intended to capture an increasing proportion of new internal trips. To the extent that access and egress satisfaction are relevant to the decision to use metro, they are relevant to this transport plan. This study is in part focused on local conditions for access to stations, so three distinctly different environments were chosen for the field study (
Figure 2). The three stations are Xisi Station (XS), Mudanyuan Station (MDY), and Huilongguan Station (HLG) (
Figure 3). The circles represent the 800 m study areas. XS is a residential area with traditional Beijing urban texture—small blocks, high road density—offering pedestrians more path choice. HLG is in a new suburban residential area, with large blocks, dense residential use, and low land use diversity. The built environment around MDY is typical of residential areas built before 2000 in Beijing, with a relatively moderate street scale and land use diversity.
Figure 2 shows the built environment around the three stations. In the first row are street intersections. The second row illustrates privatized urban blocks with the public thoroughfares between them. The last row illustrates land use, with yellow as exclusively residential use, red as exclusively commercial use, and pink with mixed commercial and residential uses. The green areas are parks.
3.3. Questionnaire Design and Data Collection
Capturing impressions of a perceptually rich environment is a methodological challenge because of uncontrolled phenomena in a dynamic environment. The brain retains selected memories for future action purposes. The selected experiences that are needed for future trips can be stored in long-term memory, while multi-sensory experiences and trip details belong to short-term memory. Applying the survey immediately following the access trip was intended to capture impressions from both short- and long-term memory. The survey was conducted on the metro station platform by approaching waiting passengers using a randomizing protocol and then asking an eligibility question. Participants needed to be executing a routine trip from home with one rail-based segment of the journey and monomodal access and egress segments. The survey was conducted simultaneously at three stations between 8 a.m. and 10 a.m. in July 2019. A pilot survey with 60 participants, recruited on the same metro platforms as for the main survey, allowed us to verify that the questionnaire was understandable and applicable and that responses were distributed. The final survey was of 332 participants with completed questionnaires, or a 40% response rate. This number is sufficient given the psycho-metric nature of the survey, as evidenced generally in such studies on environmental perceptions.
The questionnaire consisted of four parts: 1—trip characteristics; 2—evaluation of different trip stages and environmental variables; 3—socio-demographic characteristics; and 4—estimates of access and egress travel time. Trip characteristics included purpose, origin, and destination location as well as chosen mode for both access and egress, given that these are often different. The access, egress, and main parts of the trip were evaluated for satisfaction on a 5-point Likert scale with 5 as most satisfied. Actual distance was measured in GIS using the reported origin and destination locations. The set of built environment attributes considered and their definitions are as follows (
Table 2):
3.4. Mystery Consumer Survey
Considering possible reliability issues due to recall for the evaluation of service quality, a mystery consumer survey is also implemented. The method involves independent observers retracing the reported access and egress paths and reporting evaluations according to the survey grid administered to the commuter participants. Four investigators are trained with regard to the above factors and the evaluation grid. All of them conduct evaluations at all three stations and on access and egress pathways where there were more than three participants, for a total of 72 distinct paths.
3.5. Analytical Approach
Regression with dummy variables is chosen to discriminate the way service attribute performance impacts overall travel satisfaction. Since the dependent variable—overall travel satisfaction—is in order, from 1 or totally disagree, to 5 or totally agree, in this case an Ordered Logit Model (OLM) is most appropriate. In general, OLM can be expressed as:
where k^⋇ is the latent dependent variable of individual k, and Xk is the explanatory variable set of individual k, which contains all the independent variables of individual k. β is the vector corresponding to the parameter to be estimated. εk is the error term, which is assumed to be a logistic error term of the same distribution.
In this research, level 5, or very satisfied, is set as the reference variable for each group of variables, for determining to which factor in the three-factor model the attribute belongs. When there is a significant negative impact relative to the reference variable, at 1 to 2 on the satisfaction scale and no significant impact at 4, the attribute is taken as a basic factor. When a score of 4 has significant negative effect compared with a score of 5, but a score of 1 to 2 has no significant effect, the attribute is an exciting factor. When attributes have significant negative effects from 1 to 4, and the impact factor is basically linear, the attribute is treated as a covariate, i.e., belonging to performance factors.
4. Results
4.1. Descriptive Results
Table 3 summarizes the descriptive data from the three stations. The recruited participants were evenly distributed between males and females, with about 80% between the ages of 20 and 39. Nearly half of survey participants (48.0%) owned a private car or bicycle. While HLG had a significantly lower rate of car ownership among the three areas, a larger proportion (11.1%) chose car as the access mode than in MDY or XS. There was no significant difference in car ownership among the three urban areas (
p > 0.05) but significant difference in access mode choice (c
2 = 24.3,
p = 0.000). Access distance in HLG was on average greater than in XS. XS had the shortest access distance, but also a smaller proportion of trips by bus and more by shared bicycle. The walking share was greater for egress than for access overall, with a lower proportion of those taking a bus after the metro ride compared with the access stage of the trip. The longest metro journeys were from HLG, given its location in peri-urban Beijing.
Access distance was important in the choice of mode at certain thresholds. The access distance has a significant effect on the selection of access mode (c2 = 190.5, p = 0.00). Walking predominates at under 1.8 km, with a switch to bus and bicycling thereafter. Car use increases after 3 km of access distance.
Firstly, we examine overall satisfaction by mode and trip segment (
Table 4 and
Table 5). Access and egress satisfaction are highly related to overall satisfaction, contributing as much or more than the main segment of travel by metro. From the overall data, compared with the average satisfaction of the access part and the egress part, the satisfaction of the main travel stage of the metro was highest (3.69 ± 0.09), and the access part was lowest (3.61 ± 0.09). Metro passengers arriving by car have the highest mean score of trip satisfaction (3.71 ± 0.35), while those who chose bus as access mode have the lowest (3.43 ± 0.23). The scores of access mode were significantly different among the three sites (F = 5.126,
p < 0.01), among which XS had the highest average satisfaction of all stages, while HLG had the lowest. When arriving at the station by foot and bicycle, visitors’ satisfaction was significantly higher at the XS Station than at the HLG Station (
p < 0.05), although the latter tended to have longer trips.
Pedestrians are most satisfied with the continuity and lack of detour in the street network, while they are most dissatisfied with shade and greenery (
Table 6). They rate walking to the bus stop (mean = 3.49) or cycling (mean = 3.38) as less satisfying than walking to the metro (mean = 3.73). Pedestrians are more satisfied with services than are bicyclists. Those biking to the station express generally lower levels of satisfaction with the metro portion of the trip, similar to the effect of riding to the station by bus. Bicyclists are less satisfied with separated bikeway (mean = 3.29) and bike parking facilities (mean = 3.33), but show highest satisfaction with road connectivity (mean = 3.69). People have a high degree of satisfaction with the built environment when traveling by bus, especially the safety of the station (mean = 3.80). The higher satisfaction with the metro for bus riders may be illustrative of the contrast they feel between their access mode and the main mode.
XS has the highest average score of road connectivity, detour and crossing safety, and service facilities among the three stations, but the width of the sidewalk has the worst performance among the three sets of data. The sidewalk in XS is not only narrow but also impossible to walk due to illegal car parking and bicycle parking. XS commercial and residential uses are combined, with both sides of the road providing a wealth of service facilities. Although the smaller block size of XS provides more convenience, other attributes are lacking, such as landscape greening. The greenery and shading of the MDY are obviously the best of the three stations. Compared with the XS and HLG, the sidewalk width at MDY is the most satisfactory for commuters. MDY also has more green space than the other station areas. The average value of all attributes of HLG is lower than that of the other two stations, especially the service facilities, which are far lower than that of XS. Due to the barrier of railway traffic in HLG, the satisfaction of PRD is low. At the same time, the wide road also reduces the road connectivity and crossing safety.
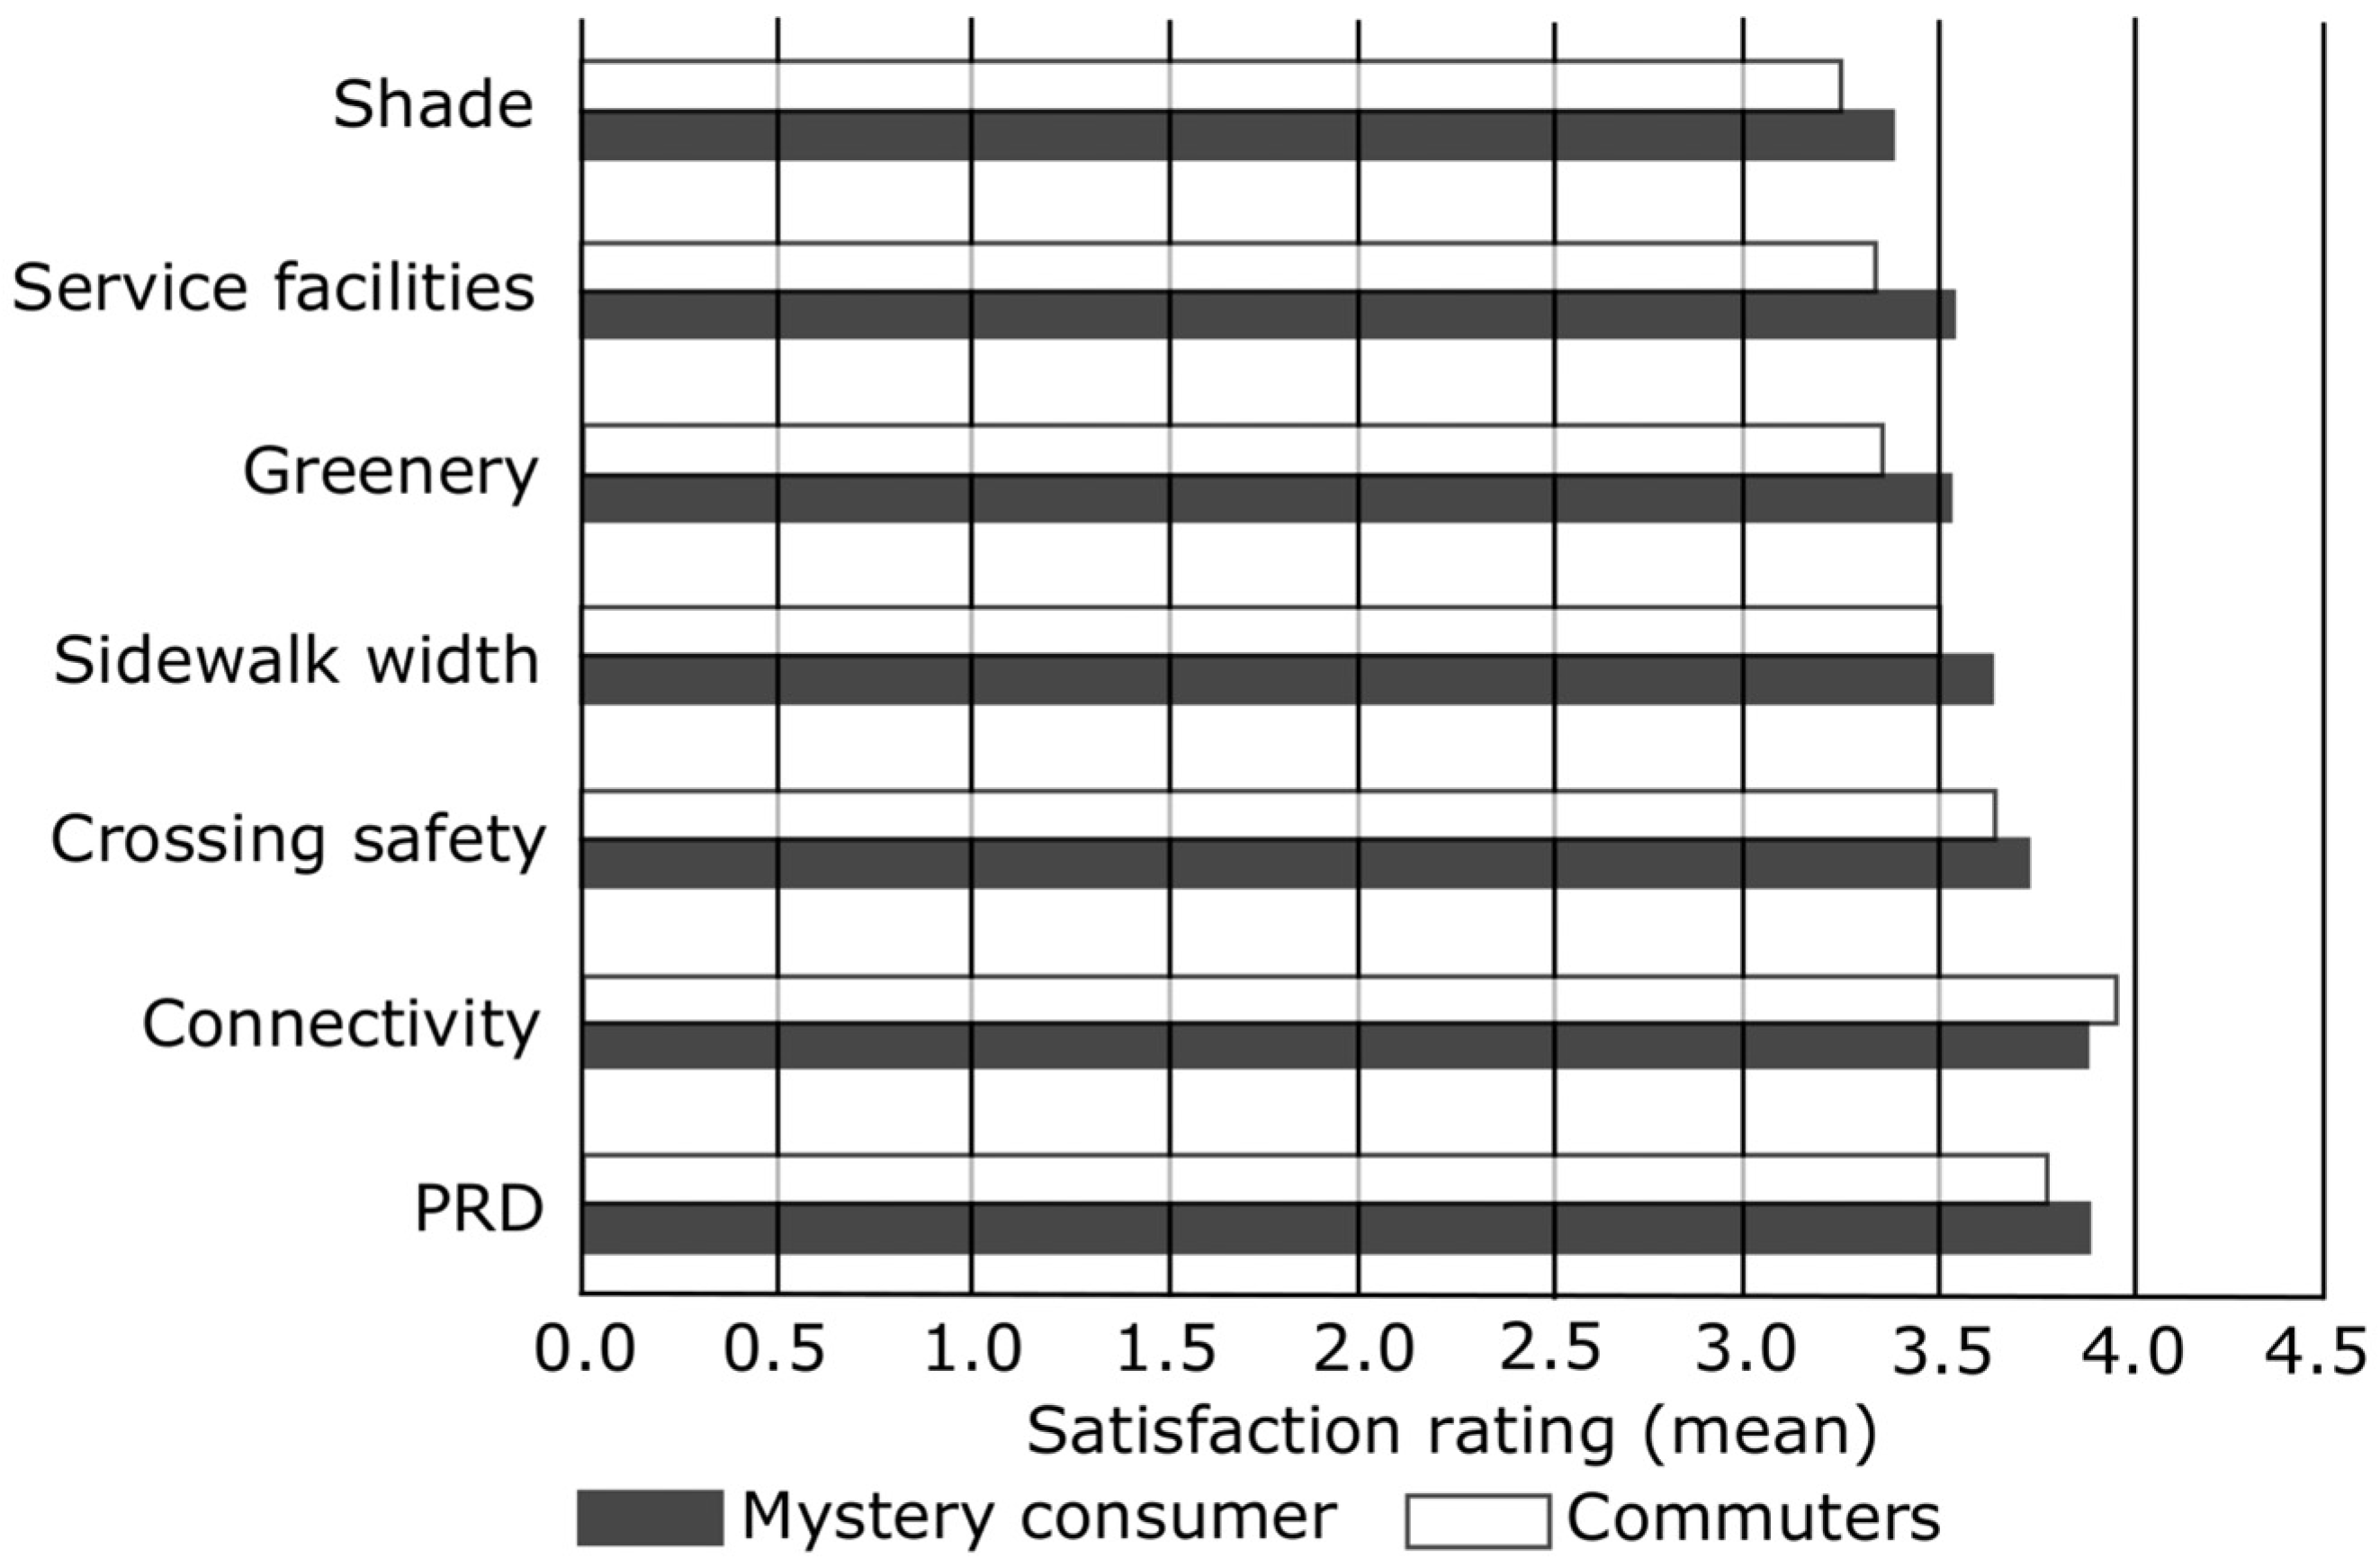
The mystery consumer survey results are compared with those of the commuter participants in
Figure 4, with an overall correlation of 0.97 (
p = 0.000). Except for road connectivity, the average score of each attribute in the mystery consumer experiment results was lower than that in the commuter satisfaction survey, with an absolute difference of less than 0.20. We conclude that commuter participants had a clear recall of access and egress conditions, ranking the environments in much the same way as the mystery consumer investigators, who had the advantages of comparison and purpose.
4.2. Multivariate Analysis
In the walking access mode, all factors except PRD have a significant impact on overall trip satisfaction, while all environmental attributes are significant for bicycling access. Bus access distance is unrelated to satisfaction, consistent with Abenoza et al. (2019a).
All travel stage satisfaction levels are closely related to overall travel satisfaction using Spearman’s coefficient (r = 0.6,
p < 0.01). Based on the correlation test, the ordered regression models (
Table 7,
Table 8,
Table 9 and
Table 10) are presented for satisfaction at different stages and for different access modes. Satisfaction with each stage of the journey can explain up to 74.6% of overall travel satisfaction (
Table 7). In general, the influence of the access stage is higher than the influence of the other stages. Recall that our survey was conducted upon the participant’s recent completion of the access stage. Satisfaction of the connecting part of travel has a greater impact on overall satisfaction than satisfaction with the main ride stage. The access part in the bus access mode has greater impact.
Table 8 presents the estimated coefficients for overall satisfaction under the walking access mode. The model can explain 51% of overall travel satisfaction. On the whole, road connectivity features prominently in overall satisfaction. Since there is a linear relationship between this factor and overall satisfaction, we can conclude that more connectivity brings higher overall satisfaction. When the shading condition is poor, there is little change in satisfaction, but when the shading condition is better, it will bring a significant increase in satisfaction. This fulfills the condition of the exciting factors in the three-factor classification—unexpected but welcome. Greening and crossing safety attributes have the opposite effect to shading. When the satisfaction of greening and crossing safety attributes is lower than the basic value, it has a significant negative impact on the overall travel satisfaction, but when the greening attribute satisfaction exceeds the basic satisfaction, the impact on overall satisfaction no longer increases linearly with the increase in greening satisfaction. This shows that greening and street crossing safety attributes are basic factors.
Table 9 presents the estimated coefficients under the cycling access mode. Due to data limitations, non-significant factors are eliminated. The model can explain 67% of the overall travel satisfaction. The results show that service facilities, parking facilities, detour and access distance all have a significant impact on the travel satisfaction of cyclists. Access distance and PRD have a linear effect on overall satisfaction. The greater the access distance, the greater the detour, and the lower the overall satisfaction. When passengers are very dissatisfied with the parking facilities, there is a significant negative impact on the overall trip satisfaction; however, if satisfaction continues to increase, the impact on the overall satisfaction does not increase linearly, which indicates that parking facilities are basic attributes. The higher the passengers’ satisfaction evaluation of service facilities, the higher the overall satisfaction is; however, when service facility satisfaction falls below 3, overall satisfaction is no longer significantly decreased. Therefore, service facilities are an exciting factor in this model—unexpected but when present, lead to a better travel experience.
Table 10 presents estimated coefficients under the bus access mode. The model can explain 62% of the overall travel satisfaction. The results show that the higher the walking experience satisfaction, the higher the overall travel satisfaction. The experience of walking to the bus is not a specific attribute in itself (
Table 11). When passengers are dissatisfied with the station’s location, however, there is a significant negative impact on overall travel satisfaction. When the satisfaction increases to a normal value, overall satisfaction will no longer increase as satisfaction with the station’s location increases. Therefore, the position of the station is a basic factor in this model.
Figure 5 summarizes the multi-level organization of the built environment attributes of metro passengers, following the previous interpretation of the regression model. Basic requirements are made up of landscape greening, bicycle parking facilities, bus stop location, and crossing safety. The second level of performance factors are mainly connection distance and detour and road connectivity, which can produce similar positive and negative effects according to their performance, and have a linear relationship with overall trip satisfaction. The shorter the access distance, the higher the overall satisfaction; the lower the amount of detour, the higher the overall satisfaction, etc. The third level of exciting factors is composed of shade and service facilities. If such conditions are available, they can increase travel satisfaction but are not necessary conditions for travel satisfaction.
5. Discussion
The literature has generally found that the main, central, or public transit mode was dominant in travel satisfaction with the whole journey [
29,
35]. Our result is that the access and to some extent, egress, have greater weight than the main travel component in overall trip satisfaction for commuting travel on the metro. The preponderance of walking and bicycling trips in the result are important. Moreover, our survey was conducted with the access trip just completed, presumably vivid in memory and perhaps having significant effect on mood generally, and on the specifics that were part of our survey. Rietveld’s remark (2000) [
41] that “the market potential of railway services depends to a considerable extent on the quality of the total chain from residence to place of activity and vice versa” is to the point.
Previous work on the access and egress parts of the journey involving urban rail has centered on distance and time issues, safety and security issues [
42], and conditions at the transfer point [
43]. The present analysis contributes evaluations of some qualitative aspects of the experience and shows that such evaluations have relation with broader assessments of travel by urban rail. Distance remains important for the PT portion of the trip but is not significant for the distances covered by the walking and bicycling modes. The walking distances at HLG and MDY are nevertheless considerable, while bicycling distances are about double the walking distance in the three study areas. The most notable difference in mode choice among the three study areas concerns HLG, with its contemporary layout of very large blocks and wide streets. Car use is higher in HLG, even if car ownership is lower, which seems likely to result from urban layout adapted to the car. The sharp differences in modal split and related access distances in these three sample datasets attest to the influence of the environment on the travel outcomes.
Satisfaction with walking is higher than with public transport, a finding similar with that of St-Louis et al. [
23]. When access distance exceeds 1 km, there is a notable shift from the walking mode to bus and car. At greater distance, there is time saving with the bus on the access journey, which helps explain why distance is less important while time becomes more important. This also helps explain why the waiting time for the bus figures prominently in the bus riders’ responses. This may be because the access part occupies more waiting and transfer time during the bus access process. Travel phases that include more waiting and transfer time have a higher impact on overall travel satisfaction.
Relatively high satisfaction with bus access to the station might appear counter-intuitive, particularly in light of the less than satisfying ratings for crowdedness and seat capacity. During the time of the survey, it could be expected that most buses arriving at the station would be full, with standing room only. Crowding has serious negative effects on the perceived utility of travel by public transport [
42]. Bus riders are likely to evaluate their condition within a different frame of reference than that of pedestrians and cyclists. Factors that might impinge on their satisfaction are also largely out of their control, including waiting time, crowdedness, location of the bus stop, and traffic speed. Within that frame, the efficiency of the trip will tend to be more important, with time savings in particular.
The car does not have a prominent role in the access or egress trips with metro as the central mode. Firstly, driving and non-driving days are determined by license plate number in Beijing. Secondly, there is much more uncertainty about travel time and conditions by car while the non-motorized access and egress modes together with the metro main mode are highly reliable. As a result, many car owners do not use their cars and also have higher levels of satisfaction with the travel, as they are PT travelers by choice. This is consistent with the literature. A large proportion of the PT travelers by choice likely did not experience restrictions on the use of their private car but chose other and distinct mode combinations according to local conditions.
Access environment has a significant role in access trip satisfaction, which is consistent with the literature [
43,
44] and may explain specifically why XS has the highest access satisfaction. Although the access distance for XS was the shortest among the three, short distance did not have a significant effect on expressed satisfaction. In contrast, it is access to the physical environment that plays an important role. These findings might suggest that traditional neighborhood designs are more suitable for walking and bicycling than contemporary high-rise neighborhoods in Mainland China. Furthermore, we find that when people choose to use a vehicle to get to a metro station, the comfort of getting to that vehicle also plays an important role. Therefore, we can add to previous findings in the literature that the built environment impacts not only walking but also the other access modes including bicycling and bus.
With regard to the classification of attribute factors, there are differences and similarities with previous work. For urban rail transit, network structure defined as the distance, detour, and connectivity, is classified as a performance factor and has a linear influence on satisfaction. Attributes such as greening and shade show significant nonlinear effects in this model.
Although the nature of the three-factor approach by itself does not permit the establishment of preferences and priorities among service attributes, it can serve as a reference point for strategic investments. Stakeholders need to consider not only the level of necessity for a given attribute but also a number of other important aspects, including the actual level of performance of the attribute and the cost of improving performance, as well as the degree of positive and negative impacts on performance.
Overall, we have the sense that the access and egress portions of the travel involving the metro are important, not only for choice but also for the overall satisfaction with the chosen method of urban travel. In many cases, certainly the case in Beijing, urban rail is retrofitted into the existing urban environment with little or no alteration to the conditions in the local environment for access. Those local conditions deserve more attention, based on the evaluations of metro riders’ experience.
The study has limitations. The relatively small sample size does not allow us to examine in detail the car access mode. A further investigation on the egress segment of the trip would be useful, particularly given the somewhat different mix of modes used for egress compared with access. Moreover, this research did not control the influence of personal social attributes and preferences [
45]. Finally, when considering the response differences between local areas, one needs to admit the possibility of self-selection with regard to mode choice and response to the attributes of those particular local environments.
6. Conclusions
This research measured the impact of access and egress stages of travel in metro-based commuter trips on overall travel satisfaction. Specific features and qualities of access and egress trips were also evaluated by commuters who routinely made the journey in progress and had just completed the access trip. The reported access and egress itineraries were independently evaluated by a team of investigators to validate the responses of survey participants. A relatively wide range of features were examined by applying the survey at three metro stations in a centrally located traditional area, an area built up after market reforms in 1978 and a peri-urban community built up after the year 2000. The investigations by the mystery consumer team across all environments and paths turned up satisfaction responses that strongly resembled those of the commuter participants, suggesting that the participants were well able to discriminate their local access conditions and to agree on those conditions.
The access and egress portions of the journey by rail have a major impact on overall travel satisfaction with the metro in the case of Beijing, with their contributions to overall satisfaction somewhat greater than that attributable to the rail portion of the journey. Given Beijing’s intention to raise the metro rail share of intra-urban travel with continued buildup of the system, it is very important to improve the local environments of access. Access to the bus stop is also important in satisfaction with this mode when the bus is used to access the metro.
Attributes of the access and egress stages of the trip were evaluated on a five-point satisfaction scale for each of the modes of walking, bicycling, bus, and car. A three-factor analysis was applied to the result to determine whether the attributes belong to basic, performance, and excitatory factor categories. An ordered logistic regression model reveals the relative importance of each in a combined explanatory model. In the case of pedestrian access, road connectivity, shading, greenery, and perceived street crossing safety collectively account for 51% of satisfaction with the whole journey. Examination of the regression effects reveals that greening and travel security can be considered basic factors, connectivity is a performance factor, and shading is an excitatory factor. In the bicycling access mode, it is found that pedestrian route directness (PRD), access distance, and service and parking facilities together can explain 62% of the variance in expressed satisfaction with the whole journey. Analysis of the regression results for the three-factor model reveals that parking facilities are a basic factor, while PRD, connection distance, and service facilities are performance factors. In the case of bus access, bus stop location is a basic factor for commuters along with the walking environment and distance to the bus stop. On the whole, the built environment has significant impact on overall travel satisfaction for commuters accessing rail on foot and by bicycle. The built environment is of less concern for commuters accessing rail by bus, while waiting time for the bus and service attributes of the bus are main concerns.
The three-factor model enables us to overcome to some extent the limitations of previous studies that assume linearity and symmetry in the response to various environmental attributes. The model enables the categorization of attributes by mode according to basic, performance, and exciting factors. The three-factor model suggests that priority areas for improvement are the connection time, greening, bicycle parking facilities, bus stop location, and perceived safety of crossing the street. Shorter connection time is achievable by reducing the time between cycles at controlled intersections. The next order of priority is the reduction in connection distance through reducing detours. Shading, greening, and service facility provision are at the lowest priority in terms of their impact on overall travel satisfaction although they are highly appreciated in the access and egress stages of travel.


