1. Introduction
The upgrading of technology is crucial to the implementation of sustainable development strategies and the solution of environmental problems. However, the research and development of green products is not always easy. For example, in November 2013, Apple [
1] signed a contract worth USD 589 million with advanced technology Inc. (GTAT), hoping that GTAT would develop an advanced sapphire screen that could prevent scratches and cracks. This outcome could cause the new iPhone to be different and more in line with the company’s concept of sustainable ecological development. However, the results were not satisfactory; GTAT did not successfully develop the green products that Apple wanted within the agreed time. Apple decided to withdraw its cooperation with GTAT in September 2014. Finally, GTAT withdrew from the market at the end of its bankruptcy, after Apple had also paid a considerable amount for research and development.
The following illustrates a successful case of green product R & D and upgrading. More than 90% of the traditional polyurethane resin is solvent-borne and the content of the organic solvent accounts for about 70%. Most of the solvent cannot be recovered, thus causing serious pollution to the environment. The Huafon Group took the lead in the research and development of water-borne branched polyurethane resin, which almost changed the production pattern of chemical industry and its downstream industries. This R & D achievement not only makes Huafon’s products more environmentally friendly, but also promotes the green transformation of the manufacturing process of downstream industries. Most importantly, this case illuminates the sustainable development of relevant industrial chains.
In order to support enterprises in the R & D, upgrading, and improvement of green products, China has formulated and issued a series of policies and documents since 2007 to encourage enterprises to carry out the green upgrading of sustainable operation. For example, “Outline of the People’s Republic of China 14th Five-Year Plan for National Economic and Social Development and Long-Range Objectives for 2035” clearly proposed the implementation of innovation-driven ideas, accelerate the construction of a national innovation system, and focus on improving innovation capability. It proposes the promotion of green development and acceleration of green transformation as key tasks and emphasizes the construction of a policy system for green development and a strengthening of the policy guarantee for green development. On 28 September 2021, Hangzhou released the Hangzhou Science and Technology Innovation Carbon Peak Action Plan, which provides 30% subsidy for equipment investment during the construction period of green product R & D enterprises [
2]. On 20 March 2020, Shanghai issued the Special Support Measures of Shanghai for Building Energy Efficiency and Green Building Demonstration Projects, indicating that Shanghai will subsidize CNY 300 per square meter for ultra-low energy consumption buildings with building areas of more than 2000 square meters [
3].
Different forms of subsidies may bring different effects. Under the support of different government subsidies, how the government should set subsidies to maximize social welfare is a problem that needs to be studied. This paper explores the case in which, considering the probability of R & D failure when enterprises carry out green product R & D and upgrading, the government provides two different government subsidies: (1) subsidies for manufacturers’ R & D costs and (2) subsidies for the unit production cost of green products successfully developed by manufacturers. Then, from the perspective of maximizing social welfare, it discusses which subsidy method is better.
2. The Literature Review
Before introducing the model, we review the relevant literature. Our work mainly focuses on three aspects: supply chain product R & D, green supply chain, and government subsidies.
The first aspect focuses on the research and development of supply chain products. Increasingly strict international environmental regulations and consumers’ awareness of environmental protection or a sustainable supply chain have prompted the supply chain to implement green production. Some experts and scholars consider innovation decisions under different R & D scenarios. For example, Li, C.Y., and Zhang, C.H. et al. [
4] studied two different innovative R & D strategies, outsourcing R & D and independent R & D, while considering product invasion. Bo et al. [
5] compared the manufacturer-led green product development model and the retailer-led green product development model and then analyzed the optimal decision-making and member income under the two models. Pal et al. [
6] found that the dual channel supply chain is more efficient than the single channel supply chain for green products. Zheng et al. [
7] used the incomplete information dynamic game method to establish and solve the optimal decision of the construction-demolition waste resource utilization supply chain under the condition that recyclers share and do not share information. Some experts and scholars have conducted research from the perspective of supply chain cooperative research and development. Zhou et al. [
8] and Wang et al. [
9] discussed the supply chain equilibrium strategy under different R & D models in the context of whether the upstream and downstream of the green product supply chain cooperate in R & D. Some scholars have studied the supply chain coordination mechanism of green product research and development. Xu et al. [
10] studied which supply chain, wholesale price contract, and cost sharing contract can coordinate the supply chain under the supervision of quota and transaction; Asghari et al. [
11] studied the cost sharing, revenue sharing, and two-part tariff contracts in a single-stage green closed-loop supply chain, and which is the best coordination strategy from the economic and environmental dimensions. Other scholars have conducted research related to new product R & D in the supply chain through empirical methods. For example, Murali [
12] and Cao [
13] analyzed the relevant factors affecting the performance of new product development through empirical methods. Zhou [
14] investigated 225 companies in China’s manufacturing supply chain and found that embeddedness and knowledge sharing have significant intermediary effects on green innovation in the sustainable supply chain. Zheng et al. [
15] investigated 453 SMEs in China and found that green product innovation and green marketing promote each other and that product innovation can significantly improve market performance. These studies all assume that R & D is certain to be successful or has been successful. Few scholars consider the probability of R & D failure in the process of innovative R & D, but they do face the risk of failure in the process of product R & D. Therefore, based on the above literature research, this paper joins enterprises in the probability of green product R & D failure and establishes a model.
In the green supply chain literature, De et al. [
16] systematically reviewed the literature from the past decade and comprehensively introduced the practice of green supply chain management. Many studies focus on exploring the impact of different influencing factors on the pricing of the green supply chain. For example, Lin Zhibing [
17] discussed the impact of retailers’ corporate social responsibility on the pricing strategy of the supply chain. Furthermore, Ramírez [
18] analyzed whether consumers care about the efforts of enterprises in green supply chain through the role of protection value and the halo effect in product evaluation. Meng et al. [
19] proposed a green supply chain model with a dual-channel structure considering consumers’ green preferences and channel preferences and studied the collaborative pricing strategy of products under the dual preferences of government subsidies and consumers. Some scholars also studied the impact of risk preference of participants in green supply chain on supply chain decision-making. For example, Zhu et al. [
20], Raza et al. [
21], and Zhang et al. [
22] analyzed the optimal operation decision of the green supply chain when the supply chain members are risk averse; Lai et al. [
23] and Barman et al. [
24] analyzed the optimal decision of the green supply chain when the supply chain members are risk neutral. Some scholars have conducted empirical research on the green supply chain. For example, Gawusu et al. [
25] provides an overview of green supply chain management (GSCM) in the context of renewable energy sources. Lerman et al. [
26] analyzes the data of 473 manufacturing enterprises and studies the different dimensions of intelligent GSCM and its contribution to green performance from the perspective of digital transformation and supply chain management. Roh et al. [
27] respectively, studied the impact of green supply chain management on green product marketing and green innovation. Most of the existing literature has considered the green degree, pricing and risk preference of green supply chain products. On the basis of the existing research, this paper also considers the risk of failure of green supply chain research and development and considers the success and failure of green research and development upgrading of existing products. In the two cases of success and failure, the corresponding production of two different products (the original product is produced in the case of failure and the green product is produced in the case of success), to explore the different impact of enterprise research and development costs and production costs on supply chain decision-making.
Finally, our study is also related to government subsidies in green supply chains. As a lever of market regulation, government intervention can often achieve better supply chain performance and social welfare, which is true for all walks of life. For example, Yu [
28] studied the utility of government subsidies in manufacturing and remanufacturing industries, Eisert et al. [
29] studied how government subsidies in the financial industry can better play their role, and Alizamir et al. [
30] studied the important role of government subsidies in agricultural production. Some scholars have studied the effect and influence of different government subsidy strategies in the green supply chain. For example, Cao et al. [
31] and Wen et al. [
32] established a supply chain decision-making model for the government to subsidize R & D costs, and production costs and product greenness when manufacturers are supply chain leaders; Chen et al. [
33] proposed a tripartite game model to explore the impact of government subsidies on sustainable innovation of the supply chain. Some scholars have also studied the role of government subsidies from an empirical perspective. For example, Wang et al. [
34] explored the impact of government subsidies on the innovation of Chinese new energy vehicle enterprises through the analysis of the data set of Chinese new energy vehicle enterprises listed on A-shares in 2010–2019. However, few examples in the literature analyze the role of government subsidies from the perspective of maximizing social welfare. Therefore, by comparing the same subsidy expenditure, which of the two different subsidy forms can achieve the maximization of social welfare, this paper explores the optimal way of government subsidies.
Therefore, this paper has two innovations. Firstly, the probability of R & D failure in the process of innovative R & D is introduced and modeled. Secondly, this paper discusses which subsidy model is optimal on the basis of maximizing social welfare. The questions to be studied in this paper are as follows: (1) considering that enterprises have a certain probability of failure in product R & D and upgrading, can government subsidies certainly improve social welfare? (2) What kind of subsidy can the government use to provide the best social welfare?
The rest of the paper is organized as follows. In the
Section 3, the basic model assumptions are discussed, and two different subsidy models for manufacturers, namely, R & D cost subsidy and production cost subsidy, are provided. In the
Section 4, the model is analyzed numerically. Finally, the
Section 5 summarizes the relevant conclusions, management implications, and future research directions.
3. Model
We consider a two-stage supply chain game with a manufacturer that develops and upgrades green products and a retailer that sells green products. All members in the supply chain are risk neutral and rational, and always make reasonable decisions. All parties in the supply chain are symmetrical in information and have the same and complete information. The manufacturers want to achieve the corresponding green product standards through R & D and the upgrading of existing products, such as installing automobile exhaust purifiers on existing vehicles to reduce the emission of carbon monoxide and other toxic gases. In many cases, enterprises must bet on green technologies that have not been successfully developed. Before using these green technologies, they need to invest a lot of energy and money in technology research and development. However, despite these early efforts, the success of green technology research and development cannot always be guaranteed.
The behavior of manufacturers in green product R & D and upgrading has a probability of failure. In this process, the government seeks to stimulate the supply chain to carry out higher-level product R & D through subsidy policies and achieve the maximum social welfare. Therefore, this paper first takes the green product R & D and upgrading of the supply chain without government subsidies as the benchmark research object and establishes models under centralized decision-making and decentralized decision-making, respectively. Then, we build models under different government subsidy modes. Finally, we discuss which kind of government subsidy is the best choice of the government through the comparative analysis of optimal decision-making and profit. The model symbols in this paper are shown in
Table 1 below.
We assume that manufacturers develop green products, but they have a
probability of failure. If it fails, the manufacturer continues to produce the existing products, and the market demand is
. If it succeeds, the manufacturers and retailers produce and sell new green products. The market demand is
, where
represents the expansion level of the green product market. In other words, manufacturers do not always succeed in developing green products. The manufacturer can improve the probability of success by exerting an expensive effect that no other party can observe. Without the loss of generality, we scale the probability of success to 0. In order to increase the probability of success from 0 to
, where
, the manufacturer needs to exert effort that is associated with R & D cost
with
[
35]. For example, in the R & D process of new energy vehicles, these figures are the R & D investment in battery technology and the capital construction cost of setting up charging facilities throughout the country. The manufacturer’s cost coefficient K reflects the manufacturer’s R & D efficiency. Compared with manufacturers with higher K, manufacturers with lower K can achieve the same success probability at lower cost.
To encourage enterprises to develop and upgrade green products, the government has formulated different subsidy policies. We establish the following subsidy model to explore which subsidy method can obtain higher social welfare under the same subsidy expenditure:
- (1)
If the government subsidizes the R & D cost of green products of manufacturers. Referring to the research performed by Sheng G.H. et al. [
36], we assume that the government subsidy coefficient is
and the government subsidy expenditure is
.
- (2)
If the government subsidizes the production cost of green products. Referring to the research performed by Zhang Y.L. et al. [
37], we assume that the subsidy per unit of green products is
. In other words, if the manufacturer fails to develop green products, the government will not provide subsidies, and only after the manufacturer succeeds in research and development will it receive subsidies. The government subsidy expenditure is
.
The government is the upper-level policy maker, the manufacturer is the leader of the supply chain, and the retailer is the follower. The decision-making order of the supply chain is as follows:
- (3)
The manufacturer decides to develop and upgrade the existing products. The effort level is and the probability of failure is . If it fails, the original product will continue to be sold and the market demand will remain the same as . If succeeds, the market demand will be increased to .
- (4)
The manufacturer decides the wholesale price. If the manufacturer succeeds in upgrading its green products, the wholesale price is ; if the upgrade fails, the wholesale price is .
- (5)
The retailer finally decides the retail price. If the manufacturer succeeds in upgrading green products, the retail price is ; if the upgrade fails, the retail price is .
In the following section, we establish a benchmark model without government subsidies first.
3.1. Basic Model without Subsidy
3.1.1. Centralized Decision-Making
The manufacturer that upgrades and develops green products is the leader of the supply chain game and the retailer is the follower of the game. In the first stage, the manufacturer chooses the R & D effort level
and then carries out the R & D of green products. If the manufacturer succeeds in R & D, the supply chain produces and sells green products; if the manufacturer fails in R & D, the supply chain will produce and sell the original products. At this stage, the manufacturer decides the wholesale price
first and then the retailer decides the retail price
. At this time, the profit function of the supply chain is:
According to the reverse-order solution, in the second stage, if the manufacturer successfully develops products, the profit function of the supply chain is:. Find the first partial derivative of for and make it equal to 0; that is, let , and obtain .
If the manufacturer fails to develop green products, the profit function of the supply chain is: . Find the first partial derivative of for and make it equal to 0; that is, let , and obtain .
Substitute and into the profit function of the supply chain, find the first-order partial derivative of for , and make it equal to 0; that is, let , and obtain , and because , we can obtain Lemma 1 as follows:
Lemma 1: Under the centralized decision-making without government subsidies, the optimal decision-making of the supply chain is:
,
. Because the profit of the supply chain is complex, the specific formula is provided in
Appendix A.
3.1.2. Decentralized Decision-Making
Under the decentralized decision, the expected profit of the manufacturer is:
The expected profit of the retailer is:
According to the reverse-order solution, in the second stage, if the manufacturer successfully develops products, the profit function of the retailer is: Find the first partial derivative of for and make it equal to 0; that is, let and obtain . At this time, the profit of the manufacturer is: . Substitute into the profit function of the manufacturer, find the first-order partial derivative of for , and make it equal to 0; that is, let , and obtain .
If the manufacturer fails to develop green products, the profit function of the retailer is: . Find the first partial derivative of for and make it equal to 0; that is, let , and obtain . At this time, the profit of the manufacturer is: . Substitute into the profit function of the manufacturer, find the first-order partial derivative of for , and make it equal to 0; that is, let , and obtain .
Finally, substitute , ,, and into the profit function of the manufacturer, find the first-order partial derivative of for , and make it equal to 0; that is, let , and obtain , and because , we can obtain Lemma 2 as follows:
Lemma 2: Under the decentralized decision-making process without government subsidies, the optimal decision-making of the supply chain is:
,
,
,
.
Because the optimal profit function is complex, it is provided in
Appendix B.
Proposition 1: Comparing the optimal decision under the centralized decision and decentralized decision in the benchmark model, we can obtain 0 .
We can see from Proposition 1 that, under decentralized decision-making, the manufacturer’s optimal R & D and upgrading efforts and supply chain profits will be reduced due to the lack of supply chain coordination.
Next, we introduce different government subsidy models to explore whether government subsidies can alleviate the double marginal effect of the supply chain and how the optimal decision-making, supply chain profits, and social welfare of the supply chain change under different government subsidies.
3.2. Case 1: The Government Subsidizes R & D Costs
Assuming that the government subsidizes the R & D costs of manufacturers, the government, as the highest level of decision-making, first determines that the subsidy coefficient is
and the government subsidy expenditure is
. Here, we focus on the impact of the R & D cost coefficient on supply chain decision-making. For the convenience of observation, it is assumed that
is an exogenous variable. Then, in the first stage, the manufacturer selects the level of R & D effort and then carries out the R & D of green products. If the manufacturer succeeds in R & D, the supply chain produces and sells green products. If the manufacturer fails in R & D, the supply chain produces and sells original products. At this stage, the manufacturer first determines the wholesale price
, and then the retailer determines the retail price
. Therefore, the expected profit of the manufacturer is:
The expected profit of the retailer is:
The expected objective function of the government is:
where
B is the biggest constraint of government financial input. Similar to the calculation of Lemma 2, the optimal decision of the supply chain after government subsidies in case 1 can be obtained as follows:
,,,.
According to the maximization of social welfare, the optimal government subsidy coefficient is .
Because the optimal profit function is complex, it is provided in
Appendix C.
Proposition 2: In the case that the government subsidizes the R & D costs of manufacturers, the level of R & D efforts after subsidies is better than that without subsidies. In other words, government subsidies can encourage manufacturers to carry out R & D and the upgrading of green products at a higher level. The retail price after subsidies is the same as that in decentralized decision-making without subsidies and is higher than that in centralized decision-making. The wholesale price after subsidies is the same as the decentralized decision without subsidies.
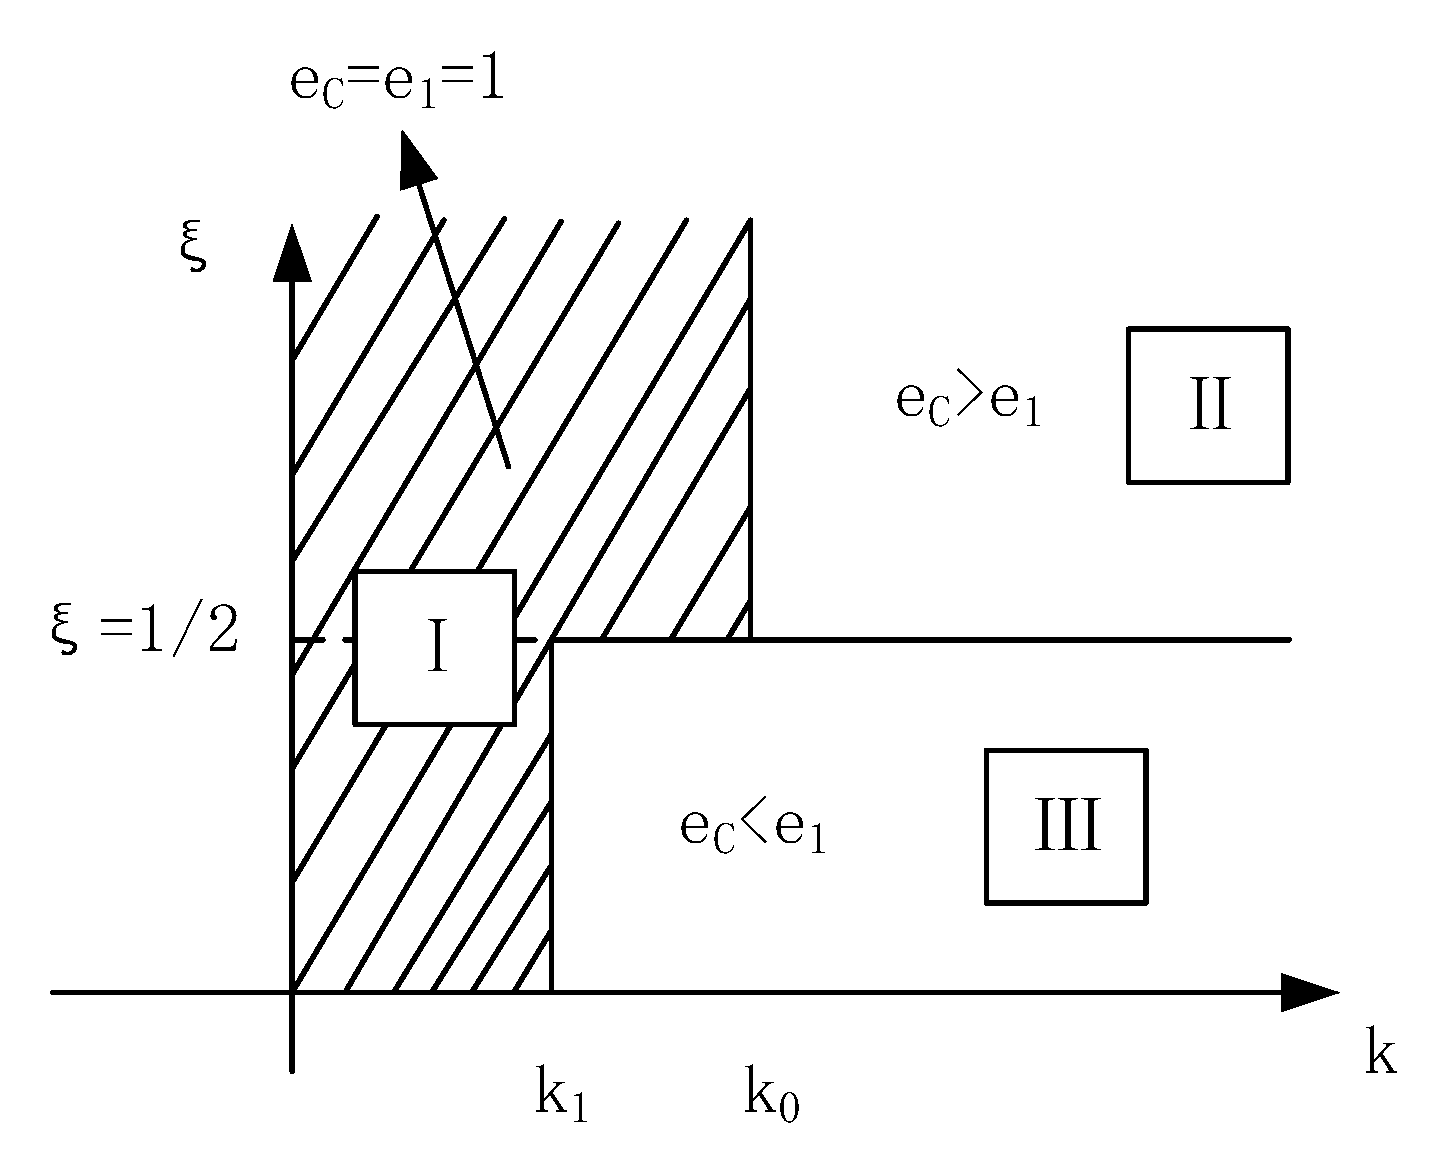
The comparison between the benchmark centralized decision and the optimal effort level after subsidies is shown in the
Figure 1.
The shaded area I in the figure represents . Area II on the upper right in the figure shows that the optimal R & D effort under the centralized decision is greater than that of case 1. In region II, compared to the benchmark model, government subsidies can improve the R & D efforts of manufacturers under decentralized decision-making, but cannot reach the level of benchmark centralized decision-making. The lower-right region III in the figure shows that the optimal R & D effort under the centralized decision is less than the optimal R & D effort of case 1. In region III, compared with the benchmark model, the government subsidies can reach the optimal effort level of the benchmark decision.
Proposition 3: , the decision-making of wholesale price and retail price has nothing to do with R & D cost coefficient and government subsidy coefficient.
From Proposition 3, we know that, with the increase in manufacturers’ R & D cost coefficient, manufacturers’ efforts in R & D and upgrading green products are decreasing. This is because as the cost coefficient of R & D and upgrading increases, the more money manufacturers invest in R & D and upgrading and the greater the cost after failure, which will inhibit manufacturers’ motivation for R & D and upgrading. Therefore, manufacturers’ efforts to develop and upgrade green products will be reduced. With the increase in the government subsidy coefficient, the government subsidy will make up for the R & D costs of manufacturers. Even if the manufacturer fails in R & D, the sunk cost of the manufacturer is lower than that without subsidies. Therefore, manufacturers’ efforts in R & D and upgrading of green products are higher than those without subsidies. With the increase in the government subsidy coefficient, it will also stimulate manufacturers to strengthen their motivation for green product research and development.
3.3. Case 2: The Government Subsidizes the Production Cost of Green Products
We suppose that the government subsidizes the unit production cost of green products after successful R & D. If the manufacturer fails in R & D, there is no subsidy. For each unit of green product subsidy , the government expects the subsidy expenditure to be . Here, we focus on the impact of the R & D cost coefficient on supply chain decision-making. For convenience of observation, is assumed to be an exogenous variable.
The expected profit of the manufacturer is:
The expected profit of the retailer is:
The expected objective function of the government is:
According to the reverse-order solution method, the optimal decision of the supply chain in this case is obtained as follows:
,,,.
Because the optimal profit function is complex, it is provided in
Appendix D.
Proposition 4: The comparison between the centralized decision-making of the benchmark model and the optimal effort level after subsidies is shown in the following
Figure 2:
The shaded area I in the figure represents . Area II on the upper right in the figure shows that the optimal R & D effort under the centralized decision is greater than that of case 2. In region II, compared with the benchmark model, government subsidies can improve the R & D efforts of manufacturers under decentralized decision-making, but cannot reach the level of benchmark centralized decision-making. The lower-right region III in the figure shows that the optimal R & D effort under the centralized decision is less than the optimal R & D effort of case 2. In region III, compared with the benchmark model, the effort level after government subsidies can reach the optimal effort level of the benchmark decision.
We compare the optimal wholesale price and the optimal retail price, as shown in the following
Table 2:
From the supply chain optimal decision in the above table, it can be seen that, in case 1, the government subsidy and the R & D cost coefficient will not affect the wholesale price and retail price decisions, which is the same as in the benchmark decentralized decision case. This may be because, in case 1, the government will provide subsidies regardless of whether the manufacturer succeeds in R & D. The subsidy is only used for the R & D cost of the manufacturer, and the decision of the wholesale price and retail price is made in the second stage. At this time, it is known whether the manufacturer has succeeded in R & D, so it has nothing to do with the subsidy coefficient.
Case 2 offers two situations to discuss. When the manufacturer fails in R & D, the decision of the wholesale price and retail price has nothing to do with the R & D cost coefficient and government subsidy coefficient. When the manufacturer succeeds in R & D, the decision-making of wholesale price and retail price has nothing to do with the R & D cost coefficient but is related to the government subsidy coefficient. The government only subsidizes the production cost of green products after the manufacturer’s R & D is successful. There is no government subsidy after R & D failure, so the wholesale price and retail price are the same as in the benchmark case.
Moreover, the retail price and wholesale price of green products after successful R & D are negatively correlated with the government subsidy coefficient, which also conforms to our cognition. When the government subsidizes the production cost of green products with the increase in the government subsidy coefficient, the production cost per unit of green products continues to decrease, and the wholesale price acceptable to manufacturers also decreases, thus the retail price acceptable to retailers also decreases. However, due to the complexity of the manufacturer’s R & D effort formula, it is impossible to see directly the impact of the R & D cost coefficient and the government subsidy coefficient, so it is analyzed in detail in the chapter of numerical examples.
3.4. Comparative Analysis of Subsidy Effect
From the conclusions drawn in the previous chapters, no matter what government subsidy strategy is adopted, the level of green product R & D efforts and supply chain profits of manufacturers will increase after government subsidies. In order to analyze the effects of the two subsidies, the government expenditure under the two government subsidies are adjusted to be equal, and the relationship between and is obtained, which is then brought into their respective optimal decisions and profits for comparative analysis. That is to say, analysis of which subsidies can obtain higher benefits under the same government subsidy expenditure is valuable in this context.
In case 1, the expenditure of government subsidies is:
. In case 2, the expenditure of government subsidies is:
. We assume that the government first provides a fixed government subsidy expenditure
B. We know that
satisfy a certain quantitative relationship. Let
, and obtain
. The expression of
is complex, so it is provided in
Appendix E. Then, let
and find
. Finally,
is substituted into the optimal decision and profit of case 1. Because the formula obtained is relatively complex, this paper will analyze it in detail in the numerical examples in the next section.
4. Numerical Analysis
In order to illustrate the effectiveness of the model and verify the correctness of the conclusions and propositions, we conduct numerical simulation to analyze the impact of two different government subsidy strategies on the green supply chain through numerical examples. Next, we discuss the optimal decision and profit when the production cost of the green product after successful R & D is different from the production cost of the existing product.
4.1. The Case of
When the production of green products has no cost-comparative advantage,
. For example, the addition of automobile exhaust catalytic converters or devices to improve gasoline efficiency in order to reduce pollution-generated additional costs in the manufacturing process, because additional devices need to be installed or more expensive materials and parts need to be used. According to the No. 27 Announcement of the Ministry of Industry and Information Technology in 2014, China has implemented the national four emission standards for diesel vehicles since 1 January 2014. Commercial vehicles with emissions lower than those of the national four model will no longer be produced and sold, while the price of the national four model with a similar horsepower is about 60% higher than that of the national three model; the main reason for the price increase is the high cost of the exhaust filter device. From 2012 to 2014, the number of cars that have reached the national four or higher standards nearly doubled. We allocate relevant parameters in the supply chain according to the case. That is to say, when the production cost of green products is greater than the production cost of existing products (
), the relevant parameters in the supply chain are assigned a value of:
. The optimal decisions and profits of the government under different government expenditures are calculated, respectively, and the results are shown in the
Figure 3,
Figure 4 and
Figure 5 below.
We see from
Figure 3 that, with the increase in the R & D cost coefficient, the R & D effort level of manufacturers shows a downward trend. This is because when the R & D cost coefficient increases, the R & D cost of the manufacturer increases, thereby inhibiting the R & D effort level of the manufacturer. At the same time, the level of R & D efforts of manufacturers increases with the increase in the government subsidy coefficient. This is because the government subsidies are enough to cover part of the costs of manufacturers. Both case 1’s subsidy to the manufacturer’s R & D cost and case 2’s subsidy to the production cost of green products after successful R & D are equivalent to making up for the risks brought by the manufacturer’s R & D failure. Therefore, with the increase in the government subsidy coefficient, manufacturers’ efforts in green product research and development also increase.
As shown in
Figure 4, the expected profits of manufacturers will increase with the increase in government subsidies, which also conforms to our cognition. When the R & D cost of the manufacturer is small, that is, k = 300, it needs to be discussed in two cases. When the government subsidy expenditure is small, the subsidy form of case 1 enables the manufacturer to obtain higher profits; when the subsidy expenditure is large, the subsidy form of case 2 enables the manufacturer to obtain higher profits. When the R & D cost of the manufacturer is large, that is, k = 500, the subsidy form of case 2 makes the manufacturer obtain higher profits. This may be because the subsidy of case 2 will encourage retailers to order more green products, so that when the R & D cost of manufacturers is high, the manufacturers can obtain higher profits in case 2.
As shown in
Figure 5, when the manufacturer’s R & D cost coefficient is high, the subsidy form of case 2 obtains higher social welfare. When the manufacturer’s R & D cost coefficient is low, there are two cases according to the different government subsidy expenditure: when the government subsidy expenditure is low, the subsidy form of case 2 obtains higher social welfare; when the government subsidy expenditure is high, the subsidy form of case 1 can obtain higher social welfare. In other words, when the government budget is low, the production cost of green products should be subsidized. When the government budget is high, the R & D cost of the manufacturer should be judged. When the R & D cost of the manufacturer is high, the subsidy form of case 2 should be adopted. When the R & D cost of the manufacturer is low, the subsidy form of case 1 should be adopted.
4.2. The Case of
When the production of green products has no cost-comparative advantage,
. For example, Nike cooperates with Flex, a world-class global manufacturer, to participate in footwear innovation. By using the new production system introduced by Flex, the labor cost can be reduced by 50% and the material cost can be reduced by 20%. Flex uses a special knitting machine to produce sports shoes for Nike, which can reduce labor input and material use and reduce the production cost of products. On 20 October 2022, in the third quarter financial report of fiscal year 2022 released by Tesla, an American electric vehicle manufacturer, it was mentioned that the size of the new generation Model 3 and Model Y would be smaller, the cost would be 50% of the current models, and the market demand would be at least doubled. We model according to the estimated cost savings and market demand of Tesla’s new product development. The relevant parameters in the supply chain are assigned a value of:
. The optimal decision-making and profit when the government subsidy coefficients
and
are obtained, respectively, and the results are shown in the
Figure 6,
Figure 7 and
Figure 8 below.
As shown in
Figure 3 and
Figure 6, when the production of green products has no cost-comparative advantage, the manufacturer’s effort level under a small amount of government subsidies in case 1 is lower than that under the decentralized decision-making without subsidies. Only when the government subsidy is high are the R & D efforts of manufacturers higher than those under the benchmark decentralized decision. Because the production cost of green products after successful R & D is large and the government subsidy is small, even if the manufacturer succeeds in R & D, the high green production cost makes the manufacturer’s efforts in green product R & D lower. According to
Figure 6, when the production of green products has a cost-comparative advantage, if the production cost of green products after successful R & D is lower than that of existing products, no matter how small the government subsidy is, the R & D efforts of manufacturers is higher than those under the benchmark decentralized decision, which will stimulate manufacturers to carry out a higher level of green product R & D.
As shown in
Figure 7, different from the results shown in
Figure 4, when the production of green products has a cost-comparative advantage, no matter how much government subsidies, the subsidy form of case 2 can bring higher profits to manufacturers. The production cost of green products successfully developed by manufacturers is lower than that of existing products and the market demand of green products is higher than that of existing products. Therefore, the subsidies for the production cost of green products can enable manufacturers to obtain better profits. In contrast to the results shown in
Figure 5,
Figure 8 shows that, regardless of the R & D cost of the manufacturer, the subsidy form of case 2 can obtain higher social welfare.
Therefore, we can draw the following conclusions. From the perspective of manufacturers, when there is no cost-comparative advantage in the production of green products, we must discuss case 1 and case 2 distinctively. In case 2, if the subsidy level provided by the government is low, the manufacturer’s profit and R & D effort level are lower than when there is no subsidy. That is to say, if the production cost of green products is high, the manufacturer is motivated to carry out green product R & D and upgrade only when the government subsidy level is high. In case 1, a small amount of government subsidies can also improve the profits and R & D efforts of manufacturers. When the production of green products has a cost-comparative advantage, as long as the government subsidizes, it improves the level of R & D efforts and profits of manufacturers.
From the perspective of the government, when the production of green products has no cost-comparative advantage, the production cost of green products should be subsidized when the government budget is low, and the R & D cost of manufacturers should be judged when the government budget is high. When the R & D cost of the manufacturer is high, the production cost of green products should be subsidized; when the R & D cost of the manufacturer is low, the R & D cost of green products should be subsidized. When the production of green products has a cost-comparative advantage, no matter how much the manufacturer’s R & D cost is, the R & D cost should not be subsidized, but the production cost of green products should be subsidized, so as to obtain the best social welfare.
5. Conclusions
This paper studies the optimal decision-making and profit of the supply chain of a manufacturer who develops and upgrades green products, with the probability of R & D failure, under different subsidy policies of the government. Through comparative analysis, it can be concluded which government subsidy method can obtain higher benefits under different cases.
It is found that government subsidies can improve the efforts of manufacturers in green product R & D and upgrading and subsidies after successful R & D of manufacturers can more effectively stimulate the efforts of manufacturers in green product R & D. When the government subsidizes the R & D cost of manufacturers, the decision-making of the wholesale price and retail price has nothing to do with the government subsidy coefficient. When the government subsidizes the manufacturer’s cost of producing green products, only the wholesale price and retail price decisions after successful R & D are related to the government’s subsidy coefficient and there is a negative correlation trend.
From the perspective of manufacturers, if the production cost of green products after successful R & D by manufacturers is high, manufacturers are motivated to carry out green product R & D only when the level of government subsidies is high. If the production cost of green products after successful R & D by manufacturers is low, as long as the government provides subsidies, the level of R & D efforts and profits of manufacturers is improved.
From the perspective of the government, we should judge whether green products have production cost advantages. When the production of green products has no cost-comparative advantage and when the government budget is low, the production cost of green products should be subsidized to encourage manufacturers to invest the most in R & D. When the government budget is high, the R & D cost of manufacturers should be judged. When the R & D cost of manufacturers is high, the production cost of green products should be subsidized to encourage retailers to order more green products. When the R & D cost of the manufacturer is low, the R & D cost of green products should be subsidized to encourage the manufacturer to invest the most in R & D. When the production of green products has a cost-comparative advantage, no matter how much the manufacturer’s R & D cost is, the R & D cost should not be subsidized, but the production cost of green products should be subsidized so as to obtain the best social welfare.
In order to verify the accuracy of the conclusion, let us look at several actual cases. In November 2020, the Ministry of Finance of China issued the Notice of the Ministry of Finance on Issuing the 2021 Energy Conservation and Emission Reduction Subsidy Budget (the first batch) in advance. In 2021, according to the corresponding proportion of different mileage of each new energy vehicle, a total of CNY 37,585.29 billion, equivalent to USD 5.15 billion, will be subsidized for new energy vehicles. As early as 2009, the United States invested USD 14 billion to support the research, development and production of key components of power batteries and plug-in hybrid vehicles and also set up a fund totaling USD 25 billion to support manufacturers to research, develop and produce energy-saving and new energy vehicles.
For the agricultural product planting industry with low R & D cost, almost all countries in the world have adopted the method of subsidy based on planting area, such as the subsidy for farmland rotation and fallow. In February 2022, the Agriculture and Rural Affairs Department of Heilongjiang Province issued the Notice of Heilongjiang Province on Applying for the Implementation of the 2022 New Cultivated Land Rotation Pilot Program, specifying that Heilongjiang Province plans to subsidize CNY 150 per mu(a unit of area in China) for the 15 million mu of cultivated land rotation pilot area. The United States began this subsidy in 1985 and the Farm Service Bureau evaluated and determined the land subsidy price. The above cases also verify that the conclusions of this paper are in line with reality.
This paper considers the subsidy optimization of supply chain without capital constraint. In fact, the upstream enterprises engaged in green product R & D may also have financial constraints, which could provide direction for further research.


