Review

Sustainable Water Resources Management Assessment Frameworks (SWRM-AF) for Arid and Semi-Arid Regions: A Systematic Review

by
Badir S. Alsaeed
1,2,*,
Dexter V. L. Hunt
1 and
Soroosh Sharifi
1
1
Department of Civil Engineering, School of Engineering, University of Birmingham, Edgbaston, Birmingham B15 2TT, UK
2
Department of Civil Engineering, College of Engineering, Qassim University, Buraydah 52571, Saudi Arabia
*
Author to whom correspondence should be addressed.
Sustainability 2022, 14(22), 15293; https://doi.org/10.3390/su142215293
Submission received: 29 June 2022 / Revised: 10 November 2022 / Accepted: 11 November 2022 / Published: 17 November 2022
(This article belongs to the Topic Water Management in the Era of Climatic Change)

Abstract

:
Sustainable water resources management assessment frameworks (SWRM-AF) with associated indicators and benchmarks have appeared widely during the last decades to improve or maintain water resources. Examination or evaluation of their appropriateness and refinement for particular arid and semi-arid regions is a relatively unexplored area. To fill this gap in knowledge, a systematic review of relevant 21st century studies identified within two extensive databases, Scopus and Engineering Village, and in grey literature, is undertaken in this study. Therein, 17 studies are identified and thoroughly explored to identify their focus, application, and framework construction. The results of the comparative analysis among these frameworks show that the average numbers of components and indicators are 4.5 and 17.6, respectively. Meanwhile, categorical rescaling (47.1%), equal weighting (47.1%), arithmetic technique (82.35%), local scale (52.8%), and interval of the final index value of [0–100] (41.2%) are the most commonly used normalization methods and elements. The paper concludes that none of the existing tools reviewed is 100% applicable for arid and semi-arid regions, and therefore the case is made for developing a new bespoke SWRM-AF. The outcomes of this paper provide some useful insights into what should be included therein (e.g., stakeholder engagement and specific indicators to fit the context).

1. Introduction

As a result of significant agricultural and industrial advancements in parallel with the peace and security afforded after the second world war, the global population has almost tripled from 2.7 billion to 7.5 billion in just seventy years [1]. This increase, accompanied by the changes in lifestyle (including eating habits) seen in many regions, is now placing significant stress on various natural resources (including but not limited to water) vital for human requirements. These requirements are categorized into basic, psychological, and self-fulfilment needs, based on Maslow’s hierarchy of needs [2,3]. This research focuses on the water requirement, which might be considered the most important yet basic requirement for humans to survive. Nevertheless, the demand for this resource has never been greater than in the last few decades [4,5,6], especially in developing countries, where exceptional population growth, increased urbanization [7], and expansion in industrial and agricultural sectors have resulted in extreme water demand and water stress. The previous conditions could highly exacerbate the situation in some arid and semi-arid regions (ASAR) where limited natural water resources (WR) are available. Therefore, special attention and preparation should be given to this issue to ensure the longevity of these crucial resources, especially in regions with difficult climatic and weather-related issues, such as ASAR.
The term arid is typically used to describe the climate of regions that suffer from very high temperature and receive less than 100 mm of rainfall per year [8]. In contrast, the term semi-arid describes regions where the annual rainfall is between 250 and 500 mm/year [9]. Both types of regions feature evapotranspiration rates that are higher than the precipitation rate, with the potential for frequent severe droughts and infrequent but considerable floods [10]. Moreover, these regions are globally characterized as the most water-stressed areas, where the groundwater (GW), stored in aquifers, is the primary water source [11]. However, since some ASAR are characterized by low rainfall rates, and rain is essential to the speed and recharge time of aquifers, the use of GW is not very sustainable [12,13]. Furthermore, high dependence on GW with intensive pumping makes it prone to pollution, such as salinity intrusion [14,15]. Conversely, in coastal regions, water supply from desalination plants with many of the current technologies is unsustainable, given the high energy, environmental impact, and economic cost [16,17,18]. Therefore, water resources management (WRM) in such regions requires careful planning and assessment of sustainability, and thus requires appropriate tools.
Furthermore, global warming phenomena and the impacts of climate change are further pressurizing WR over the globe [5,19,20,21,22], not least in ASAR, requiring new solutions and approaches on both the demand and supply sides. Thus, the scientific community has conducted several meetings and studies during the last decades to address the consequences of such a trend [23,24,25,26,27]. One of the early attempts to deal with this issue was in 1992 during the International Conference on Water and the Environment [28], which ended with the declaration of the four Dublin principles, the third one stating clearly that any “development and management” in regard to water “should be based on a participatory approach … at all levels”. Hence, this principle informed one of the main strategies to enhance WRM and ensure the continuity of WR.
Assessing and managing WR in ASAR in a way that usefully informs decision-making is fraught with difficulty, especially with what appears to be a lack of region-specific frameworks, a lack of data collection and in the context of the natural and socio-economic (i.e., Sustainability) settings in which this needs to happen. A research gap exists in terms of identifying what general sustainable water resources management (SWRM) assessment frameworks exist, and whether they are applicable to ASAR. This is a key underlying philosophy behind this paper, the findings of which will be used to identify whether (a) existing frameworks are fit-for-purpose in ASAR; or (b) a bespoke framework should be derived. Moreover, if the latter outcome is found to be true, and in order to avoid reinventing the wheel, the systematic review and analysis of existing frameworks can be used to inform its derivation.

1.1. Sustainability and Sustainable Water Resources Management (SWRM)

The water cycle and its impact on related ecosystems represent a great example of a sustainable process that has existed for millions of years. However, current water demands and global climatic changes are impacting its ability to remain so [29,30].
The use of the terms “sustainability” and “sustainable development” has become ever more popular since Bruntland’s [31] definition: “to ensure that the current development meets the needs of current generation’s without negatively impacting the capability of future generations to meet their needs”. This has never been more important than for SWRM in ASAR, where GW is becoming depleted, negatively impacting the ability of future generations to draw down water and meet their needs—which due to growing populations, will be greater than today.
Another definition or principle for sustainability was introduced by Elkington [32] as: “sustainability aims to ensure that the range of economic, social, and environmental options would stay open and not limited for the future generations because they were not hindered by the current human actions.” This has paved the way for the introduction of 17 sustainable development goals (SDG), the sixth of which is to “ensure availability and sustainable management of water and sanitation for all” [33]. This study is significant and motivated by such a global goal, and has never been more relevant in ASAR.
Sustainability itself has been widely recognized to stand on three common pillars or dimensions: the environment, the economy, and the society [34,35,36,37,38]. In other words, to obtain a sustainable system, its environment should be protected, the economy should be viable, and social equity and acceptance should be considered as much as possible.
Meanwhile, the importance of achieving a balance (rather than a trade-off) between these dimensions of sustainability has been a catalyst for much discussion [39,40,41,42]. For example, selling water in plastic bottles is both profitable for companies (economic) and satisfies the needs of many people (Social). However, the impact of this business on the environment is harmful if the bottles are not recycled. Therefore, to enhance the sustainability of any system, all three pillars need to be in balance. Moreover, for ASAR, the points at which the pillars interact for SWRM need to be considered ever more readily.

1.2. Assessment Frameworks for Sustainable Water Resources Management

To improve the sustainability of any WRM system, it is crucial to have an appropriate amount of different related indicators (i.e., quantitative and qualitative), metrics, and benchmarks contained within an assessment framework or index in order to help decision-makers and concerned stakeholders determine the current level (or performance) of their SWRM and improve it accordingly, should it be underperforming [43,44]. (N.B. The terms framework or index are used interchangeably within the literature; however, in this paper, they are considered to be one and the same.) The advantage of forming an indicator-based framework is its ability to help evaluate and elucidate multi-dimensional factors or thoughts that cannot be measured directly [45] and cannot be understood by only one component or indicator [46].
Indeed, collaboration among different stakeholders in developing a WR index is (and should always be) significant to ensure the index is acceptable [45]. By developing and using a suitable framework, all interested parties can understand the main issues that threaten sustainability in their system, and work co-operatively toward mitigating them. These issues can be simplified within the framework to a single number representing the general sustainability level of the whole WRM system. In most cases, having a quantifiable number would have a more substantial effect on the ability of the public/decision-makers to understand and therefore act in a more helpful way [47].
Furthermore, it is both beneficial and necessary to build any indicator-based framework based on a wide array of indicators [41] that have been widely vetted and endorsed and that can guide the assessment and improvement of the sustainability credentials for WRM systems [48]. Moreover, from a policy-making and management perspective, considering both water availability and access indicators is likely to be more emphasized (and therefore carry a higher weighting) for frameworks adopted in developing and water-poor countries than those in developed and water-rich countries [49]. Similarly, this would apply in countries in ASAR where appropriate “bespoke” frameworks are needed to improve or reform their WRM systems.
On the other hand, this study aims to review research published in the last two decades related to assessment frameworks for SWRM, focusing on checking to what extent they can be applicable for ASAR. Key objectives in the form of questions for the research include:
  • Since the turn of the century, what indicator-based frameworks and/or indices have been used to assess the sustainability of WRM?
  • What similarities and differences exist amongst indicator-based sustainability assessment frameworks of WRM, such as the number of components (and indicators) and the scaling, aggregating, and weighting methods?
  • How effective are the current water resource indices or frameworks in assessing the sustainability of WRM in ASAR?
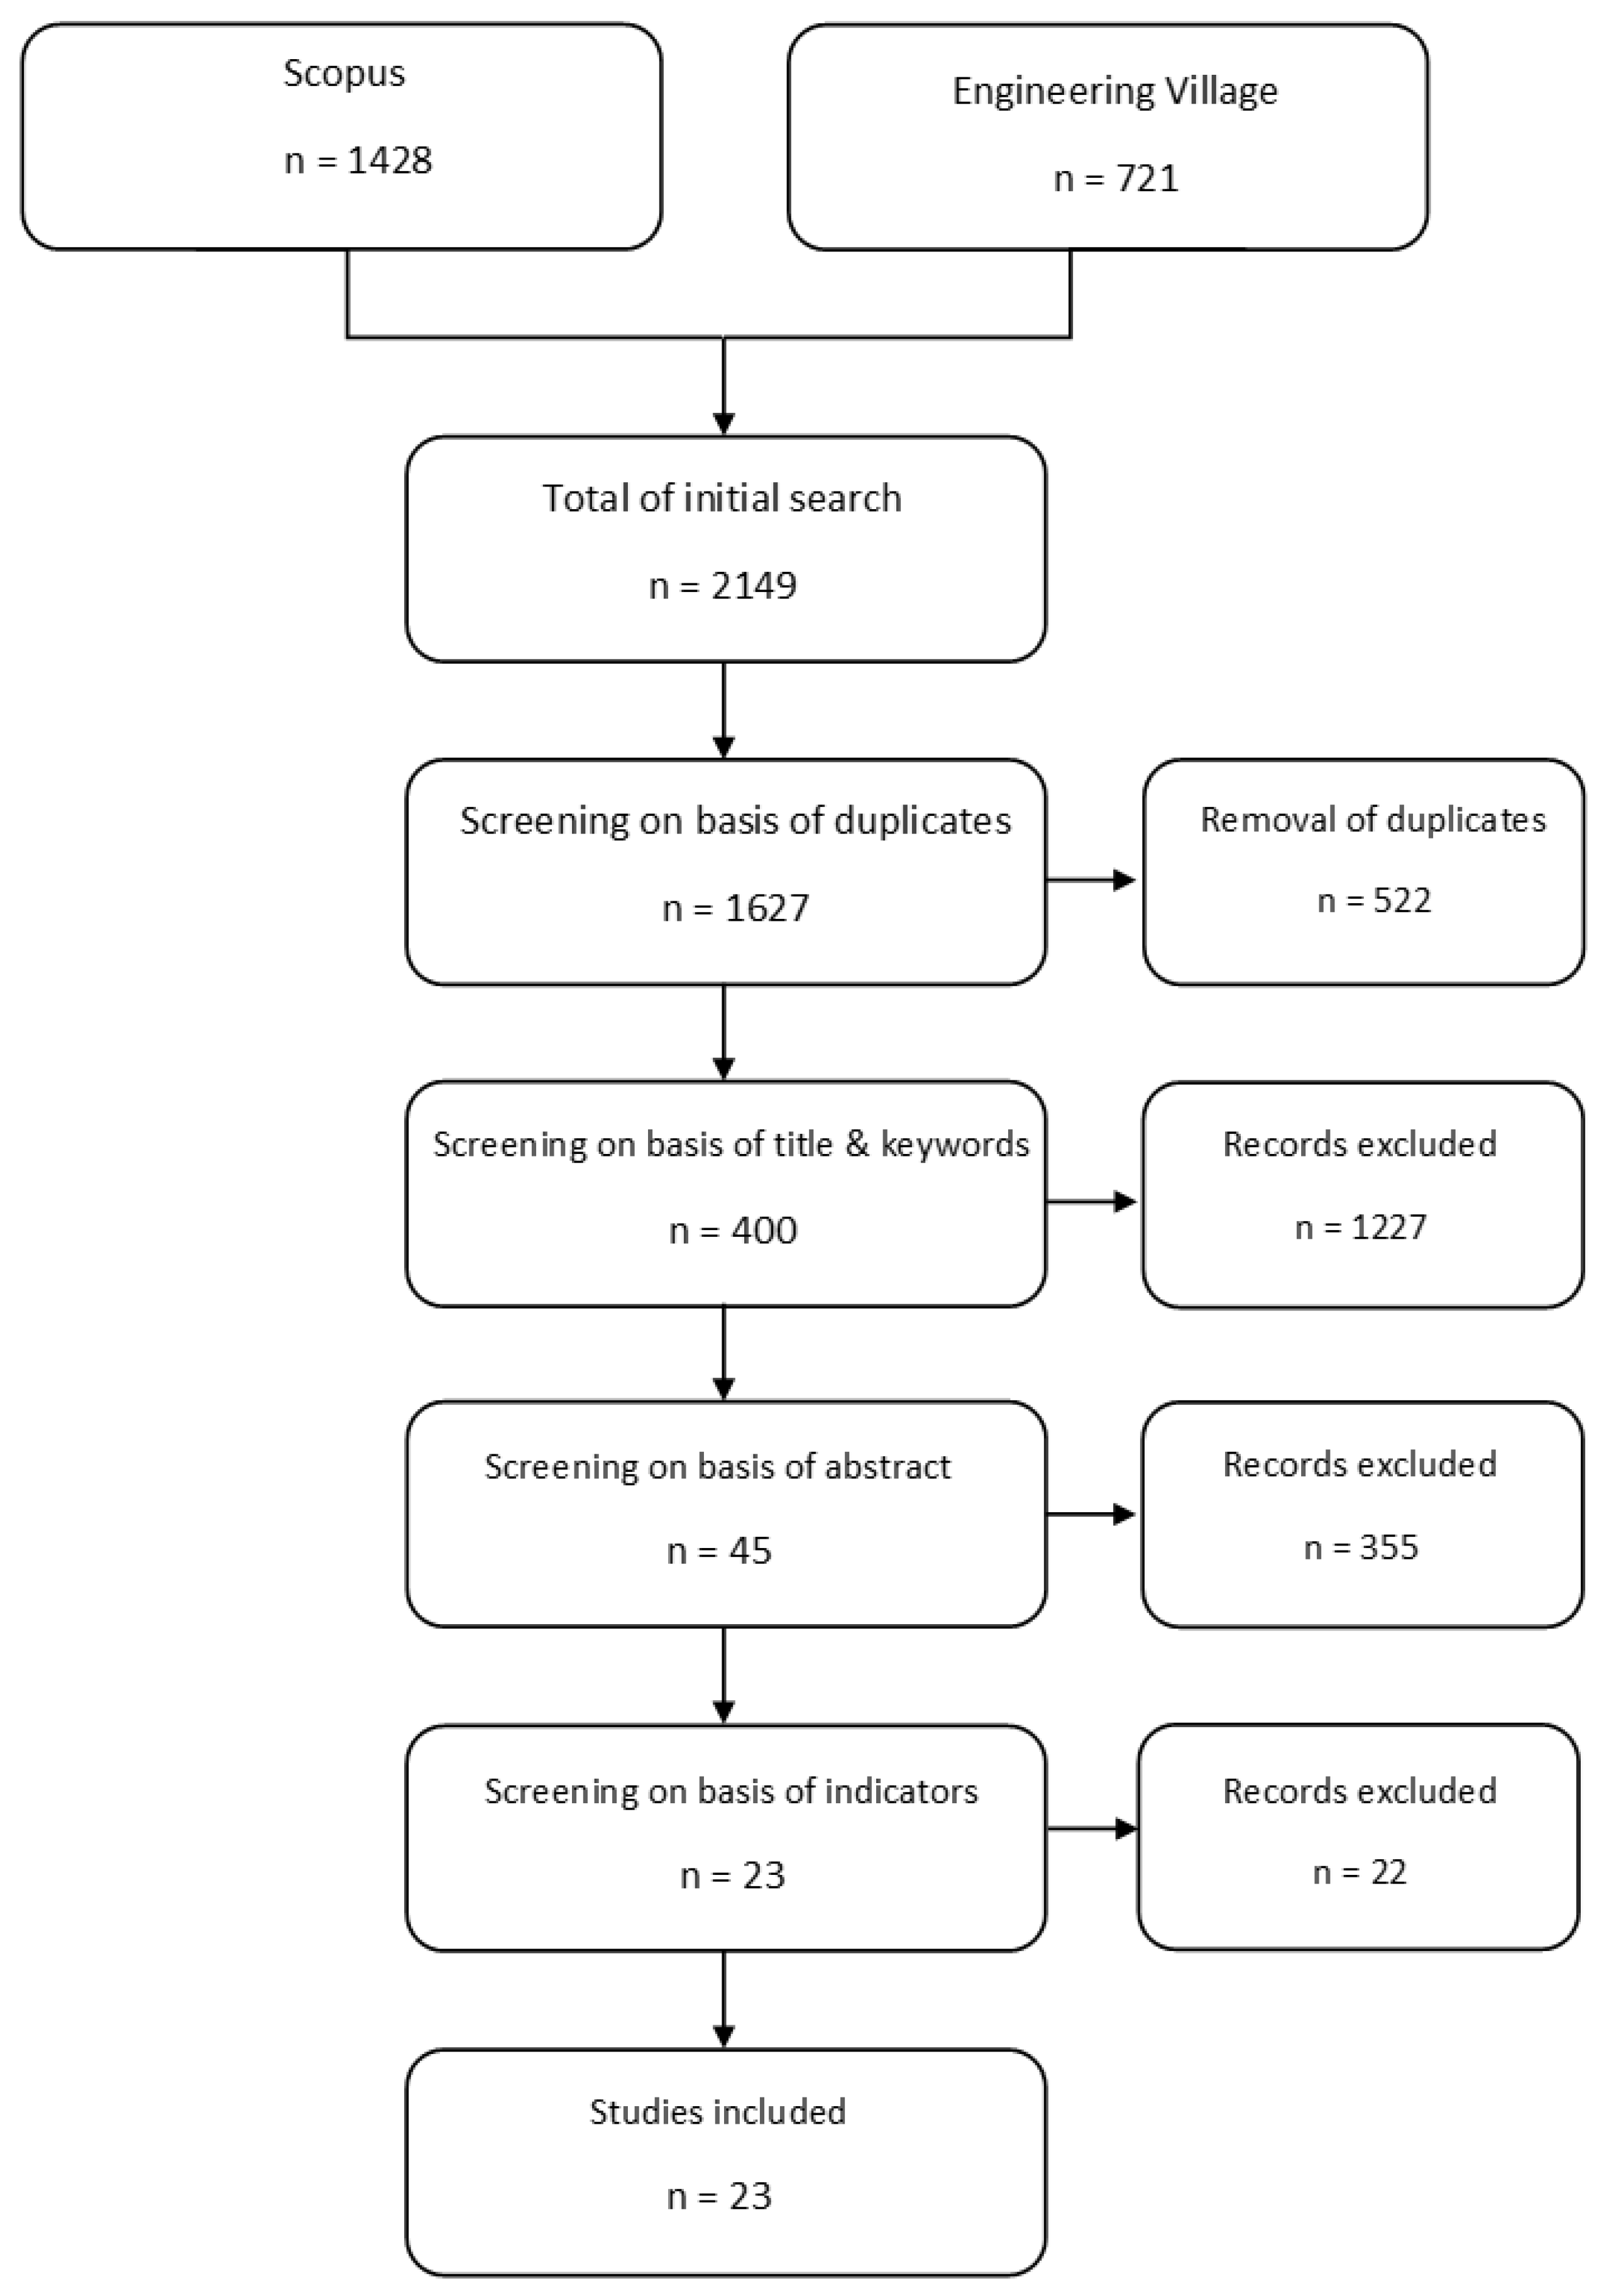
By answering these questions, it would be possible to ascertain whether a bespoke SWRM framework were needed within the context of ASAR.
The paper is divided into six sections. In Section 2, the methodology used to answer these questions is outlined. In Section 3, some general definitions of SWRM, along with criteria and related guidelines for making indicator-based frameworks are subsequently presented. In Section 4, the main elements of the indicator-based sustainability assessment framework of the WRM system are briefly illustrated. Section 5 provides the search results based on the criteria given in Section 2. These results include overviewing and analyzing the existing Sustainable Water Resources Management Assessment Framework(s) (SWRM-AF) developed since the turn of the century. A critique is provided that includes the advantages and disadvantages of each framework, followed by a brief comparative analysis. Section 6 discusses the results with a final evaluation of all frameworks included in this review to check their applicability for ASAR. Finally, conclusions are provided in Section 7, along with recommendations for future research.

2. Methodology

To answer the previous questions posed in Section 1.2, a systematic literature search using the two well-known databases Scopus and Engineering Village was conducted to check relevant studies. In the first stage, a group of pertinent keywords were identified and used to search databases using the title/abstract/keywords included in the papers. The first step required a filter, since the area of sustainability is extensive within the literature. Moreover, looking through a confined yet credible quantity for a literature review paper is crucial.
Therefore, the scope of this search was exclusive to peer-reviewed articles and peer-reviewed conference papers. Additionally, the search had two conditions for all included documents: (a) documents should have been produced in the period from 2000 to 2021 and (b) documents should be written in the English language only. This period was selected because several frameworks for assessing the WRM system were produced after 2000. Furthermore, this is consistent with the method applied by other authors, such as Topal et al. [50]. This method uses a four-step clustering algorithm (i.e., Scope, Target Group, Subject Domain, and Methods) to narrow the research area. This narrowing process would mean excluding, to some degree, any unrelated studies by using the OR operator within each category’s keywords and the AND operator within each cluster [50]. The idea of this process is straightforward, requiring all studies covered in this review to be included in the intersection area of all four clusters.

2.1. Keyword Selection

In the Scope cluster, many terms mainly related to sustainability and WRM were used to define the largest frame with which the search should start. These specific terms and their derivatives were “#water resources management”, “#water management”, “#water shortage”, “#water assessment”, “#SWRM”, “#sustainable assessment”, “#sustainable measurement”, “#water sustainable index”, “#sustainability principles”, “#sustainable development”.
The Target Group of this study concerned the primary sectors that received water or were affected by any decisions related to its supply and demand. The main terms used for the Target Group cluster were: “domestic water”, “municipal”, and “stakeholder”.
The Subject Domain keywords were specific for the required method and its main parts that could evaluate the combination of the Scope and the Target Group and the geographic areas that needed to be investigated. The terms used in this search for these purposes were “indicator”, “indicator-based”, “framework”, “criteria”, “index”, “component”, “arid”, and “semi-arid”. It is worth mentioning that this category (i.e., Subject Domain) was used twice in the exact search. The first one included all required fields (i.e., Subject/Title/Abstract in the Engineering Village database, and Title/Abstract/Keywords in the Scopus database). The second one was only in the title, that is, one of the keywords needed to be in the article’s title. This action was essential to reduce the enormous number of unrelated studies.
The fourth group, the methods of data collection or treatment based on the participatory approach, was assigned. The terms included in this cluster were “survey”, “interview”, “questionnaire”, and “participatory”.

2.2. Database Search

The search through the Scopus and Engineering Village databases was undertaken on the 14th of October 2021 and returned with 1428 and 1316 articles, respectively. However, the Engineering Village database was a combination of three databases: (1) Compendex, (2) GEOBASE, and (3) Inspec. For this reason, many of the 1316 articles were duplicated in the search output. Fortunately, the search engine had a feature to remove these duplications, and the number was subsequently reduced to 721 articles. This result, plus that from Scopus (i.e., 2149 articles) were merged in EndNote Library, which also has the advantage of automatically removing duplications, reducing the total number to 1627 articles. Among these papers, 174 were conference papers, while the remaining were peer-reviewed articles.
Before starting the manual search, inclusion and exclusion criteria needed to be assigned and followed generally. Under these criteria, any articles unrelated to the main scope (i.e., both WRM and sustainability), whether directly or indirectly, would be excluded right away. For example, many articles related mainly to the medical, education, and energy sectors were removed. In addition, if this criterion were applicable, another specific check was required to ensure that these studies had considered a framework or index by mentioning that clearly in either the title or the keywords. Consequently, both conditions were applied in the first screening stage by checking each title and all keywords of the 1627 papers. This stage resulted in a reduction in the number of articles to 400.
In the second round, abstracts were investigated concerning the target group and main elements of the subject domain (i.e., indicator, indicator-based, and component). The results dropped to 45. This round was supposed to be the last round, but after checking some articles among the 45, it appeared they lacked an applicable framework or index that included specific indicators. Therefore, a final round was added to skim-read each of the 45 papers and ensure that they contained these essential elements to be included in the full-text review. Consequently, 23 studies were selected to be included in the analysis. All these screening stages were summarized and illustrated below in Figure 1.
At the end of the systematic review, key methodological steps were applied to help meet underlying objectives, namely:
  • Identification of SWRM definitions, guidelines and criteria (Section 3);
  • Establishment of the main elements of indicator-based frameworks (Section 4);
  • Provision of an overview of existing sustainable water resources management assessment frameworks (SWRM-AF) (Section 5).

3. Sustainable Water Resources Management (SWRM): Definitions, Guidelines, and Criteria

3.1. Definitions

While the definition of sustainability was previously mentioned in Section 1.1, it is essential to clarify further definitions used within this paper—not least WRM. Firstly, WR can be defined as any shape or state of natural waters that exist on the planet, whether above (e.g., rainwater in clouds), on (e.g., oceans and rivers), or under the ground (e.g., GW), that has the potential to be used by humans [51]. Secondly, management can be defined simply as the way to manage something. In terms of WRM, these definitions pertain to the supply of and demand for water and all matters related to them.
Furthermore, it can be considered that the definition of WR includes both the natural freshwater and saltwater that usually react to or are affected by the processes of the hydrological cycle and other species’ activities. Humans are one of the species that can impact WR in their use of them, but what does it mean to make this process sustainable? Gleick et al. [52] defined sustainable water use as:
“the use of water that supports the ability of human society to endure and flourish into the indefinite future without undermining the integrity of the hydrological cycle or the ecological systems that depend on it.”
[52] (p. 24)
However, humans have the most significant impact on the environment in general and on WR in particular due to their activities [19,53,54]. These impacts on WR are expected to expand in the future and cause more uncertainty in terms of water availability, more extreme weather events of droughts and floods, and quicker evaporation of surface water resources [53]. Hence, it is important to prepare carefully for these risks before they happen or increase to improve the sustainable management of WR systems.
Accordingly, the three definitions for the three terms (i.e., sustainability, water resources, and management) can be combined to present a possible explanation for SWRM. The function of such a definition is to help stakeholders from different backgrounds understand the target in a simple way, which would assist in the communication process, thereby gaining their trust and cooperation.
Pertinently to this matter and its purpose, the term integrated water resources management (IWRM) is defined as:
“a process which promotes the coordinated development and management of water, land and related resources, in order to maximise the resultant economic and social welfare in an equitable manner without compromising the sustainability of vital ecosystems”.
[23] (p. 1)
Although the previous definition is widely known and broadly accepted by the scientific community, the understandable main aim is to maximize the benefits to the economy and society without harming the ecosystem or the environment. Meanwhile, it can be argued that the purpose of sustainability is slightly different, being more about obtaining the best result (i.e., optimizing) for all three aspects (i.e., economy, society, and environment) in as balanced a way as possible.
Therefore, the suggested definition for SWRM used in this paper is “to ensure that the current management of water resources meets the need of the present generation in a way that balances between social, economic, and environmental factors avoiding negatively impacting future generations’ capability to meet their water needs”, accepting that future needs are not always easy to identify and require a range of foresight methods to predict. This definition requires a breakdown into several objectives or components that constitute indicators and sub-indicators to measure the performance of SWRM.

3.2. Guidelines for the Development of the SWRM Framework

Sustainability frameworks and their indicators, in general, could (and should) have different interpretations based on the perspective, context, and local conditions they are used for. For example, frameworks assigned for business or construction per se would be different than those for WRM. Indeed, each sector should have specific guidelines and criteria for any suggested indicator that matched its context [44,55].
First of all, the consideration and linkage of the three dimensions of sustainability (i.e., environmental, economic, and social) [56], in addition to the technical side in the criteria overall, are crucial to handling the complexity and uncertainty of water-related issues [57]. Hence, a sustainable system would not only facilitate the management of the infrastructure of water utilities with the supply and demand sides, but would also assure integration and fairness among the previously mentioned three core areas. Thus, it is essential in the developing stage of an SWRM framework to check whether any suggested indicator belongs (or not) to one of these four categories (i.e., technical or physical, environmental, economic, and social) before considering it.
The second general guideline can be elicited from one of the Dublin principles [28] (i.e., the third), which emphasizes the importance of a participatory approach for any development for WR. Thus, the involvement of stakeholders in developing an SWRM-AF, or at least the process of indicator selection, is necessary.
Another guideline is that the number of indicators should be appropriate. In other words, they should not be too numerous, since this would complicate the process of application and interpretation [58,59] and challenge the capacity of the financial and human resources in collection and analysis. Conversely, too small a number could result in inaccurate conclusions that would lead to weak policy decisions—not least because they would be based on inadequate data [44]. Hence, it is instrumental during the selection process to focus on just the right number of indicators whose details (i.e., data) are available, unambiguous, and comprehensive. Nevertheless, following the above guidelines as a first stage would require more specific criteria for the selection process of each indicator, as outlined in Section 3.3.

3.3. Criteria for Selection of SWRM Indicators

Specific criteria must be considered in order to select appropriate indicators for assessing SWRM-AF. One of these criteria is that these sustainable indicators should (1) work as a set; (2) be both simple and clear, and (3) contain sufficient information to help decision-makers provide efficient actions [60].
Moreover, Bell and Morse [61] identified other criteria as conditions for selecting indicators. Indicators must:
  • Be relevant to the purpose for which they are used;
  • Be comprehensive in the field of sustainability in parallel with the definition used;
  • Have data available for all regions pertaining to the framework, and these data should be available from public sources, scientific or institutional.
Therefore, sustainability indicators should be filtered by the previous criteria to decide whether they are applicable and relevant to the system and whether they fit its definition. Additionally, data availability is significant; data must be authentic and from open sources, allowing access for all stakeholders. Furthermore, the United Nations [59] suggested additional selection criteria for sustainable development indicators, some of which could benefit the development of the SWRM framework, as follows:
  • Designed on a national scale;
  • Able to assess the progress of sustainability;
  • Clear and understandable;
  • Part of a conceptual foundation;
  • Representative of an international consensus as much as possible, based on the context;
  • Within the capacity of the government with regard to development;
  • Reliant on cost-effective data of recognized quality.
Thus, it can be considered that any indicator should have specific features to be considered, such as being measurable, understandable, conceptual, and adaptable based on the function for which it is used.
Next, in Section 4, a brief overview of the main elements of the indicator-based assessment framework or index is outlined and briefly illustrated.

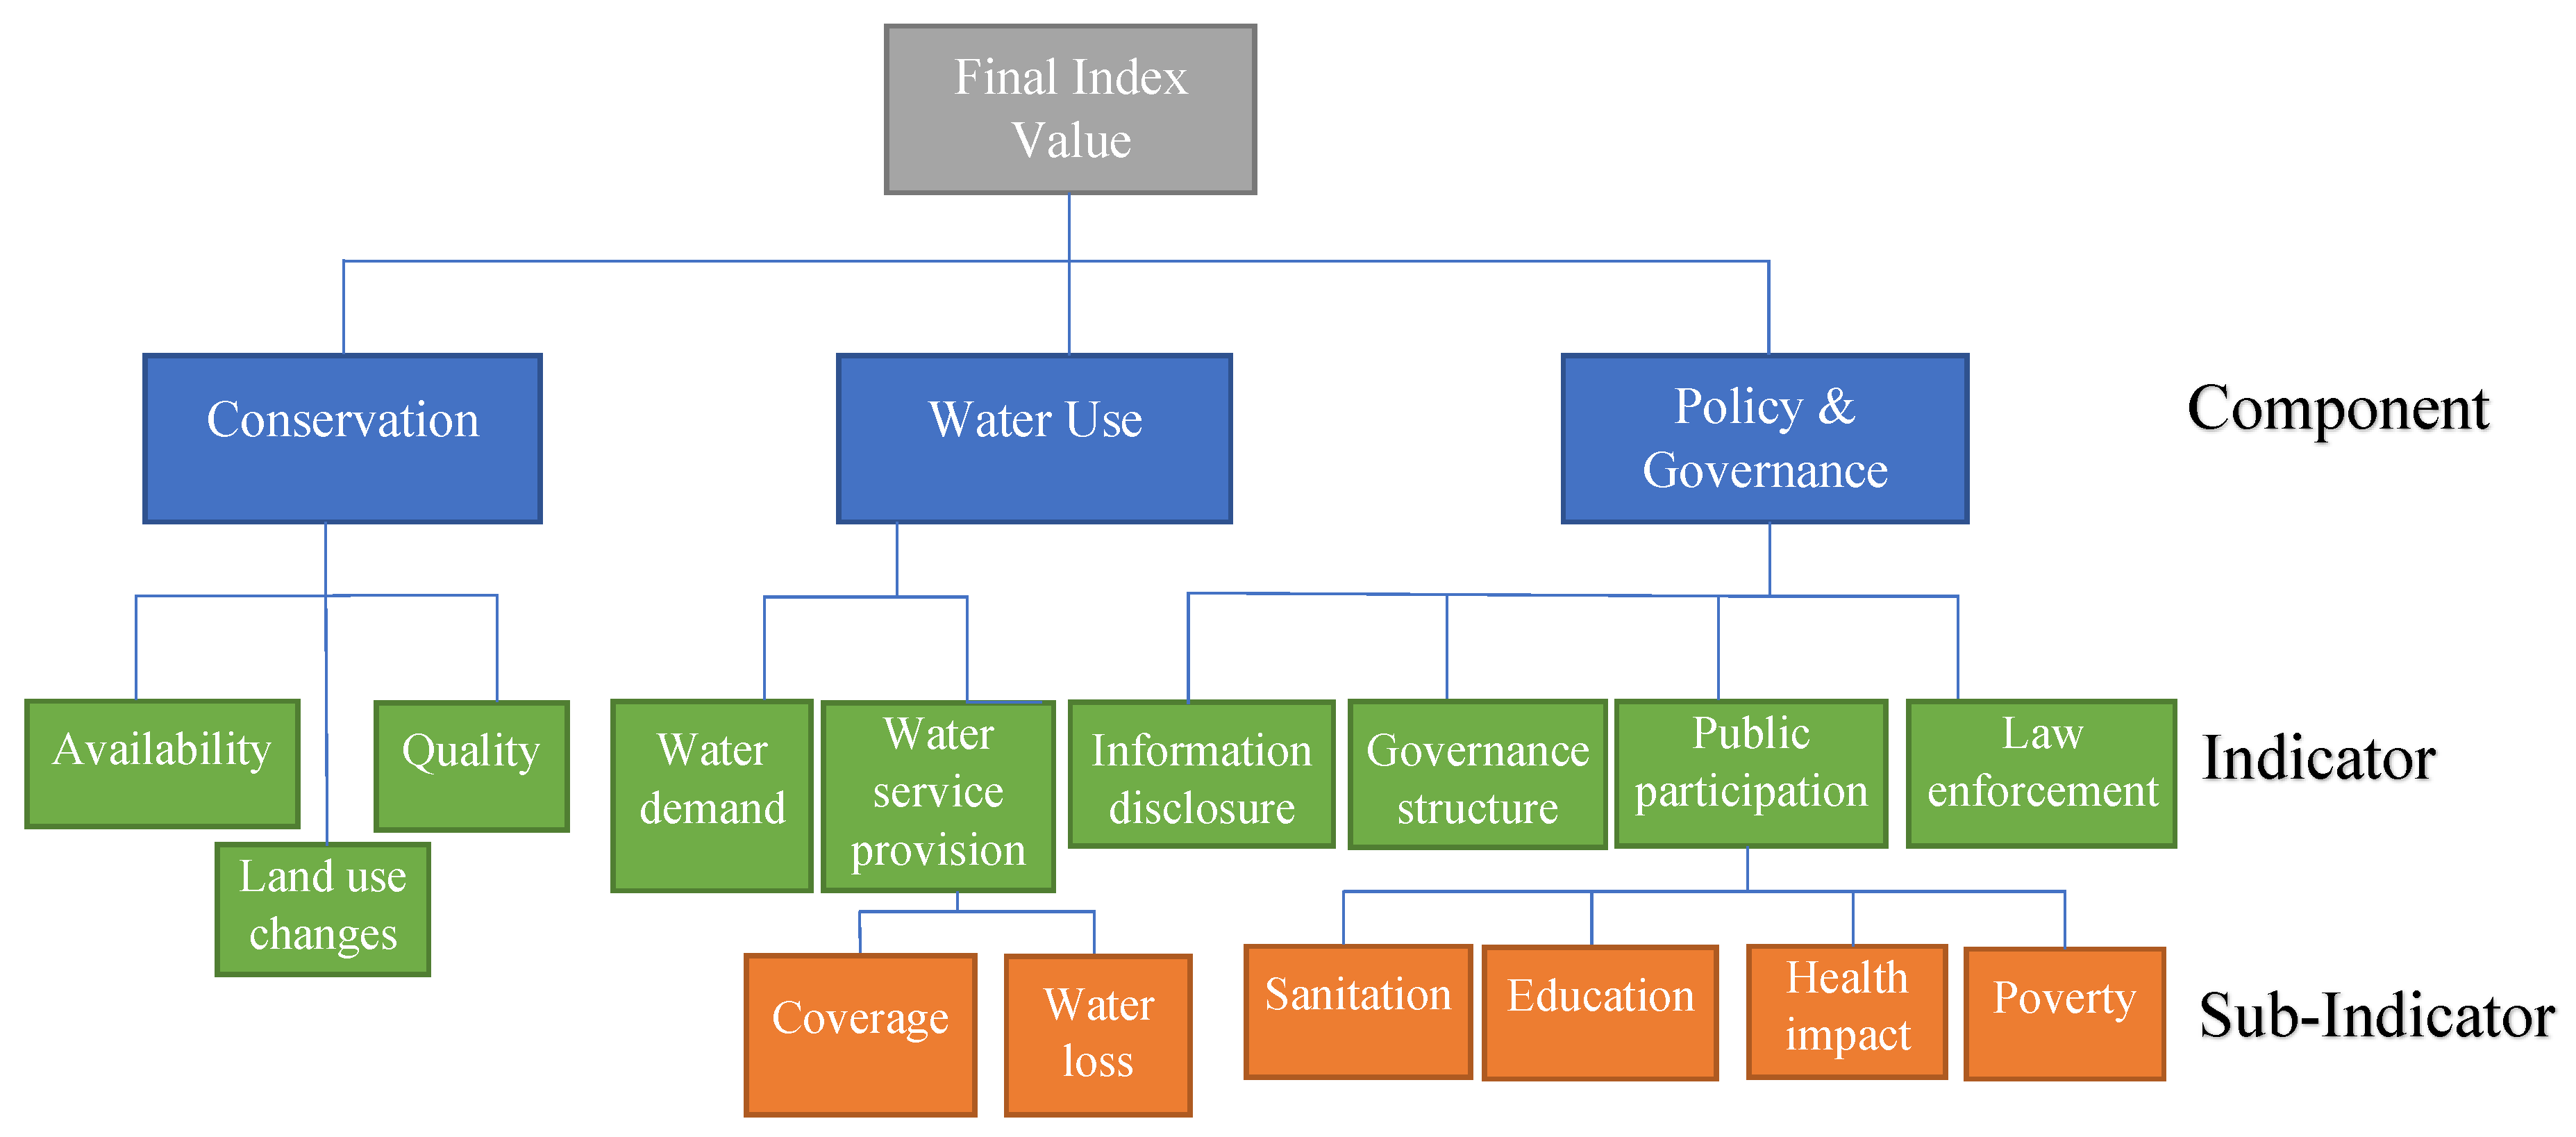
4. Main Elements of an Indicator-Based Assessment Framework

Before establishing or developing any assessment framework, it is vital to recognize and identify its main pillars. This process would ensure that the framework or index would be built clearly on a solid foundation. Therefore, the seven main elements of the indicator-based assessment framework, expressed explicitly and implicitly based on the literature analysis, are presented briefly below.
Overall, it can be said that any sustainability framework (or index) is constituted of several key parts: (1) a set of headline categories (components); (2) a set of underpinning indicators for each component, and (3) a set of second-order and possibly third-order sub-indicators [43]. To illustrate, a visual example for one of the SWRM-AFs included in this review (i.e., West Java Water Sustainability Index (WJWSI)- See Section 5.1) is presented in Figure 2, where the components are represented by the blue boxes, the indicators by the green ones, and the sub-indicators by the orange boxes.
It can be observed that the index in Figure 2 is in a hierarchy shape, where the aggregating direction is a bottom-up process. A particular calculation method (i.e., rescaling or normalization) to have an equivalent value for each indicator and sub-indicator would be applied. Then, the aggregation and the weight of the output value of each sub-indicator would produce the indicator value. The same process is applicable for the resultant values of indicators and components in obtaining the final value of the index (i.e., the top grey box in Figure 2).

4.1. Indicator

The first element in forming an assessment framework or index is the indicator itself, which has the feature of being able to:
  • combine with other indicator(s) to produce a component, and/or
  • split to create more sections related to the same indicator, with each branch called a sub-indicator.
At the same time, a question might arise about what is meant by an indicator and what is the purpose of using it? Indicators present data about the case of a phenomenon [56], used mainly to measure/assess progress toward sustainability [62]. Moreover, indicators can reveal how countries (or regions) are coping with internal and external goals (e.g., SDGs) and conditions in terms of their sustainability obligations [60].
Indicators and sub-indicators are often objective and quantitative—representing a quantity or change based on metrics (e.g., water leakage rate [%], litres of water per person [l/p]). They may also include other aspects, such as area (e.g., [l/m2]) or time periods [l/p/d] [l/p/yr]). On the other hand, they can be qualitative and subjective—dealing with cases that cannot be measured by a number, such as opinions, which differ from one person to another [44]. For example, they may be elicited by such questions as “How happy are you with your water provider (5 being very happy and 0 being very unhappy)”? However, in several SWRM frameworks in the literature, the value of a qualitative indicator or sub-indicator is converted into a number based on a pre-defined conditions or criteria to simplify the aggregation process, enabling the calculation of a final equivalent score for each component [63,64,65]. In general, combining the two types or classifications of indicators in the SWRM frameworks is not uncommon [66], although using only one or the other is more popular [63,65,67,68].

4.2. Benchmark

Furthermore, the second element of the indicator-based assessment framework is the benchmark or target (i.e., an aspired level of performance) with which any indicator and sub-indicator is usually measured or compared [44,68,69]—for example, domestic potable water consumption of 160 l/p/day. Thus, a baseline and specific range (i.e., roadmap and timeline) of values can be developed from any related benchmark to achieve this end goal, which might be to reach 120 l/p/day by 2025 and 80 l/p/day by 2040. This process is considered helpful for stakeholders and decision-makers to gain more comprehensive knowledge about the output of these indicators and enhance their contributions to moving towards, rather than away from, such an end goal.

4.3. Application Scale

Another vital element of the indicator-based assessment framework that needs to be carefully dealt with is the application scale. The scales assigned in the literature for SWRM indices in descending order are usually global, territorial (or regional), local, and community scales, in addition to river basins. Indeed, it is important to understand that the application of each scale might require different criteria and specific guidelines for the selection process of indicators that would form a suitable framework. For example, the Water Poverty Index (WPI) [67] (see Section 5.1) has two different versions/values of the same indicator because of the scale change. In other words, the original version was on a global scale with specific indicators of commonly available data among countries that can serve for this scale [67], while the second version was on a community scale, adding and removing some indicators to fit with the requirements of the case studies [70]. Therefore, knowing the appropriate application scale is essential.

4.4. Normalization Method

The fourth element of the indicator-based framework is the method of calculating sub-index values, or the normalization method (i.e., obtaining equivalent component values for each set of indicators and their following sub-indicators if applicable, as shown above in Figure 2). Before going further, it is essential to note that many indicators under the same index or framework would have different unit values. To illustrate, the water coverage or access indicator, which is common to numerous sustainable water indices, is usually measured as a percentage (%) of people who already have (or are connected to) the water service. On the other hand, the water quality indicator, which is also popular, is typically quantified by a unique summation of different sub-indicators. For instance, water turbidity, which refers to the solutions spectral light absorbance property, or “transparency”, and is measured in nephelometric turbidity units (NTU), while another sub-indicator is the concentration of total suspended solids (TSS), measured in (Mg/L) [71]. Furthermore, if these indicators (i.e., water coverage and water quality) are categorized under one component with different unit values, they cannot be aggregated or compared directly. Therefore, a particular method to combine and compare their values as a normalization process should be chosen based on the features of the data and the goal of creating such a framework [43,46].
There are two widely used normalization methods in the literature for sustainable water indices addressing the issue of calculating the sub-index values:
(a)
continued re-scaling [67,68], and
(b)
categorical scaling [63,65].
The first method is also referred to as empirical normalization [72]. This method is proposed to re-scale the actual values of indicators by converting them mathematically into comparable numbers belonging to an identical interval of numbers ranging from either 0 to 1 or 0 to 100, based on the Equations (1) and (2), respectively [43]:
S i = X i X min X max X min  
S i = X i X min X max X min   ×   100
where Si is the component value for indicator i, Xi is the actual value for indicator i, and Xmin and Xmax are the minimum and maximum threshold values of the indicator, respectively; or in some cases, it can be said that Xmin is the least-preferred value and the Xmax is the most-preferred value, which means that to be able to use this method, the threshold values including the minimum and maximum should be identified for each indicator [43]. The advantage of this method is that it is easy and efficient in comparing the initial state of the indicator with alternatives [72]. Overall, this method might be more applicable when the assessment framework has a majority of quantitative indicators in terms of their data.
The second method for obtaining equivalent indicator values is categorical scaling, where the values of indicators are categorized and assigned based on pre-defined criteria [43]. These categories can be numbers, such as from 1 to 10, or descriptions and opinions, such as “low”, “medium”, or “high”.
The general Equation (3) for using this method is presented below [43]:
Zj     if    Xi meets criteria 1
Zj      if     Xi meets criteria 2
Si = …         …
Zn       if   Xn meets criteria n
where Si is the component value for the indicator i, Xi is the actual value for indicator i, Zj is the category for Xi that meets criteria j, and n is the number of categories. Overall, this method has the advantage of providing the ability to work on both quantitative and qualitative data. For instance, because of the diversity of scales and units in their indicator-based system, Silva et al. [65] used a quali–quantitative scale working as a normalization step to aggregate and compare contrasting model elements.

4.5. Weighting Scheme

The fifth element of the indicator-based framework is the weighting scheme that should be considered before doing any aggregation for the product of the previous element (i.e., the normalization method). The weighting scheme is a process of multiplying each part of the indicator-based framework or index by a value representing its importance or weight during each calculation stage to get the final index number. These weighting techniques are classified in general, according to Nardo et al. [46], into two broad categories: (a) statistical-based methods, where weights are given based on the analysis of the indicator data (e.g., [73,74,75,76]), and (b) participatory-based methods, where weights are assigned based on the preference of expert decision-makers or stakeholders [43].
However, since the first approach is more complex and not used in most frameworks covered in this study, it is considered outside of the scope of this current paper. In addition, the participatory-based methods are preferred for use in SWRM because they match the Dublin principles’ requirements and the definition of the IWRM. Moreover, participatory processes in these assessment types proved valuable and tended to lead to system change through cooperation [77,78]. Nevertheless, it is mandatory prior to using the participatory-based methods to consider providing appropriate justifications for the type of experts or people who have been selected [43], not least because this process might involve subjective judgment [43] and bias.
Furthermore, the weighting distribution scheme can be classified based on the literature of sustainable water indices, particularly in the participatory-based methods, into two schemes:
(a)
the equal weights scheme, and
(b)
the non-equal weights scheme.
According to Nardo et al. [46], most of the composite indicators, in general, have historically relied on equal weighting, and this also applies to some WR sustainable indices [63,65,67,68]. Indeed, it might be argued that a truly sustainable assessment system should equally balance the main elements of sustainability without introducing bias toward one aspect. For example, carbon and the race to achieve carbon neutrality is one key aspect here.

4.6. Aggregation Technique

The sixth element of the indicator-based framework is the aggregating method for the values of sub-indicators, indicators, and components. There are two common aggregating techniques, which are usually linked to the weighting schemes.
(a)
Arithmetic (or linear) method
(b)
Geometric method
The first one is the arithmetic (or linear) method, where all the output values of the indicators (or sub-indicators) are added together, then divided by their total number to obtain an equivalent value for each component (or indicator). This method is commonly called the mean or the average, which has the advantage of being simple, and the disadvantage of being sensitive to outlier values. The general expression for this method is shown in Equation (4) [79]:
I = i = 1 N w i S i
where I is the aggregated component (or indicator), N is the total number of indicators (or sub-indicators) that needs to be calculated, Si is the sub-index for the indicator i, and wi is the weight of indicator i. Another feature of this method is that it can ensure perfect substitutability and compensability among sub-index values [46]. However, this method has been criticized, since it might hide or compensate for poor (or low) indicator quality if combined with a high-quality one [43,46,79].
The second method is the geometric aggregation method, where all the weighted sub-index values are multiplied instead of being added as in the arithmetic. Then, the result is powered by the inverse of their total numbers. Moreover, the geometric aggregation method does not have the feature of creating perfect substitutability and compensability among the sub-index values [43]. The general Equation (5) for using this method is given below [79]:
  I = i = 1 N S i w i  
where the symbols for Equation (4) are the same as for Equation (5); meanwhile, the weights wi in both equations reflect the relative significance of Si, and the summation of these weights should always equal one [79].

4.7. Final Index Value

The seventh element of the indicator-based framework is the final index value, which is the final goal of having an index. This element is usually represented by one number, and it is the final score of the standardized procedures of the fourth, fifth, and sixth elements of the indicator-based framework (i.e., normalization method, weighting scheme, and aggregation technique, respectively) [80]. This number is most likely to be from 0 to 100 or 0 to 1. The benefit of having such a number is to make the result of the whole framework easy to understand, not least by a range of different stakeholders, without the need for a more detailed assessment. Furthermore, classified interpretations for the overall sustainability level are sometimes given based on specific ranges of the final index value. For example, in a framework where the final index value is from 0 to 1, the low, intermediate, and high level of sustainability are interpretations for any final value lower than 0.5, from 0.5 to 0.8, and higher than 0.8, respectively [63].

5. Existing Sustainable Water Resources Management Assessment Frameworks (SWRM-AF): An Overview

After the previous brief exploration and explanation of the main elements of the indicator-based assessment framework, it would be helpful to provide an overview of the existing SWRM-AFs and check whether they are applicable to ASAR. Those presented in this section represent the result of the systemic literature review. This section is vital to finding any limitation or knowledge gap(s) in their respective application(s), and to ascertaining whether they would be suitable for application in different local contexts and conditions. For this reason, a specific search was conducted in this paper for every SWRM-AF available in two literature databases since the year 2000 (See Section 2).
Before going further, it is important to remember that this study focuses on the participatory method for the development of an SWRM-AF. This method is a critical process recommended by the principles of IWRM [81], where it is emphasized that stakeholders should be involved in the planning and implementation process [82]. However, in reality, the application of IWRM has faced different issues ranging between the complexity in measuring its effects and the difficulty in applying prescriptive ideals to the decision-making process [83]. Thus, considering that any indicator-based framework relies on a participatory technique would overcome the flaws of the application of IWRM. Additionally, this technique could gain the public’s trust and would likely ensure their cooperation with any developed future plans and interventions after assessing their WRM system’s sustainability.

5.1. Results of Systematic Literature Review

As illustrated previously in Figure 1 and discussed in Section 2.2, the final number of studies that matched the systematic review requirements from the two databases was narrowed in the final stages to only 23 studies. Of these 23 studies, which were supposed to be taken to the full review stage, 17 original frameworks were identified (Table 1). Inevitably, each of these frameworks has different purposes, uses different assessment techniques, and was made for a specific application at different scales and within diverse local contexts and conditions. Nevertheless, each of them was presented as a supportive tool to either measure or improve the level of sustainability of the WRM system, individually or collectively.
The other six studies were excluded for several reasons. One of these is that they applied one of the other 17 frameworks but with only minor changes. For example, by varying only the case study, which happened with a journal article [30] that applied the same Watershed Sustainability Index (WSI) [63] to a different region. Therefore, it was decided to only include the paper that introduced the original index in this review. In addition, a conference paper that suggested the application of the Canadian Water Sustainable Index (CWSI) to evaluate a specific case study had very few details about the index itself [84]. This was consequently replaced by the original framework published in a previous report [68]. Likewise, a conference paper [85] about some procedures used in developing the Water Needs Index (WNI) was excluded because the same index was provided in full detail in another paper [86] that was included in the review.
Another reason for excluding other papers was when their research served either as guidance on how to make indicators and frameworks with examples [58], or as criticism of the indicators assigned for the SDG number 6 [87].
The last reason for not including some studies in the final comparison, even though they had a framework and indicators, was that their purpose and indicators were not sufficiently focused on improving/assessing the sustainability of WRM. The first study of this type was a conference paper focused on evaluating the United States’ infrastructure performance related to the water sector, without careful consideration of other dimensions of sustainability [88]. Similarly, to some degree, another study concentrated to some degree on evaluating the already existing performance indicators related to the water supply network that targeted the issue of water losses [89]. There were three main issues with the previous study: (1) the final product was not compatible with the definition of an index/framework; (2) it had too much technical detail in its indicators that were not all specifically related to sustainability, and (3) the final number of performance indicators reached 117, which did not comply with the guidance with regard to having a simple sustainable framework. Thus, this study was excluded. The remaining studies, ordered from the oldest to newest, are shown in Table 1 and Table 2. Further comparative analysis among all frameworks included in Table 1 and Table 2 is provided in Section 5.2.
Table 1. Summary and comparison of main elements of existing SWRM-AFs.
SWRM-AF NameAcronymAuthor(s), YearNumber of IndicatorsBenchmarkScale
[Location]
Normalization
Method
Weighting SchemeAggregation Tech.Final Index Value
ComponentIndicatorS. Indicator
Water Poverty IndexWPI(Lawrence et al., 2002)
[67]
51715yesGlobalContinuous
rescaling
EqualArithmetic0–100
Canadian Water Sustainability IndexCWSI(Policy Research Initiative, 2007)
[68]
515×yesCommunity 2
[Canada]
Continuous
rescaling
EqualArithmetic0–100
Watershed Sustainability IndexWSI(Chaves and Alipaz, 2007)
[63]
4 15×yesLocal &
regional 2
[Brazil]
Categorical rescalingEqualArithmetic0–1
West Java Water Sustainability IndexWJWSI(Juwana et al., 2010)
[90,91]
396yesTerritorial
(regional) 2
[Indonesia]
Continuous +
Categorical rescaling
Equal + non-equalGeometric0–100
Water Needs IndexWNI(Moglia et al., 2012)
[86]
69×yesLocal (ward & district)
[Vietnam]
Continuous
rescaling
Non-equal (user defined)Arithmetic0–100
Water & Sanitation Sustainability IndexWASSI(Iribarnegaray et al., 2015)
[48]
9152yesLocal (urban & peri-urban)
[Argentina]
Continuous +
categorical rescaling
EqualArithmetic0–100
Global Water Security Index GWSI(Gain et al., 2016)
[7]
410×yesGlobalContinuous
rescaling
Non-equal (authors defined)Arithmetic0–1
Hybrid Triple Bottom Line & Multi-criteria Decision AnalysisTBL-MCDA 1(Cole et al., 2018)
[92]
3 44×yesLocal &
community
[USA]
Categorical rescalingEqualArithmetic1–5 3
Freshwater Health IndexFHI(Vollmer et al., 2018)
[93]
31131yesLocal &
regional 2
[China]
Continuous +
categorical rescaling
Equal + non-equalGeometric+ Arithmetic0–100 3
Assessing Water Security & Water–Energy–Food NexusWEF nexus 1(Marttunen et al., 2019)
[49]
417×yesNational
[Finland]
Categorical rescaling×××
Municipal Environmental Management MEM(Criollo et al., 2019)
[94]
440×yesLocal &
regional
[Colombia]
Continuous
rescaling
Non-equal (user defined)Arithmetic 0–1
River Basin Water Sustainability IndexRBWSI(Silva et al., 2020)
[65]
3819 (54)yesTerritorial
regional 2
[N/A]
Categorical rescalingEqualArithmetic0–1
Water Sensitive Cities IndexWSC(Rogers et al., 2020)
[78]
734×yesLocal (metropolitan/municipal)
[Australia]
Categorical rescaling×Arithmetic1–5 3
Malaysia Manufacturing Industry Water Benchmarking SystemMIWABS(Bahar et al., 2020)
[80]
49×yesFactories level
[Malaysia]
Proximity-to-target + categorical
rescaling
Non-equal (user defined)Arithmetic0–100
Indicators of Integrated Water Resource ManagementIIWRM 1(Ben-Daoud et al., 2021)
[95]
412×yesLocal 2
[Morocco]
Categorical rescalingEqualArithmetic1–5
Sustainability Index SI(Najar and Persson, 2021)
[96]
31482yesLocal
[Sweden]
Survey
(categorical rescaling)
EqualArithmetic0–2
Rural Water Sustainability IndexRWSI(Crispim et al., 2021)
[97]
52158yesRural &
community
[Brazil]
Categorical rescalingNon-equal (user defined)Arithmetic0–10
Average4.517.630.3
1 Indicates a suggested acronym; 2 designed for river basin scale; 3 does not have a final index value but a final value for each component only.

5.2. Comparative Analysis of Existing SWRM-AFs

After the brief illustration of all the frameworks obtained from the systematic literature review (see Table 1 and Table 2) a comparative analysis is performed in order to collectively get valuable observations and insights. The comparative analysis is undertaken using the aspects previously detailed in Section 4 and the key headings shown in Table 1 and Table 2.

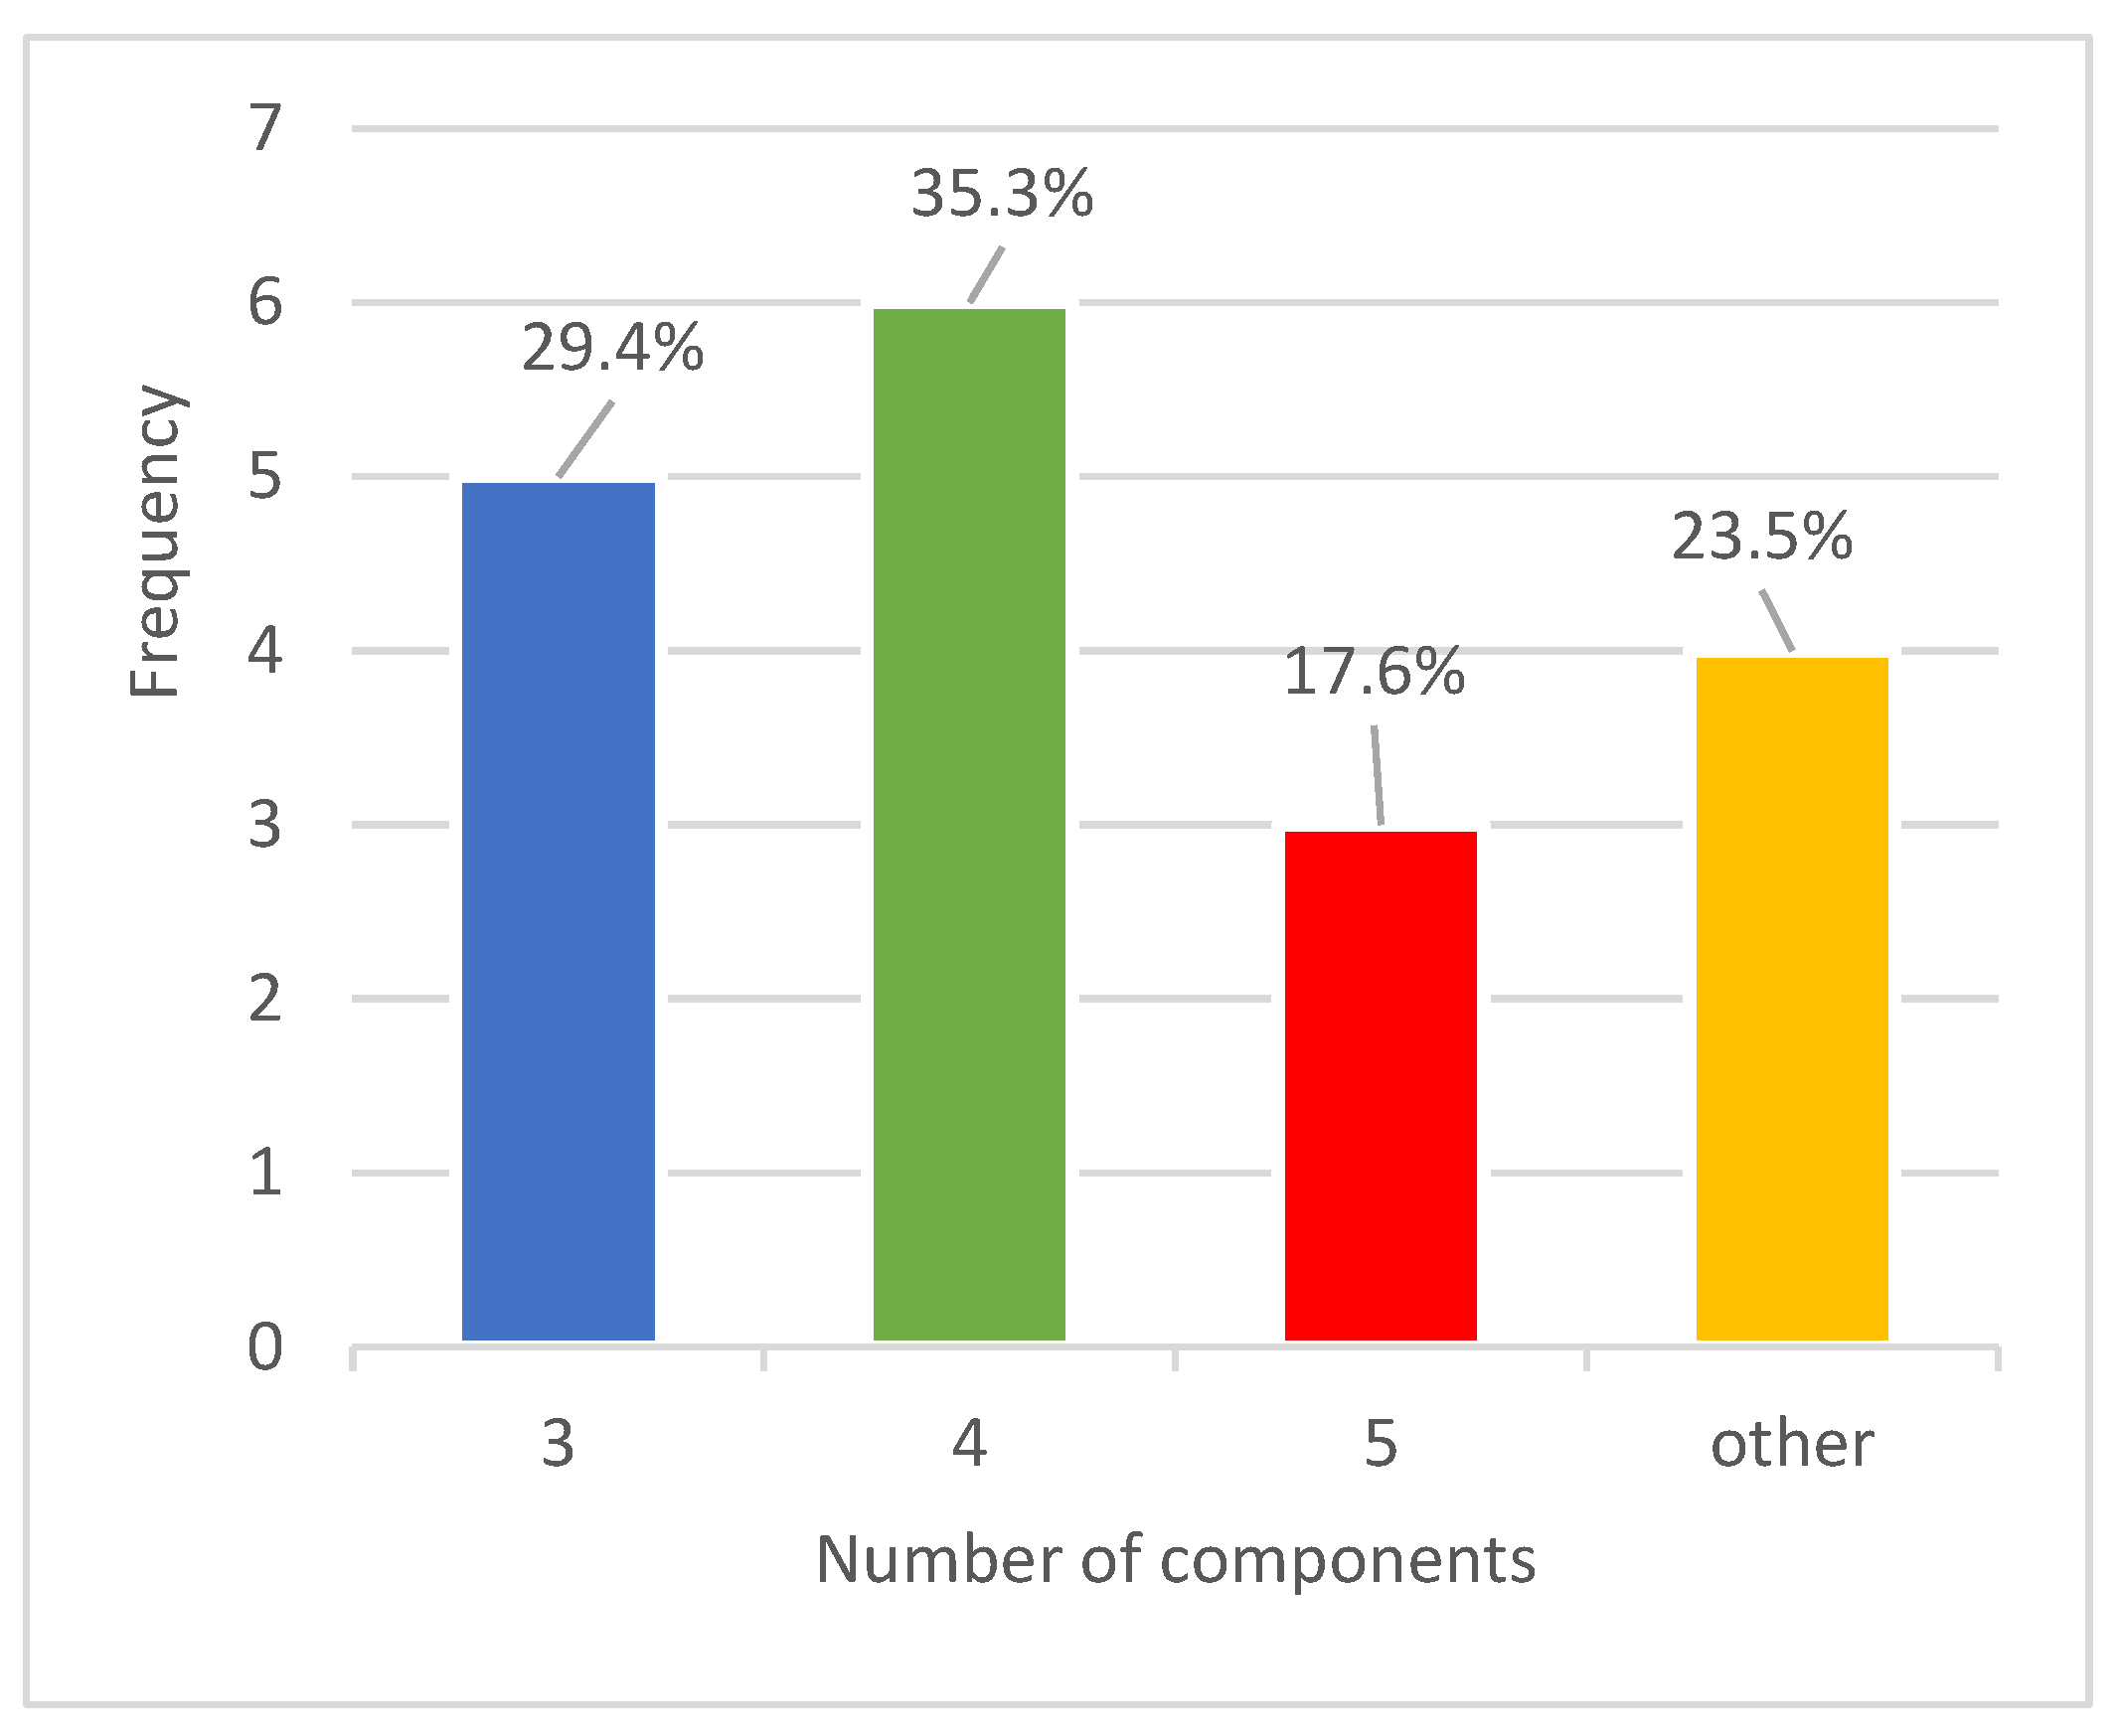
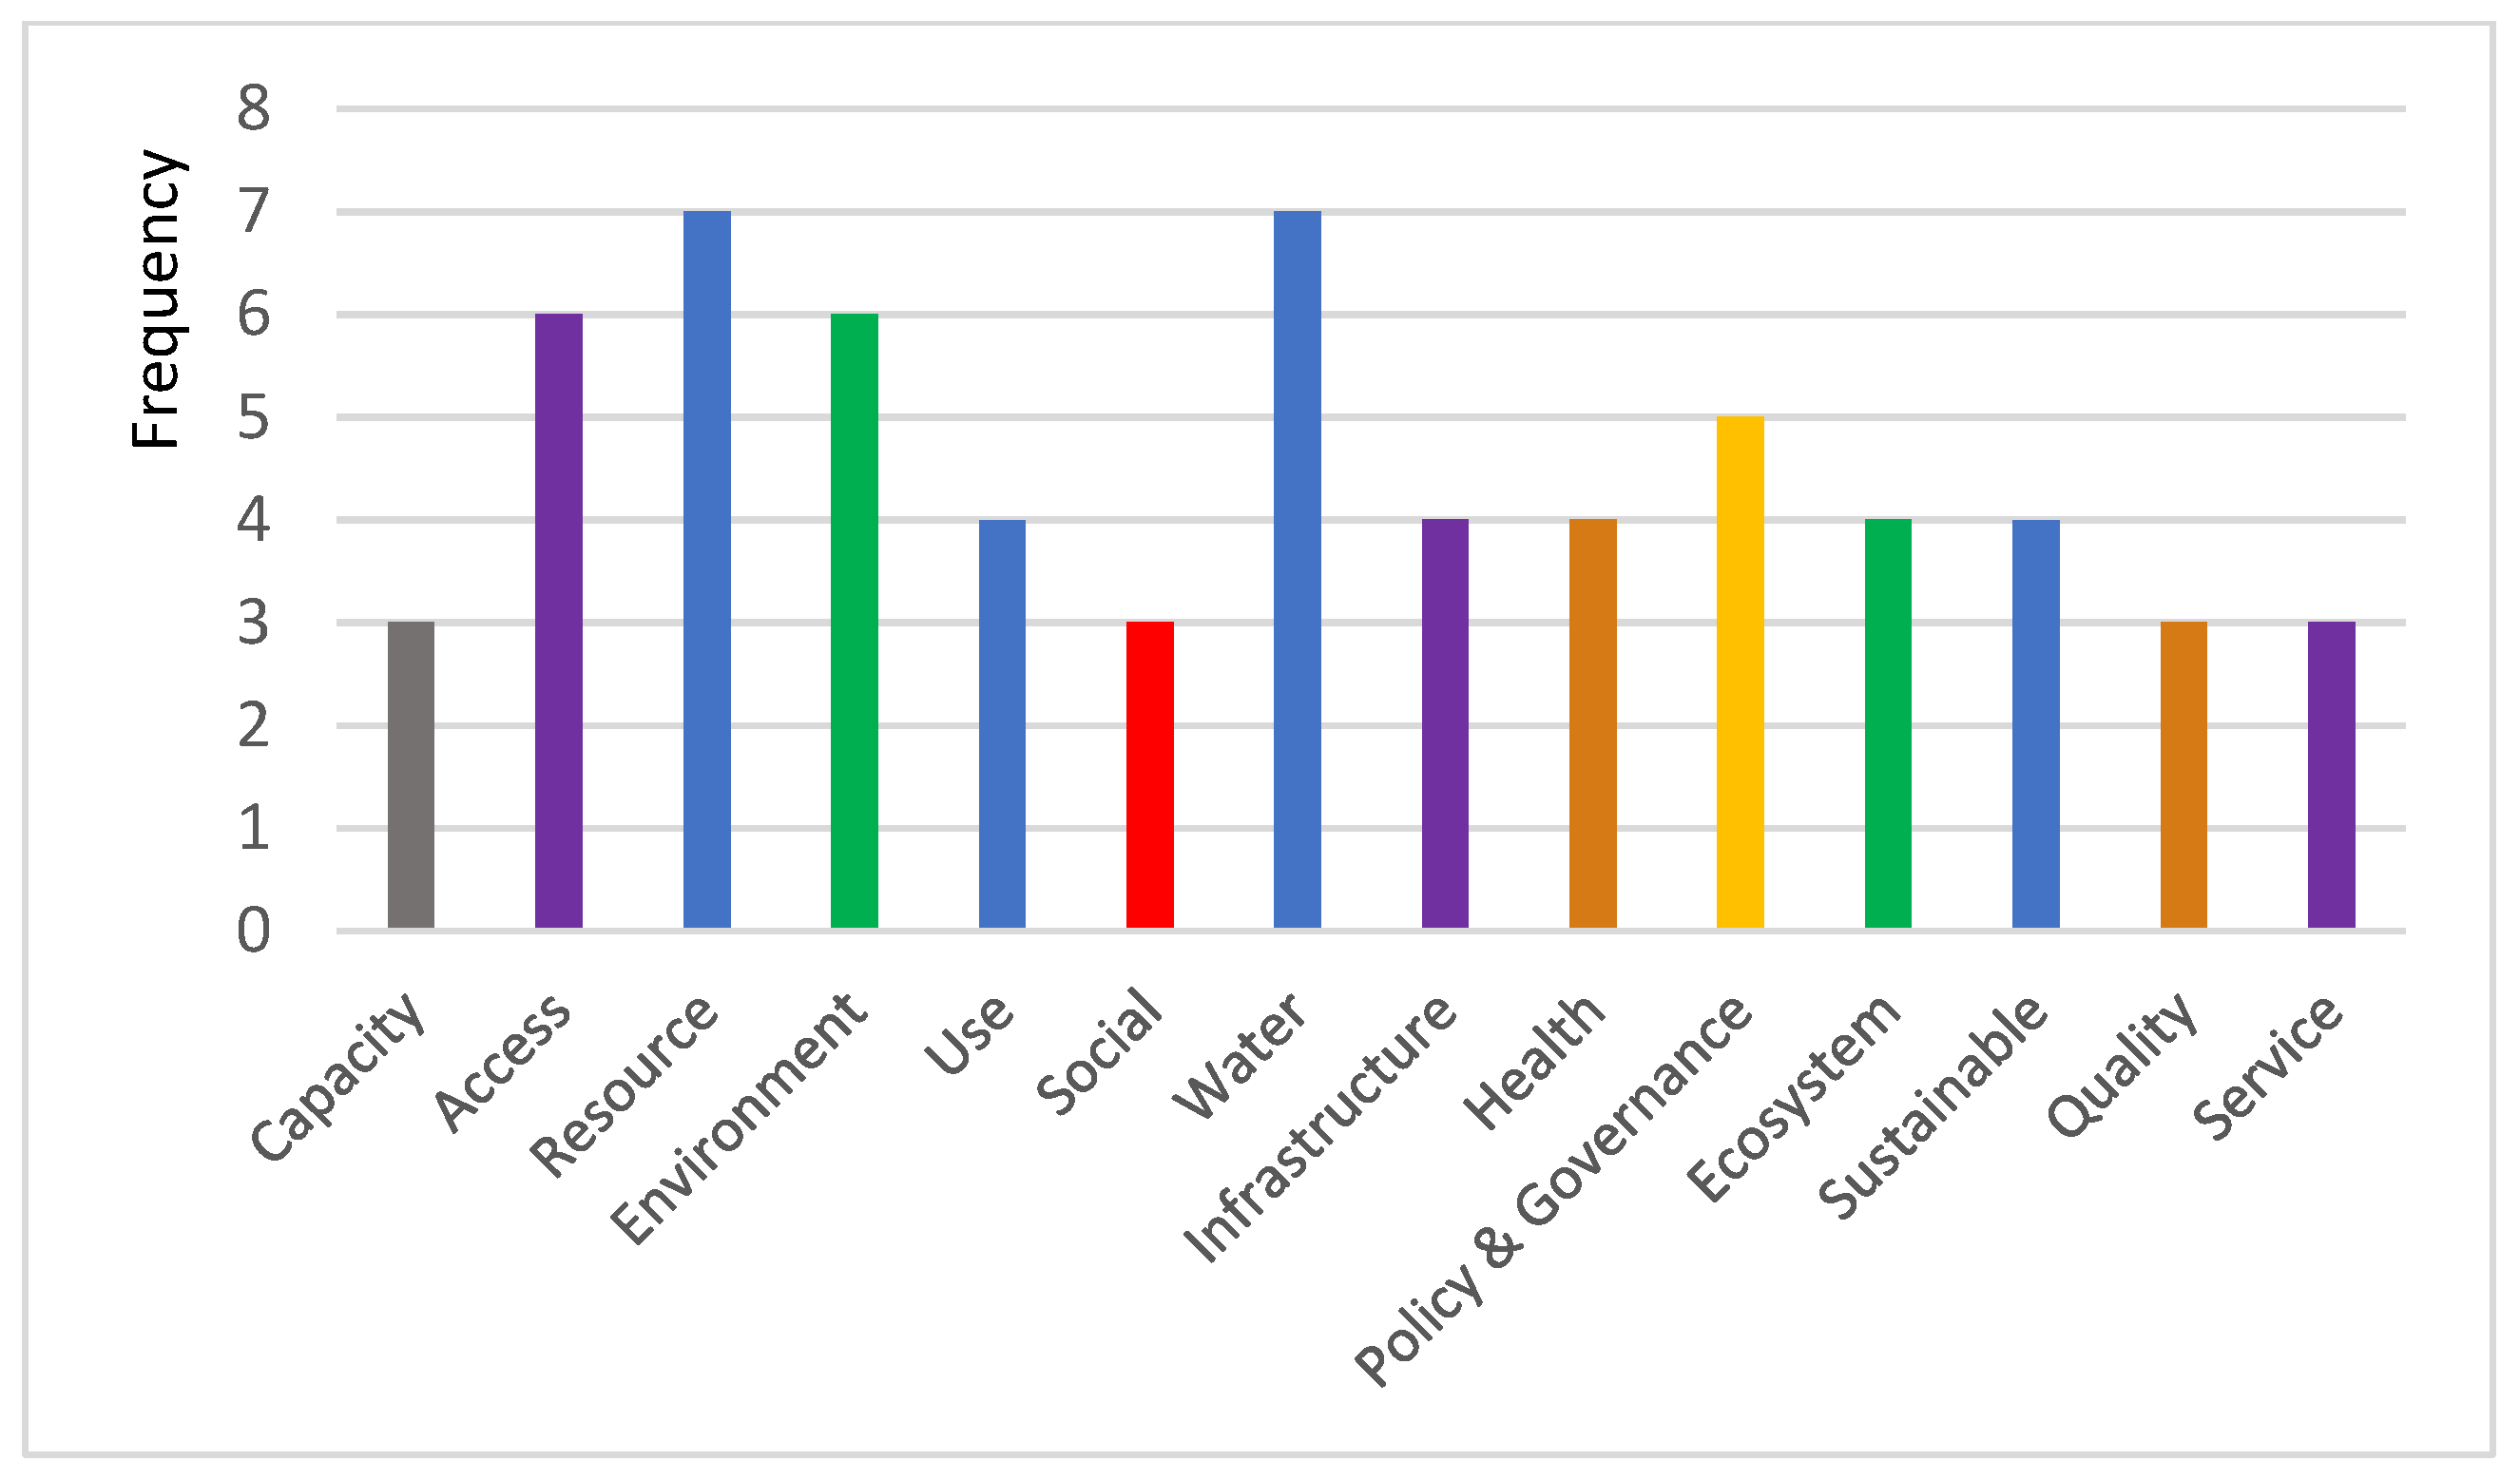
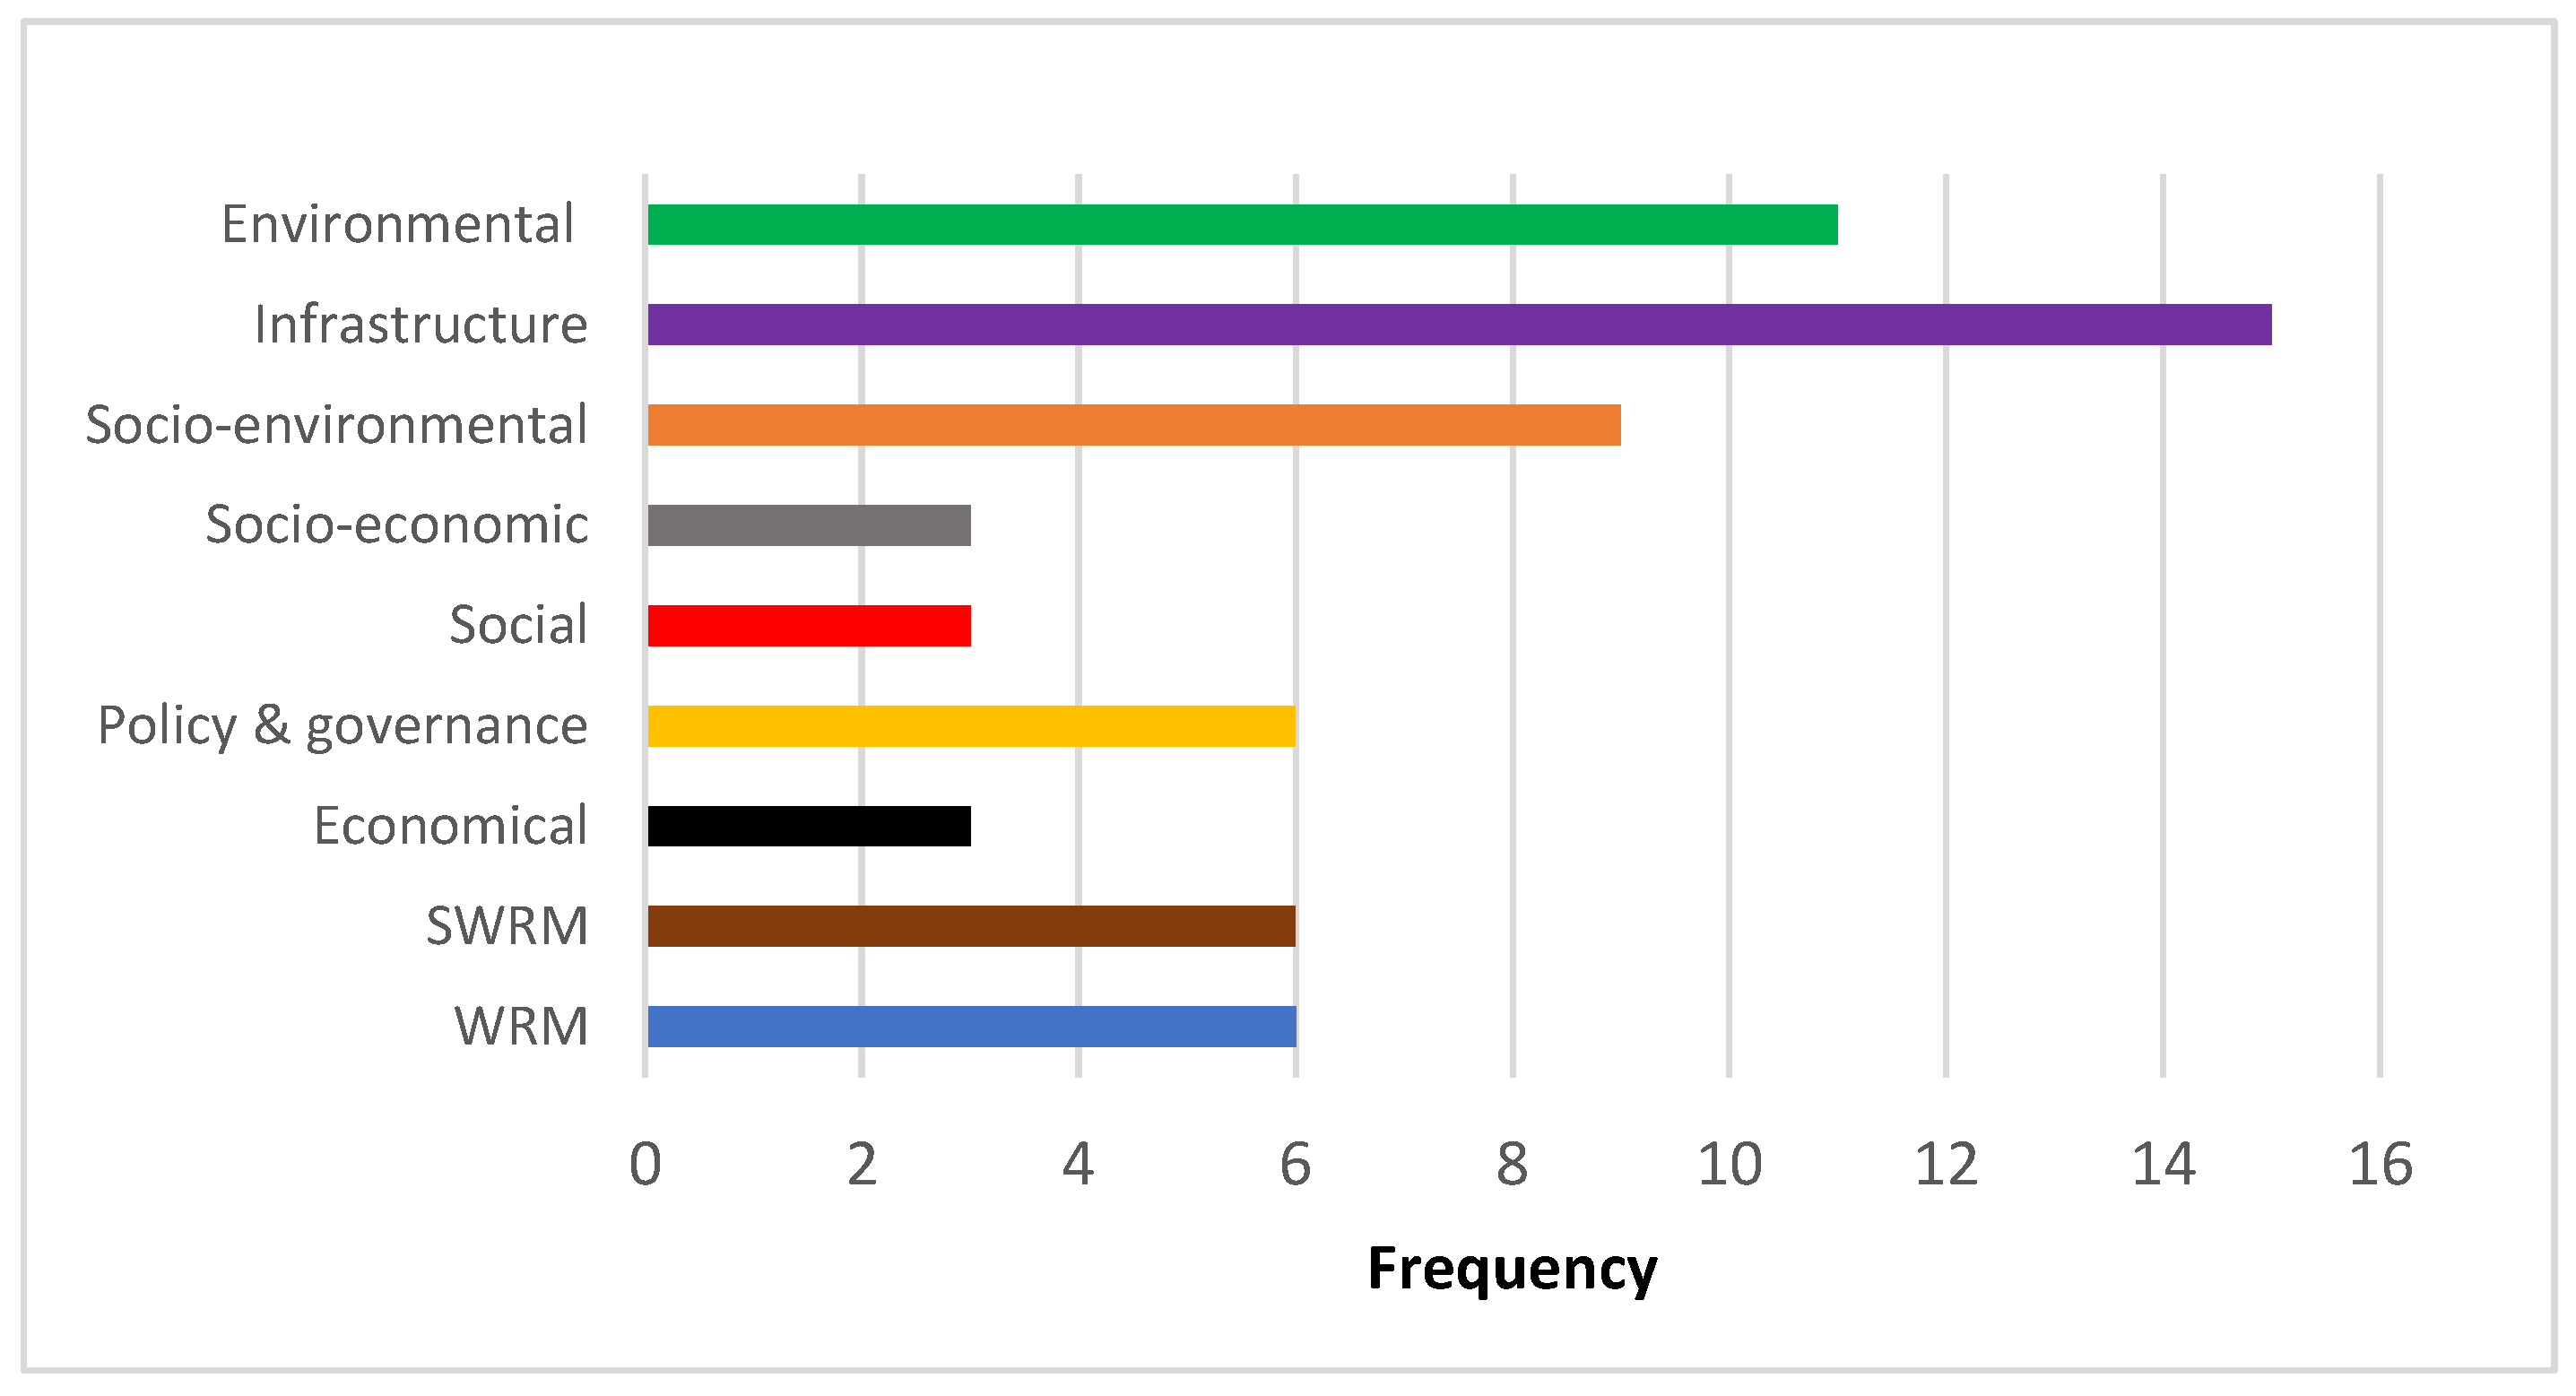
5.2.1. Number and Type of Components

The first observation was in regard to the number of components (Figure 3), where their total number was 76, while the different investigated frameworks used an average number of 4.5 components. Moreover, thirteen frameworks (76.5% of the total) opted for three to five components, with four being the most widely adopted featuring within six studies (35.3% of the total), whilst three and five components were featured in four and three frameworks (i.e., 29.4% and 17.6% of total), respectively. The other frameworks adopted six, seven, or nine components (23.5% of total). The highest number of components (9) was found in WASSI [48] and the least numbers of components (3) were found in RBWSI [65], FHI [93], TBL-MCDA [92] and WJWSI [90,91]. Based on this observation, it can be suggested that for any new SWRM-AF being developed, the number of components should preferably stay within the threshold of three to five, with a preference of four, since it was the most repeated number.
Regarding the types of components, a thematic analysis was conducted to categorize them in two steps. The first step was to check the common words in the title of the components that were repeated based on their numbers. A criterion was suggested to eliminate any word repeated less than three times. Therefore, only 63 components distributed among 14 main words were included in this analysis, as seen in Figure 4. The most-repeated words were “resource” and “water” (i.e., seven times for each), followed by “environment” and “access”, which were mentioned six times. In contrast, “capacity”, “social”, “infrastructure”, “quality”, and “service” were the least-repeated words, with only three repetitions for each.
Further investigation, which was the second step, highlighted that thematic categorization was possible by combining those categories in Figure 4 that served the same theme, as shown in Figure 5.
Overall, it can be seen that the infrastructure, environmental, and socio-environmental components are critical in any SWRM-AF, since they have the biggest shares.

5.2.2. Number of Indicators

The second observation concerned the number of indicators. From the interrogation of Table 1, it can be seen that the average number of indicators in all included frameworks was 17.6 indicators. However, it can also be seen that most frameworks (twelve–70.6% of total) had a total number of indicators ranging between 9 [73,83,88] and 17 [49,67] (inclusive), leading to an average of 12.75 in this discrete group. The most repeated number of indicators therein were nine [80,86,91] and fifteen [48,63,68], where each of these numbers was found in three of the seventeen frameworks. Four of the remaining frameworks (i.e., 23.5% of total) had a higher number of indicators, 21 in RWSI [97], 34 in WSC [78], 40 in MEM [94], and 44 in TBL-MCDA [92], respectively, while only one study (i.e., RBWSI [65]) had a lower number, with eight indicators. The lower number was not typical; however, this framework had a unique design, with two orders of sub-indicators.

5.2.3. Number of Sub-Indicators and Benchmarks

In terms of sub-indicators, Table 1 shows that they were not always available. In other words, only seven frameworks (41.1% of total) included them. The average number was 30.3 sub-indicators, with a minimum of 2 in WASSI [48] and a maximum of 82 in SI [96]. In terms of benchmarking, all frameworks reviewed contained these (see Table 1)

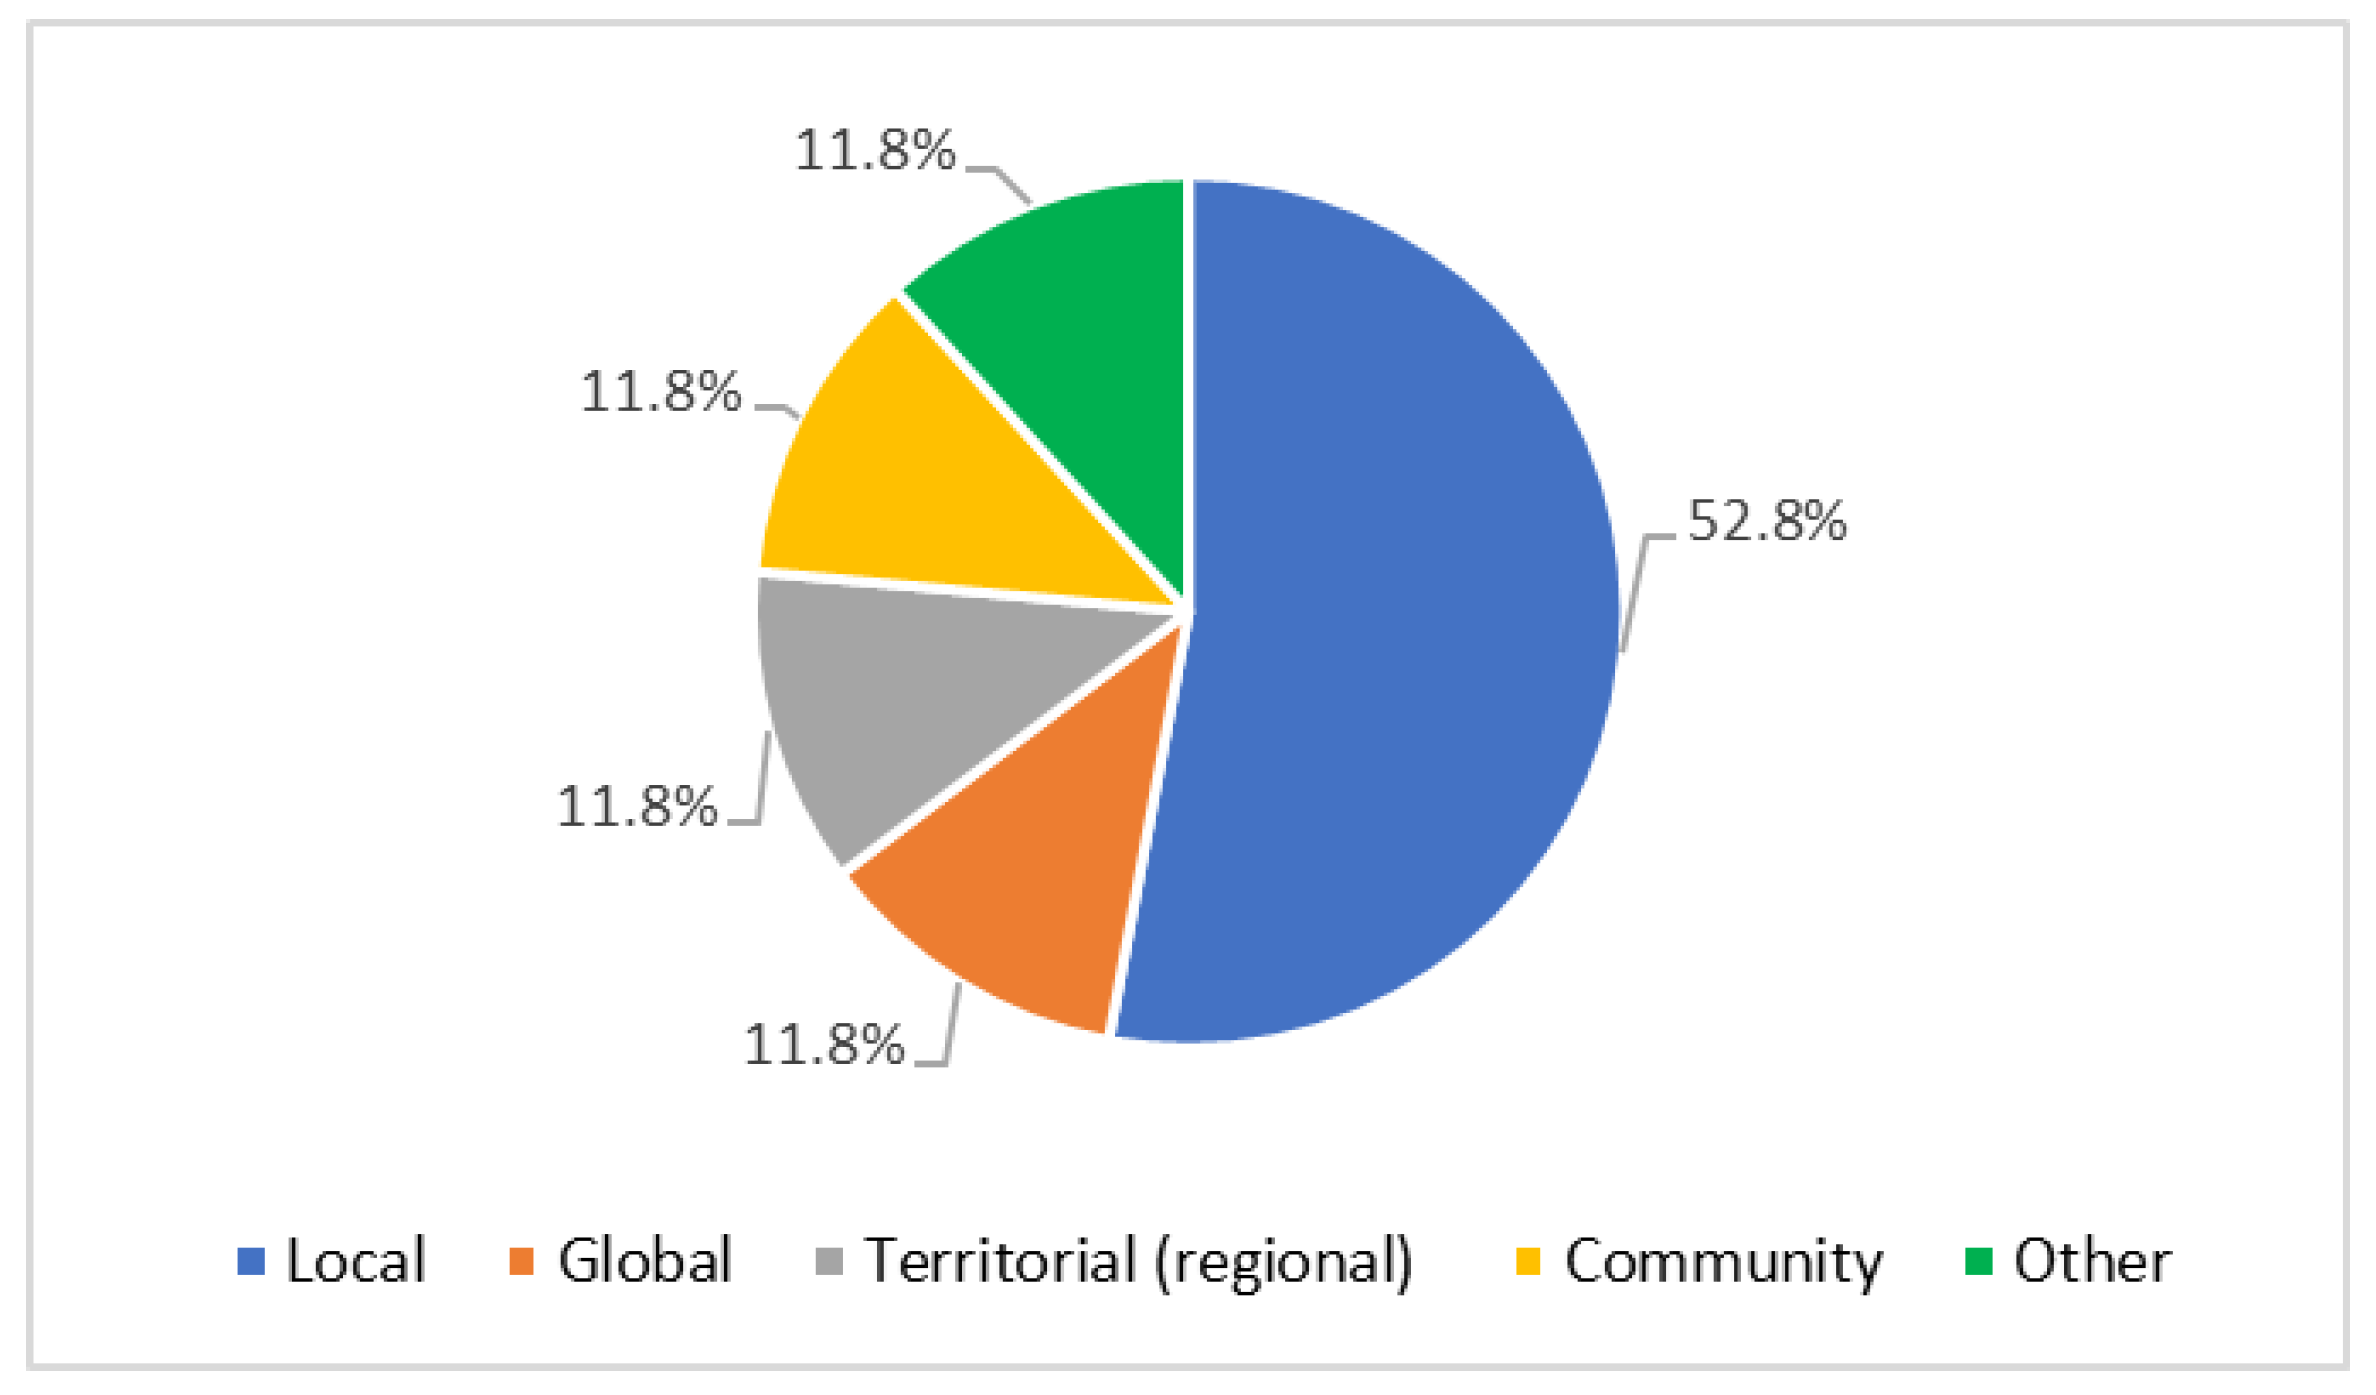
5.2.4. Scale of Application

Various scales can be seen within the frameworks reviewed (Figure 6).
The global scale appeared only twice in WPI [67] and GWSI [7], likely because the amount of time, effort, and required data are extensive. The scale with the most significant share (9 studies or 52.8%) tended toward the local (mainly city) scale whilst the remaining six studies were evenly split between the community scale [68,92] and territorial (regional) scale [63,94], which refers to large areas, such as those with several cities. The last of these is the “other” category, with two frameworks, which included the national and factory scales [80,96]. It is also worth noting that six studies (i.e., 35.3% of total) considered areas with river basins [63,65,68,90,93,95].

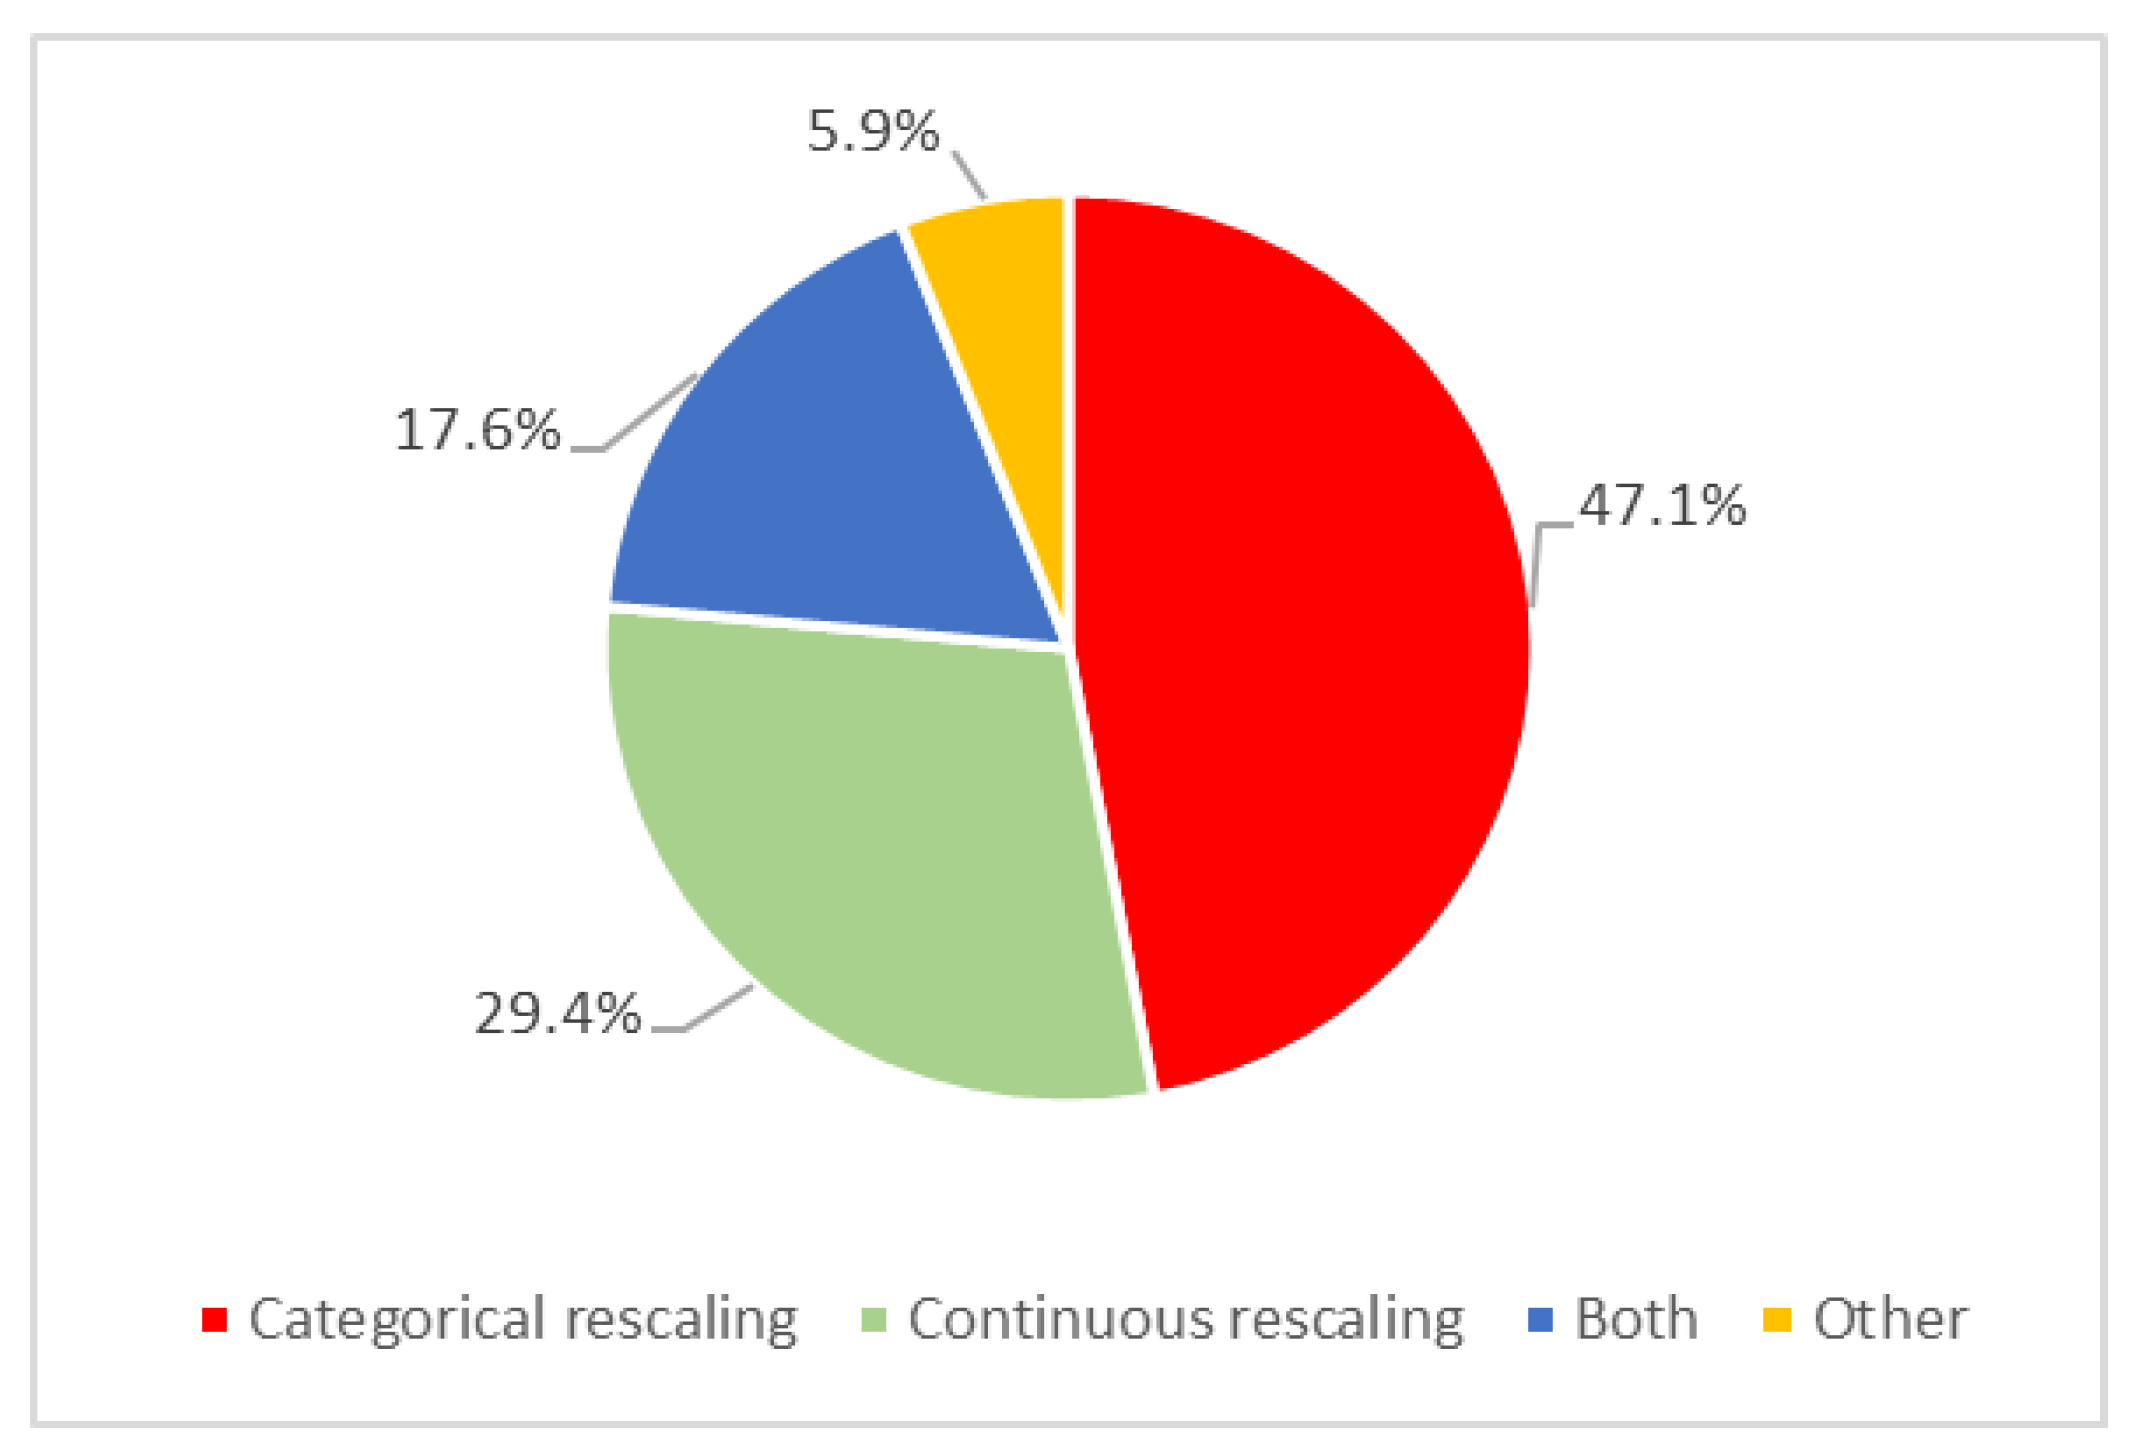
5.2.5. Normalization Process

All percentages for the process of normalization are shown in Figure 7. Eight studies used categorical rescaling [49,63,65,78,92,95,96,97], and five studies used continuous rescaling [7,67,68,86,94], with 47.1% and 29.4% of the total share, respectively. Three studies (17.6% of total) used a combination of both [48,90,93]. This option is not common, because this task would be confusing for non-expert stakeholders. On the other hand, only one framework (i.e., MIWABS [80]) used a different approach: the Proximity-to-Target [80], which happened to be a very close match to continuous rescaling, albeit with subtle, nuanced differences.

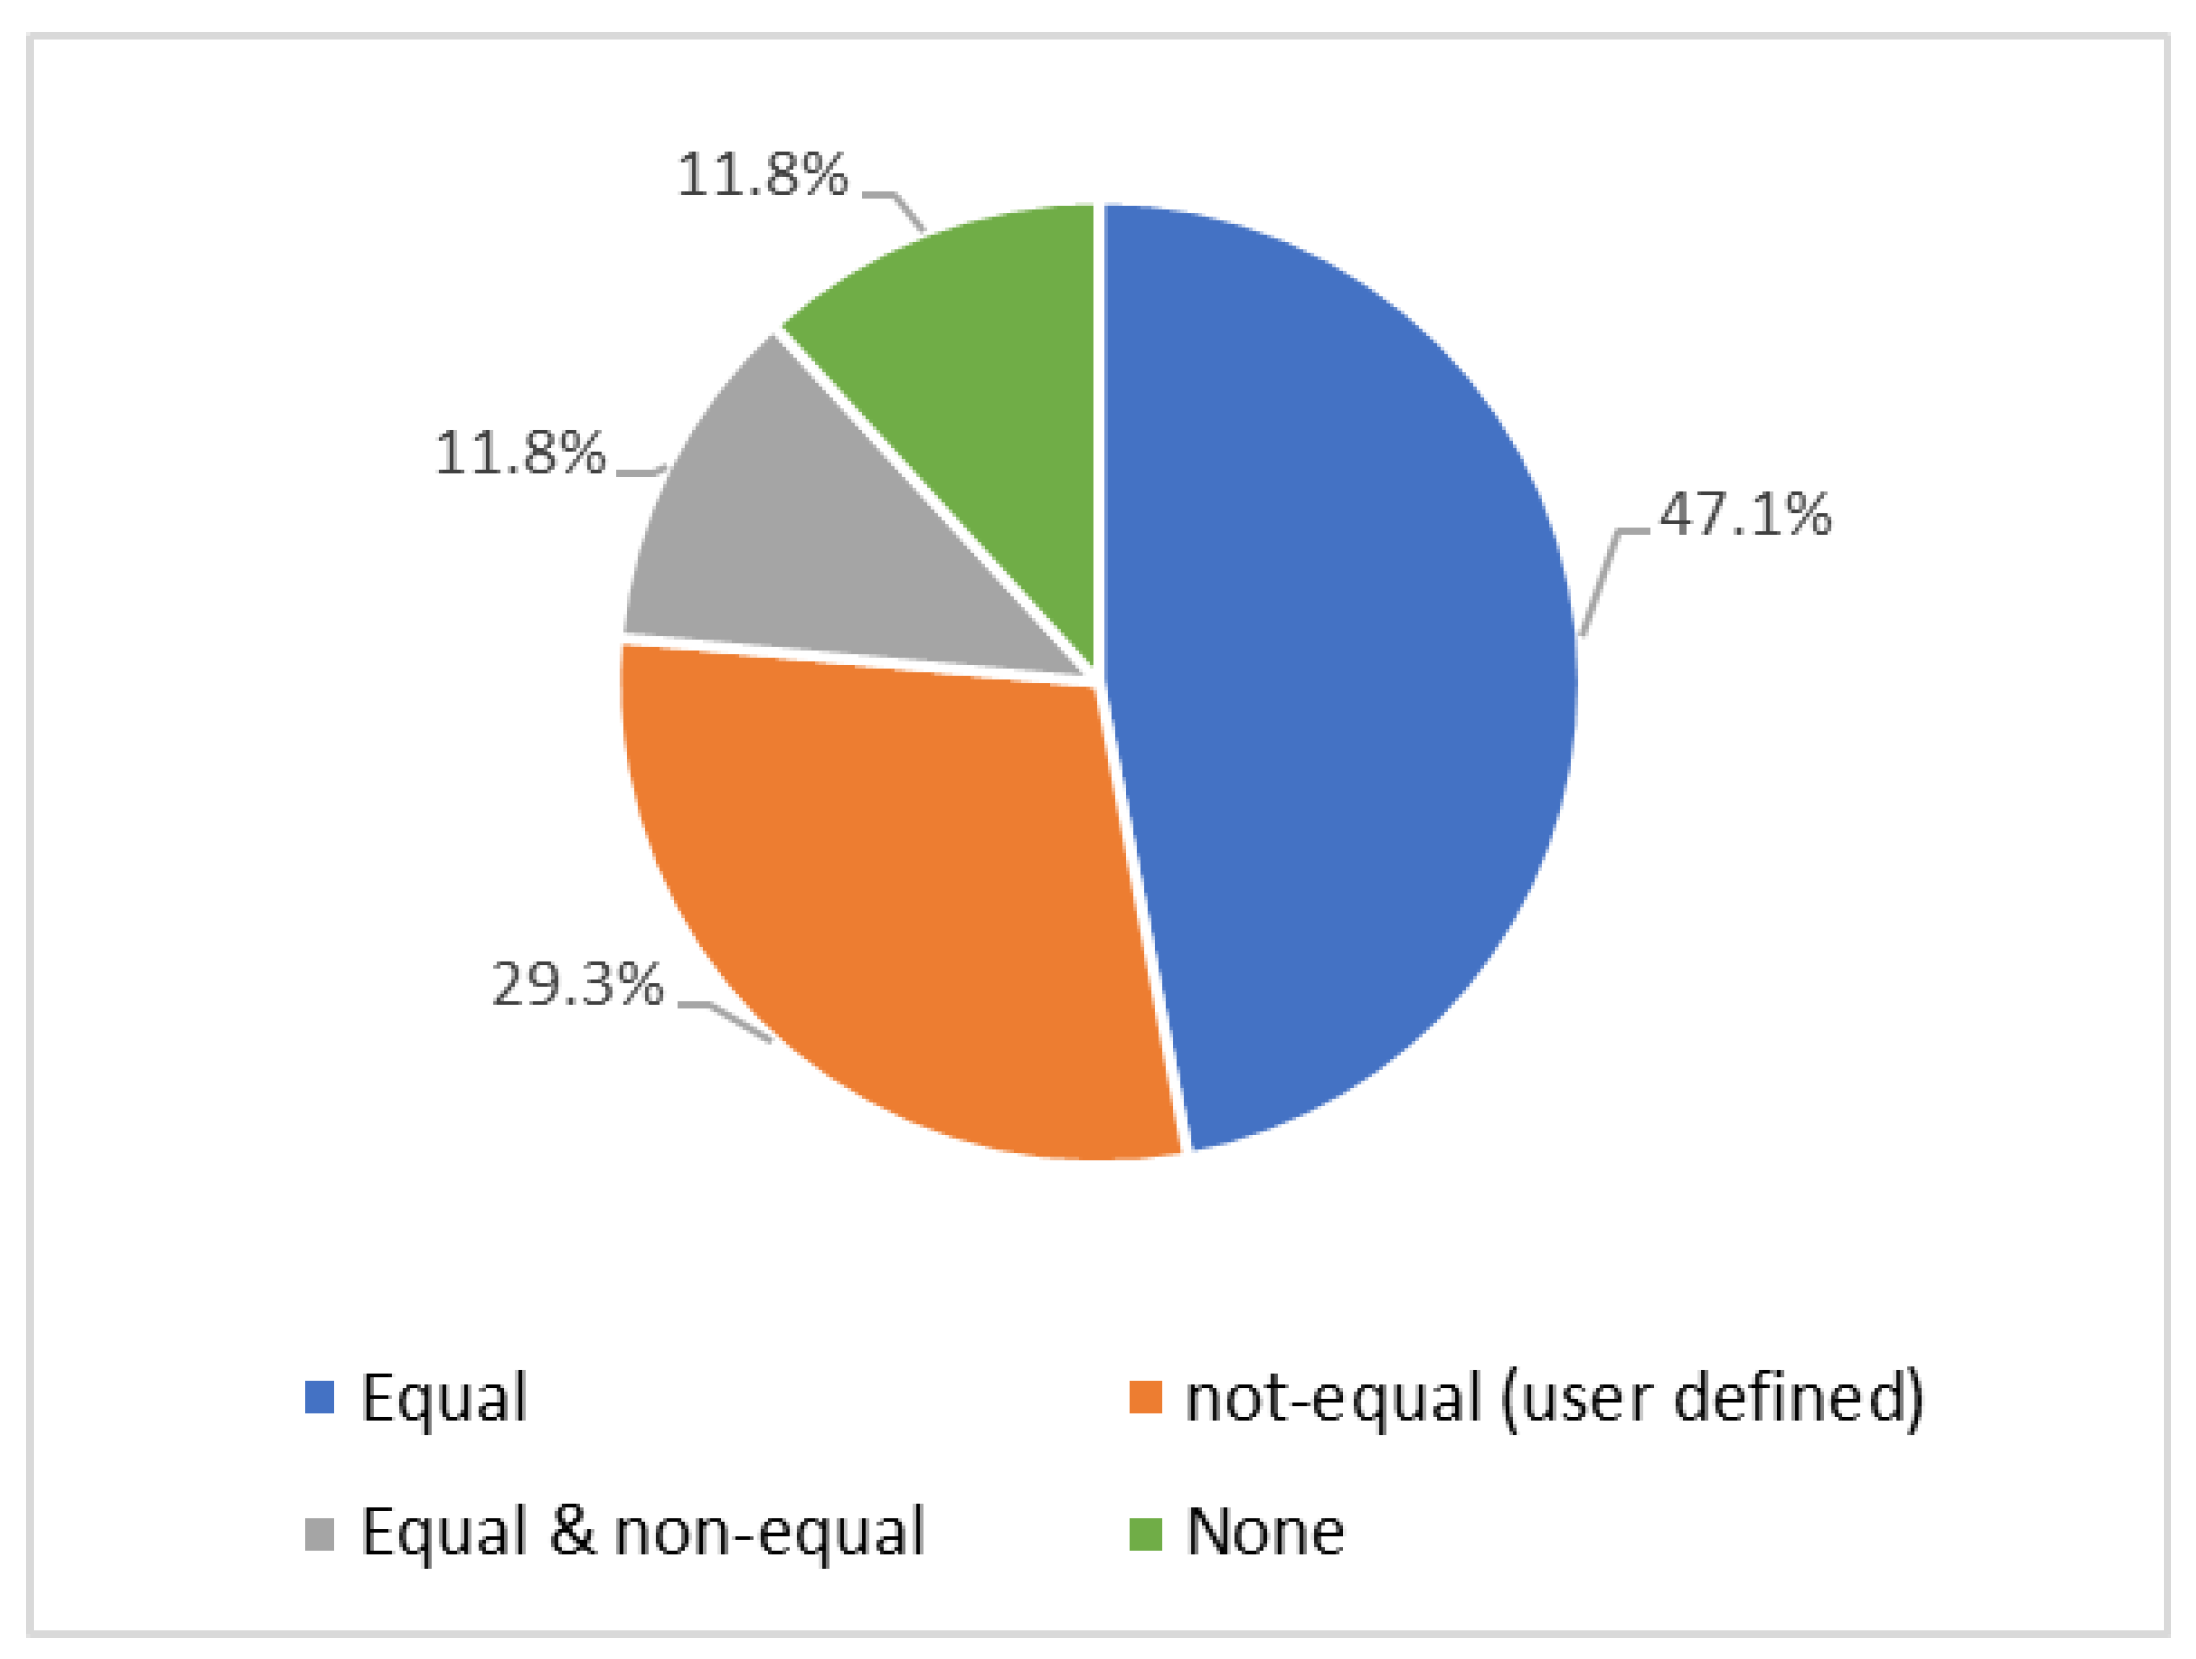
5.2.6. Weighting Process

The process of weighting indicators and components was seen in 15 of the 17 (90%) frameworks reviewed (Figure 8). Out of all the frameworks reviewed, the preference for allocating equal weights was dominant in eight studies [48,63,65,67,68,92,95,96] with a percentage of 47.1%. This aligns with the ethos of sustainability, which is about balancing, rather than trading off, respective pillars. Five studies [7,80,86,94,97] considered the non-equal weights (user-defined), with a percentage of 29.3% of the total. Only two frameworks [90,93] (11.8% of total) adopted a combination of both approaches.

5.2.7. Aggregation Technique and Final Index Value

The next element is the aggregation technique, which is used in combination with the weighting scheme in order to reach a final index value. Most frameworks [7,48,63,67,68,78,80,86,92,94,95,96,97] (i.e., 14 or 82.35%) relied on the arithmetic technique—calculating the average rescaling value of indicators. The geometric technique was used twice: one time alone [90] and the other in combination with the arithmetic technique [93]. In contrast, the WEF nexus framework [49] used neither aggregation technique nor final index value.
In Figure 9, it can be seen that the most widely adopted interval for the final index value (with 41.2% of total) was 0 and 100 [48,67,68,80,86,90,93]. Therefore, it can be suggested that this interval was the most preferred choice for both experts and stakeholders within the frameworks reviewed. The second most widely adopted interval for final index value (with 23.5% of total) was 0 and 1 [7,63,65,94]. The third most widely adopted interval for final index value (with 17.6% of total) was 1 to 5 [78,92,95]. A category called “other” was used to combine any final index value with a unique range that appeared once in the frameworks reviewed. This happened in only two indices [96,97] (11.8% of total). The last category called “without” for the WEF nexus framework [49] (5.9% of total), which does not have any final index value. Meanwhile, only the final assessment for each indicator (or criterion as they called it) is provided with a qualitative description in an individual assessment card without aggregating all indicators or components to get a single final value.

5.3. SWRM-AF for ASAR

After going through the systematic literature review, it was clear that no dedicated SWRM-AF had been explicitly made for or applied to ASAR—these areas lack any permanent rivers or river basins. That said, the frameworks reviewed in Section 5.1 and Section 5.2 had considerable use in being developed (in whole or part) for such purposes.
By furthering the scope of the review to the grey literature outside the two databases that were checked previously, another two additional frameworks were identified, namely the Arab Water Sustainability Index (AWSI) [98] and the Abu Dhabi Water Index (ADWI) [99]. Thus, an overview and brief analysis is provided in the following sections to check their effectiveness.

5.3.1. Arab Water Sustainability Index (AWSI)

The AWSI is presented as a monitoring tool to address the water sustainability state relative to a base condition or period [98]. The scale of its application could be considered a national scale. In this index, 22 Arab countries, where 82.2% of their weather is either arid or semi-arid, were evaluated through four main components that were divided into only eight indicators. These components can be classified by checking their indicators and main themes or categories from Figure 5, as follows:
  • water crowding (related to WRM category);
  • water dependency (related to SWRM category);
  • water scarcity (related to SWRM category);
  • environmental sustainability (related to socio-environmental category).
Based on our comparative analysis above, it can be said that four components are an adequate number; however, the number of indicators (eight only) is lower than the average number of indicators, which was found to be approximately 18. Other main elements of indicator-based framework were used, such as the benchmark, the aggregation technique (i.e., arithmetic), and the final index value ranging between 0 to 100%. The normalization method of AWSI is based on a statistical method (i.e., principal components analysis (PCA)), which was also used to assign weights, which were not equal, for each component and indicator. A unique advantage of AWSI is the consideration of conventional and non-conventional WR (e.g., GW and desalination water, respectively), which is crucial for ASAR.
Meanwhile, the continuous rescaling method as a normalization method was mentioned, but whether that was for application or just information was unclear. Overall, even though the pillars of sustainability were considered, the stakeholders’ participation in all phases did not exist in AWSI, which does not match the general guidance in developing such a framework. Therefore, to avoid such limitations, it is still required to have a more helpful framework that can gain public trust and cooperation.

5.3.2. Abu Dhabi Water Index (ADWI)

The other framework is the ADWI, which was developed through the adoption of the cause–effect approach (DSR—Driving force, State, Response) to deal with the challenging context of WRM of the United Arab Emirates (UAE) (i.e., very much at a local scale) [99]. The selection of indicators was based on a review of the literature, followed by checking of the availability of their data and whether they were relevant to the UAE environment. This process resulted in four categories (i.e., components), nineteen indicators, and twelve sub-indicators. Then, the benchmark for most of the indicators was obtained from the literature. These components with our main themes or categories from Figure 5 are as follows:
  • water availability (related to WRM category);
  • water quality (related to socio-environmental category);
  • water use efficiency (related to SWRM category);
  • policy and governance (related to policy & governance category).
Overall, the methodology for building ADWI was well-organized and systematically illustrated. In addition, taking the conventional and non-conventional WR into account is essential for the context of ASAR, which is another advantage similar to AWSI.
On the other hand, while considering all sustainability pillars in any SWRM-AF is significant, little attention was given here to the economic pillar. Additionally, ADWI seemed to lack any stakeholder participation or involvement. However, an indicator to measure the public participation in water activities existed, but it was based only on the researchers’ evaluation. Moreover, the normalization method seems to equate to categorical rescaling. Still, the scoring criteria were not entirely clear (i.e., all scores were either good, represented by happy face, or poor, represented by sad face, while only one seemed neutral).
Furthermore, the weighting scheme, aggregation technique, and final index value did not exist in this methodology, except for the calculation of sub-indicators. Therefore, it can be said that ADWI was an attempt to develop a particular framework for ASAR, but with many limitations. Hence, it is important to build or develop an SWRM-AF that could avoid these flaws and is suitable to fit the main requirements and contexts of ASAR by considering stakeholder participation. A summary of the main elements that form the above two SWRM-AFs is presented in Table 3 to make the process of comparing them simpler.

6. Discussion

This research sought to identify whether any existing SWRM-AF would be suitable for application in arid or semi-arid regions; by way of Section 6.1, this is explored further. Section 6.2 identifies the shortfalls of this research before the next steps of research are determined in Section 6.3.

6.1. Existing SWRM-AFs and Their Applicability for ASAR

The review has helped identify six key requirements that a framework would need in order for it to be considered appropriate for application in ASAR. In other words, they should:
  • adopt a participatory approach (i.e., stakeholder engagement) during the selection process of indicators and assigning weights;
  • have appropriate numbers of indicators;
  • include all seven primary elements of the indicator-based framework (Section 4.1, Section 4.2, Section 4.3, Section 4.4, Section 4.5, Section 4.6 and Section 4.7).
  • include water scarcity (WS) as a key theme;
  • consider all Water Resources (WR)—conventional and non-conventional;
  • fit with an ASAR context.
With this in mind, Table 4 provides a synthesis of the analysis to evaluate (by way of grading) the 19 frameworks, including those from the systematic review and the previous two SWRM-AFs found in the grey literature. All of the checking aspects are based on the six requirements mentioned above. The first three aspects (i.e., 1 to 3) are considered general but essential for inclusion in any SWRM-AF. The last three aspects (i.e., 4 to 6) are specific and considered vital to any SWRM-AF for ASAR. In Table 4, one point was assigned for each aspect included—based on its existence, except for the participatory approach, where a point was equally divided between the selection and weighting. Additionally, half of the maximum point was given if the aspect was either partially fulfilled or partially existed. This meant a maximum value of 6 could be achieved where a framework met all six criteria fully.
Table 4 shows that the highest total points was 4 out of 6, found in three frameworks (i.e., WPI, AWSI, and ADWI). While two of these frameworks were developed mainly for ASAR (i.e., AWSI and ADWI), there were some general requirements identifiable by a zero in the respective columns. In other words, this research showed that there is no SWRM-AF that could be considered fully fit-for-purpose for application in ASAR. Hence, steps should be taken to address this gap in knowledge (See Section 6.3).

6.2. Shortfalls of this Research

This review paper goes some way towards filling the gap in knowledge with respect to identifying whether an SWRM-AF for ASAR exists. However, it should be noted that the review was restricted to two well-known academic databases (i.e., Scopus and Engineering Village) in addition to the search terms and filtering process adopted herein. Broadening the review to other databases (e.g., Google Scholar and Research Gate, to name just two) may have identified more literature (including grey literature) beyond the two most applicable papers found. In addition, this research was very much focused on the derivation of the frameworks themselves, and not on the detailing (and usefulness) of individual indicators or the data availability enabling the actual measurement of their values. Hence, whilst the need for a new framework was identified by this review, more stages of research are required during its derivation (See Section 6.3).

6.3. Next Stage of Research

The next area of research will seek to develop a SWRM-AF for ASAR that satisfies all six aspects outlined in Section 6.1 In order to ensure it is both practical and meaningful for application, a conceptual framework for ASAR will be developed. This will involve some key steps:
  • providing a detailed map of all components, indicators and sub-indicators;
  • developing the methodology for selecting important indicators for each component;
  • justifying (by way of stakeholder engagement) indicators and weights adopted;
  • applying the framework to case studies (likely Kingdom of Saudi Arabia and elsewhere).
  • refining SWRM-AF based on user feedback.

7. Conclusions

The sustainability of water supply to match proper demand is crucial for any future planning for the WRM system. This strategy became more significant in areas with limited WR and located in ASAR with challenging water conditions. During the last few decades, many scientific meetings and recommendations were conducted and presented to tackle the WRM issues, such as the Brundtland’s definition, the Dublin principles, and the IWRM definition and principles. These efforts were the foundation for introducing guidance and criteria that led to the creation of several SWRM-Afs, such as those manifested above. However, it is essential to remember that sustainability does not mean focusing only on one pillar. Attaining a balance between the three pillars (i.e., environmental, social, economic) would generate the best results. This consideration should be accounted for during the development process of any tool that aims to improve and monitor sustainability progress. One of these tools is the indicator-based framework for assessing sustainability. Therefore, having specific and clear SWRM-AF to measure the level of SWRM would undoubtedly help improve the longevity of such vital resources.
Whilst many SWRM-AFs were developed for this purpose in the past, such as those described briefly in this review, it has been shown that they are insufficient to assess some ASAR. Moreover, even where frameworks have been developed specifically for ASAR, many shortfalls exist. That said, this review helps recognize the primary elements required to establish this type of framework. Moreover, detailed investigation and comparison among SWRM-AFs have helped identify similarities, differences, and limitations/knowledge gaps. As such, several recommendations are suggested based on the results of this review:
  • Before establishing or developing an SWRM-AF, it is important to consider and comply with the specific guidelines and criteria for having one. Otherwise, the output of this process would not be practical and rigorous enough.
  • Then, having all seven standard main elements of SWRM-AF clearly defined and justified during both the development and application stages will make the SWRM-AF less challenging to reapply in general. This includes its adoption by the scientific community and water authorities in regions with similar conditions. In contrast, ignoring some of these elements could reduce the whole benefit of the framework and make it obsolescent.
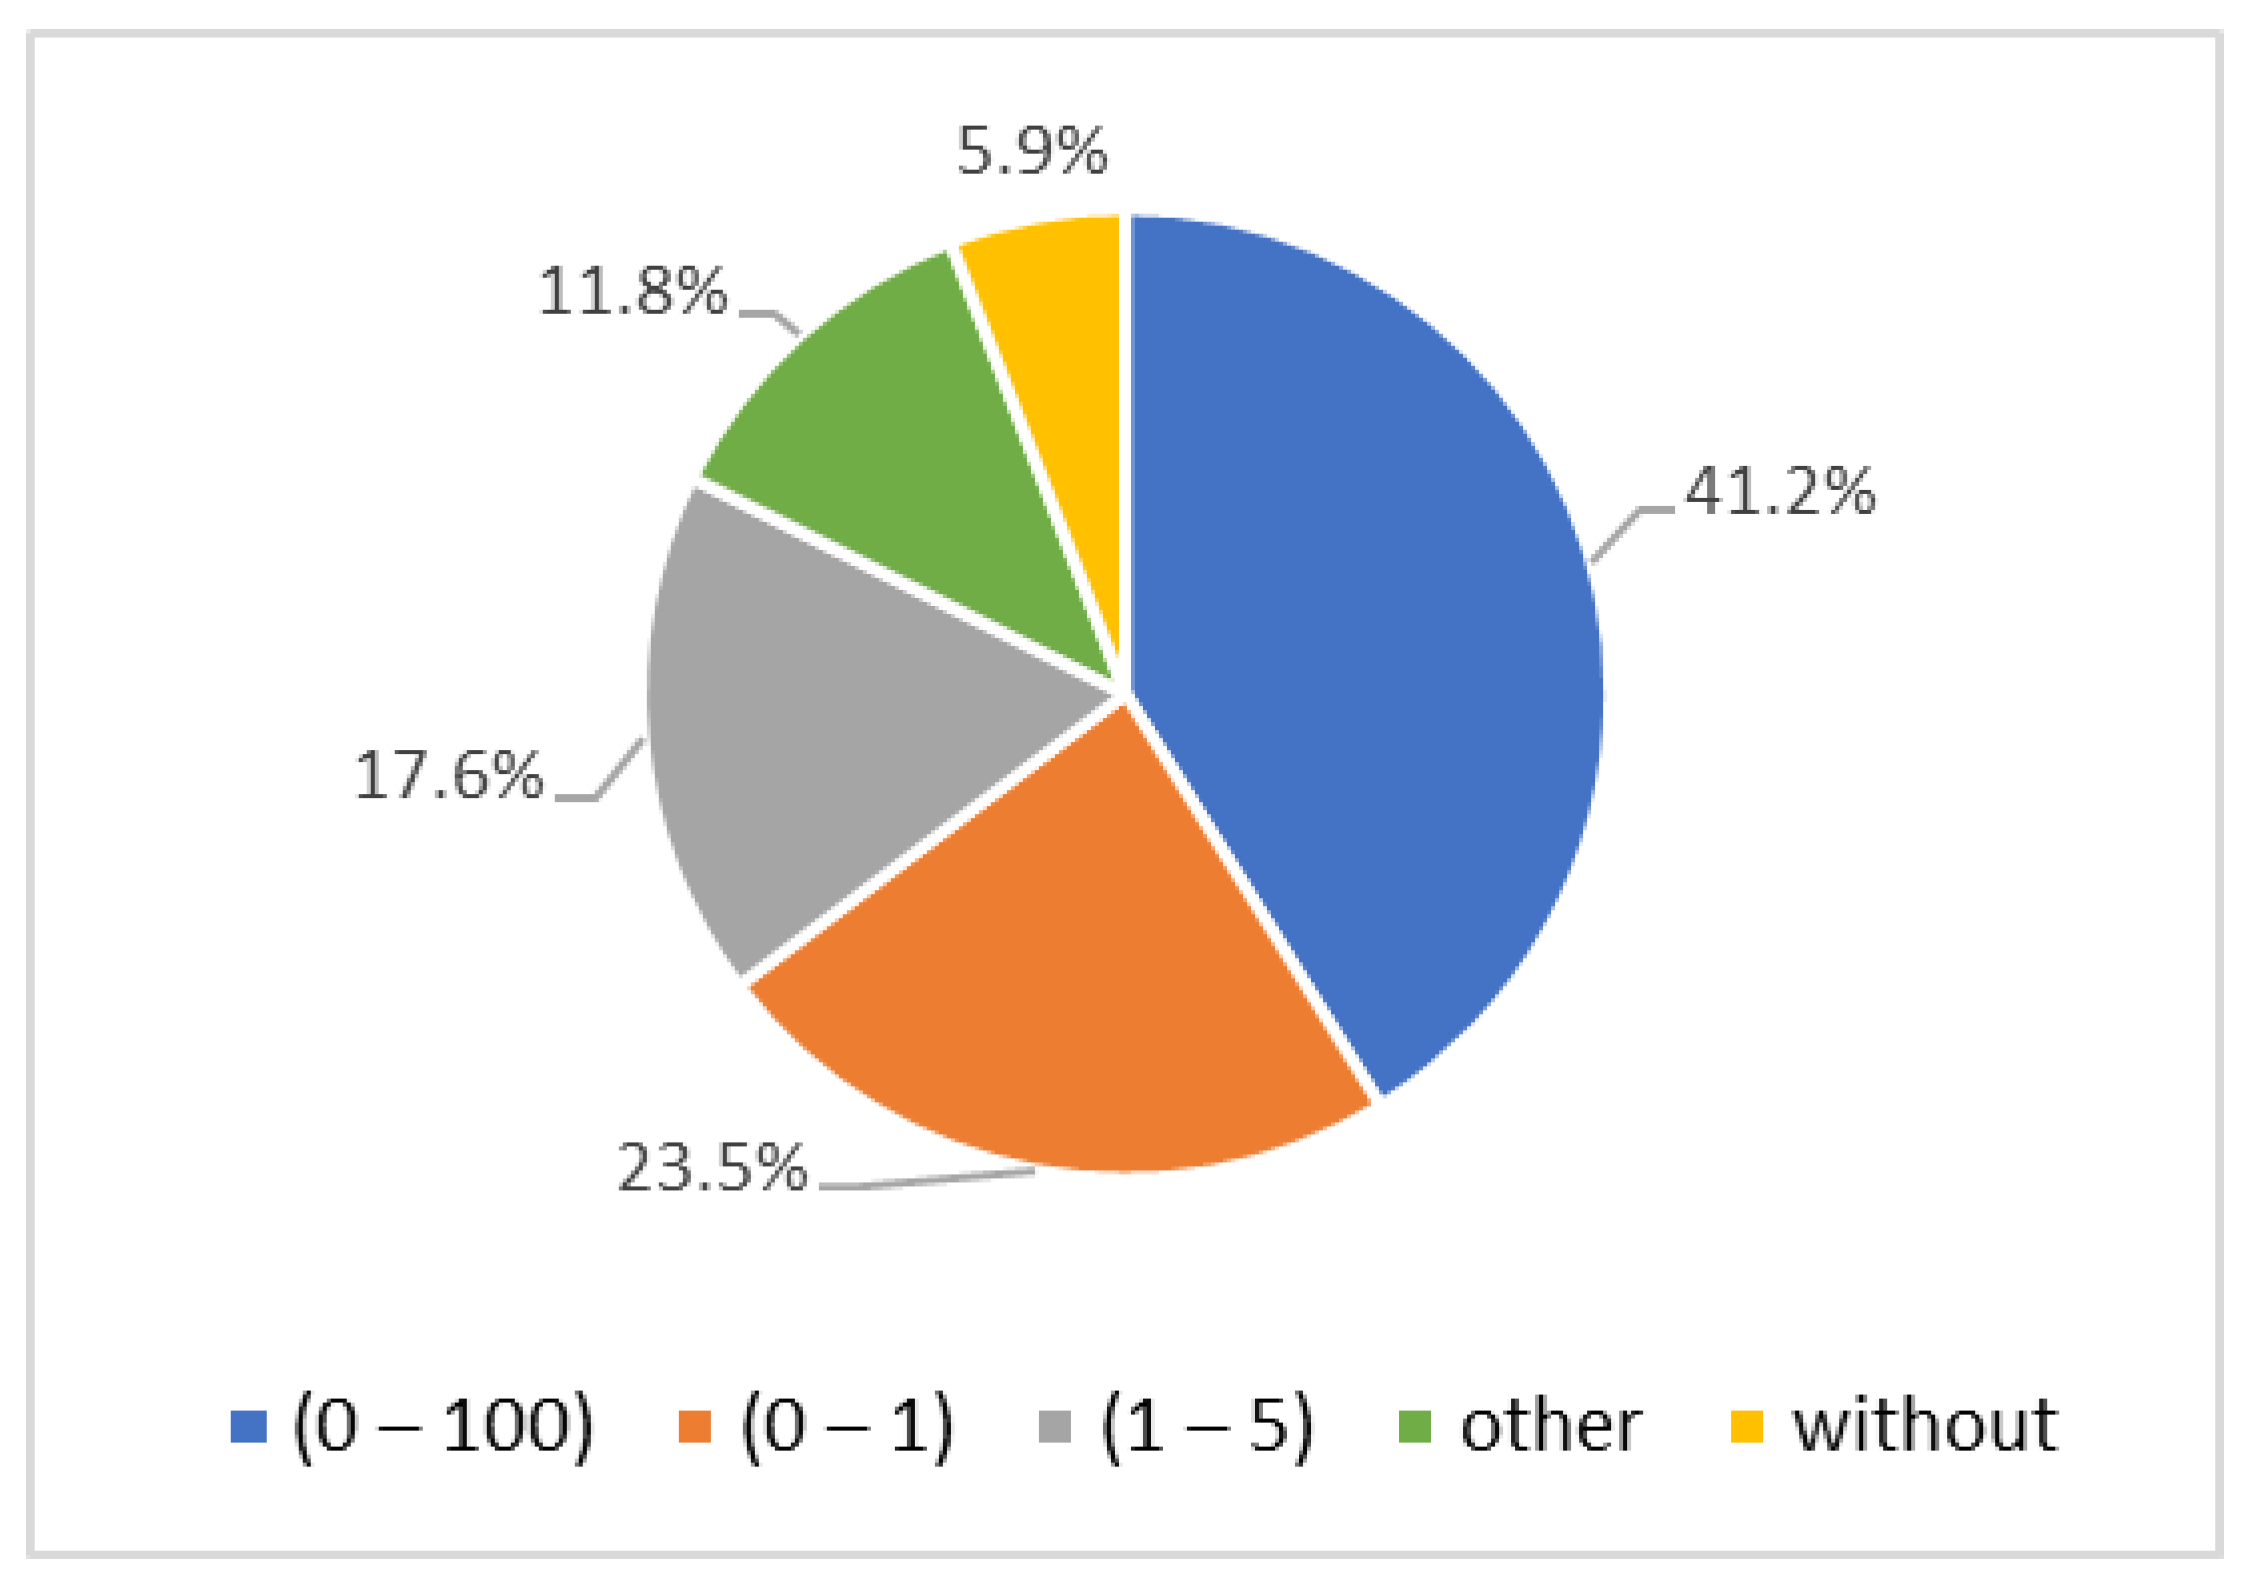
  • For any new SWRM-AF, it would be preferred to select elements and normalization methods with a higher application rate, such as those highlighted in Section 5.2. For example, while the application of local scale (52.8%) and the final index value of [0–100] (41.2%) seem more popular in many frameworks, categorical rescaling (47.1%), equal weighting (47.1%), and the arithmetic technique (82.35%) are the most commonly used normalization methods. Thus, choosing them might ensure more confidence in both decision-makers and the public in the output of such a framework.
  • The participation of stakeholders in developing SWRM-AF is essential, and helps reveal their main concerns. Their involvement could occur during the process of indicator selection, in the weighting stage, or in both stages. Hence, bias in the output of SWRM-AF can be eliminated or at least reduced, while motivation and awareness of SWRM among stakeholders would be higher. More importantly, this participation, especially by expert stakeholders, could be part of the validation for the SWRM-AF, making it more credible.
  • Finally, it was found that the SWRM-AF for ASAR for particular countries without any permanent rivers or lakes is needed, since water shortage conditions are a serious threat for these countries, and little or inadequate research has been conducted to develop such a tool.
Therefore, a conceptual SWRM-AF for ASAR is recommended to tackle this issue, and its development is currently underway.

Author Contributions

Conceptualization, B.S.A.; methodology, B.S.A.; investigation, B.S.A.; resources, B.S.A.; data curation, B.S.A.; writing—original draft preparation, B.S.A.; writing—review and editing, B.S.A., D.V.L.H., and S.S.; visualization, B.S.A.; supervision, D.V.L.H. and S.S.; project administration, D.V.L.H. All authors have read and agreed to the published version of the manuscript.

Funding

D.V.L.H. received the financial support of the UK EPSRC under grant EP/J017698/1 (Transforming the Engineering of Cities to Deliver Societal and Planetary Wellbeing, known as Livable Cities) and EP/P002021 (From Citizen to Co-innovator, from City Council to Facilitator: Integrating Urban Systems to Provide Better Outcomes for People, known as Urban Living Birmingham).

Institutional Review Board Statement

Not applicable.

Informed Consent Statement

Not applicable.

Data Availability Statement

Not applicable.

Acknowledgments

B.S.A. gratefully acknowledges the financial support of Qassim University in Saudi Arabia given to him during his doctoral studies.

Conflicts of Interest

The authors declare no conflict of interest.

Abbreviations

AbbreviationsNotations
ADWIAbu Dhabi Water Indexiindicator (or component)
AHPAnalytical hierarchy processIaggregated indicator (or component)
ASARArid and semi-Arid regionsjcriteria
AWSIArab Water Sustainability IndexNtotal number of indicators
CWSICanadian Water Sustainability IndexSsub-index value
CVIClimate Vulnerability Indexwweight
DSRDriving force, state, responseXactual value
FHIFreshwater Health IndexXmaxmaximum threshold value
GWGroundwaterXminminimum threshold value
GWSIGlobal Water Security IndexZcategory
IIWRMIndicators of integrated water resources management
IRBMIntegrated river basin management
IWRMIntegrated water resources management
MEMMunicipal environmental management
MIWABS Malaysia manufacturing industry water benchmarking system
NTUNephelometric turbidity units
PCAPrincipal components analysis
PTTProximity-to-target
RBWSIRiver basin water sustainability index
RWSIRural water sustainability index
SISustainability Index
SDGSustainable development goal
SWRMSustainable water resources management
SWRM-AFSustainable water resources management assessment framework
SWWASwedish Water and Wastewater Association
TBL-MCDAHybrid triple bottom line & multicriteria decision analysis
TSSTotal suspended solids
UAEUnited Arab Emirates
WASSIWater & Sanitation Sustainability Index
WEF nexusWater–energy–food nexus
WJWSIWest Java Water Sustainability Index
WNIWater Needs Index
WPIWater Poverty Index
WRWater resources
WRMWater resources management
WSCWater Sensitive Cities Index
WSIWatershed Sustainability Index

References

  1. UNDESA. World Population Prospects 2019: Highlights; Department of Economic and Social Affairs, Population Division: New York, NY, USA, 2019. [Google Scholar]
  2. Maslow, A.H. A Theory of Human Motivation. Psychol. Rev. 1943, 50, 370–396. [Google Scholar] [CrossRef] [Green Version]
  3. Maslow, A.H. Motivation and Personality; Motivation and personality; Harpers: Oxford, UK, 1954; p. xiv, 411. [Google Scholar]
  4. Falkenmark, M.; Lundqvist, J.; Widstrand, C. Macro-Scale Water Scarcity Requires Micro-Scale Approaches. Nat. Resour. Forum 1989, 13, 258–267. [Google Scholar] [CrossRef] [PubMed]
  5. Strayer, D.L.; Dudgeon, D. Freshwater Biodiversity Conservation: Recent Progress and Future Challenges. J. North Am. Benthol. Soc. 2010, 29, 344–358. [Google Scholar] [CrossRef] [Green Version]
  6. Mekonnen, M.M.; Hoekstra, A.Y. Four Billion People Facing Severe Water Scarcity. Sci. Adv. 2016, 2, e1500323. [Google Scholar] [CrossRef] [PubMed] [Green Version]
  7. Gain, A.K.; Giupponi, C.; Wada, Y. Measuring Global Water Security towards Sustainable Development Goals. Environ. Res. Lett. 2016, 11, 124015. [Google Scholar] [CrossRef]
  8. Şen, Z.; Al-Harithy, S.; As-Sefry, S.; Almazroui, M. Aridity and Risk Calculations in Saudi Arabian Wadis: Wadi Fatimah Case. Earth Syst. Environ. 2017, 1, 26. [Google Scholar] [CrossRef] [Green Version]
  9. Cirilo, J.A. Public Water Resources Policy for the Semi-Arid Region. Estud. Avançados 2008, 22, 61–82. [Google Scholar] [CrossRef] [Green Version]
  10. Jolly, I.D.; McEwan, K.L.; Holland, K.L. A Review of Groundwater–Surface Water Interactions in Arid/Semi-Arid Wetlands and the Consequences of Salinity for Wetland Ecology. Ecohydrology 2008, 1, 43–58. [Google Scholar] [CrossRef]
  11. Almazroui, M.; Islam, M.N.; Balkhair, K.S.; Şen, Z.; Masood, A. Rainwater Harvesting Possibility under Climate Change: A Basin-Scale Case Study over Western Province of Saudi Arabia. Atmos. Res. 2017, 189, 11–23. [Google Scholar] [CrossRef]
  12. Shomar, B.; Darwish, M.; Rowell, C. What Does Integrated Water Resources Management from Local to Global Perspective Mean? Qatar as a Case Study, the Very Rich Country with No Water. Water Resour. Manag. 2014, 28, 2781–2791. [Google Scholar] [CrossRef]
  13. Odhiambo, G.O. Water Scarcity in the Arabian Peninsula and Socio-Economic Implications. Appl. Water Sci. 2017, 7, 2479–2492. [Google Scholar] [CrossRef] [Green Version]
  14. Alyamani, M.S. Salinity Problem of Groundwater in the Wadi Tharad Basin, Saudi Arabia. GeoJournal 1999, 48, 291–297. [Google Scholar] [CrossRef]
  15. Kinzelbach, W.; Brunner, P.; von Boetticher, A.; Kgotlhang, L.; Milzow, C. Sustainable Water Management in Arid and Semi-Arid Regions. In Groundwater Modelling in Arid and Semi-Arid Areas; Wheater, H., Mathias, S., Li, X., Eds.; Cambridge University Press: Cambridge, UK, 2010; pp. 119–130. ISBN 978-051-176-028-0. [Google Scholar]
  16. Roberts, D.A.; Johnston, E.L.; Knott, N.A. Impacts of Desalination Plant Discharges on the Marine Environment: A Critical Review of Published Studies. Water Res. 2010, 44, 5117–5128. [Google Scholar] [CrossRef] [PubMed]
  17. Ghaffour, N.; Missimer, T.M.; Amy, G.L. Technical Review and Evaluation of the Economics of Water Desalination: Current and Future Challenges for Better Water Supply Sustainability. Desalination 2013, 309, 197–207. [Google Scholar] [CrossRef] [Green Version]
  18. Davies, P.A.; Yuan, Q.; Richter, R. de Desalination as a Negative Emissions Technology. Environ. Sci.: Water Res. Technol. 2018, 4, 839–850. [Google Scholar] [CrossRef] [Green Version]
  19. Vörösmarty, C.J.; Green, P.; Salisbury, J.; Lammers, R.B. Global Water Resources: Vulnerability from Climate Change and Population Growth. Science 2000, 289, 284–288. [Google Scholar] [CrossRef] [Green Version]
  20. Lobell, D.B.; Burke, M.B.; Tebaldi, C.; Mastrandrea, M.D.; Falcon, W.P.; Naylor, R.L. Prioritizing Climate Change Adaptation Needs for Food Security in 2030. Science 2008, 319, 607–610. [Google Scholar] [CrossRef]
  21. Blair, A.C.; Sanger, D.M.; Holland, A.F.; White, D.L.; Vandiver, L.A.; White, S.N. Stormwater Runoff—Modeling Impacts of Urbanization and Climate Change. In Proceedings of the American Society of Agricultural and Biological Engineers Annual International Meeting 2011, ASABE 2011, Louisville, KY, USA, 7–10 August 2011; Volume 6, pp. 4918–4933. [Google Scholar]
  22. Mujumdar, P.P. Climate Change: A Growing Challenge for Water Management in Developing Countries. Water Resour. Manag. 2013, 27, 953–954. [Google Scholar] [CrossRef] [Green Version]
  23. GWP-TAC. Background Paper No. 4. Integrated Water Resources Management; Technical Advisory Committee of Global Water Partnership: Stockholm, Sweden, 2000; p. 71. [Google Scholar]
  24. Hanjra, M.A.; Qureshi, M.E. Global Water Crisis and Future Food Security in an Era of Climate Change. Food Policy 2010, 35, 365–377. [Google Scholar] [CrossRef]
  25. Allouche, J. The Sustainability and Resilience of Global Water and Food Systems: Political Analysis of the Interplay between Security, Resource Scarcity, Political Systems and Global Trade. Food Policy 2011, 36, S3–S8. [Google Scholar] [CrossRef]
  26. Vörösmarty, C.J.; Pahl-Wostl, C.; Bunn, S.E.; Lawford, R. Global Water, the Anthropocene and the Transformation of a Science. Curr. Opin. Environ. Sustain. 2013, 5, 539–550. [Google Scholar] [CrossRef]
  27. Cuthbert, M.O.; Gleeson, T.; Moosdorf, N.; Befus, K.M.; Schneider, A.; Hartmann, J.; Lehner, B. Global Patterns and Dynamics of Climate–Groundwater Interactions. Nat. Clim. Change 2019, 9, 137–141. [Google Scholar] [CrossRef]
  28. ICWE. The Dublin Statement on Water and Sustainable Development; International Conference on Water and the Environment: Dublin, Ireland, 1992. [Google Scholar]
  29. Ni, X.; Wu, Y.; Wu, J.; Lu, J.; Wilson, P.C. Scenario Analysis for Sustainable Development of Chongming Island: Water Resources Sustainability. Sci. Total Environ. 2012, 439, 129–135. [Google Scholar] [CrossRef] [PubMed]
  30. de Castro, C.O.; Loureiro, Ó.C.S.; Santos, A.V.; Silva, J.; Rauen, W.B. Water sustainability assessment for the region of Curitiba. Int. J. Sustain. Build. Technol. Urban Dev. 2017, 8, 184–194. [Google Scholar] [CrossRef]
  31. WCED. Our Common Future; World Commission on Environment and Development; Oxford University Press: Oxford, UK, 1987; p. 300. [Google Scholar]
  32. Elkington, J. Cannibals with Forks: The Triple Bottom Line of 21st Century Business; Capstone: Oxford, UK, 1997; ISBN 978-190-096-127-1. [Google Scholar]
  33. United Nations. Transforming Our World: The 2030 Agenda for Sustainable Development; United Nations: New York, NY, USA, 2015. [Google Scholar]
  34. Basiago, A.D. Economic, Social, and Environmental Sustainability in Development Theory and Urban Planning Practice. Environmentalist 1998, 19, 145–161. [Google Scholar] [CrossRef]
  35. Stirling, A. The Appraisal of Sustainability: Some Problems and Possible Responses. Local Environ. 1999, 4, 111–135. [Google Scholar] [CrossRef]
  36. Lehtonen, M. The Environmental–Social Interface of Sustainable Development: Capabilities, Social Capital, Institutions. Ecol. Econ. 2004, 49, 199–214. [Google Scholar] [CrossRef]
  37. Gibson, R.B. Beyond the Pillars: Sustainability Assessment as a Framework for Effective Integration of Social, Economic and Ecological Considerations in Significant Decision-Making. J. Env. Assmt. Pol. Mgmt. 2006, 08, 259–280. [Google Scholar] [CrossRef]
  38. Kuhlman, T.; Farrington, J. What Is Sustainability? Sustainability 2010, 2, 3436–3448. [Google Scholar] [CrossRef] [Green Version]
  39. Purvis, B.; Mao, Y.; Robinson, D. Three Pillars of Sustainability: In Search of Conceptual Origins. Sustain. Sci. 2019, 14, 681–695. [Google Scholar] [CrossRef]
  40. UN. Overall Progress Achieved since the United Nations Conference on Environment and Development; Commission on sustainable development fifth session; United Nations: New York, NY, USA, 1997. [Google Scholar]
  41. Moldan, B.; Janoušková, S.; Hák, T. How to Understand and Measure Environmental Sustainability: Indicators and Targets. Ecol. Indic. 2012, 17, 4–13. [Google Scholar] [CrossRef]
  42. Maiolo, M.; Pantusa, D. Sustainable Water Management Index, SWaM_Index. Cogent Eng. 2019, 6, 1603817. [Google Scholar] [CrossRef]
  43. Juwana, I.; Muttil, N.; Perera, B.J.C. Indicator-Based Water Sustainability Assessment—A Review. Sci. Total Environ. 2012, 438, 357–371. [Google Scholar] [CrossRef] [PubMed] [Green Version]
  44. Bertule, M.; Bjørnsen, P.K.; Costanzo, S.D.; Escurra, J.; Freeman, S.; Gallagher, L.; Kelsey, R.H.; Vollmer, D. Using Indicators for Improved Water Resources Management: Guide for Basin Managers and Practitioners; 2017; ISBN 978-879-063-405-6. Available online: https://ian.umces.edu/site/assets/files/11189/using-indicators-for-improved-water-resources-management.pdf (accessed on 28 March 2022).
  45. Sullivan, C. Calculating a Water Poverty Index. World Dev. 2002, 30, 1195–1210. [Google Scholar] [CrossRef]
  46. Nardo, M.; Saisana, M.; Saltelli, A.; Tarantola, S.; Hoffman, A.; Giovannini, E. Handbook on Constructing Composite Indicators: Methodology and User Guide; OECD Publishing: Paris, France, 2005; No. 2005/03. [Google Scholar] [CrossRef]
  47. Streeten, P. Human Development: Means and Ends. Bangladesh Dev. Stud. 1994, 21, 65–76. [Google Scholar]
  48. Iribarnegaray, M.A.; D’Andrea, M.L.G.; Rodriguez-Alvarez, M.S.; Hernández, M.E.; Brannstrom, C.; Seghezzo, L. From Indicators to Policies: Open Sustainability Assessment in the Water and Sanitation Sector. Sustainability 2015, 7, 14537–14557. [Google Scholar] [CrossRef] [Green Version]
  49. Marttunen, M.; Mustajoki, J.; Sojamo, S.; Ahopelto, L.; Keskinen, M. A Framework for Assessing Water Security and the Water–Energy–Food Nexus—The Case of Finland. Sustainability 2019, 11, 2900. [Google Scholar] [CrossRef] [Green Version]
  50. Topal, H.F.; Hunt, D.V.L.; Rogers, C.D.F. Urban Sustainability and Smartness Understanding (USSU)—Identifying Influencing Factors: A Systematic Review. Sustainability 2020, 12, 4682. [Google Scholar] [CrossRef]
  51. Encyclopedia Britannica. Water Resource; Encyclopedia Britannica: Chicago, IL, USA, 2021. [Google Scholar]
  52. Gleick, P.; Gomez, S.; Loh, P.; Morrison, J. California Water 2020: A Sustainable Vision; Pacific Institute Report; Pacific Institute for Studies in Development, Environment, and Security: Oakland, CA, USA, 1995; p. 113. [Google Scholar]
  53. Cosgrove, W.J.; Loucks, D.P. Water Management: Current and Future Challenges and Research Directions. Water Resour. Res. 2015, 51, 4823–4839. [Google Scholar] [CrossRef] [Green Version]
  54. Ivanova, D.; Stadler, K.; Steen-Olsen, K.; Wood, R.; Vita, G.; Tukker, A.; Hertwich, E.G. Environmental Impact Assessment of Household Consumption. J. Ind. Ecol. 2016, 20, 526–536. [Google Scholar] [CrossRef]
  55. Joumard, R.; Nicolas, J.-P. Transport Project Assessment Methodology within the Framework of Sustainable Development. Ecol. Indic. 2010, 10, 136–142. [Google Scholar] [CrossRef]
  56. Bradley Guy, G.; Kibert, C.J. Developing Indicators of Sustainability: US Experience. Build. Res. Inf. 1998, 26, 39–45. [Google Scholar] [CrossRef]
  57. Loucks, D.P.; Gladwell, J.S. (Eds.) Sustainability Criteria for Water Resource Systems; UNESCO International Hydrology Series; Cambridge University Press: Cambridge, UK, 1999. [Google Scholar]
  58. Lundie, S.; Peters, G.; Ashbolt, N.; Lai, E.; Livingston, D. A Sustainability Framework for the Australian Water Industry. Water J. Aust. Water Assoc. 2006, 33, 83–88. [Google Scholar] [CrossRef]
  59. United Nations (Ed.) Indicators of Sustainable Development: Guidelines and Methodologies, 3rd ed.; United Nations: New York, NY, USA, 2007; ISBN 978-921-104-577-2. [Google Scholar]
  60. da Silva, J.; Fernandes, V.; Limont, M.; Rauen, W.B. Sustainable Development Assessment from a Capitals Perspective: Analytical Structure and Indicator Selection Criteria. J. Environ. Manag. 2020, 260, 110147. [Google Scholar] [CrossRef]
  61. Bell, S.; Morse, S. Sustainability Indicators: Measuring the Immeasurable, 2nd ed.; Earthscan: London, UK, 2008; ISBN 978-185-383-498-1. [Google Scholar]
  62. Hiremath, R.B.; Balachandra, P.; Kumar, B.; Bansode, S.S.; Murali, J. Indicator-Based Urban Sustainability—A Review. Energy Sustain. Dev. 2013, 17, 555–563. [Google Scholar] [CrossRef]
  63. Chaves, H.M.L.; Alipaz, S. An Integrated Indicator Based on Basin Hydrology, Environment, Life, and Policy: The Watershed Sustainability Index. Water Resour. Manag. 2007, 21, 883–895. [Google Scholar] [CrossRef]
  64. Juwana, I.; Muttil, N.; Perera, B.J.C. Application of West Java Water Sustainability Index to Three Water Catchments in West Java, Indonesia. Ecol. Indic. 2016, 70, 401–408. [Google Scholar] [CrossRef]
  65. da Silva, J.; Fernandes, V.; Limont, M.; Dziedzic, M.; Andreoli, C.V.; Rauen, W.B. Water Sustainability Assessment from the Perspective of Sustainable Development Capitals: Conceptual Model and Index Based on Literature Review. J. Environ. Manag. 2020, 254, 109750. [Google Scholar] [CrossRef]
  66. Juwana, I. Development of a Water Sustainability Index for West Java, Indonesia. Ph.D. Thesis, Victoria University, Footscray, VIC, Australia, 2012. [Google Scholar]
  67. Lawrence, P.; Meigh, J.; Sullivan, C. The Water Poverty Index:An International Comparison; Keele Economics Research Papers; Centre for Economic Research, Keele University: Keele, UK, 2002; revised March 2003. [Google Scholar]
  68. Policy Research Initiative. Canadian Water Sustainability Index (CWSI): Project Report; Policy Research Initiative: Ottawa, ON, Canada, 2007; ISBN 978-066-245-045-0. [Google Scholar]
  69. Liverman, D.M.; Hanson, M.E.; Brown, B.J.; Merideth, R.W. Global Sustainability: Toward Measurement. Environ. Manag. 1988, 12, 133–143. [Google Scholar] [CrossRef]
  70. Sullivan, C.A.; Meigh, J.R.; Giacomello, A.M. The Water Poverty Index: Development and Application at the Community Scale. Nat. Resour. Forum 2003, 27, 189–199. [Google Scholar] [CrossRef]
  71. Parnian, A.; Furze, J.N.; Parnian, A.; Mayad, E.H. Water Purification Plantations for Oil and Gas Industries in Iran. Environ. Sci. Pollut. Res. 2021, 28, 64193–64198. [Google Scholar] [CrossRef] [PubMed]
  72. Shilling, F. The California Water Sustainability Indicators Framework: Draft Final Report; 2013; p. 309. Available online: https://aquadoc.typepad.com/files/cwp_sif_phase-ii_draft_final_report_dec2013.pdf (accessed on 28 March 2022).
  73. Hashimoto, T.; Stedinger, J.R.; Loucks, D.P. Reliability, Resiliency, and Vulnerability Criteria for Water Resource System Performance Evaluation. Water Resour. Res. 1982, 18, 14–20. [Google Scholar] [CrossRef] [Green Version]
  74. Loucks, D.P. Quantifying Trends in System Sustainability. Hydrol. Sci. J. 1997, 42, 513–530. [Google Scholar] [CrossRef]
  75. McMahon, T.A.; Adeloye, A.J.; Zhou, S.-L. Understanding Performance Measures of Reservoirs. J. Hydrol. 2006, 324, 359–382. [Google Scholar] [CrossRef]
  76. Sandoval-Solis, S.; McKinney, D.C.; Loucks, D.P. Sustainability Index for Water Resources Planning and Management. J. Water Resour. Plan. Manag. 2011, 137, 381–390. [Google Scholar] [CrossRef] [Green Version]
  77. Rijke, J.; Farrelly, M.; Brown, R.; Zevenbergen, C. Configuring Transformative Governance to Enhance Resilient Urban Water Systems. Environ. Sci. Policy 2013, 25, 62–72. [Google Scholar] [CrossRef]
  78. Rogers, B.C.; Dunn, G.; Hammer, K.; Novalia, W.; de Haan, F.J.; Brown, L.; Brown, R.R.; Lloyd, S.; Urich, C.; Wong, T.H.F.; et al. Water Sensitive Cities Index: A Diagnostic Tool to Assess Water Sensitivity and Guide Management Actions. Water Res. 2020, 186, 116411. [Google Scholar] [CrossRef]
  79. Swamee, P.K.; Tyagi, A. Describing Water Quality with Aggregate Index. J. Environ. Eng. 2000, 126, 451–455. [Google Scholar] [CrossRef]
  80. Bahar, N.S.; Noor, Z.Z.; Aris, A.; Kamaruzaman, N.A.B. An Indicator Framework Approach on Manufacturing Water Assessment towards Sustainable Water Demand Management. J. Environ. Treat. Tech. 2020, 8, 875–883. [Google Scholar]
  81. Xie, M. Integrated Water Resources Management (IWRM)—Introduction to Principles and Practices. In Proceedings of the Africa Regional Workshop on IWRM, Nairobi, Kenya, 29 October 29–3 November 2006. [Google Scholar]
  82. Mostert, E.; Craps, M.; Pahl-Wostl, C. Social Learning: The Key to Integrated Water Resources Management? Water Int. 2008, 33, 293–304. [Google Scholar] [CrossRef] [Green Version]
  83. Giordano, M.; Shah, T. From IWRM Back to Integrated Water Resources Management. Int. J. Water Resour. Dev. 2014, 30, 364–376. [Google Scholar] [CrossRef]
  84. Attari, J.; Mojahedi, S.A. Water Sustainability Index: Application of CWSI for Ahwaz County. In Proceedings of the World Environmental and Water Resources Congress 2009, Kansas City, MO, USA, 17–21 May 2009; Volume 342, pp. 1664–1670. [Google Scholar]
  85. Moglia, M.; Nguyen, M.N.; Neumann, L.E.; Cook, S.; Nguyen, T.H. Integrated Assessment of Water Management Strategies: Framework and Case Study. In Proceedings of the 20th International Congress on Modelling and Simulation, MODSIM 2013, Adelaide, SA, Australia, 1–6 December 2013; pp. 2262–2268. [Google Scholar]
  86. Moglia, M.; Neumann, L.E.; Alexander, K.S.; Nguyen, M.N.; Sharma, A.K.; Cook, S.; Trung, N.H.; Tuan, D.D.A. Application of the Water Needs Index: Can Tho City, Mekong Delta, Vietnam. J. Hydrol. 2012, 468–469, 203–212. [Google Scholar] [CrossRef] [Green Version]
  87. Guppy, L.; Mehta, P.; Qadir, M. Sustainable Development Goal 6: Two Gaps in the Race for Indicators. Sustain. Sci. 2019, 14, 501–513. [Google Scholar] [CrossRef]
  88. Lee, J.; McNeil, S.; Li, Q. “Joshua” Development of a Water Infrastructure Performance Index for the USA. In Proceedings of the World Environmental and Water Resources Congress 2019, Pittsburgh, PA, USA, 19–23 May 2009; pp. 424–431. [Google Scholar] [CrossRef]
  89. Kanakoudis, V.; Tsitsifli, S.; Samaras, P.; Zouboulis, A.; Banovec, P. A New Set of Water Losses-Related Performance Indicators Focused on Areas Facing Water Scarcity Conditions. Desalination Water Treat. 2013, 51, 2994–3010. [Google Scholar] [CrossRef]
  90. Juwana, I.; Perera, B.J.C.; Muttil, N. A Water Sustainability Index for West Java. Part 1: Developing the Conceptual Framework. Water Sci. Technol. 2010, 62, 1629–1640. [Google Scholar] [CrossRef]
  91. Juwana, I.; Perera, B.J.C.; Muttil, N. A Water Sustainability Index for West Java—Part 2: Refining the Conceptual Framework Using Delphi Technique. Water Sci. Technol. 2010, 62, 1641–1652. [Google Scholar] [CrossRef] [Green Version]
  92. Cole, J.; Sharvelle, S.; Fourness, D.; Grigg, N.; Roesner, L.; Haukaas, J. Centralized and Decentralized Strategies for Dual Water Supply: Case Study. J. Water Resour. Plan. Manag. 2018, 144, 05017017. [Google Scholar] [CrossRef]
  93. Vollmer, D.; Shaad, K.; Souter, N.J.; Farrell, T.; Dudgeon, D.; Sullivan, C.A.; Fauconnier, I.; MacDonald, G.M.; McCartney, M.P.; Power, A.G.; et al. Integrating the Social, Hydrological and Ecological Dimensions of Freshwater Health: The Freshwater Health Index. Sci. Total Environ. 2018, 627, 304–313. [Google Scholar] [CrossRef]
  94. Criollo, R.; Malheiros, T.; Alfaro, J.F. Municipal Environmental Management Indicators: A Bottom-Up Approach Applied to the Colombian Context. Soc. Indic. Res. 2019, 141, 1037–1054. [Google Scholar] [CrossRef]
  95. Ben-Daoud, M.; Moumen, A.; Sayad, A.; Elbouhadioui, M.; Essahlaoui, A.; Eljaafari, S. Indicators of Integrated Water Resources Management at the Local Level: Meknes as a Case (Morocco). In Proceedings of the E3S Web of Conferences, Kenitra, Morocco, 25–27 December 2021; Volume 234. [Google Scholar]
  96. Najar, N.; Persson, K.M. A Sustainability Index within Water and Wastewater Management in Sweden: An Evaluation of Eight Case Studies. Water 2021, 13, 1879. [Google Scholar] [CrossRef]
  97. Crispim, D.L.; Pimentel Da Silva, G.D.; Fernandes, L.L. Rural Water Sustainability Index (RWSI): An Innovative Multicriteria and Participative Approach for Rural Communities. Impact Assess. Proj. Apprais. 2021, 39, 320–334. [Google Scholar] [CrossRef]
  98. Ali, H.M.M. Development of Arab Water Sustainability Index Using Principal Component Analysis. In Proceedings of the IWTC13, Hurghada, Egypt, 12–15 March 2009. [Google Scholar]
  99. Alsalmi, H.; Elkadi, H.A.; Leao, S. Urban Growth in Arid Environments: Developing Water Sustainability Indicators for Abu Dhabi (UAE). In Proceedings of the 6th Making Cities Liveable Conference, in Conjunction with the Sustainable Transformation Conference, Melbourne, VIC, Australia, 17–19 June 2013. [Google Scholar]
Figure 1. The selection process for articles.
Sustainability 14 15293 g001
Figure 2. A visual example of the main parts that form an index/framework.
Sustainability 14 15293 g002
Figure 3. Total number of components used in each framework.
Sustainability 14 15293 g003
Figure 4. Number of most repeated-words in the titles of components.
Sustainability 14 15293 g004
Figure 5. Main themes of components based on their repeated number.
Sustainability 14 15293 g005
Figure 6. Scale of Application.
Sustainability 14 15293 g006
Figure 7. Percentage of Normalization Method.
Sustainability 14 15293 g007
Figure 8. Percentage of Weighting Scheme.
Sustainability 14 15293 g008
Figure 9. Interval of Final Index Value.
Sustainability 14 15293 g009
Table 2. Summary of why and how the existing SWRM-AFs have been developed with pros and cons.
Acronym
[Reference]
PurposeSelection Process for IndicatorsStakeholders InvolvedAdvantageDisadvantage
WPI
[67]
To find the relation between the water availability or scarcity impacts on the welfare level of human populations among 147 countriesLiterature review then
stakeholder opinion
Physical & social experts, academics, practitioners,
others
Good range of stakeholders,
helpful for general comparisons
General nature (or base) of indicators can neglect internal important issues related to the context of specific regions
CWSI
[68]
To evaluate water sustainability and well-being in Canadian communities concerning freshwaterLiterature review then
stakeholder workshop
Government officials, academics, consultantsParticipatory method with stakeholders in refining the selected indicatorsDeveloped only for communities that depend on river basins
WSI
[63]
To combine the treatment of the three pillars of sustainability within an integrated and dynamic processLiterature reviewNoneEqual weighting of indicators to ensure mutual respect among all sectorsNo stakeholder engagement,
developed only for river basins
WJWSI
[90,91]
To identify main factors help improving WR, to assist in prioritize issues of WRM, and to communicate current condition of WR to communityLiterature review then
conceptual framework, then Delphi application & stakeholders’ interview
Academics,
consultants,
government officials, community representatives
Participatory method with stakeholders in refining the selected indicators,
good range of stakeholders
Developed for river basins particularly in Indonesia,
unclear way of combination of normalization methods
WNI
[86]
To pinpoint persistent water problems and hotspots that local water authorities should addressLiterature review then
stakeholder workshop
Academics,
government
officials
Participatory method with stakeholders in refining the selected indicators & assigning weights for components onlyIndicator weightings assigned by researchers alone, component of aquatic ecosystems is specific for surface water
WASSI
[48]
Developed as a tool to support governance procedures for more SWRM, applied to four cities in northern ArgentinaDeveloped in collaboration with the provincial water companyGovernment
officials,
water Company
Helpful in comparing level of SWRM among cities,
new information/data easily uploaded to web-interface
Website in Spanish,
only one stakeholder group involved in the indicator selection process
GWSI
[7]
To integrate physical and socio-economic aspects of security within a SWRM indexLiterature reviewNoneHelpful for general comparisons,
water security evaluation maps are well developed
General nature (or base) of indicators because of global scale,
no stakeholder engagement
TBL-MCDA
[92]
To evaluate the pillars (lenses) of sustainability related to using alternative water supply strategies versus maintaining the conventional system.Developed in collaboration with technical experts & stakeholdersTechnical experts, city departments, non-profit organization Good range of stakeholders,
performance indicators used with stakeholder preferences to support decision-making
Unclear if literature review used,
Indicator number too large to be implemented in practical way,
no final index value calculated.
FHI
[93]
To integrate the multiple social, ecological, and governance dimensions toward the sustainability of freshwater management.Literature review then
scientific workshops & stakeholder opinion
Scientific experts,
local stakeholders
Stakeholder engagement—include for indicator selection and partially in weightingsNo final index value calculated.
Developed for river basins
WEF nexus
[49]
To evaluate water security and its trends in the future through a participatory process, and to analyse connections with water, energy, and food security in FinlandLiterature review then
stakeholder workshop
Academics,
government officials, security
organizations
Stakeholder engagement,
high-level interviews,
excel tool with different sheets
Highly qualitative,
missed three main elements,
difficult to use in other contexts/settings
MEM
[94]
To create, as a bottom-up approach, a WRM that can measure local government administrations’ dedication to sustainabilityLiterature review & stakeholder opinion then Interviews and online surveysAcademics,
government & municipal officials, social organizations
Participatory method with stakeholders in refining the selected indicators and weights,
Results published in a website
Environmental focus,
large number of indicators that needed aggregation
RBWSI
[65]
To evaluate and guide the decision-making process in promoting water sustainability as part of integrated river basin management (IRBM)Literature interrogationNoneLiterature reviewed using an inductive approachNo stakeholder engagement,
large number of sub-indicators that needed aggregation, developed for river basins
WSC
[78]
To evaluate a city’s water sensitivity, create aspirational goals, and guide management actions to enhance water-sensitive processesLiterature review then consultation with stakeholdersIndustry experts,
academics
Participatory method for developing indicators and scoring systemHigh number of indicators, weightings seem ambiguous, no final index value
MIWABS
[80]
To evaluate the industrial sector’s water performance within a factory-level scale in MalaysiaLiterature review then stakeholder workshop to screen & filterIndustry experts,
academics
Weighting used analytical hierarchy process (AHP) applied to questionnaire outputMethod for aggregation not reported, scale applicable to factory alone
IIWRM
[95]
To produce an indicator-based framework to evaluate the application of IWRM within Meknes city, MoroccoLiterature review then survey of stakeholder via questionnairesGovernment officials (water sector actors), practitionersEasy to interpret radar diagram used for displaying resultsNo evidence/justification for calculations or weighting scheme provided
SI
[96]
To evaluate and guide Sweden’s municipal water and wastewater sectors to be more sustainableSwedish Water and Wastewater Association (SWWA) developed frameworkMembers of SWWA,
water utilities of the municipalities
Annual survey—rigorously developed and well-written, simply to use/understand, results published in a web-based databaseHigh number of sub-indicators,
yearly application would have huge time, resource implications
RWSI
[97]
To help decision-makers in the process of finding and prioritizing rural communities that need state intervention with regard to water provisionLiterature review then Delphi method via questionnaires to stakeholdersPolicymakers,
technicians,
experts, others
Participatory method with stakeholders in refining the selected indicators and weightsHigh number of indicators,
mostly applicable to rural communities
Table 3. Summary and comparison of existing SWRM-AF for ASAR.
SWRM-AFNumber of indicatorsBenchmarkScale
[Location]
NormalizationWeighting SchemeAggregation Tech.Final Index Value
ComponentIndicatorS. Indicator
AWSI48×yesNational
[Arab countries]
Principal components analysisNon-equalArithmetic0–100
ADWI41912yesLocal
[UAE]
Categorical rescaling×××
Table 4. Evaluation of the applicability of each SWRM-AF for ASAR.
SWRM-AFParticipatory ApproachNumber of
Indicators
7 Main
Elements
Water
Scarcity
All WRFit ASARTotal
SelectionWeighting
WPI0.5011100.54
CWSI0.50111003.5
WSI00110002
WJWSI0.50111003.5
WNI0.50.25110002.75
WASSI0.50111003.5
GWSI00.2511100.53.75
TBL-MCDA0.50.2500.50001.25
FHI0.50.2510.50002.25
WEF nexus0.50100001.5
MEM0.50.5010002
RBWSI00011002
WSC0.50.2500.5000.51.75
MIWABS0.50.5110003
IIWRM0.50110002.5
SI0.5011000.53
RWSI0.50.501100.53.5
AWSI00011114
ADWI00101114
Publisher’s Note: MDPI stays neutral with regard to jurisdictional claims in published maps and institutional affiliations.

