
Sustainable Agriculture and Rural Poverty Eradication in Pakistan: The Role of Foreign Aid and Government Policies

 ,
,  ,
,
Abstract
:1. Introduction
2. Materials and Methods
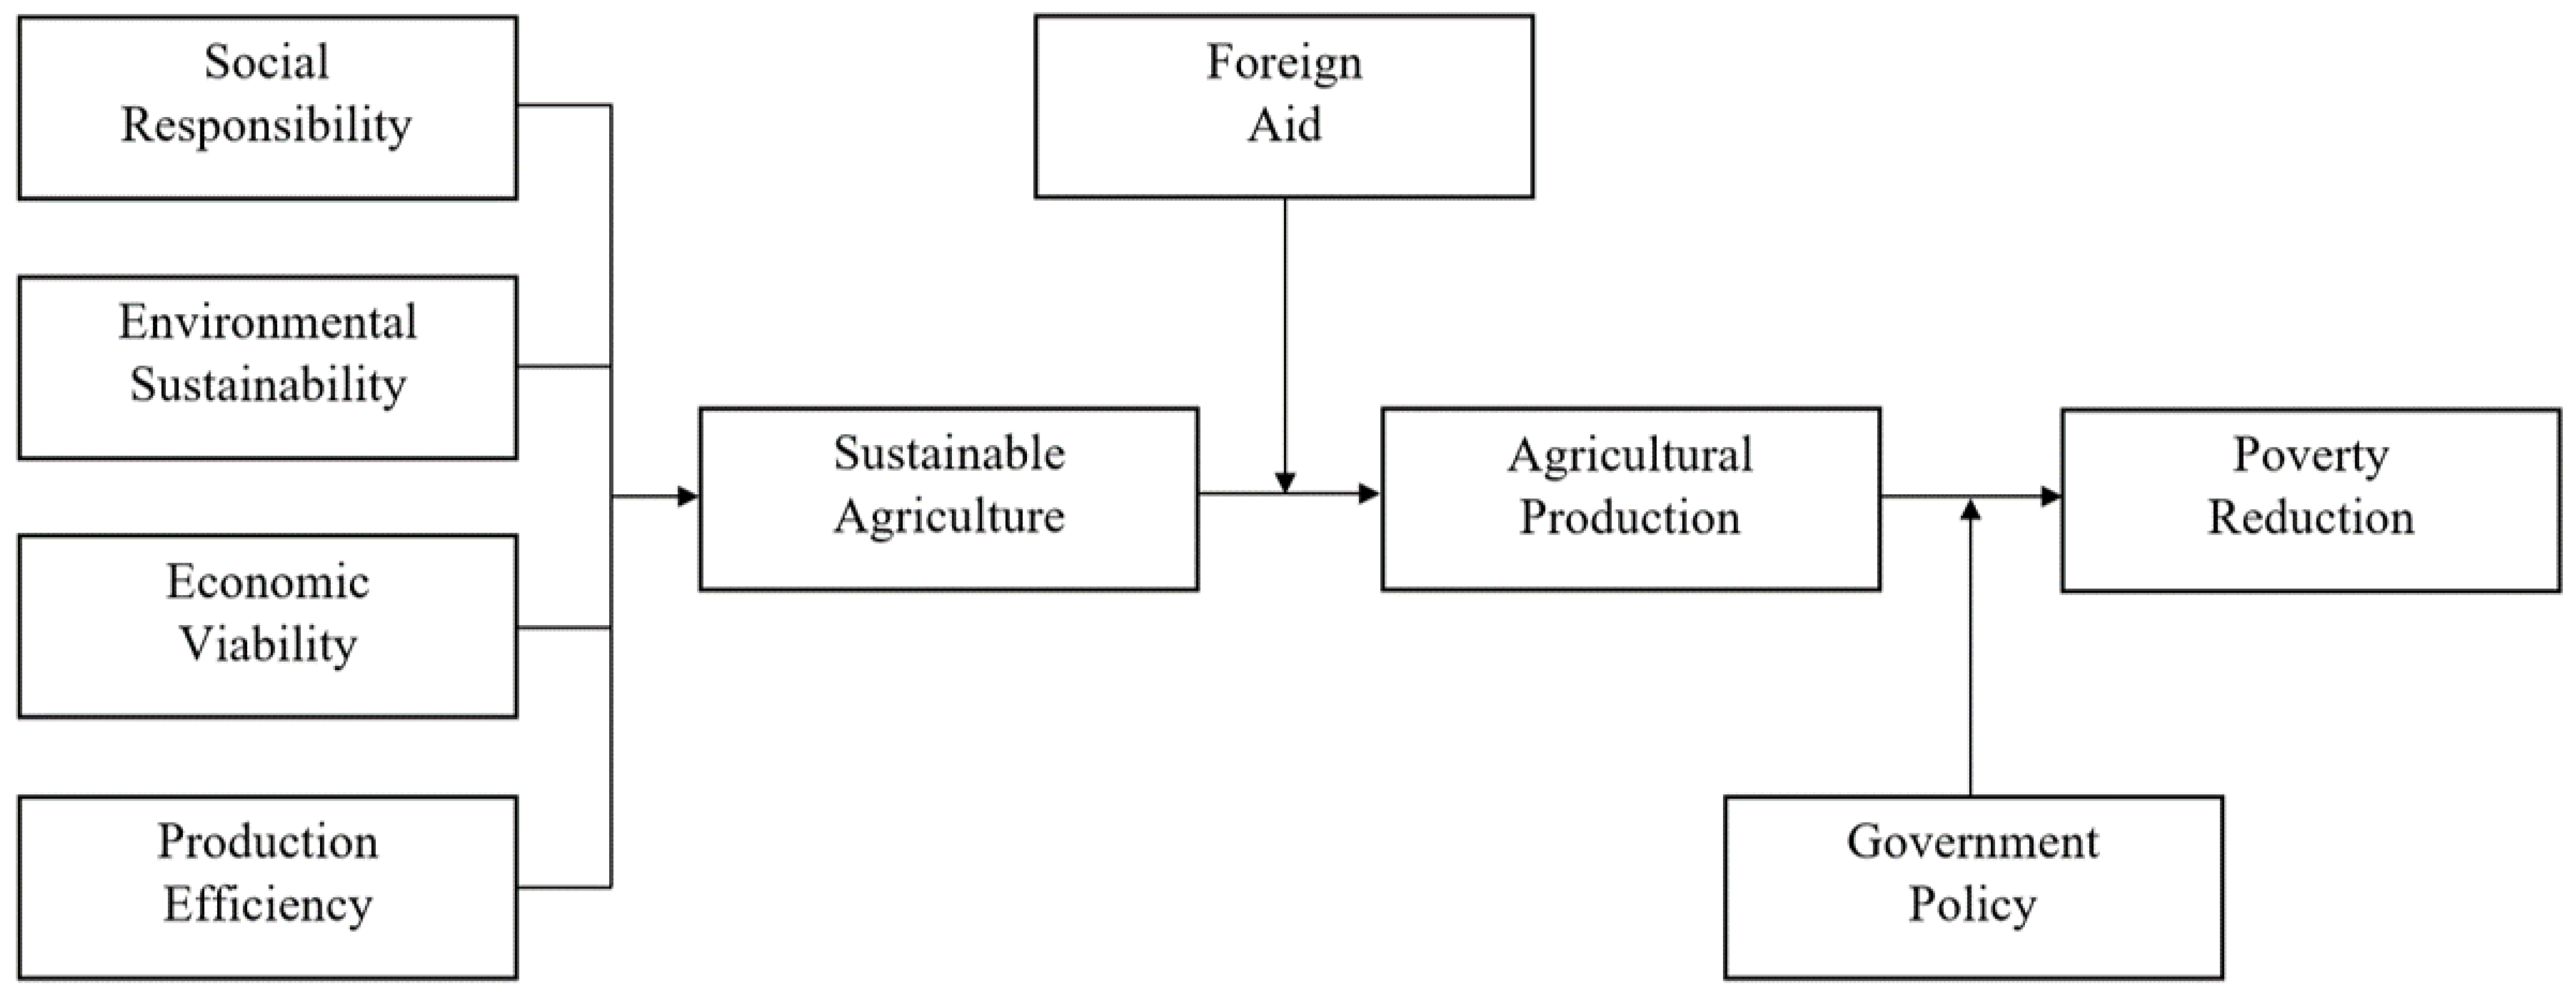
2.1. Selection of Variables
2.2. Research Approach
2.3. Structural Equation Modelling
2.4. Reliability and Validity
3. Results and Discussion
3.1. Structural Model Assessment
3.2. Findings
3.3. Discussion
4. Conclusions
Author Contributions
Funding
Institutional Review Board Statement
Informed Consent Statement
Data Availability Statement
Acknowledgments
Conflicts of Interest
Appendix A

| # | Question | SD | D | SDA | A | SA |
|---|---|---|---|---|---|---|
| 1 | Do you feel foreign aid has helped Pakistan to achieve SDG 1 (eradicate extreme poverty for all people)? | 1 | 2 | 3 | 4 | 5 |
| 2 | Do you feel foreign aid has improved the agricultural sector? | 1 | 2 | 3 | 4 | 5 |
| 3 | Has foreign aid helped Pakistan to achieve universal basic goals? | 1 | 2 | 3 | 4 | 5 |
| 4 | Do you feel foreign aid has improved information and communication technology in Pakistan? | 1 | 2 | 3 | 4 | 5 |
| 5 | Do you feel foreign aid has led to improvement in the outcome of agriculture at primary? | 1 | 2 | 3 | 4 | 5 |
| 6 | Do you feel foreign aid has negative effects on the agricultural sector in Pakistan? | 1 | 2 | 3 | 4 | 5 |
| 7 | Do you feel foreign aid has improved science and technology through research innovations in the agricultural sector of Pakistan? | 1 | 2 | 3 | 4 | 5 |
| 8 | Do you think foreign aid has led to the improvement of the agricultural sector outcome at the national level? | 1 | 2 | 3 | 4 | 5 |
| 9 | Do you feel foreign aid has improved agriculture production in Pakistan? | 1 | 2 | 3 | 4 | 5 |
| 10 | Do you feel Pakistan relies on foreign aid intervention in the area of agriculture development? | 1 | 2 | 3 | 4 | 5 |
| # | Question | SD | D | SDA | A | SA |
|---|---|---|---|---|---|---|
| Production efficiency | ||||||
| 1 | Technology should be used as best as possible to increase the efficiency of agricultural production | 1 | 2 | 3 | 4 | 5 |
| 2 | Meeting food needs with fewer farmers is a positive outcome of technological progress | 1 | 2 | 3 | 4 | 5 |
| 3 | Production, processing, and marketing of agricultural products are best carried out at the national and regional level | 1 | 2 | 3 | 4 | 5 |
| 4 | Technology should be used to make farm labour more rewarding and enjoyable, but not to replace it | 1 | 2 | 3 | 4 | 5 |
| Economic viability | ||||||
| 5 | Farming is first and foremost a business, like any other business | 1 | 2 | 3 | 4 | 5 |
| 6 | The primary goal of farmers should be to maximize the productivity, efficiency, and profitability of their farms | 1 | 2 | 3 | 4 | 5 |
| 7 | The successful farmer is one who earns enough from farming to enjoy a good standard of living | 1 | 2 | 3 | 4 | 5 |
| 8 | Farmers should purchase most of the goods and services they use on their farm | 1 | 2 | 3 | 4 | 5 |
| 9 | Large scale farmers can best serve agriculture needs | 1 | 2 | 3 | 4 | 5 |
| 10 | Farmers should farm only as much land as they can personally care for | 1 | 2 | 3 | 4 | 5 |
| 11 | The amount of farmland owned by an individual/corporation should be limited in order to encourage land ownership by as many people as possible | 1 | 2 | 3 | 4 | 5 |
| Environmental sustainability | ||||||
| 12 | Soil and water are the sources of all life and should, therefore, be strictly conserved | 1 | 2 | 3 | 4 | 5 |
| 13 | Farms should be specialized in one or at most a few crops | 1 | 2 | 3 | 4 | 5 |
| 14 | The key to agriculture’s future success lies in learning to imitate natural ecosystems and farm in harmony with nature | 1 | 2 | 3 | 4 | 5 |
| 15 | Farmers should use primarily natural fertilizers/production methods such as manure, crop rotations, compost, and biological pest control | 1 | 2 | 3 | 4 | 5 |
| 16 | Agricultural scientists and policymakers should expand efforts to develop biotechnologies and other innovations in order to increase food supplies | 1 | 2 | 3 | 4 | 5 |
| 17 | Modern agriculture is a major cause of ecological problems and must be greatly modified to become ecologically sound | 1 | 2 | 3 | 4 | 5 |
| 18 | Most farms should integrate agronomy and animal husbandry | 1 | 2 | 3 | 4 | 5 |
| 19 | Sustainability should be considered only at the farm level | 1 | 2 | 3 | 4 | 5 |
| Social responsibility | ||||||
| 20 | Agricultural education programs should teach students about the interrelationships between the environment, agriculture, and people | 1 | 2 | 3 | 4 | 5 |
| 21 | An important responsibility of agricultural education programs is to develop future leaders for the agricultural industry and rural communities in Iran | 1 | 2 | 3 | 4 | 5 |
| 22 | Farm traditions and culture are outdated and of little use in modern agriculture | 1 | 2 | 3 | 4 | 5 |
| 23 | Most people should live in cities, and they should entrust farming to somebody who can do it in the best manner | 1 | 2 | 3 | 4 | 5 |
| 24 | Sustainability is the outcome of the collective decision-making that arises from interaction among stakeholders | 1 | 2 | 3 | 4 | 5 |
| # | Question | SD | D | SDA | A | SA |
|---|---|---|---|---|---|---|
| 1 | Changes in agricultural pattern | 1 | 2 | 3 | 4 | 5 |
| 2 | Pests infestation of crops | 1 | 2 | 3 | 4 | 5 |
| 3 | Choking of crops by weeds | 1 | 2 | 3 | 4 | 5 |
| 4 | Crop failure and poor harvest | 1 | 2 | 3 | 4 | 5 |
| 5 | Farmers incur more costs on agricultural activities | 1 | 2 | 3 | 4 | 5 |
| 6 | Drying up and rotting of farm produce | 1 | 2 | 3 | 4 | 5 |
| 7 | Delays planting dates which affect yields | 1 | 2 | 3 | 4 | 5 |
| 8 | Animal growth, reproduction, and milk production are negatively affected | 1 | 2 | 3 | 4 | 5 |
| 9 | Pasture, forage, and other animal feeds are negatively affected | 1 | 2 | 3 | 4 | 5 |
| 10 | Diseases and parasites spread quickly | 1 | 2 | 3 | 4 | 5 |
| 11 | Reduces animal rate of eating and grazing | 1 | 2 | 3 | 4 | 5 |
| 12 | Increases animal mortality | 1 | 2 | 3 | 4 | 5 |
| 13 | Reduction in livestock quality and quantity | 1 | 2 | 3 | 4 | 5 |
| 14 | Reduction in fish harvest | 1 | 2 | 3 | 4 | 5 |
| 15 | Displacement of farmers | 1 | 2 | 3 | 4 | 5 |
| # | Question | SD | D | SDA | A | SA |
|---|---|---|---|---|---|---|
| 1 | Government offers advisory services and consultancy to improve the agricultural output | 1 | 2 | 3 | 4 | 5 |
| 2 | Receiving R&D from the government | 1 | 2 | 3 | 4 | 5 |
| 3 | Collaboration with government institutions | 1 | 2 | 3 | 4 | 5 |
| # | Question | SD | D | SDA | A | SA |
|---|---|---|---|---|---|---|
| 1 | Ability to save and invest | 1 | 2 | 3 | 4 | 5 |
| 2 | Ability to meet basic needs of shelter, food, and clothing | 1 | 2 | 3 | 4 | 5 |
| 3 | Ability to access recreational services/facilities | 1 | 2 | 3 | 4 | 5 |
| 4 | Ability to enjoy luxury goods and services | 1 | 2 | 3 | 4 | 5 |
| 5 | Increase health and education level | 1 | 2 | 3 | 4 | 5 |
| 6 | Increase wealth for household members | 1 | 2 | 3 | 4 | 5 |
| 7 | Increase employment levels and skills | 1 | 2 | 3 | 4 | 5 |
| Division | District | Tehsil | Union Councils |
|---|---|---|---|
| Dera Ghazi Khan | Dera Ghazi Khan | Rajanpur, Dera Ghazi Khan, Muzaffargarh District, Layyah District | 98 |
| Layyah | Chaubara, Karor Lal Esan, Layyah | 48 | |
| Muzaffargarh | Alipur, Jatoi, Kot Addu, Muzaffargarh | 111 | |
| Rajanpur | De-Excluded Area Rajanpur, Jampur, Rajanpur, Rohan | 69 | |
| Faisalabad | Chiniot | Bhawana, Chiniot, Lalian | 39 |
| Faisalabad | Chak Jhumra, Faisalabad City, Faisalabad Sadar, Jaranwala, Sammundri, Tandlianwala | 189 | |
| Jhang | 18-Hazari, Ahmadpur Sial, Jhang, Shorkot | 91 | |
| Toba Tek Singh | Gojra, Kamalia, Pirmahal, Toba Tek Singh | 85 | |
| Gujranwala | Gujranwala | Gujranwala City, Gujranwala Saddar, Kamoke, Nowshera Virkan Tehsil, Wazirabad | 93 |
| Gujrat | Gujrat, Kharian, Sarai Alamgir | 117 | |
| Hafizabad | Hafizabad, Pindi Bhattian | 46 | |
| Mandi Bahauddin | Malakwal, Mandi Bahauddin, Phalia | 80 | |
| Narowal | Narowal, Shakargarh, Zafarwal | 98 | |
| Sialkot | Daska, Pasrur, Sambrial, Sialkot | 124 | |
| Lahore | Kasur | Chunian, Kasur, Kot Radha Kishan, Pattoki | 125 |
| Lahore | Lahore Cantt, Lahore City, Model Town, Raiwind, Shalimar | 274 | |
| Nankana Sahib | Nankana Sahib, Sangla Hill, Shah Kot | 65 | |
| Sheikhupura | Firozewala, Muridke, Safdarabad, Sharak Pur, Sheikhupura | 99 | |
| Multan | Khanewal | Jahanian, Kabirwala, Khanewal, Mian Channu | 135 |
| Lodhran | Dunyapur, Kahror Pacca, Lodhran | 70 | |
| Multan | Jalalpur Pirwala, Multan City, Multan Saddar, Shujabad | 117 | |
| Vehari | Burewala, Mailsi, Vehari | 105 | |
| Sahiwal | Okara | Depalpur, Okara, Renala Khurd | 140 |
| Pakpattan | Arifwala, Pakpattan | 33 | |
| Sahiwal | Chichawatni, Sahiwal | 88 | |
| Sargodha | Bhakkar | Bhakkar, Darya Khan, Kalur Kot, Mankera | 64 |
| Khushab | Khushab, Nurpur Thal, Quaidabad | 48 | |
| Mianwali | Isa Khel, Mianwali, Piplan | 51 | |
| Sargodha | Bhalwal, Bhera, Kot Momin, Sahiwal, Sargodha, Shahpur, Sillanwali | 164 | |
| Bahawalpur | Bahawalnagar | Bahawalnagar, Chishtian, Fort Abbas, Haroonabad, Minchinabad | 135 |
| Bahawalpur | Ahmadpur East, Bahawalpur City, Bahawalpur Saddar, Hasilpur, Khairpur Tamiwali, Yazman | 88 | |
| Rahim Yar Khan | Khanpur, Liaquatpur, Rahim Yar Khan, Sadiqabad | 139 |
References
- Loibl, C. Living in Poverty: Understanding the Financial Behaviour of Vulnerable Groups. In Economic Psychology; Ranyard, R., Ed.; John Wiley & Sons: Hoboken, NJ, USA, 2017; pp. 421–434. [Google Scholar]
- Erokhin, V. Emerging Trade-Related Threats to Food Security: Evidence from China. In Handbook of Research on Globalized Agricultural Trade and New Challenges for Food Security; Erokhin, V., Gao, T., Eds.; IGI Global: Hershey, PA, USA, 2020; pp. 319–336. [Google Scholar] [CrossRef]
- Iammarino, S.; Rodriguez-Pose, A.; Storper, M. Regional Inequality in Europe: Evidence, Theory, and Policy Implications. J. Econ. Geogr. 2019, 19, 273–298. [Google Scholar] [CrossRef]
- Erokhin, V.; Ivolga, A.; Lisova, O. Challenges to Sustainable Rural Development in Russia: Social Issues and Regional Divergences. Appl. Stud. Agribus. Commer. 2016, 10, 45–52. [Google Scholar]
- Erokhin, V.; Heijman, W.; Ivolga, A. Sustainable Rural Development in Russia through Diversification: The Case of the Stavropol Region. Visegr. J. Bioecon. Sustain. Dev. 2014, 3, 20–25. [Google Scholar] [CrossRef] [Green Version]
- Haider, S.; Ashraf, E.; Javed, M.A. Assessment of Factors Causing Lack of Interest among Small-Scale Farmers in Agriculture System in Tehsil Shakargarh, Pakistan. PSM Biol. Res. 2016, 1, 53–57. [Google Scholar]
- Khan, R.; Jhariya, D.C. Assessment of Land-Use and Land-Cover Change and Its Impact on Groundwater Quality Using Remote Sensing and GIS Techniques in Raipur City, Chhattisgarh, India. J. Geol. Soc. India 2018, 92, 59–66. [Google Scholar] [CrossRef]
- Simkin, A.J.; López-Calcagno, P.E.; Raines, C. Feeding the World: Improving Photosynthetic Efficiency for Sustainable Crop Production. J. Exp. Bot. 2019, 70, 1119–1140. [Google Scholar] [CrossRef] [Green Version]
- Ministry of Finance of Pakistan. Economy Survey of Pakistan 2015. Available online: http://www.finance.gov.pk/survey/chapters_16/03_Manufacturing.pdf (accessed on 21 September 2022).
- Ministry of Finance of Pakistan. Economy Survey of Pakistan 2016. Available online: http://www.finance.gov.pk/survey/chapters_17/03-Manufacturing.pdf (accessed on 21 September 2022).
- Ministry of Finance of Pakistan. Economy Survey of Pakistan 2017. Available online: http://www.finance.gov.pk/survey/chapters_18/Economic_Survey_2017_18.pdf (accessed on 21 September 2022).
- Fahad, S.; Wang, J. Farmers’ Risk Perception, Vulnerability, and Adaptation to Climate Change in Rural Pakistan. Land Use Policy 2018, 79, 301–309. [Google Scholar] [CrossRef]
- Werbner, D. Tears of the Dead: The Social Biography of an African Family; Edinburgh University Press: Edinburgh, Scotland, 1991. [Google Scholar]
- Erokhin, V.; Gao, T.; Andrei, J.V. Sustainable Economic Development: Challenges, Policies, and Reforms; MDPI: Basel, Switzerland, 2020. [Google Scholar] [CrossRef]
- Vassileva, B. Agricultural Trade Patterns from the Perspective of Economic Complexity. In Shifting Patterns of Agricultural Trade: The Protectionism Outbreak and Food Security; Erokhin, V., Gao, T., Andrei, J.V., Eds.; Springer: Singapore, 2021; pp. 1–19. [Google Scholar] [CrossRef]
- Erokhin, V. Probing into Economic Development Studies in the Post-COVID Era. J. Bus. Strategy Financ. Manag. 2021, 2, 4–6. [Google Scholar] [CrossRef]
- Mahmood, K.; Munir, S. Agricultural Exports and Economic Growth in Pakistan: An Econometric Reassessment. Qual. Quant. 2018, 52, 1561–1574. [Google Scholar] [CrossRef]
- Border, O.M. What Is Poverty Reduction? Center for Global Development: Washington, DC, USA, 2009. [Google Scholar]
- Okubo, B.W.; Makanga, N. Effects of Micro Finance Institutions on Poverty Reduction in Kenya. Int. J. Curr. Res. Acad. Rev. 2014, 2, 76–95. [Google Scholar]
- Bottani, E.; Gentilotti, M.C.; Rinaldi, M. A Fuzzy Logic-Based Tool for the Assessment of Corporate Sustainability: A Case Study in the Food Machinery Industry. Sustainability 2017, 9, 583. [Google Scholar] [CrossRef] [Green Version]
- Pineiro, V.; Arias, J.; Durr, J.; Elverdin, P.; Ibanez, A.M.; Kinengyere, A.; Torero, M. A Scoping Review on Incentives for Adoption of Sustainable Agricultural Practices and Their Outcomes. Nat. Sustain. 2020, 3, 809–820. [Google Scholar] [CrossRef]
- Constantin, M.; Radulescu, I.D.; Andrei, J.V.; Chivu, L.; Erokhin, V.; Gao, T. A Perspective on Agricultural Labor Productivity and Greenhouse Gas Emissions in Context of the Common Agricultural Policy Exigencies. Econ. Agric. 2021, 68, 53–67. [Google Scholar] [CrossRef]
- Panait, M.; Erokhin, V.; Andrei, J.V.; Gao, T. Implication of TNCs in Agri-Food Sector–Challenges, Constraints and Limits–Profit or CSR? Strateg. Manag. 2020, 20, 33–43. [Google Scholar] [CrossRef]
- Lambin, E.F.; Thorlakson, T. Sustainability Standards: Interactions between Private Actors, Civil Society, and Governments. Annu. Rev. Environ. Resour. 2018, 43, 369–393. [Google Scholar] [CrossRef]
- Allahyari, M.S.; Chisari, M.; Homage, M. Perceptions of Iranian Agricultural Extension Professionals Toward Sustainable Agriculture Concepts. J. Agric. Soc. Sci. 2008, 4, 101–106. [Google Scholar]
- Erbaugh, J.; Bierbaum, R.; Castilleja, G.; da Fonseca, G.A.; Hansen, S.C.B. Toward Sustainable Agriculture in the Tropics. World Dev. 2019, 121, 158–162. [Google Scholar] [CrossRef]
- Trojan, J.D. Impact of Climate Change on Agricultural Production by Farmers in Taraba State, Nigeria. Int. J. Entrep. Dev. Educ. Sci. Res. 2017, 4, 178–190. [Google Scholar]
- Malik, O.R.; Kotabe, M. Dynamic Capabilities, Government Policies, and Performance in Firms from Emerging Economies: Evidence from India and Pakistan. J. Manag. Stud. 2009, 46, 421–450. [Google Scholar] [CrossRef]
- Deng, H.; Hu, R.; Pray, C.; Jin, Y. Impact of Government Policies on Private R&D Investment in Agricultural Biotechnology: Evidence from Chemical and Pesticide Firms in China. Technol. Forecast. Soc. Change 2019, 147, 208–215. [Google Scholar] [CrossRef]
- United Nations Development Programme. Africa Human Development Report 2016 Accelerating Gender Equality and Women’s Empowerment in Africa; United Nations Development Programme: New York, NY, USA, 2016. [Google Scholar]
- Mood, C.; Jonsson, J.O. The Social Consequences of Poverty: An Empirical Test on Longitudinal Data. Soc. Indic. Res. 2016, 127, 633–652. [Google Scholar] [CrossRef] [PubMed] [Green Version]
- Jalilvand, E.; Tajrishy, M.; Hashemi, S.Z.; Brocca, L. Quantification of Irrigation Water Using Remote Sensing of Soil Moisture in a Semi-Arid Region. Remote Sens. Environ. 2019, 231, 111226. [Google Scholar] [CrossRef]
- Mumtaz, M.; de Oliveira, J.P.; Ali, S.H. Climate Change Impacts and Adaptation in Agricultural Sector: The Case of Local Responses in Punjab, Pakistan. In Climate Change and Agriculture; Hussain, S., Ed.; IntechOpen: London, UK, 2019. [Google Scholar] [CrossRef]
- Sikandar, F.; Wang, H.; Zahra, K.; Zada, M.; Mumtaz, M.U. Effects of Poverty Reduction Policies on Food Security and Sustainable Development in Rural Areas: Case of Southern Punjab, Pakistan. In Shifting Patterns of Agricultural Trade: The Protectionism Outbreak and Food Security; Erokhin, V., Gao, T., Andrei, J.V., Eds.; Springer: Singapore, 2021; pp. 527–552. [Google Scholar] [CrossRef]
- Zaman, S.; Yousuf, A.; Begum, A.; Bari, M.L.; Rabbani, K.S. Evaluation of Adaptive Low-Cost Solar Water Pasteurization Device for Providing Safe Potable Water in Rural Households. J. Water Health 2019, 17, 274–286. [Google Scholar] [CrossRef] [PubMed]
- Hair, J.F.; Howard, M.C.; Nitzl, C. Assessing Measurement Model Quality in PLS-SEM Using Confirmatory Composite Analysis. J. Bus. Res. 2020, 109, 101–110. [Google Scholar] [CrossRef]
- Baron, R.M.; Kenny, D.A. The Moderator-Mediator Variable Distinction in Social Psychological Research: Conceptual, Strategic and Statistical Considerations. J. Personal. Soc. Psychol. 1986, 51, 1173–1182. [Google Scholar] [CrossRef]
- Hair, J.F.; Hult, G.M.; Ringle, C.M.; Sarstedt, M. A Primer on Partial Least Squares Structural Equation Modeling (PLS-SEM), 2nd ed.; Sage: Thousand Oaks, CA, USA, 2017. [Google Scholar]
- Holmbeck, G.N. Toward Terminological, Conceptual, and Statistical Clarity in the Study of Mediators and Moderators: Examples from the Child-Clinical and Pediatric Psychology Literatures. J. Consult. Clin. Psychol. 1997, 65, 599–610. [Google Scholar] [CrossRef]
- Henseler, J. Partial Least Squares Path Modeling. In Advanced Methods for Modeling Markets. International Series in Quantitative Marketing; Leeflang, P., Wieringa, J., Bijmolt, T., Koen, H., Eds.; Springer: Cham, Switzerland, 2017; pp. 361–381. [Google Scholar] [CrossRef]
- Hair, J.F.; Ringle, C.M.; Sarstedt, M. PLS-SEM: Indeed a Silver Bullet. J. Mark. Theory Pract. 2011, 19, 139–152. [Google Scholar] [CrossRef]
- Ramayah, T.; Cheah, J.; Chuah, F.; Ting, H.; Memon, M.A. Partial Least Squares Structural Equation Modeling (PLS-SEM) Using SmartPLS 3.0: An Updated Guide and Practical Guide to Statistical Analysis; Pearson: Kuala Lumpur, Malaysia, 2018. [Google Scholar]
- Sekaran, U.; Bougie, R. Research Methods for Business: A Skill Building Approach; John Wiley & Sons: Hoboken, NJ, USA, 2010. [Google Scholar]
- Zikmund, W.G.; Babin, B.; Carr, J.; Griffin, M. Business Research Methods; Cengage Learning: Stamford, CT, USA, 2012. [Google Scholar]
- Hair, J.F.; Ringle, C.M.; Sarstedt, M. Partial Least Squares Structural Equation Modeling: Rigorous Applications, Better Results and Higher Acceptance. Long Range Plan. 2013, 46, 1–12. [Google Scholar] [CrossRef]
- Couchman, P.K.; Fulop, L. Building Trust in Cross-Sector R&D Collaborations: Exploring the Role of Credible Commitments. In Proceedings of the 22nd EGOS Colloquium “Trust within and Across Boundaries: Conceptual Challenges and Empirical Insights”, Bergen, Norway, 6–8 July 2006. [Google Scholar]
- Vinzi, V.E.; Trinchera, L.; Amato, S. PLS Path Modeling: From Foundations to Recent Developments and Open Issues for Model Assessment and Improvement. In Handbook of Partial Least Squares; Vinzi, V.E., Chin, W., Henseler, J., Wang, H., Eds.; Springer: Berlin, Germany, 2010; pp. 47–82. [Google Scholar] [CrossRef]
- Elahi, E.; Khalid, Z.; Weijun, C.; Zhang, H. The Public Policy of Agricultural Land Allotment to Agrarians and Its Impact on Crop Productivity in Punjab Province of Pakistan. Land Use Policy 2020, 90, 104324. [Google Scholar] [CrossRef]
- Gao, T.; Erokhin, V.; Arskiy, A. Dynamic Optimization of Fuel and Logistics Costs as a Tool in Pursuing Economic Sustainability of a Farm. Sustainability 2019, 11, 5463. [Google Scholar] [CrossRef] [Green Version]
- Ali, A.; Erenstein, O. Assessing Farmer Use of Climate Change Adaptation Practices and Impacts on Food Security and Poverty in Pakistan. Clim. Risk Manag. 2017, 16, 183–194. [Google Scholar] [CrossRef]
- Gao, T.; Ivolga, A.; Erokhin, V. Sustainable Rural Development in Northern China: Caught in a Vice between Poverty, Urban Attractions, and Migration. Sustainability 2018, 10, 1467. [Google Scholar] [CrossRef] [Green Version]
- Joshi, N.V. Photoconductivity: Art, Science, and Technology; Marcel Dekker: New York, NY, USA, 1990. [Google Scholar]
- Erokhin, V.; Gao, T.; Ivolga, A. International Agricultural Trade: Exporters and Importers. In Shifting Patterns of Agricultural Trade: The Protectionism Outbreak and Food Security; Erokhin, V., Gao, T., Andrei, J.V., Eds.; Springer Nature: Singapore, 2021; pp. 21–51. [Google Scholar] [CrossRef]
- Erokhin, V.; Gao, T.; Ivolga, A. International Agricultural Trade: Products. In Shifting Patterns of Agricultural Trade: The Protectionism Outbreak and Food Security; Erokhin, V., Gao, T., Andrei, J.V., Eds.; Springer Nature: Singapore, 2021; pp. 53–101. [Google Scholar] [CrossRef]
- Verter, N. International Trade: The Position of Africa in Global Merchandise Trade. In Emerging Issues in Economics and Development; Ibrahim, M.J., Ed.; IntechOpen: London, UK, 2017; pp. 64–89. [Google Scholar] [CrossRef] [Green Version]
- Sarkar, A.; Azim, J.A.; Al Asif, A.; Qian, L.; Peau, A.K. Structural Equation Modeling for Indicators of Sustainable Agriculture: Prospective of a Developing Country’s Agriculture. Land Use Policy 2021, 109, 105638. [Google Scholar] [CrossRef]
- Sikandar, F.; Erokhin, V.; Shu, W.H.; Rehman, S.; Ivolga, A. The Impact of Foreign Capital Inflows on Agriculture Development and Poverty Reduction: Panel Data Analysis for Developing Countries. Sustainability 2021, 13, 3242. [Google Scholar] [CrossRef]


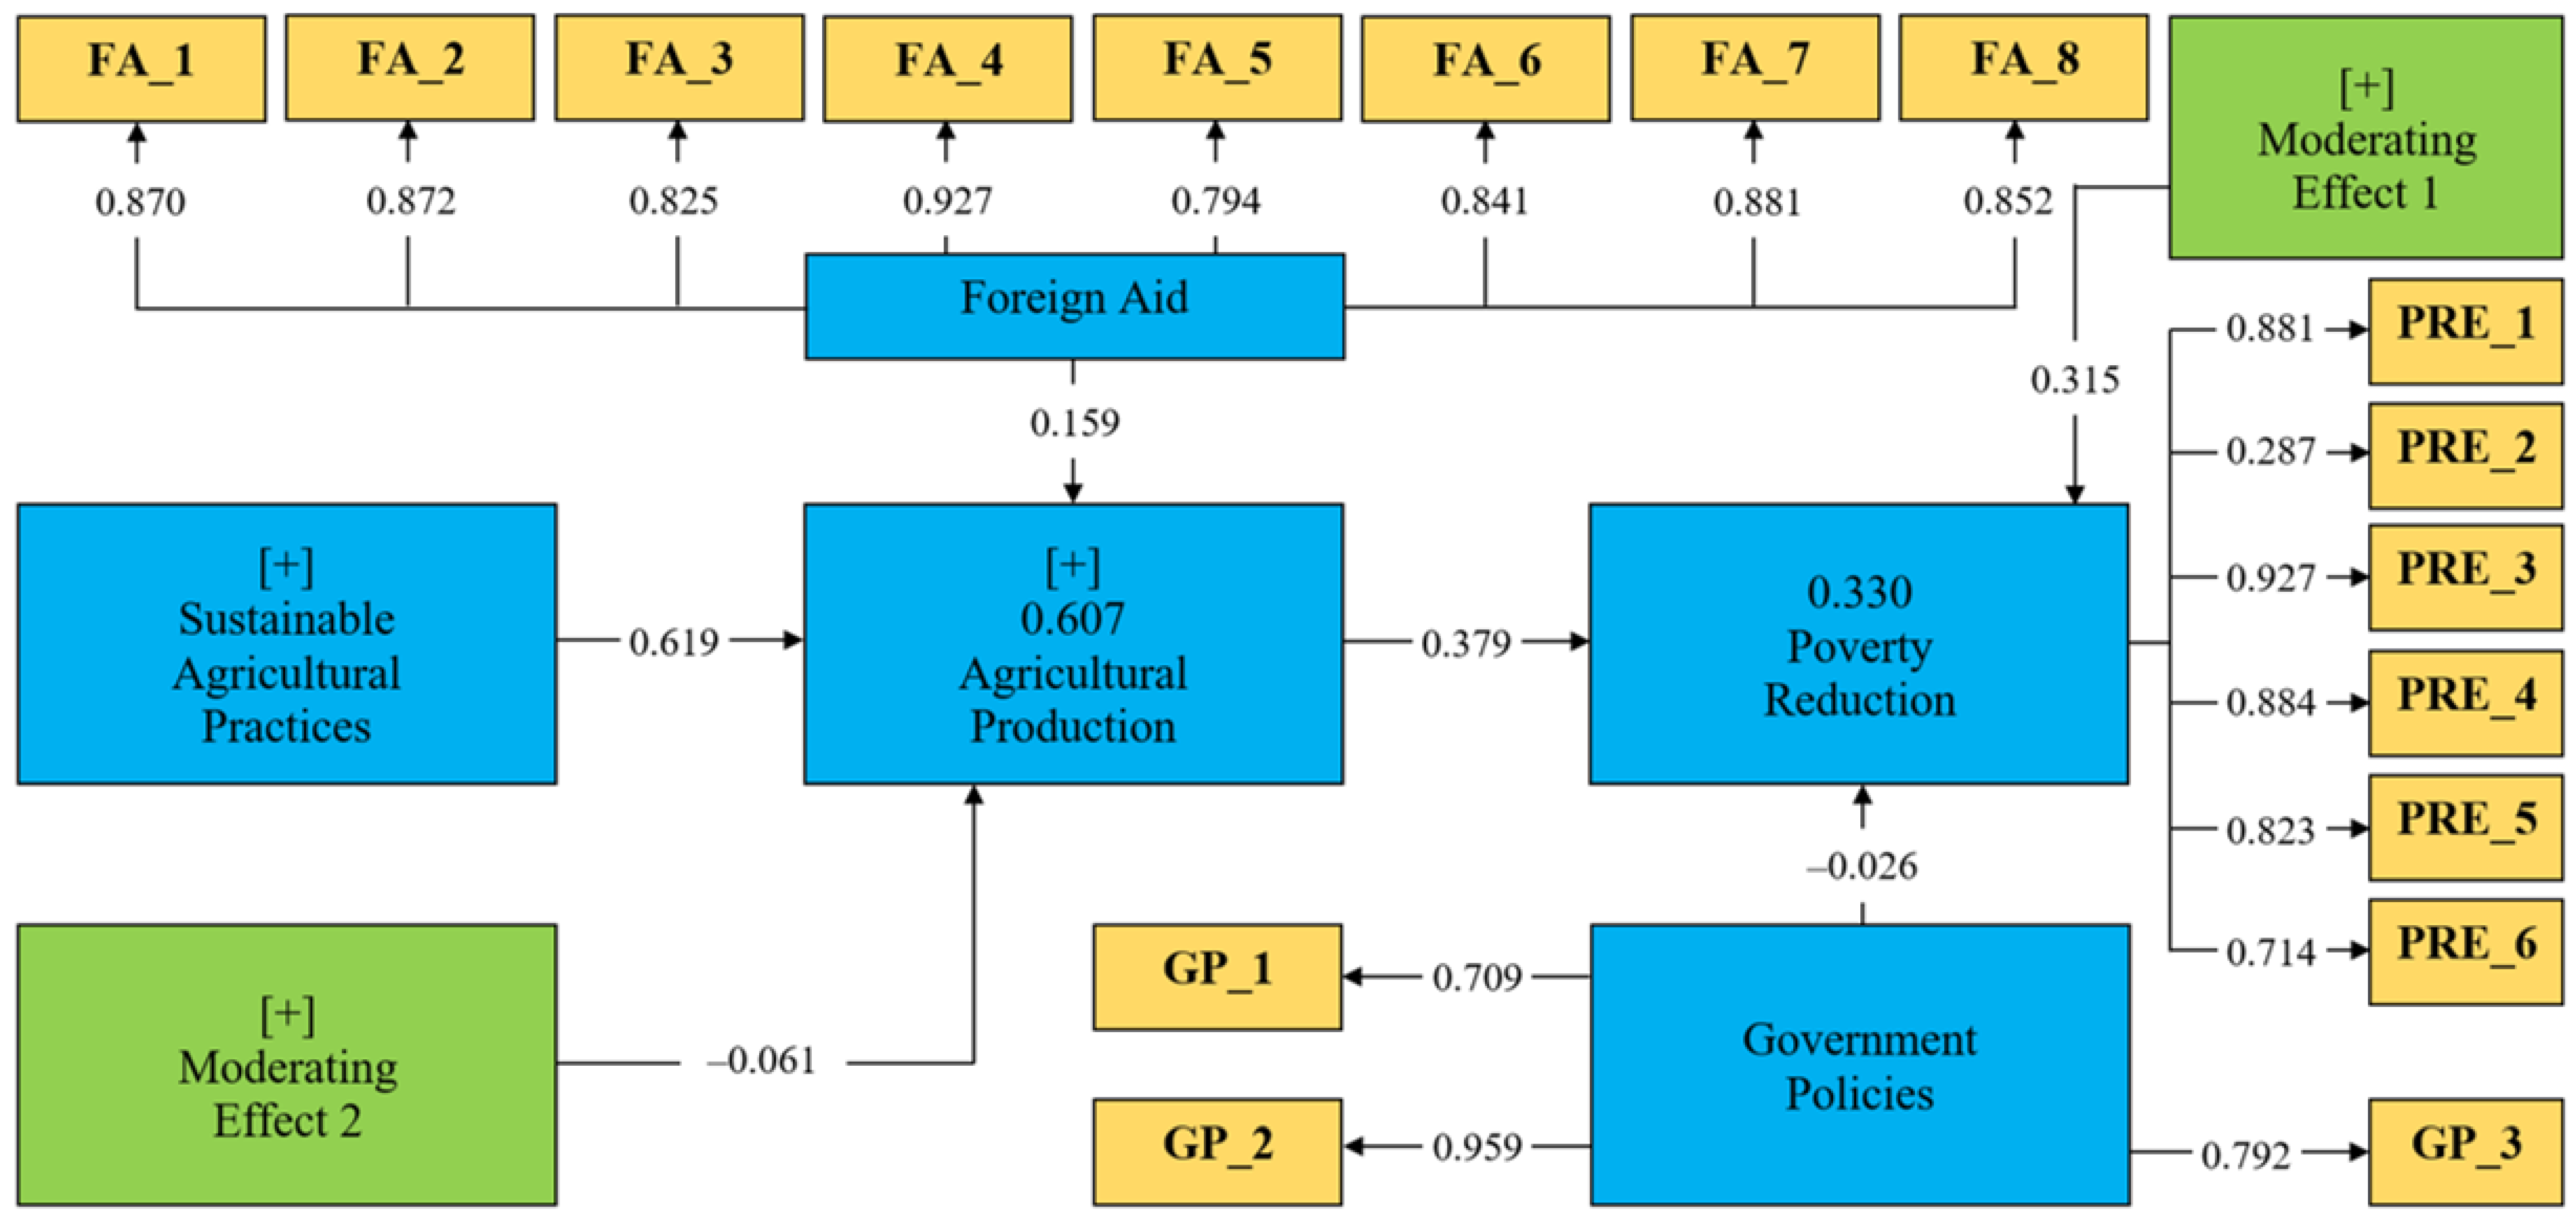
| Variables | Items | Loadings | CR | AVE | |
|---|---|---|---|---|---|
| Sustainable Agriculture | Environmental Sustainability | ENV_1 | 0.816 | 0.913 | 0.724 |
| ENV_2 | 0.867 | ||||
| ENV_3 | 0.817 | ||||
| ENV_4 | 0.900 | ||||
| Economic Viability | Econ_1 | 0.832 | 0.950 | 0.733 | |
| Econ_2 | 0.840 | ||||
| Econ_3 | 0.890 | ||||
| Econ_4 | 0.858 | ||||
| Econ_5 | 0.901 | ||||
| Econ_6 | 0.874 | ||||
| Econ_7 | 0.795 | ||||
| Production Efficiency | Prod_1 | 0.893 | 0.949 | 0.824 | |
| Prod_2 | 0.923 | ||||
| Prod_3 | 0.919 | ||||
| Prod_4 | 0.897 | ||||
| Social Responsibility | SR_1 | 0.877 | 0.925 | 0.712 | |
| SR_2 | 0.828 | ||||
| SR_3 | 0.813 | ||||
| SR_4 | 0.832 | ||||
| SR_5 | 0.868 | ||||
| Foreign Aid | FA_1 | 0.870 | 0.957 | 0.737 | |
| FA_2 | 0.871 | ||||
| FA_3 | 0.823 | ||||
| FA_4 | 0.927 | ||||
| FA_5 | 0.795 | ||||
| FA_6 | 0.840 | ||||
| FA_7 | 0.882 | ||||
| FA_8 | 0.852 | ||||
| Agriculture Production | AP_1 | 0.699 | 0.949 | 0.608 | |
| AP_2 | 0.704 | ||||
| AP_3 | 0.791 | ||||
| AP_4 | 0.778 | ||||
| AP_5 | 0.768 | ||||
| AP_6 | 0.811 | ||||
| AP_7 | 0.849 | ||||
| AP_8 | 0.813 | ||||
| AP_9 | 0.847 | ||||
| AP_10 | 0.751 | ||||
| AP_12 | 0.810 | ||||
| AP_14 | 0.721 | ||||
| Government Policies | GP_1 | 0.593 | 0.630 | 0.422 | |
| GP_2 | 0.627 | ||||
| GP_3 | 0.998 | ||||
| Poverty Reduction | PRE_1 | 0.897 | 0.929 | 0.724 | |
| PRE_3 | 0.931 | ||||
| PRE_4 | 0.863 | ||||
| PRE_5 | 0.827 | ||||
| PRE_6 | 0.721 | ||||
| 1 | 2 | 3 | 4 | 5 | 6 | 7 | 8 | 9 | |
|---|---|---|---|---|---|---|---|---|---|
| AP | 0.780 | ||||||||
| EV | −0.423 | 0.856 | |||||||
| EN | 0.730 | −0.412 | 0.851 | ||||||
| FA | 0.591 | −0.312 | 0.583 | 0.858 | |||||
| FDI | −0.442 | 0.814 | −0.385 | −0.263 | 0.618 | ||||
| GP | 0.156 | −0.084 | 0.208 | 0.070 | −0.289 | 0.649 | |||
| Pre | 0.527 | −0.223 | 0.449 | 0.595 | −0.135 | 0.080 | 0.851 | ||
| Pro | 0.367 | −0.185 | 0.283 | 0.575 | −0.172 | 0.055 | 0.403 | 0.908 | |
| SR | 0.682 | −0.372 | 0.752 | 0.524 | −0.320 | 0.131 | 0.463 | 0.311 | 0.844 |
| AP | EV | EN | FA | FDI | GP | Pre | Pro | SR | |
|---|---|---|---|---|---|---|---|---|---|
| AP | |||||||||
| EV | 0.447 | ||||||||
| EN | 0.807 | 0.438 | |||||||
| FA | 0.608 | 0.329 | 0.649 | ||||||
| FDI | 0.377 | 0.710 | 0.370 | 0.278 | |||||
| GP | 0.168 | 0.114 | 0.207 | 0.208 | 0.533 | ||||
| Pre | 0.548 | 0.242 | 0.500 | 0.622 | 0.158 | 0.161 | |||
| Pro | 0.382 | 0.202 | 0.303 | 0.599 | 0.166 | 0.215 | 0.437 | ||
| SR | 0.739 | 0.396 | 0.861 | 0.574 | 0.307 | 0.194 | 0.502 | 0.334 |
| Coeff. | SD. | t-Values | p-Values | |
|---|---|---|---|---|
| SAP ≥ AP | 0.619 | 0.127 | 4.858 | 0.000 |
| AP ≥ PR | 0.379 | 0.188 | 2.014 | 0.044 |
| FA ≥ AP | 0.159 | 0.116 | 1.366 | 0.172 |
| GP ≥ PR | −0.026 | 0.167 | 0.157 | 0.875 |
| Moderating Effect 1 ≥ PR | 0.315 | 0.338 | 0.935 | 0.350 |
| Moderating Effect 2 ≥ AP | −0.061 | 0.088 | 0.693 | 0.488 |
| SAP ≥ AP ≥ PR | 0.234 | 0.119 | 1.969 | 0.049 |
Publisher’s Note: MDPI stays neutral with regard to jurisdictional claims in published maps and institutional affiliations. |
© 2022 by the authors. Licensee MDPI, Basel, Switzerland. This article is an open access article distributed under the terms and conditions of the Creative Commons Attribution (CC BY) license (https://creativecommons.org/licenses/by/4.0/).
Share and Cite
Sikandar, F.; Erokhin, V.; Xin, L.; Sidorova, M.; Ivolga, A.; Bobryshev, A. Sustainable Agriculture and Rural Poverty Eradication in Pakistan: The Role of Foreign Aid and Government Policies. Sustainability 2022, 14, 14751. https://doi.org/10.3390/su142214751
Sikandar F, Erokhin V, Xin L, Sidorova M, Ivolga A, Bobryshev A. Sustainable Agriculture and Rural Poverty Eradication in Pakistan: The Role of Foreign Aid and Government Policies. Sustainability. 2022; 14(22):14751. https://doi.org/10.3390/su142214751
Chicago/Turabian StyleSikandar, Furqan, Vasilii Erokhin, Li Xin, Marina Sidorova, Anna Ivolga, and Alexey Bobryshev. 2022. "Sustainable Agriculture and Rural Poverty Eradication in Pakistan: The Role of Foreign Aid and Government Policies" Sustainability 14, no. 22: 14751. https://doi.org/10.3390/su142214751