Article

Gold and Bitcoin Optimal Portfolio Research and Analysis Based on Machine-Learning Methods

1
College of Electronic and Information, Southwest Minzu University, Chengdu 610041, China
2
International Business School Suzhou at XJTLU, Xi’an Jiaotong-Liverpool University, Suzhou 215123, China
*
Author to whom correspondence should be addressed.
Sustainability 2022, 14(21), 14659; https://doi.org/10.3390/su142114659
Submission received: 2 October 2022 / Revised: 20 October 2022 / Accepted: 24 October 2022 / Published: 7 November 2022
(This article belongs to the Special Issue Business, Innovation, and Economics Sustainability)

Abstract

:
In recent years, the bitcoin market has developed rapidly and has been recognized as a new type of gold by many investors. It may replace gold as a hedge against inflation and become a new investment asset for financial management. The investment relationship with gold has increasingly important research value and practical significance. This paper modeled daily price flow data from 11 September 2016 to 10 September 2021 to help market traders determine whether they need to buy, hold, or sell assets in their portfolios daily. The model predicts price fluctuations through linear regression prediction of machine learning, K-Nearest Neighbor (KNN) algorithm. In the linear regression prediction, the goodness of fit of gold is 89.44%, and the goodness of fit of Bitcoin is 98.43%. In the test set prediction of KNN algorithm, the goodness of fit of gold is 97.25%, and the goodness of fit of Bitcoin is 95.06%. Based on this, the optimal investment strategy and the initial investment value are obtained. Empirical analysis shows that bitcoin price volatility and gold price volatility have a strong substitution effect; gold and currency used will be a suitable combination of hedging, which will bring momentum for the development of the market economy and become an important force in the sustainable development of a high-quality-driven economy.

1. Introduction

Market traders often buy and sell volatile assets, which is a risky investment behavior, and its volatility is usually measured by the standard deviation of fluctuations over a period of time. Among these tradable and volatile assets, gold and bitcoin play an important role [1,2,3]. With the rapid development of digital information technology, the social economy is also developing continuously. At present, human society is in the era of a digital economy, and the form of currency is always in line with technological and economic development [2,3,4,5]. In the context of the digital economy, the generation of digital currency has a certain inevitability [6]. Compared with traditional currencies, digital currencies can be divided into two categories. The first category is a legal digital currency issued by the central bank or the government, and the second category is a virtual digital currency issued by non-financial institutions and other entities. Bitcoin is presently entering the public eye [7,8,9,10].
At present, gold investment has become an important part of investors’ investment portfolios [11]. Therefore, the gold market has opened up a wealth of investment channels for investors in the financial market and improved the investment function of the financial market [12,13,14,15]. However, after the subprime mortgage crisis, along with the bursting of the bubble and the devaluation of paper money, the calls for decentralization of currency issuance and transactions are getting louder and louder [16]. Bitcoin, which was born amidst this background, has attracted much attention from investors. Compared with gold, bitcoin has the characteristics of high yield, high volatility, exemption from supervision, and tax exemption. It also has the characteristics of decentralization, globalization, and anonymity, like the Internet. With this so-called “digital gold”, there is huge room for development in the financial field [17,18,19]. The liquidity and limitation of bitcoin determine that bitcoin can serve as a currency function equivalent to a general equivalent; however, this measurement is not a physical measurement, such as gold, but a digital product. It can replace gold to deal with inflation or complement gold for package preservation [18,19,20,21]. Therefore, research on the relationship between bitcoin and gold will play an important role in developing the financial industry.
However, the nature and investment attractiveness of gold and bitcoin are not the same, so how to make the correct investment strategy for the two has become a problem of public concern. Based on this, a trader asked our team for help by way of developing a model that uses only the daily price stream from 10 September 2016–10 September 2021 to determine whether they should buy, hold or sell assets in their portfolio, which included cash, gold, and bitcoin.
As a stochastic process model, the Markov decision process model is widely used in the modelling and optimal control of systems evolves with Markovian property [22]. Due to the large volatility of financial market transactions, affected by many non-standard factors, and showing strong randomness, the introduction of the Markov decision process model applied to asset management can further obtain an actual market investment strategy [23]. A growing body of research shows that the Markov decision process model is a powerful tool for predicting market share and profit expectations. In addition, the Markov decision process model will be expanded to economic management areas, such asenterprise human capital investment, international project bidding risk prediction, and non-performing bank asset management.
With the rapid expansion of the bitcoin market, there is an increasing amount of literature on bitcoin research. The primary literature focuses on correlation analysis between bitcoin and gold. Dyhrberg used the GARCH model to study the US dollar, gold, and bitcoin. It was found that all three can be used as hedging tools. The asymmetric GARCH model was then used to find that bitcoin can be a diversified investment tool [24]. At the same time, Ye Wuyi et al. conducted research on gold and bitcoin based on semi-parametric MIDAS and found a quantile cointegration relationship between the two [25]. In summary, bitcoin and gold are more closely linked than other traditional assets, so it is necessary to pay attention to changes in the correlation between the two.
In this article, a portfolio model was established for market traders, which can determine the investment strategy of gold and bitcoin according to the price changes of gold and bitcoin over 5 years, to help traders to make better investment plans. Although the model and algorithm adopted in this study are easy to understand, there are still some problems. For example, to maintain data consistency, gold and bitcoin data was processed, which may cause errors in the prediction model. In addition, simpler models affect the accuracy of the results, so we adopted a combined model and carried out a sensitivity analysis to deal with these problems.
Our work mainly includes the following:
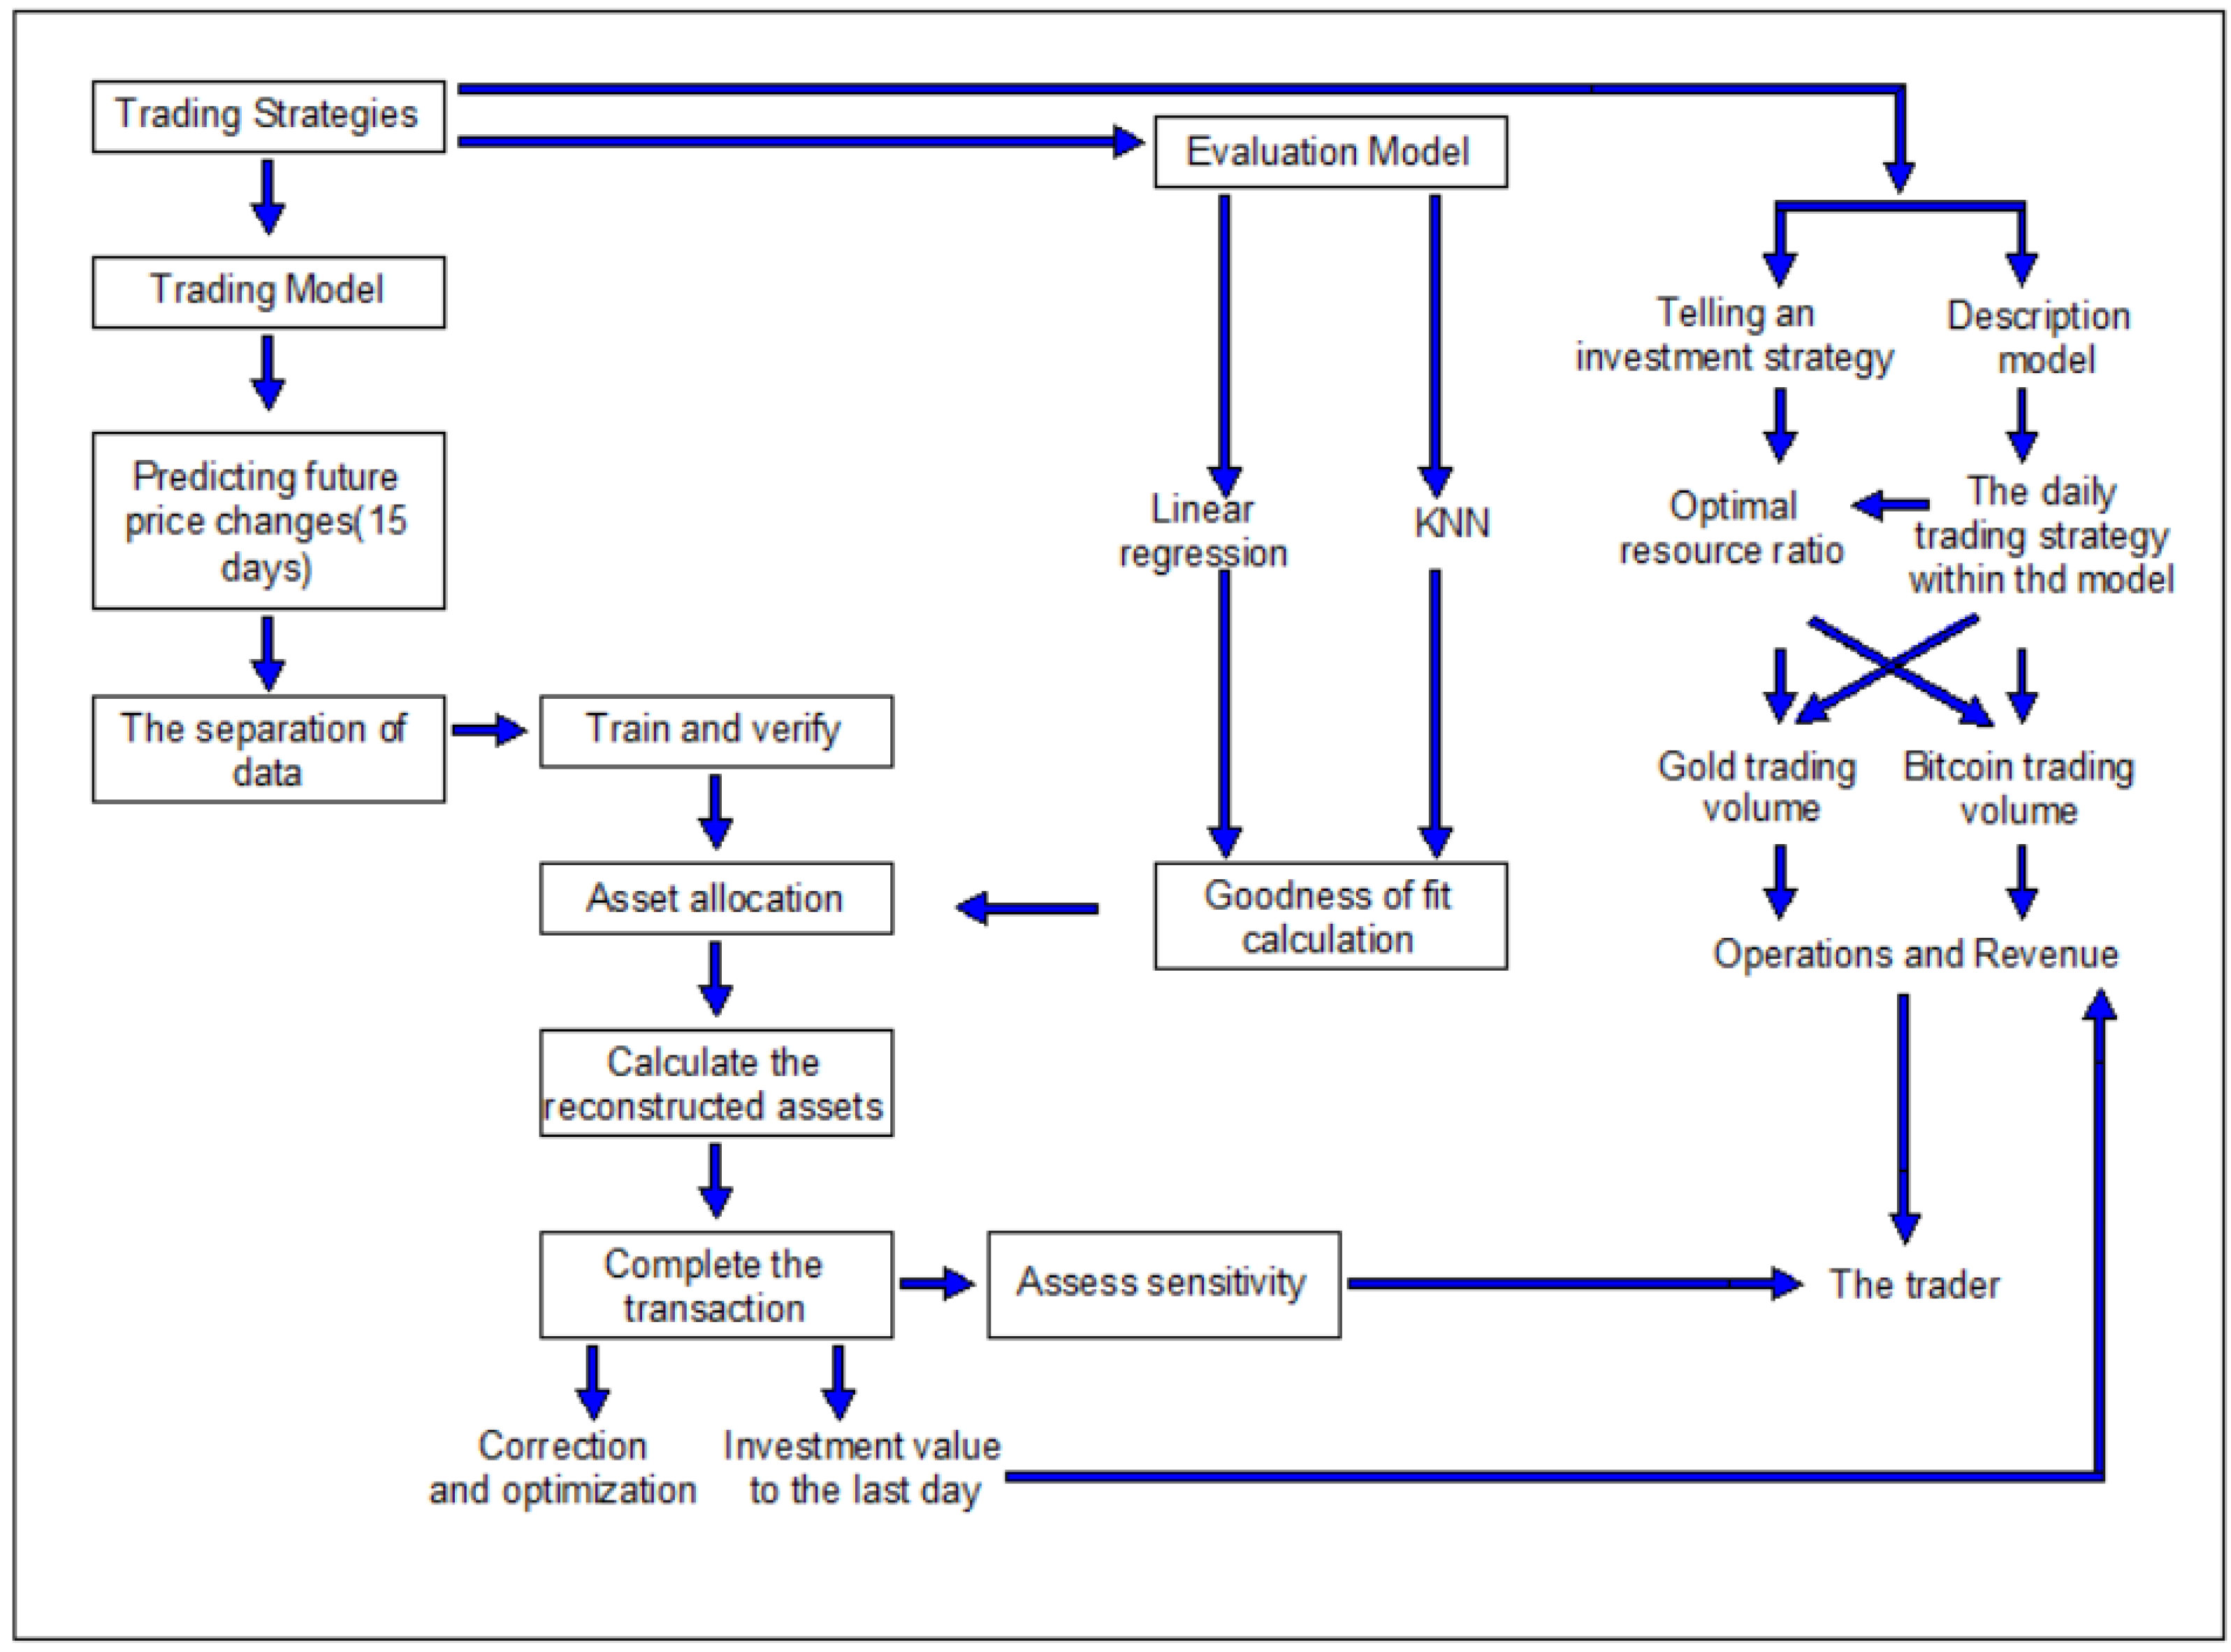
  • Based on the historical pricing data of gold and bitcoin, to establish a price fluctuation prediction model for both;
  • Establishment of a model for effective evaluation of the portfolio strategies;
  • Based on the investment portfolio model of the financial industry, this paper studies the relationship between bitcoin and gold, puts forward investment suggestions for maximizing benefits and conducts a sensitivity analysis of the scheme to put forward reasonable suggestions for improvement.
In summary, the whole modeling process can be shown in Figure 1:

2. Assumptions and Justifications

To simplify the problem, this paper made the following basic assumptions, each of which is properly justified.
Assumption 1. 
Assume a trader only trades on gold trading days.
Justification: 
Gold is only traded on the opening day, which means that the trading status of gold during weekends or holidays will remain in holding, so assume that trading occurs on the opening day of the gold market [26].
Assumption 2. 
Suppose the trader only makes one trade per day.
Justification: 
There is no limit to the number of trades per day in a trader’s requirements. To enable the model to achieve higher prediction rates and accuracy, assume that traders only make one trade per day to minimize the associated error [27].
Assumption 3. 
It is assumed that each transaction is carried out with the minimum transaction cost method.
Justification: 
From the request made by the trader, know that the commission cost of each transaction is α% of the transaction amount, and α g o l d = 1% and α b i t c o i n = 2%, so assume that the transaction cost of each transaction is the minimum state, to maximize the value of the final USD 1000 [28].
Assumption 4. 
It is assumed that there is a decimal point in the transaction amount during the transaction of USD, gold, and bitcoin.
Justification: 
Both gold and bitcoin are easily divided as currencies in circulation. Bitcoin can be divided into eight decimal places, which is 1 Satoshi. Although gold can also be divided, it is more troublesome than bitcoin. At one time assumed that the transaction amount of the two could be accurate to the same decimal point during the transaction [29].

3. Notations

The key mathematical notations used in this paper (shown as Table 1).

4. Model Preparation

In this section, a brief overview of the data was used to build the models with subsequent descriptions.
Our model was built around investing in gold and bitcoin to gain maximum value. This paper obtained the daily pricing data for gold and bitcoin from 10 September 2016 to 10 September 2021 [30]. The data were obtained from the London Gold and Silver Market Association and the NASDAQ. From the two pricing data files, LBMA-GOLD.csv and BCHAIN-MKPRU.csv, not only did learn about the daily price fluctuation range and rising trend of gold and bitcoin but also that it was also found that bitcoin can be traded daily. Gold trades only on the opening day, which was our key message. Due to the large amount of data provided and which was not intuitive, so visualized the data in the subsequent modeling process.

5. Model I: Linear Regression Prediction Model

5.1. Data Preprocessing

Based on the machine-learning regression prediction model, it’s necessary to ensure the accuracy and availability of the data before performing the data analysis. If machine learning is performed based on unreliable data, then accurate predictions cannot be made. According to the data files provided by the traders, gold is only traded on an opening day, so I deleted the blank lines in the LBMA GOLD.csv file. In addition, to ensure the consistency of the data and reduce the prediction error, also the pricing data corresponding to bitcoin was deleted during the gold shutdown day, predicting that the model could be more accurate.

5.2. Data Segmentation

During the development of the machine-learning linear regression prediction model built, it was hoped that the trained model would perform well on new, unseen data. To simulate new, unseen data, this paper split the pricing data on gold and bitcoin into two parts. Of these, the first part was a larger subset of the data, used as a training set, representing 90% of the original data, while the second part was a smaller subset, where the remaining 10% was used as a test set. This method does not use cross-validation to overcome the possible overfitting phenomenon, while K-fold cross validation is used in the following application of the method.
Next, used the training set to build a predictive model and then applied this trained model to the test set for prediction to select the best model based on the model performance on the test set.

5.3. Linear Regression Model (LRM)

5.3.1. Regression to the Problem

Regression is used to predict the relationship between the input and output variables, especially when the output variable changes when the value of the given input variable changes. The regression model is an exact function representing the mapping between the input variable and the output variable. The learning of such problems is equivalent to function fitting, where a function curve was chosen to fit the pricing data for gold and bitcoin for the period from 10 September 2016 to 10 September 2021 to predict future data prices.

5.3.2. Linear Regression Model Description

In the linear regression analysis, two independent variables were included, and linear relationships were found between the dependent and independent variables. This paper chose the price fluctuations before the day of gold and the difference between the largest and smallest as the influence factors, where the formula in the multivariate linear regression is as follows, X denotes the vector, and θ denotes the parameters:
h θ ( X ) = θ 0 + θ 1 x 1 + θ 2 x 2 + + θ n x n
Here, default that 0 is always equal to 1. To facilitate representation, consider the hypothesis function can be written in the form of vectors:
h θ ( X ) = θ Τ X
What’s more,
θ = [ θ 0 , θ 1 , , θ n ] Τ
X = [ 1 , x 1 , x 2 , , x n ] T
The influence factor solution formula is as follows:
Y = θ 1 × X 1 + θ 2 × X 2 + G o l d ( E T F ) p r i c e = θ 1 × P C T _ c h a n g e + θ 2 × H L _ P C T + c
To choose the most suitable linear regression model, this paper still used the loss function to find out the vector that minimized the loss function. Next, found a line in the given gold and bitcoin data file to fit it, then assumed the equation of the line, then substituted the data point into the assumed equation to get the observation, and found the parameters minimizing the sum of the square of the actual value from the observation, presented in the following formula:
J ( θ ) = 1 2 m i = 0 m ( h θ ( X ) y ) 2 = 1 2 m ( X θ y ) T ( X θ y )
In addition, to obtain the optimal local solution, the gradient descent algorithm was also adopted in the machine-learning process, and the whole process used the following formula:
J ( θ ) θ = θ 1 2 i = 1 m ( h θ ( x ) y ) 2 = ( h θ ( x ) y ) x

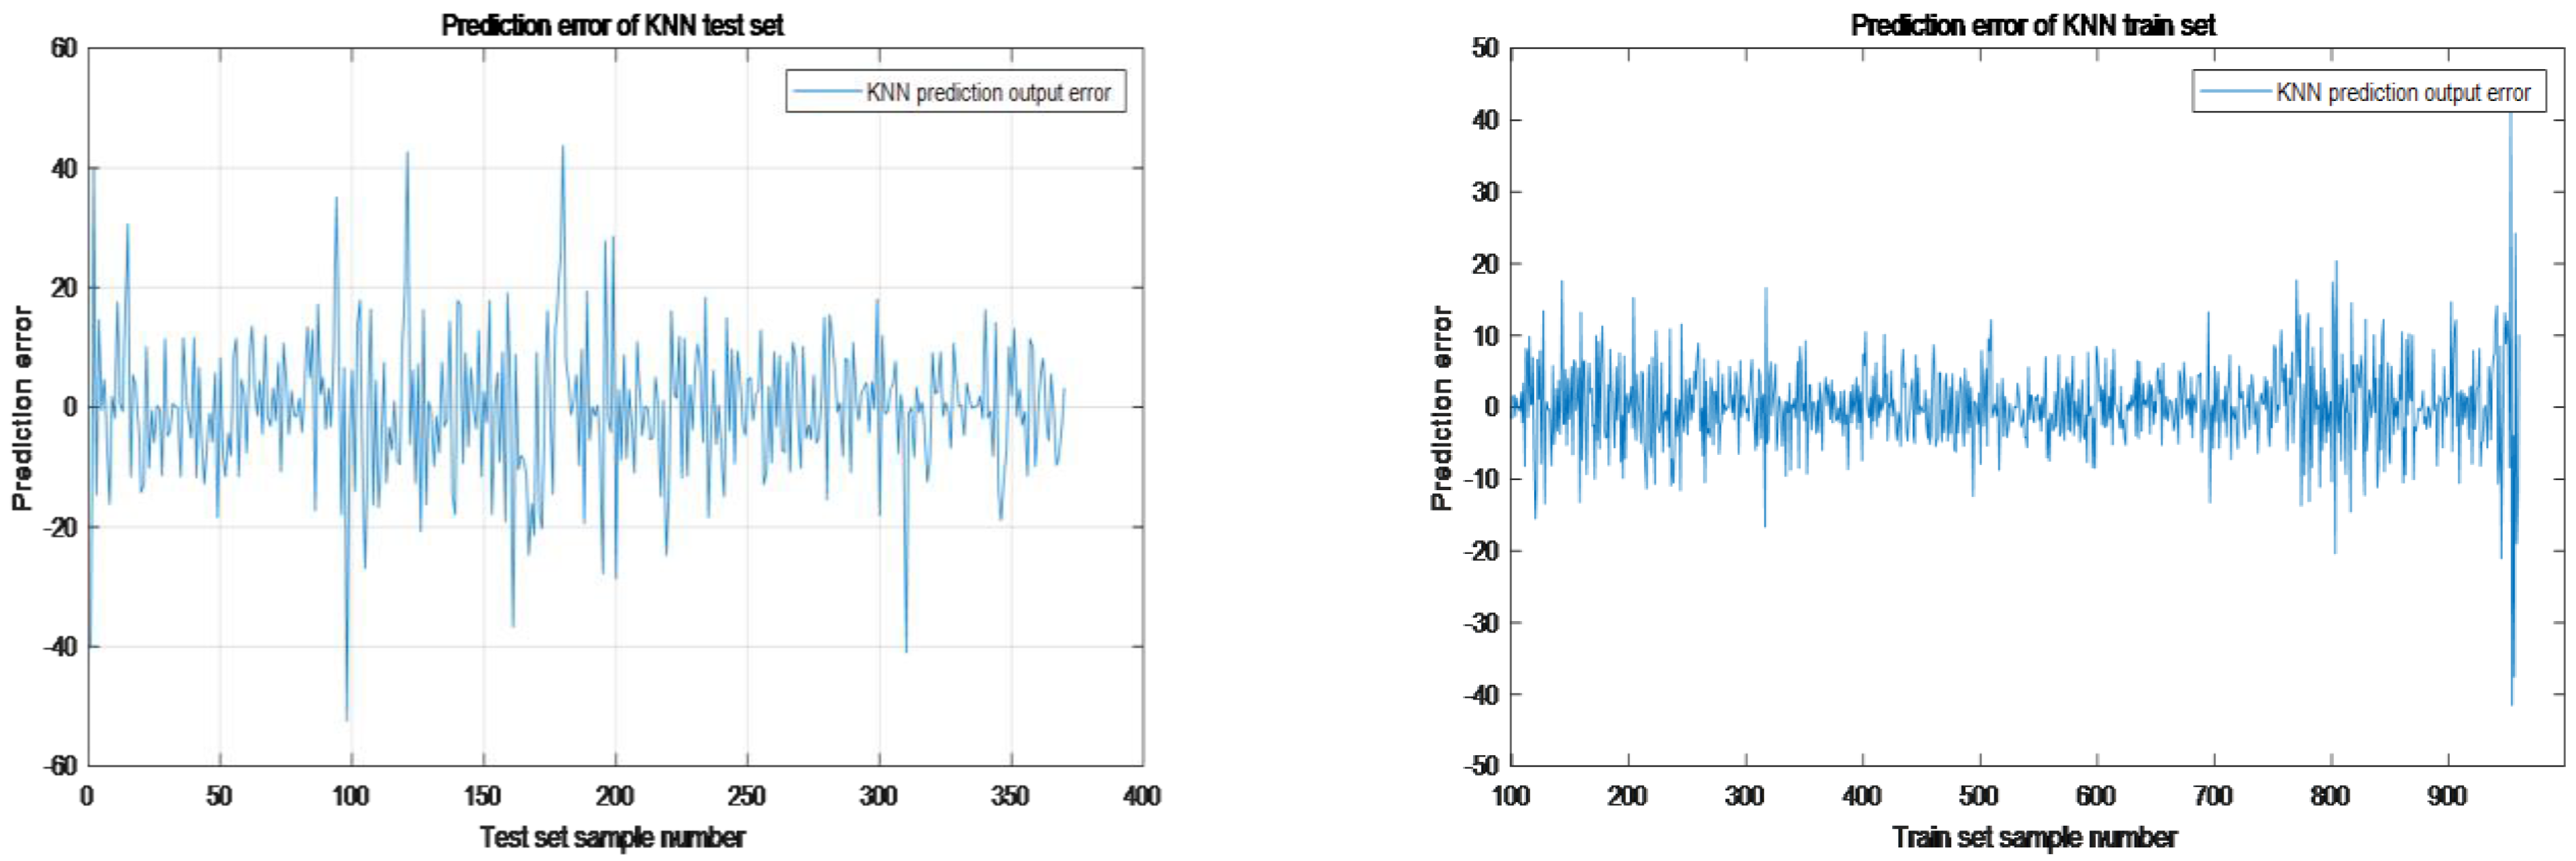
6. Model II: K-Nearest Neighbor Algorithm

Data algorithms use feature similarity to evaluate the accuracy of two predicted data. To guarantee that the new data predicted by gold and bitcoin are at the same points in the original data set, this paper decided to use the K-Nearest Neighbor KNN algorithm(KNN) to predict feature similarity.

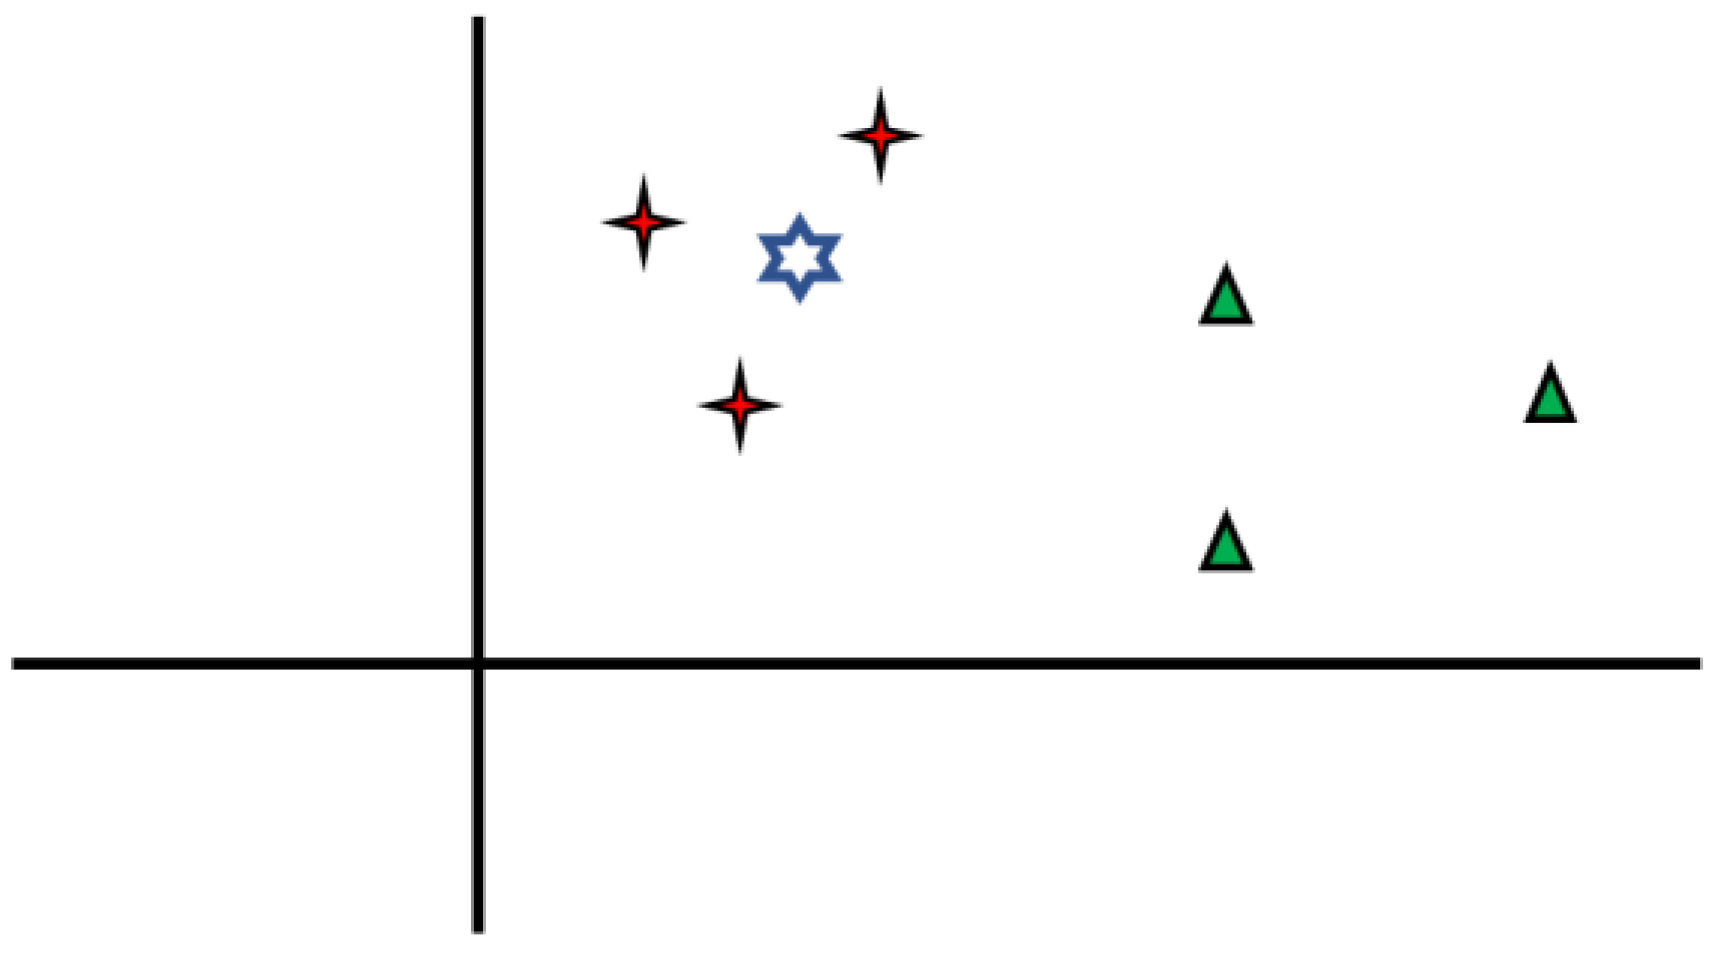
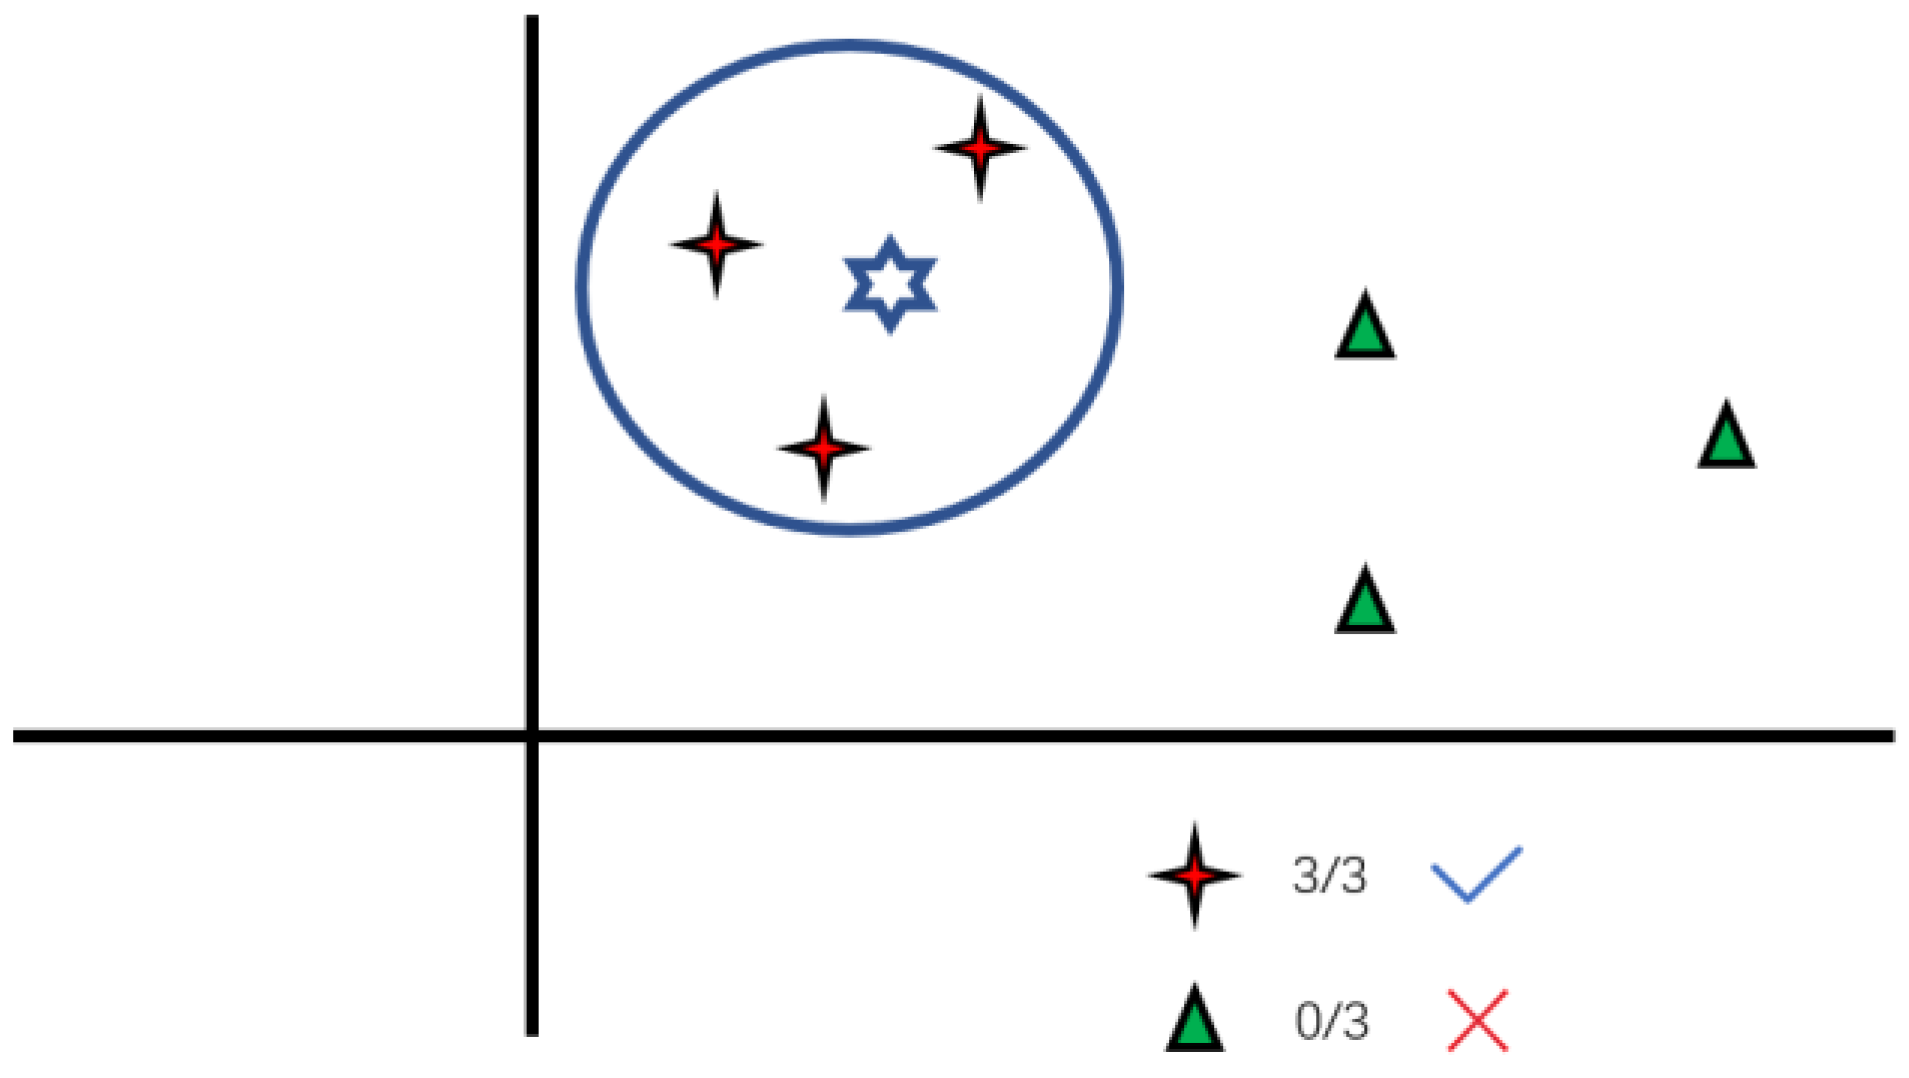
6.1. KNN Algorithm Application

First, use two simple pictures to understand how the KNN algorithm could help us achieve our goal, including the distribution of red diamonds (RD) and green triangles(GT), which shown in Figure 2. Where, RD and GT represent different classes in the training set, and blue star(BS) represent predicted instances.
Then, find out the blue star (BS) level; the BS can be RD or GT. “K” is the nearest neighbor of the KNN algorithm to select from it, which is shown in Figure 3.

6.1.1. Selecting the Appropriate K-Value

In the process, choose the appropriate K value to predict gold and bitcoin. First, in order to train the error rate and verify the error rate, we need to access two parameters with different K values. The following charts show the error rate of gold and bitcoin in the prediction, corresponding to the test set and the training set, which show in Figure 4 and Figure 5.

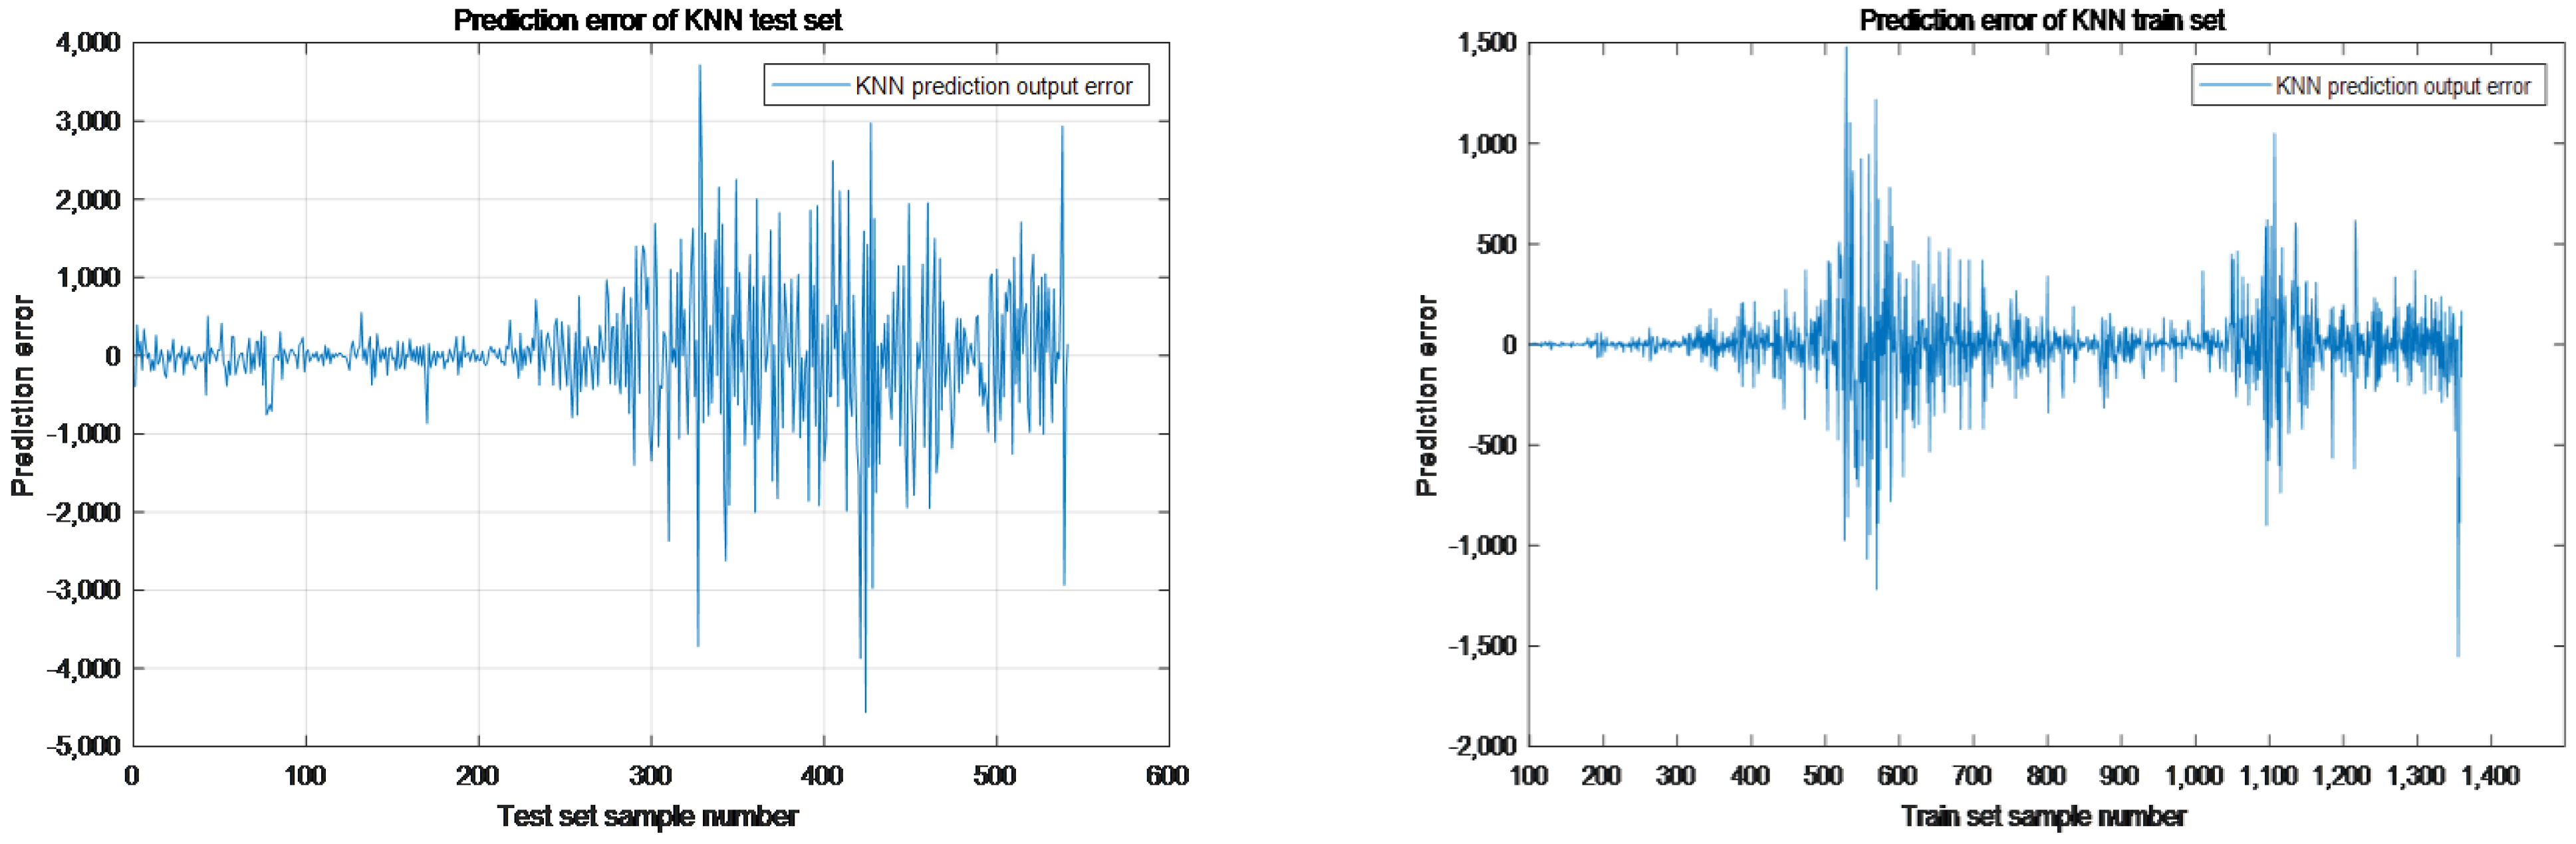
6.1.2. Obtaining the Results

The above process makes our goal more clear. From the initial data separation training and testing, we can get the optimal value of K. We can draw the verification error curve and get the optimal value of K, which can be applied to the prediction of gold and bitcoin.

6.2. Score Function to Determine Portfolio
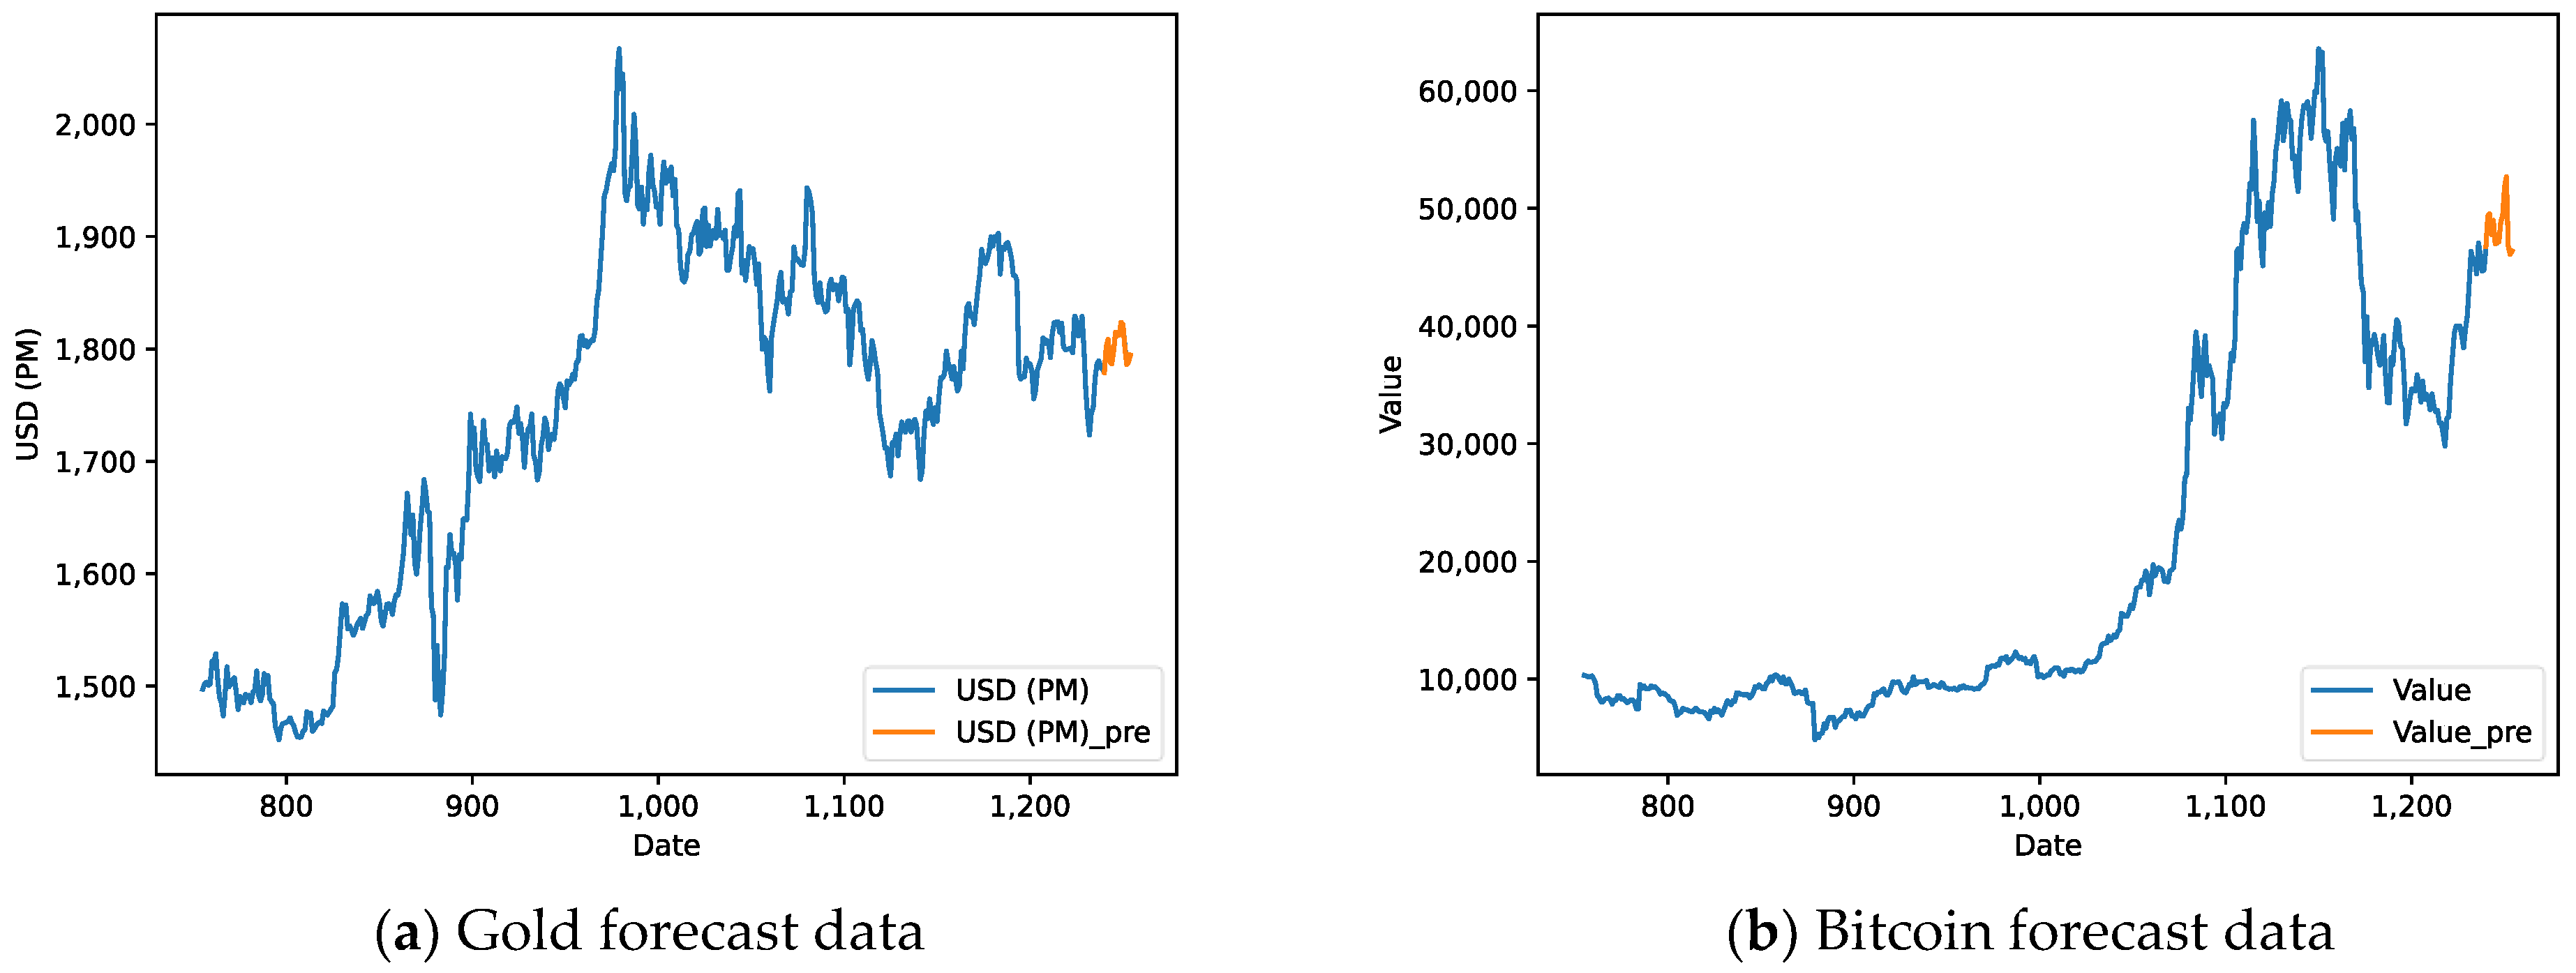
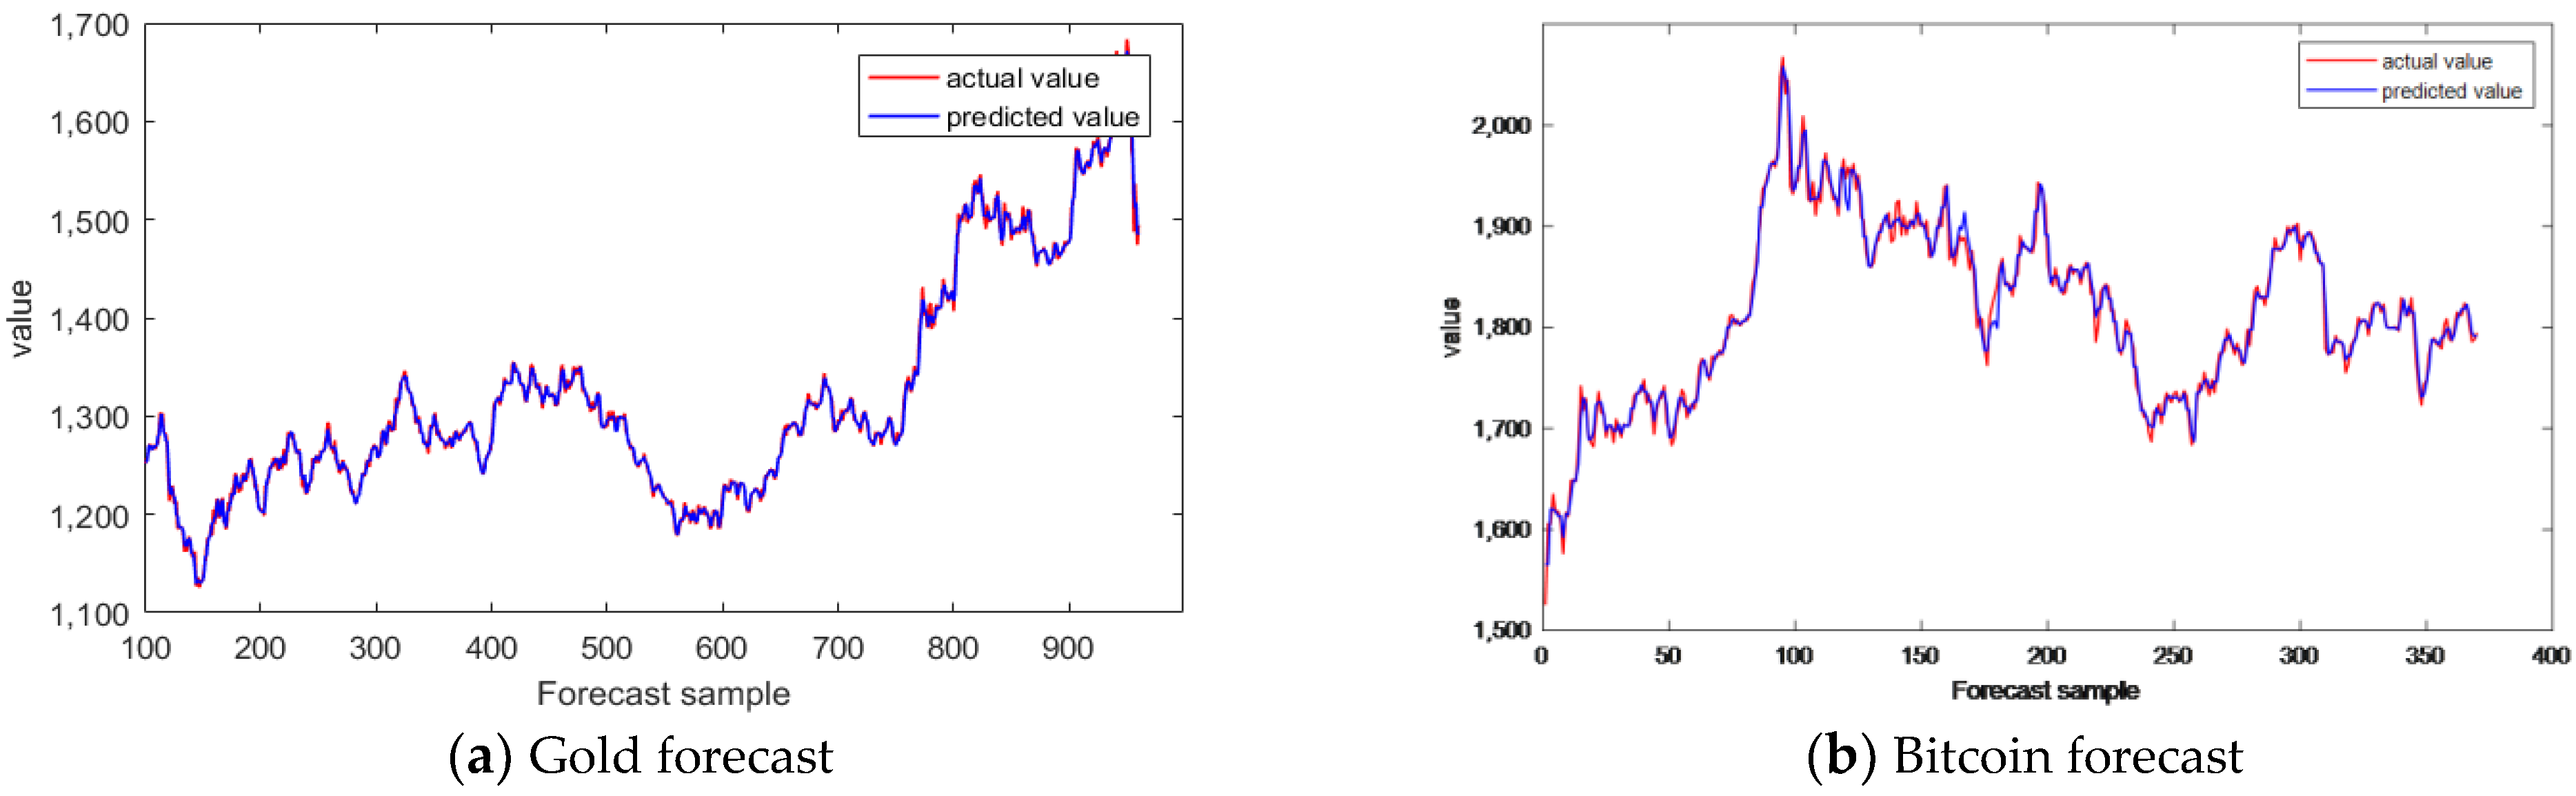
In the end, this paper adopted the score function method to determine our portfolio scheme, where the score function was the built-in function and was used in calculation using Python 3.7 [31]. The results also used the decision coefficient to reflect the extent of the interpretation of the independent variables set in gold and bitcoin. The determination coefficient reflected what percentage of y fluctuations can be described by fluctuations of x, the percentage of variants characterizing variable Y that the controlled independent variable X can explain. The higher the interpretation, the higher the independent variable-induced change as a percentage of the total change, and the more successful our portfolio was.

7. Results

7.1. Forecast Results

With the help of Python 3.7, the linear regression modeling process was implemented, and through the variables, the pricing data of gold and bitcoin were predicted as the fluctuation range. From our fitting, the prediction accuracy was high, and the results are shown in Figure 6 and Figure 7:
In addition, through Matlab 2018b [32], this paper obtained the prediction comparison results of training set and test machine in KNN algorithm, as shown in Figure 8 and Figure 9:

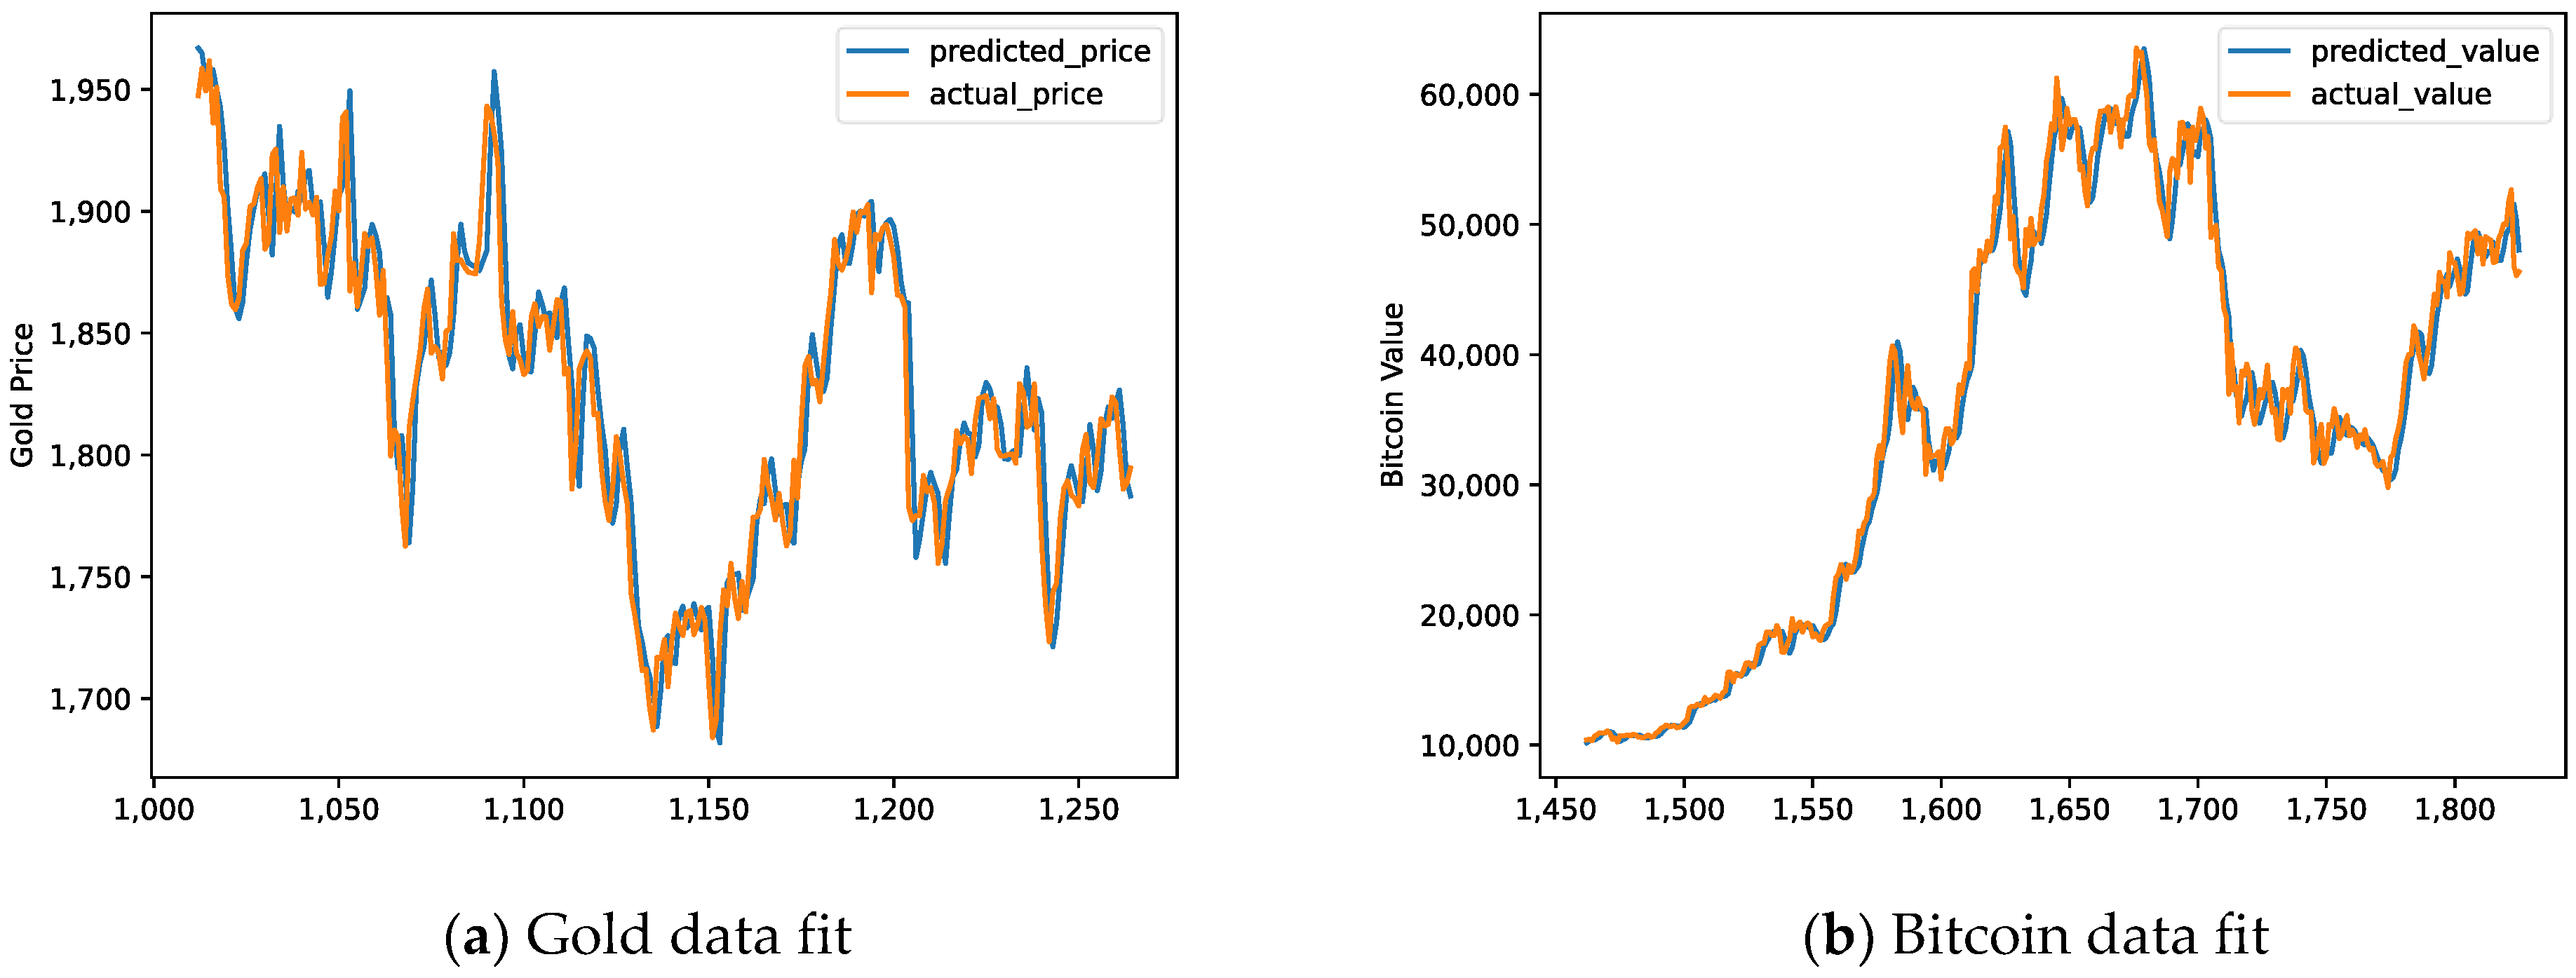
7.2. Test of Goodness of Fit

The mapping process looked for very mild gold, and bitcoin data sequenced mathematical model processes. After fitting good data, it better evaluated our prediction accuracy and adopted the goodness of fit test scheme with the concept of test probability to evaluate the quality of gold and bitcoin data fit. Specifically, X d f 2 represents the degree of difference between theory and practice, O i represents the actual value, and T i represents the theoretical value. The goal of the chi-square test was to check the significance of the difference between the observed frequency and the expected frequency, and the goodness-of-fit test measured the relationship strength between variables. This paper used the Chi-square statistics for statistical significance tests with the following formula:
X d f 2 = i = 1 k ( O i T i ) 2 T i
In the linear regression prediction, the goodness of fit of gold is 89.44%, and the goodness of fit of Bitcoin is 98.43%. In the test set prediction of KNN algorithm, the goodness of fit of gold is 97.25%, and the goodness of fit of Bitcoin is 95.06%.

7.3. Price Change Weights Determine the Optimal Strategy

This paper predicted the price changes of gold and bitcoin in the fifteen days after and took the average value as the estimated amount. According to the following formula:
p r e s e n t _ c r a s h : p r e s e n t _ g o l d : p r e s e n t _ b i t c o i n = l o g i s t i c ( δ 1 + δ 2 ) : l o g i s t i c ( δ 1 ) : l o g i s t i c ( δ 2 )
where δ   is the estimated average price minus the current price, δ 1 is the price expressed as gold, expressed δ 2 as the price of bitcoin; α g o l d = 1% and α b i t c o i n = 2%. In the above formula, this paper determined the investment strategy by controlling the daily ratio of gold and bitcoin.
p r e s e n t _ c r a s h   +   p r e s e n t _ g o l d   ×   t h e P r i c e O f G o l d   +   p r e s e n t _ b i t c o i n   ×   t h e P r i c e O f B i t c o i n   =   p r e v i o u s _ c r a s h   +   p r e v i o u s _ g o l d   ×   t h e P r i c e O f G o l d   +   p r e v i o u s _ b i t c o i n   ×   t h e P r i c e O f B i t c o i n     α   ×   p r e v i o u s _ g o l d     p r e s e n t _ g o l d t h e P r i c e O f G o l d   α   ×   p r e v i o u s _ b i t c o i n     p r e s e n t _ b i t c o i n t h e P r i c e O f B i t c o i n
According to the following formula, supplement the judgment:
c r a s h _ a l l < p r e s e n t _ g o l d + a v a r a g e _ g o l d × t h e P r i c e O f G o l d + a v a r a g e _ b i t × t h e P r i c e O f B i t c o i n
If the above formula was true, traders could trade on the opening day of the gold market; otherwise, they would not trade. With this algorithm, this paper succeeded in arriving at the final result.

8. Discussion

This paper used the established model to obtain a series of data by changing the size of the initial amount, the range of which was from USD 1000 to USD 10,000. Using Python 3.7, finally a straight line was drew. The image is as Figure 10:
This shows that our initial amount had a positive relationship with the final return, which indicates that our model is relatively robust and reliable. The advantages and disadvantages of this modeling process are discussed below.
By comparing the prediction of the linear regression model and KNN algorithm, it can be seen that the prediction accuracy of the former for Bitcoin is 3.37% higher than that of the latter. In comparison, the prediction accuracy of gold is far lower than that of the latter, with a difference of 7.81%. Compared with linear regression, KNN algorithm prediction is relatively simpler and rougher, but the computational volume also increases. It has been proved that if the linear relationship between the data is obvious, linear regression prediction will be better than that of the KNN algorithm; otherwise, KNN will be better. In addition, with the increase of dimension, KNN algorithm will face more obvious failure problem, namely dimension disaster.

9. Conclusions

In this paper, the machine learning linear regression model based on time series and KNN algorithm are used to model the Bitcoin and gold portfolio transactions so as to obtain the prediction results and determine the best portfolio. In order to evaluate the effect of the model, the goodness-of-fit test is used to determine the weight of price changes, and the investment proportion of gold and Bitcoin is obtained. The experimental results show that our initial amount is positively correlated with the final return, which reflects that our model is relatively stable and reliable and can increase the investment confidence of investors.
The model used in this paper mainly focuses on the price prediction between gold and Bitcoin. In the future, the model could be applied to different financial domains and, with some tweaks to the model architecture, to other emerging industries. In addition, in the context of accelerating globalization of economic and financial markets, there will be more investment into bitcoin, gold, stocks and other financial investment markets in the future. How to improve the model to avoid financial risks is also the next research direction of this paper.

Author Contributions

Conceptualization, J.L. and X.R.; methodology, X.L. and S.G.; validation, J.L. formal analysis, S.G. and X.L.; investigation, J.L. and X.R.; writing—original draft preparation, J.L.; writing—review and editing, J.L. and S.G.; visualization, J.L.; supervision, J.L. and X.R.; project administration, S.G. All authors have read and agreed to the published version of the manuscript.

Funding

This research is supported by the Southwest Minzu University Research Startup Fund (Grant No. RQD2021064) and also supported by the Fundamental Research Funds for the Central Universities, Southwest Minzu University (Grant Number: 2021XJTD01, 2021PTJS24).

Institutional Review Board Statement

Not applicable.

Informed Consent Statement

Not applicable.

Data Availability Statement

The data used in the research paper are available from the corresponding authors upon request.

Acknowledgments

We are using this opportunity to express our gratitude to Fangyao Liu. We are thankful for his aspirational writing skill guidance and invaluable constructive advice during this research paper.

Conflicts of Interest

The authors declare no conflict of interest.

References

  1. Ciaian, P.; Rajcaniova, M.; Kancs, D.A. The economics of BitCoin price formation. Appl. Econ. 2016, 48, 1799–1815. [Google Scholar] [CrossRef] [Green Version]
  2. Munim, Z.H.; Shakil, M.H.; Alon, I. Next-day bitcoin price forecast. J. Risk Financ. Manag. 2019, 12, 103. [Google Scholar] [CrossRef] [Green Version]
  3. Hayes, A.S. Bitcoin price and its marginal cost of production: Support for a fundamental value. Appl. Econ. Lett. 2019, 26, 554–560. [Google Scholar] [CrossRef] [Green Version]
  4. Greaves, A.; Au, B. Using the bitcoin transaction graph to predict the price of bitcoin. No Data 2015, 8, 416–443. [Google Scholar]
  5. Velankar, S.; Valecha, S.; Maji, S. Bitcoin price prediction using machine learning. In Proceedings of the 2018 20th International Conference on Advanced Communication Technology (ICACT), Chuncheon, South Korea, 11–14 February 2018; IEEE: Piscataway, NJ, USA, 2018; pp. 144–147. [Google Scholar]
  6. Chen, Z.; Li, C.; Sun, W. Bitcoin price prediction using machine learning: An approach to sample dimension engineering. J. Comput. Appl. Math. 2020, 365, 112395. [Google Scholar] [CrossRef]
  7. Atsalakis, G.S.; Atsalaki, I.G.; Pasiouras, F.; Zopounidis, C. Bitcoin price forecasting with neuro-fuzzy techniques. Eur. J. Oper. Res. 2019, 276, 770–780. [Google Scholar] [CrossRef]
  8. Lamothe-Fernández, P.; Alaminos, D.; Lamothe-López, P.; Fernández-Gámez, M.A. Deep learning methods for modeling bitcoin price. Mathematics 2020, 8, 1245. [Google Scholar] [CrossRef]
  9. Wu, C.H.; Lu, C.C.; Ma, Y.F.; Lu, R.S. A new forecasting framework for bitcoin price with LSTM. In Proceedings of the 2018 IEEE International Conference on Data Mining Workshops (ICDMW), Singapore, 17–20 November 2018; IEEE: Piscataway, NJ, USA, 2018; pp. 168–175. [Google Scholar]
  10. Phaladisailoed, T.; Numnonda, T. Machine learning models comparison for bitcoin price prediction. In Proceedings of the 2018 10th International Conference on Information Technology and Electrical Engineering (ICITEE), Bali, Indonesia, 24–26 July 2018; IEEE: Piscataway, NJ, USA, 2018; pp. 506–511. [Google Scholar]
  11. Sin, E.; Wang, L. Bitcoin price prediction using ensembles of neural networks. In Proceedings of the 2017 13th International Conference on Natural Computation, Fuzzy Systems and Knowledge Discovery (ICNC-FSKD), Guilin, China, 29–31 July 2017; IEEE: Piscataway, NJ, USA, 2017; pp. 666–671. [Google Scholar]
  12. Awoke, T.; Rout, M.; Mohanty, L.; Satapathy, S.C. Bitcoin Price Prediction and Analysis Using Deep Learning Models. In Communication Software and Networks; Springer: Singapore, 2021; pp. 631–640. [Google Scholar]
  13. Roy, S.; Nanjiba, S.; Chakrabarty, A. Bitcoin price forecasting using time series analysis. In Proceedings of the 2018 21st International Conference of Computer and Information Technology (ICCIT), Dhaka, Bangladesh, 22–24 December 2018; IEEE: Piscataway, NJ, USA, 2018; pp. 1–5. [Google Scholar]
  14. Cretarola, A.; Figà-Talamanca, G.; Patacca, M. Market attention and Bitcoin price modeling: Theory, estimation and option pricing. Decis. Econ. Financ. 2020, 43, 187–228. [Google Scholar] [CrossRef] [Green Version]
  15. Nikou, M.; Mansourfar, G.; Bagherzadeh, J. Stock price prediction using DEEP learning algorithm and its comparison with machine learning algorithms. Intell. Syst. Account. Financ. Manag. 2019, 26, 164–174. [Google Scholar] [CrossRef]
  16. Lei, J.; Lin, Q. Analysis of gold and bitcoin price prediction based on LSTM model. Acad. J. Comput. Inf. Sci. 2022, 5, 95–100. [Google Scholar]
  17. Yu, J.; Shang, Y.; Li, X. Dependence and Risk Spillover among Hedging Assets: Evidence from Bitcoin, Gold, and USD. Discret. Dyn. Nat. Soc. 2021, 2021, 2010705. [Google Scholar] [CrossRef]
  18. Sun, Y.; Xie, S.; Li, N. Research on Gold and Bitcoin Price Prediction Model and Sensitivity Analysis. World Sci. Res. J. 2022, 8, 468–471. [Google Scholar]
  19. Zhou, Q.; Chen, Z.; Cai, Z.; Xia, Z. Prediction of the Best Portfolio for Bitcoin and Gold based on the ARIMA Model. Front. Bus. Econ. Manag. 2022, 4, 141–149. [Google Scholar] [CrossRef]
  20. Liu, F.; Peng, Y.; Chen, Z.; Shi, Y. Modeling of characteristics on artificial intelligence IQ test: A fuzzy cognitive map-based dynamic scenario analysis. Int. J. Comput. Commun. Control. 2020, 14, 653–669. [Google Scholar] [CrossRef] [Green Version]
  21. Klein, T.; Thu, H.P.; Walther, T. Bitcoin is not the New Gold—A comparison of volatility, correlation, and portfolio performance. Int. Rev. Financ. Anal. 2018, 59, 105–116. [Google Scholar] [CrossRef]
  22. Qiu, Q.; Maillart, L.; Prokopyev, O.; Cui, L. Optimal Condition-Based Mission Abort Decisions. IEEE Trans. Reliab. 2022. [Google Scholar] [CrossRef]
  23. Liu, X.; Masoud, N.; Zhu, Q.; Khojandi, A. A markov decision process framework to incorporate network-level data in motion planning for connected and automated vehicles. Transp. Res. Part C Emerg. Technol. 2022, 136, 103550. [Google Scholar] [CrossRef]
  24. Dyhrberg, A.H. Bitcoin, gold and the dollar–A GARCH volatility analysis. Financ. Res. Lett. 2016, 16, 85–92. [Google Scholar] [CrossRef]
  25. Ye, W.; Sun, L.; Miao, B. Dynamic Cointegration of Gold and Bitcoin based on Semi-parametric MIDAS fractional regression model. Syst. Sci. Math. 2020, 40, 1270–1285. [Google Scholar]
  26. Kang, Y.Z. Analysis on the trajectory characteristics and influencing factors of gold price fluctuation. Mod. Enterp. 2022, 9, 94–96. [Google Scholar]
  27. Zhang, D. Establishment, Evaluation and Improvement of Spot Gold Trading Strategy; Xinjiang University of Finance and Economics: Urumqi, China, 2015. [Google Scholar]
  28. Wang, Q.; Du, Z. Research on the difference between Bitcoin and gold hedging Function: Based on VAR-BEKK-GARCH model. Manag. Sci. 2022, 35, 134–146. [Google Scholar]
  29. Meng, T. Currency Trading Data in Network Characteristics Research; Beijing University of Posts and Telecommunications: Beijing, China, 2021. [Google Scholar]
  30. Available online: https://www.comap.com/contests (accessed on 1 October 2022).
  31. Available online: https://www.python.org/downloads/windows/ (accessed on 1 October 2022).
  32. Available online: https://ww2.mathworks.cn/products/matlab.html (accessed on 1 October 2022).
Figure 1. Model overview flowchart.
Sustainability 14 14659 g001
Figure 2. Schematic diagram of distribution map 1.
Sustainability 14 14659 g002
Figure 3. Schematic diagram of distribution map 2.
Sustainability 14 14659 g003
Figure 4. The error rate of gold forecasts.
Sustainability 14 14659 g004
Figure 5. The error rate of bitcoin forecasts.
Sustainability 14 14659 g005
Figure 6. Predictions for gold and bitcoin.
Sustainability 14 14659 g006
Figure 7. Fit data for gold and bitcoin.
Sustainability 14 14659 g007
Figure 8. Training set prediction results.
Sustainability 14 14659 g008
Figure 9. Test set prediction results.
Sustainability 14 14659 g009
Figure 10. Sensitivity analysis chart.
Sustainability 14 14659 g010
Table 1. Notations used in this paper.
SymbolDescriptionUnit
PCT_changePast price fluctuation%
HL_PCTMaximum price difference in the past%
present_crashCash held after the transaction$
present_goldPost-trade gold holdingsoz.t
p r e s e n t _ b i t c o i n Hold bitcoin after the transactionBTC
δ 1 Change in the estimated price of gold (15 days later)$/oz.t
δ 2 Change in the estimated price of bitcoin (after 15 days)$/BTC
t h e P r i c e O f G o l d The current price of gold$
Publisher’s Note: MDPI stays neutral with regard to jurisdictional claims in published maps and institutional affiliations.

