Article

Analysis of the Quality of Service in Gastronomic Festivals

by
Ronald Campoverde-Aguirre
1,
Mauricio Carvache-Franco
2,
Wilmer Carvache-Franco
1,* and
María Almeida-Cabrera
1
1
Facultad de Ciencias Sociales y Humanísticas, Escuela Superior Politécnica del Litoral, ESPOL, Guayaquil 090615, Ecuador
2
Facultad de Turismo y Hotelería, Universidad Espíritu Santo, Samborondón 092301, Ecuador
*
Author to whom correspondence should be addressed.
Sustainability 2022, 14(21), 14605; https://doi.org/10.3390/su142114605
Submission received: 23 September 2022 / Revised: 19 October 2022 / Accepted: 27 October 2022 / Published: 7 November 2022
(This article belongs to the Special Issue Marketing Management in Hospitality and Tourism Industries Volume II)

Abstract

:
Gastronomic festivals have become a pathway to promoting the gastronomy and culture of a tourist destination. However, there is no taxonomy for evaluating the quality of services in these types of festivals. For this reason, the present study aimed to propose a service quality evaluation model applicable to gastronomic festivals based on a review of commonly used models. The research was carried out at the Raíces Gastronomic Festival held in Guayaquil, Ecuador, in 2018. Six hundred valid questionnaires were obtained, and exploratory factor analysis (EFA) was applied to identify the dimensions of the items. In addition, confirmatory factor analysis (CFA) was used to validate the proposed model. As a result, we obtained a questionnaire to evaluate the quality of services in gastronomic festivals based on tangibility, reliability, responsiveness, and adequacy dimensions. These findings contribute to expanding the academic literature on food festivals and provide a questionnaire to measure the service quality of this type of event.

1. Introduction

Local cuisine is a set of inherited representations, beliefs, knowledge, practices, and learning associated with food and shared by individuals of a given culture or social group [1]. For this reason, gastronomy in the tourist experience is one of the most outstanding and studied aspects of tourist destinations [2], which makes local food an essential resource for tourists [3].
Among tourist and gastronomic promotion events, gastronomic festivals have become an increasingly used alternative. A food festival is defined as an event that highlights the region or local specialty food or food-related activities and programs [4]. Food festivals offer accessible entertainment for all demographic groups due to the association between individuals’ daily life and food [5,6]. In addition, they offer tourists the chance to increasingly enrich their cultural capital by having original and authentic cultural experiences [7].
In the Latin American region, some countries have sought to position themselves as tourist destinations, using gastronomy as a channel to communicate culture, natural resources, and history. Among these types of events, the gastronomic festivals of Mistura (Peru) and Raíces (Ecuador) stand out. Therefore, previous studies have studied the behavior of visitors and the outcomes of these events and have explored the benefits for tourism and the economy perceived by their attendees [8].
In particular, the Mistura festival in Peru has helped promote restaurants since 2008, reaching close to 400,000 visitors in 2016, 10% of whom were foreign tourists [
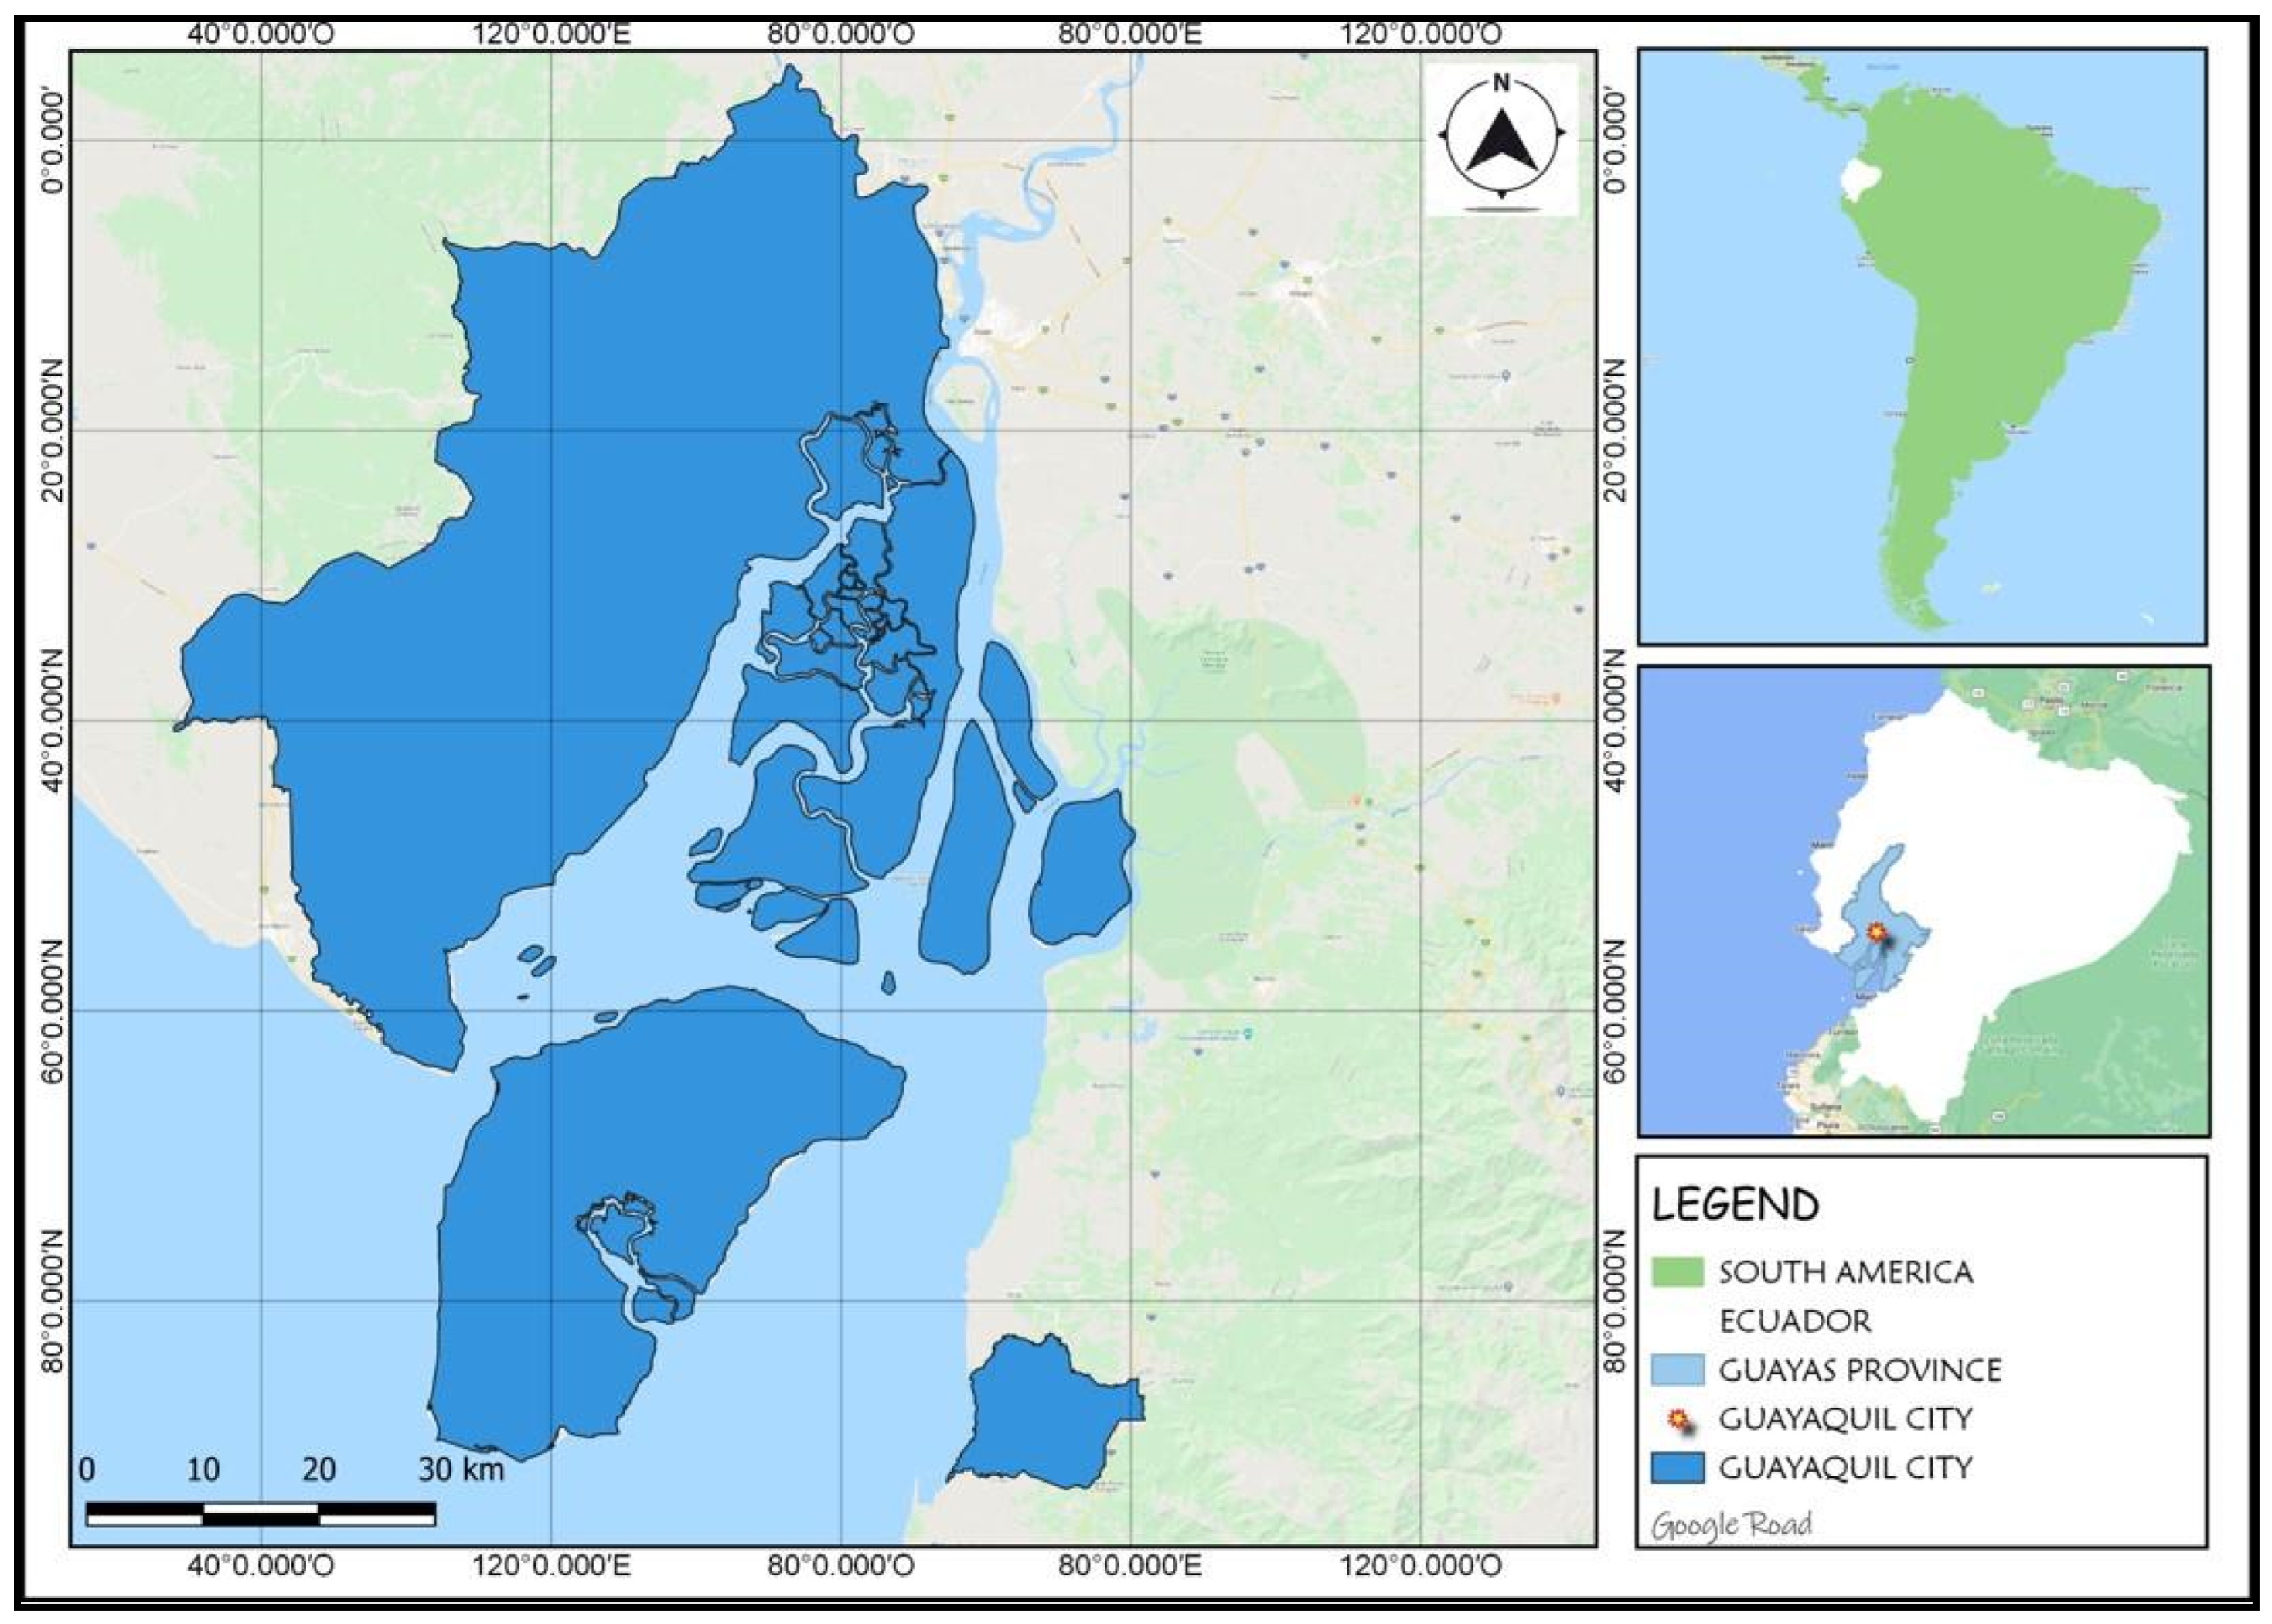
9]. In addition, the international gastronomic festival called Raíces was held for the first time in July 2014 in Guayaquil, Ecuador, as part of a tourism promotion strategy fostered by the Guayaquil Mayor’s Office. Since then, this festival has been the main gastronomic event in Ecuador, seeing more than 70,000 visitors each year.
One of the objectives of this festival is to bring together the best local food establishments, popularly known as huecas. Raíces seeks to publicize the processes of preparing traditional foods, strengthening culture, and promoting the city as an attractive gastronomic destination at a national and international level. Furthermore, participating establishments can promote themselves at the festival by showcasing the attributes of their products and services [10] and can train their staff to improve the quality of their services.
The gastronomic industry is increasingly competing with national and international offerings at a regional level. Therefore, food establishments must implement differentiating components to add value to the service and final product delivered [11]. Nowadays, the variety of restaurants to which consumers are exposed has developed a critical customer who evaluates several attributes to obtain an outstanding gastronomic experience [12]. Therefore, offering quality service and excellent food have become key factors for the success of gastronomic establishments since both customer satisfaction and loyalty will be achieved.
Regarding the quality of food festivals, Crompton and Love [13], for a local festival, proposed a four-dimensional construct, namely generic features, specific entertainment, information, and comfort services. Crompton [14] then proposed a different approach to measuring festival quality, drawn from Hertzberg’s two-factor theory of hygiene factors contributing to dissatisfaction and motivating factors contributing to satisfaction. In this sense, Lee et al. [15] used the term festivalscape to measure the quality of a festival by adopting the servicescape concept, which emphasizes the physical environment in which a service is carried out [16]. In the context of a festival, Chang et al. [17] found that the effect of satisfaction on loyalty was not significant among tourists, although it was for residents. Regarding the participation of attendees, this moderates the effect of quality and satisfaction on loyalty, as per Choo et al. [18]. In this sense, for the academics Pai et al. [19], the quality of a festival consists of the subdimensions of hospitality, place, product, convenience, and program, which have a positive impact on the value of the festival, the trust in the festival, and the satisfaction of the festival, which in turn affects loyalty to the festival. In relation to loyalty, for Vesci and Botti [20], the quality of food and beverages, the service of the staff, and the information largely determine the attitude of the attendees towards local festivals and their intentions to visit them again.
In this context, despite the growth and positioning of gastronomic festivals, there is no taxonomy of instruments to evaluate the quality of the gastronomic services offered by the participating establishments in food festivals. For gastronomic festivals, the instruments used in the evaluation of services in restaurants or general models such as SERVQUAL are usually used. However, a gastronomic festival generates a particular experience for the visitor because festivals have different objectives than a restaurant. This can influence expectations and service performance. For this reason, the objective of this study was to generate a service quality evaluation model adjusted to the type of services and characteristics of gastronomic festivals. To this end, the following section of this paper reviews the models applied to assess the quality of services in these types of events. After that, the results of the exploratory and confirmatory factor analysis are presented as the methods used for identifying and validating the model.

2. Literature Review

2.1. Food Festivals

Festivals are classified into four interest categories: (a) leisure and participation, (b) sociological, (c) community development, and (d) from a tourism perspective [21]. Food festivals are placed in the category of leisure and participation and are considered one of the most popular [6]. The World Tourism Organization [22] also recognizes food as an important leisure experience. Therefore, leisure is linked to gastronomy; it has proven to be an essential component of nutrition and a motivating factor that influences consumption in various activities, including gastronomic festivals, cooking schools, and visits to food producers [23].
Gastronomic events are an important motivating element for tourism and are keys to developing most tourist destinations [24]. In this sense, these festivals or events benefit the economic growth of destinations by giving new life to companies, developing new businesses, and generating income from tourism [25,26]. For [27], food festivals help destinations differentiate themselves from other places, creating a more objective image and brand for the site [24,28,29,30,31].
There are three key elements in the organization of a gastronomic festival: (a) taste, (b) place, and (c) tradition [32]. Therefore, it represents an excellent opportunity for tourists to enjoy local cuisine and have new experiences and also a way to promote the destination [33]. In addition, festivals are a great place to reinforce regional/local identity and allow the community to showcase its products [34].

2.2. Service Quality

Interest in service quality has increased in the marketing management literature [35]. It has been studied from a quality management perspective and a marketing call to action approach, whose relevance is highlighted by researchers and managers due to its impact on customer satisfaction [36]. In addition, service quality is considered a key factor for developing competitive advantages and ensuring business survival in an increasingly changing environment [37,38].
Service quality is defined as the result of an evaluation process, where the customers assess whether the level of service delivered meets their expectations [39]. Parasuraman et al. [40,41] describe it as the difference between customer perceptions and their expectations, based on expectation disconfirmation models, assessing whether the components of the service are less than satisfactory for the customer. The quality of services and customer satisfaction are related constructs; the quality of services is considered an antecedent of customer satisfaction [42], and customer satisfaction is understood as the difference between consumer expectations and experiences of service.
The effectiveness of the perception of service quality is one of the most important within the variety of service activities. It is also considered a critical factor in creating value and differentiation for companies seeking competitive advantages [43]. However, organizations face obstacles in measuring service quality because it is a multidimensional concept where customers must assess different dimensions during the production, delivery, and result processes [44,45].

2.3. Service Quality Measures in the Gastronomic Industry

Stevens et al. [46] proposed an instrument for measuring service quality in the restaurant industry called DINESERV. It is based on the SERVQUAL model; therefore, it is also a Gap model that compares a quality expectation index with a quality perception index. This model consists of 29 elements that measure the five dimensions of service quality.
DINESERV has been validated and applied to a wide variety of contexts, as well as various types of fast-food restaurants [47] and table services [46]. However, previous studies affirm that DINESERV is not recommended as an instrument to evaluate service quality in gastronomic festivals [48]. For this reason, it is necessary to structure a measurement model applicable to the context of gastronomic festivals based on previously applied instruments, considering SERVQUAL as the primary reference model due to the nature of the study.
Other instruments related to the restaurant industry have been designed and researched in the literature. For example, [49] introduced TANGSERV as a scale that incorporates a measure of the tangible and social elements of the gastronomic experience through three dimensions: (a) layout and design, regarding factors such as the interior decoration and the furniture; (b) product and service, considering the presentation and variety of food; and (c) ambient and social, including music and temperature. However, [50,51] argue that the TANGSERV findings are not entirely reliable due to unclear methodology and questionable statistical analysis.
DINESCAPE is a model created by [51] in response to the unclear methodology of TANGSERV for the measurement of service quality in restaurants. This scale consists of six factors: facility aesthetics, ambience, lighting, service product, layout, and social factors. This instrument has been considered reliable and valid; however, it is limited to evaluating the physical environment within the restaurant and does not consider some aspects of the external and internal environment that are important to customers.

2.4. Quality of Gastronomic Services and Customer Satisfaction

Companies today are faced with the challenge of capturing potential customers. The impact of service quality on customer satisfaction has generated attention from academics and companies [52]. In this regard, [53] claims that a greater number of satisfied customers will generate better income, and the company’s reputation will prosper.
For this reason, customer satisfaction has become one of the essential objectives of restaurant services, allowing them to build long-term relationships with their customers [54]. This objective generates benefits both at the income level and at the cost level, given that keeping current clients is much less expensive than trying to attract new ones [55].
When conceptualizing customer satisfaction with service quality, the most popular model is the Expectancy–Disconfirmation Model [56]. In this model, the perceived quality of service is generated by comparing the clients with their expectations and the performance perceived after the completion of the service. In other words, positive disconfirmation occurs if the perceived quality of service exceeds a customer’s expectation, meaning that the customer is satisfied. However, negative disconfirmation occurs if the perceived service quality falls below the customer’s expectations, which means the consumer is dissatisfied [57].
Service quality and customer satisfaction are different constructions of great interest in the marketing literature [58]. Several authors have verified how good service quality leads to better customer satisfaction [59,60]. This relationship goes further because positive perceptions of quality influence purchasing behavior [61] and the satisfaction of these customers generates higher retention rates [62].
Next, we present the proposed questionnaire items to measure service quality in gastronomic festivals based on the systematic review of the literature. The questionnaire is based on the dimensions of the SERVQUAL model. However, since there is little evidence of the application of this model for gastronomic festivals, the questions were adapted to the study context. To make these adjustments, previous studies with similar purposes were taken as references, which are detailed in Table 1. The adaptation of the questions was carried out according to the recommendations and comments of experts in gastronomy and event organization. The items were organized according to the five dimensions of the SERVQUAL model. (Table 1).

3. Study Area

The research was conducted in Guayaquil, one of Ecuador’s leading commercial and tourist cities. The main entry points to this province are the José Joaquín de Olmedo International Airport and the land terminal, where national and international tourists arrive with the motivation to know and enjoy its tourist attractions and cultural wealth.
In July of each year, the largest gastronomic festival in Ecuador, called Raíces, is held in Guayaquil. This important gastronomic fair began in 2014 to promote Ecuadorian gastronomy as a tourist reference with great potential. Furthermore, this festival encourages various gastronomic enterprises to get involved in continuous improvement and promotion. The organization of this event is in the charge of the Municipality of Guayaquil, together with the seven cooking schools of the city and private companies.
This project aims to strengthen the entire gastronomic sector in the country, encouraging the participation of the most representative restaurants, known as hueca, different brands in the trade fair, and chefs in training and gastronomy students who measure their abilities in a culinary competition.
Companies and institutions that offer goods and services to the food and beverage industry in all its segments and key players in gastronomy are presented in the fair area. The exhibition is complemented by a space showing the high-quality native produce that enriches Ecuadorian cuisine, such as grains, fruits, and spices (See Figure 1).

4. Methodology

This research followed a positivist design with a deductive theoretical approach. This quantitative cross-sectional study used surveys to collect data and applied multivariate analysis tools. A questionnaire was designed to review the scales used in similar studies but adapted to the context of gastronomic festivals through a review of previous work and interviews with professionals with experience in gastronomic services and professors of the Hospitality and Tourism career at ESPOL, with the aim of evaluating the relevance of the questions to the factor that includes it.
The questionnaire included a section with nine questions for the description of the characteristics of the sample and a section with 21 questions corresponding to the items of the proposed model. Ordinal-type response alternatives were included to answer the questions using a 5-point Likert scale with interval levels ranging from 1 (totally disagree) to 5 (totally agree). Prior to administering the questionnaire, a pilot test was applied to 30 people on the first day of the Raíces festival to evaluate the structure of the questionnaire and their understanding of the questions. After the pilot test, it was possible to correct the way of asking the questions to phrase them in understandable language for the visitor.
The questionnaire was administered at the Raíces festival between 26 and 29 July 2018. For a visitor to the event to be considered eligible, they must have met two requirements: Being a visitor to the festival, being of legal age, and having food within the festival. Thus, the sample was made up of national and foreign visitors of legal age who tried the food of the festival. For the calculation of the sample size, the finite population was used based on the number of attendees at the festival the previous year (70,000), and the convenience method was used to collect the questionnaires. Six hundred valid questionnaires were obtained, representing the sample size. For data analysis, exploratory factor analysis (EFA) was used, making it possible to reduce and better interpret quality dimensions in gastronomic services. Then, confirmatory factor analysis was implemented in the second stage to validate the proposed model. Once the data were collected in situ, they were organized, tabulated, and analyzed using the latest version of the FACTOR program and, later, SPSS Version 26 and AMOS Version 23 for model validation. (See Table 2).

5. Results

Before applying exploratory factor analysis (EFA), an analysis was carried out to determine the adequacy of the data to the type of analysis. For this, missing values, atypical values, correlations between variables, univariate normality, and multivariate normality were identified.
Through frequency analysis, no values were found outside the range of the five response levels. On the other hand, the missing values per variable were not greater than 5% of the total data, not affecting the estimation quality. Moreover, the Pearson correlation matrix was analyzed, finding significant correlations between variables of different factors in the original model.
The univariate normality of the data was analyzed graphically through the Skewness and Kurtosis values for each of the items. In the graphical analysis, utilizing the frequency histograms, the first evidence of the non-normal distribution of the data was found, with distributions of leptokurtic shapes with negative asymmetries. This first visual evidence was verified with values between −0.401 and−2.050 for Skewness and between −0.939 and 5.424 for Kurtosis. With values greater than the absolute value of 2 for both Skewness and Kurtosis, the non-normal univariate distribution of the data could be confirmed [64]. A third univariate normality analysis was performed using the Kolmogorov–Smirnov test, obtaining p < 0.001 values, thus rejecting the null hypothesis of normal data distribution [65].
Given the non-normal distributions of the data, the evaluation of multivariate normality was suggested, considering that some of the estimation methods for factor analysis were robust in the face of the acceptable non-normality of the data. Furthermore, the Mardia test allowed us to know the intensity of the multivariate non-normality of the data. This test was performed using the Excel add-in, Real Statistics [66]. Using the Mardia test, a multivariate Skewness value of 75.125 and a multivariate Kurtosis of 656.043 were obtained, thus confirming the existence of severe non-normal distributions [67].
Given the evidence of the non-normal distribution of the data, it was suggested to review the distribution due to atypical values. For this, the Malahanobis Distance test [68] was applied, finding 30 records with outliers, with p-values less than 0.001, following the recommendations of [69] and [70]. After eliminating the 30 records with outliers, the non-normal behavior of the data was maintained, which was expected since the outliers only represented 5% of the total sample. Given this situation, it was confirmed that the outliers were not generated by tabulation errors, and it was decided to use the original sample with 600 records.
Once the data distribution characteristics were confirmed, the sample adequacy analysis was carried out for factor analysis using the Kaiser–Meyer–Olkin (KMO) test. In addition, Bartlett’s Test of Sphericity was performed, which evaluates whether the variables are not correlated in the population; that is, it determines whether the correlation matrix is an identity matrix through a chi-squared estimate [71]. In these tests, a KMO of 0.929 and a p-value of Bartlett’s Test of Sphericity of 0.000 were obtained, confirming the sample’s adequacy for performing factor analysis.
When choosing the association matrix of the variables, the Pearson correlation matrix is commonly used, which is adequate in evaluating the linear relationship of continuous variables with normal distributions. The ordinal responses of Likert scales with five interval levels adequately consider continuity [72]. However, the type of association matrix that fits the data distribution is rarely chosen. For ordinal items with non-normal distribution, it is recommended to use the polychoric correlation matrix, as long as samples greater than 200 records are used [72].
The commonly used factor estimation methods are maximum likelihood and ordinary least squares. Studies that use ordinal items usually use maximum likelihood as a factor estimation method. However, this estimation method is not recommended in the multivariate non-normality of the data distribution [73].
Given the data distribution in the present study, the polychoric correlation matrix and weighted least squares were used as the estimation method by ordinary least squares. In this way, the estimation method was adapted to the ordinal items of five interval levels and the multivariate non-normal distribution of the data. Furthermore, to estimate the exploratory factorial analysis, the Factor program was used, which allows estimation through a polychoric correlation matrix [74].
For choosing the number of factors to extract, the most used criterion is that suggested by Kaiser, in which factors with eigenvalues greater than one are retained and are extracted from the original correlation matrix [73]. However, a drawback of this method is that the number of factors extracted will depend on the number of analyzed items. For [75], the number of factors to extract depends on the starting theory and the interpretation of the solution found.
Given that the base model for the construction of the instrument is based on five dimensions, the same number of factors was analyzed using the Unweighted Least Squares (ULS) extraction method. This practice is recommended since it is preferable to retain more factors than to eliminate potential ones, which would imply a loss of information [76]. Table 3 shows that the five extracted factors explain 0.66422 of the explained variance based on the eigenvalues.
However, the results obtained from the rotated matrix indicate a weakness in one factor. This factor has the peculiarity of being made up of a single variable. Beavers et al. [77] prevent the existence of factors with lower saturation, qualifying them as secondary factors. These can negatively impact the main factors and cause more complex structures and difficult interpretations [76]. Considering this, a simpler structure is proposed with four main factors for the quality of services, as shown in Table 4.
The Varimax orthogonal rotation is the most used method for rotating and assigning items in exploratory factor analysis. This method assumes orthogonality between extracted factors, which would not be fulfilled in the present study given the significant values in the correlation matrix and because the factors seek to explain the same phenomenon. The Direct Oblimin method has been used in this situation, the most used criterion in oblique rotation [72].
Each of the values of the factorial matrix corresponds to the correlation between the attributes and the common underlying factors. It means that the attribute corresponding to the order is correlated with the four elements but more strongly with the common factor one. Therefore, each attribute was classified into the common factors with which they have the highest correlation.
On the other hand, to guarantee stable solutions and make more precise estimates, it was also necessary to evaluate the explanatory level of the variables that make up the factors [78]. Commonality is defined as the proportion of the variance of the variable explained by the common factors extracted [73].
In this sense, commonality serves as an indicator of the sufficiency of the selected variables to measure the underlying common factor. Therefore, the values should be as high as possible since they increase the importance of the factors and the error is smaller [78]. Hair [79] indicates a minimum commonality value of 0.50. Table 5 favorably shows that 16 of 21 variables reached this specification.
Once the analysis of the variables and the classification of each of the variables by their correlation with the common factor were completed, the content of each of the underlying factors was analyzed to give them a name representing the dimension to be interpreted (see Table 5, Table 6, Table 7 and Table 8).
Once the four factors that explain the perception of the quality of the services offered in gastronomic festivals have been defined, the internal consistency of the factors may be determined.
In terms of reliability, what matters is the consistency of the findings. Cronbach’s alpha coefficient is an index used to measure internal consistency reliability; that is, to assess the extent to which the items of an instrument are correlated [80].
The minimum acceptable value for Cronbach’s alpha coefficient is 0.70; with values lower than this, the scale is considered to have low internal consistency. On the other hand, values higher than 0.95 would show the redundancy of items. For Oviedo and Campo [80], Cronbach’s alpha values between 0.8 and 0.9 are usually preferred. Despite the above, values lower than 0.70 could be accepted when a better instrument is not available, as long as this limitation is explicitly expressed (See Table 9).
The value of the tangibility factor, made up of four variables, shows an internal consistency of 0.68. This value indicates a certain weakness in the factor considering the general consistency rule. However, Peterson [81] suggests a value of 0.6 as an additional acceptable criterion. Other authors support this and even state that it is reasonable [82,83]. Therefore, this factor is considered consistent because its alpha value is higher than the acceptable criteria (See Table 10).
The reliability factor, conformed by five variables, shows a high internal consistency without reaching the point of redundancy (see Table 11).
The internal consistency analysis of the responsiveness factor evidences a high internal consistency from the factorial construction through five observed variables (see Table 12).
Finally, the adequacy factor, made up of six variables, presents a high internal consistency of 0.78 with no signs of redundancy.
Once the internal consistency analysis of the factors has been carried out, a multidimensional model of service quality perception for visitors to gastronomic festivals can be proposed (see Figure 2).
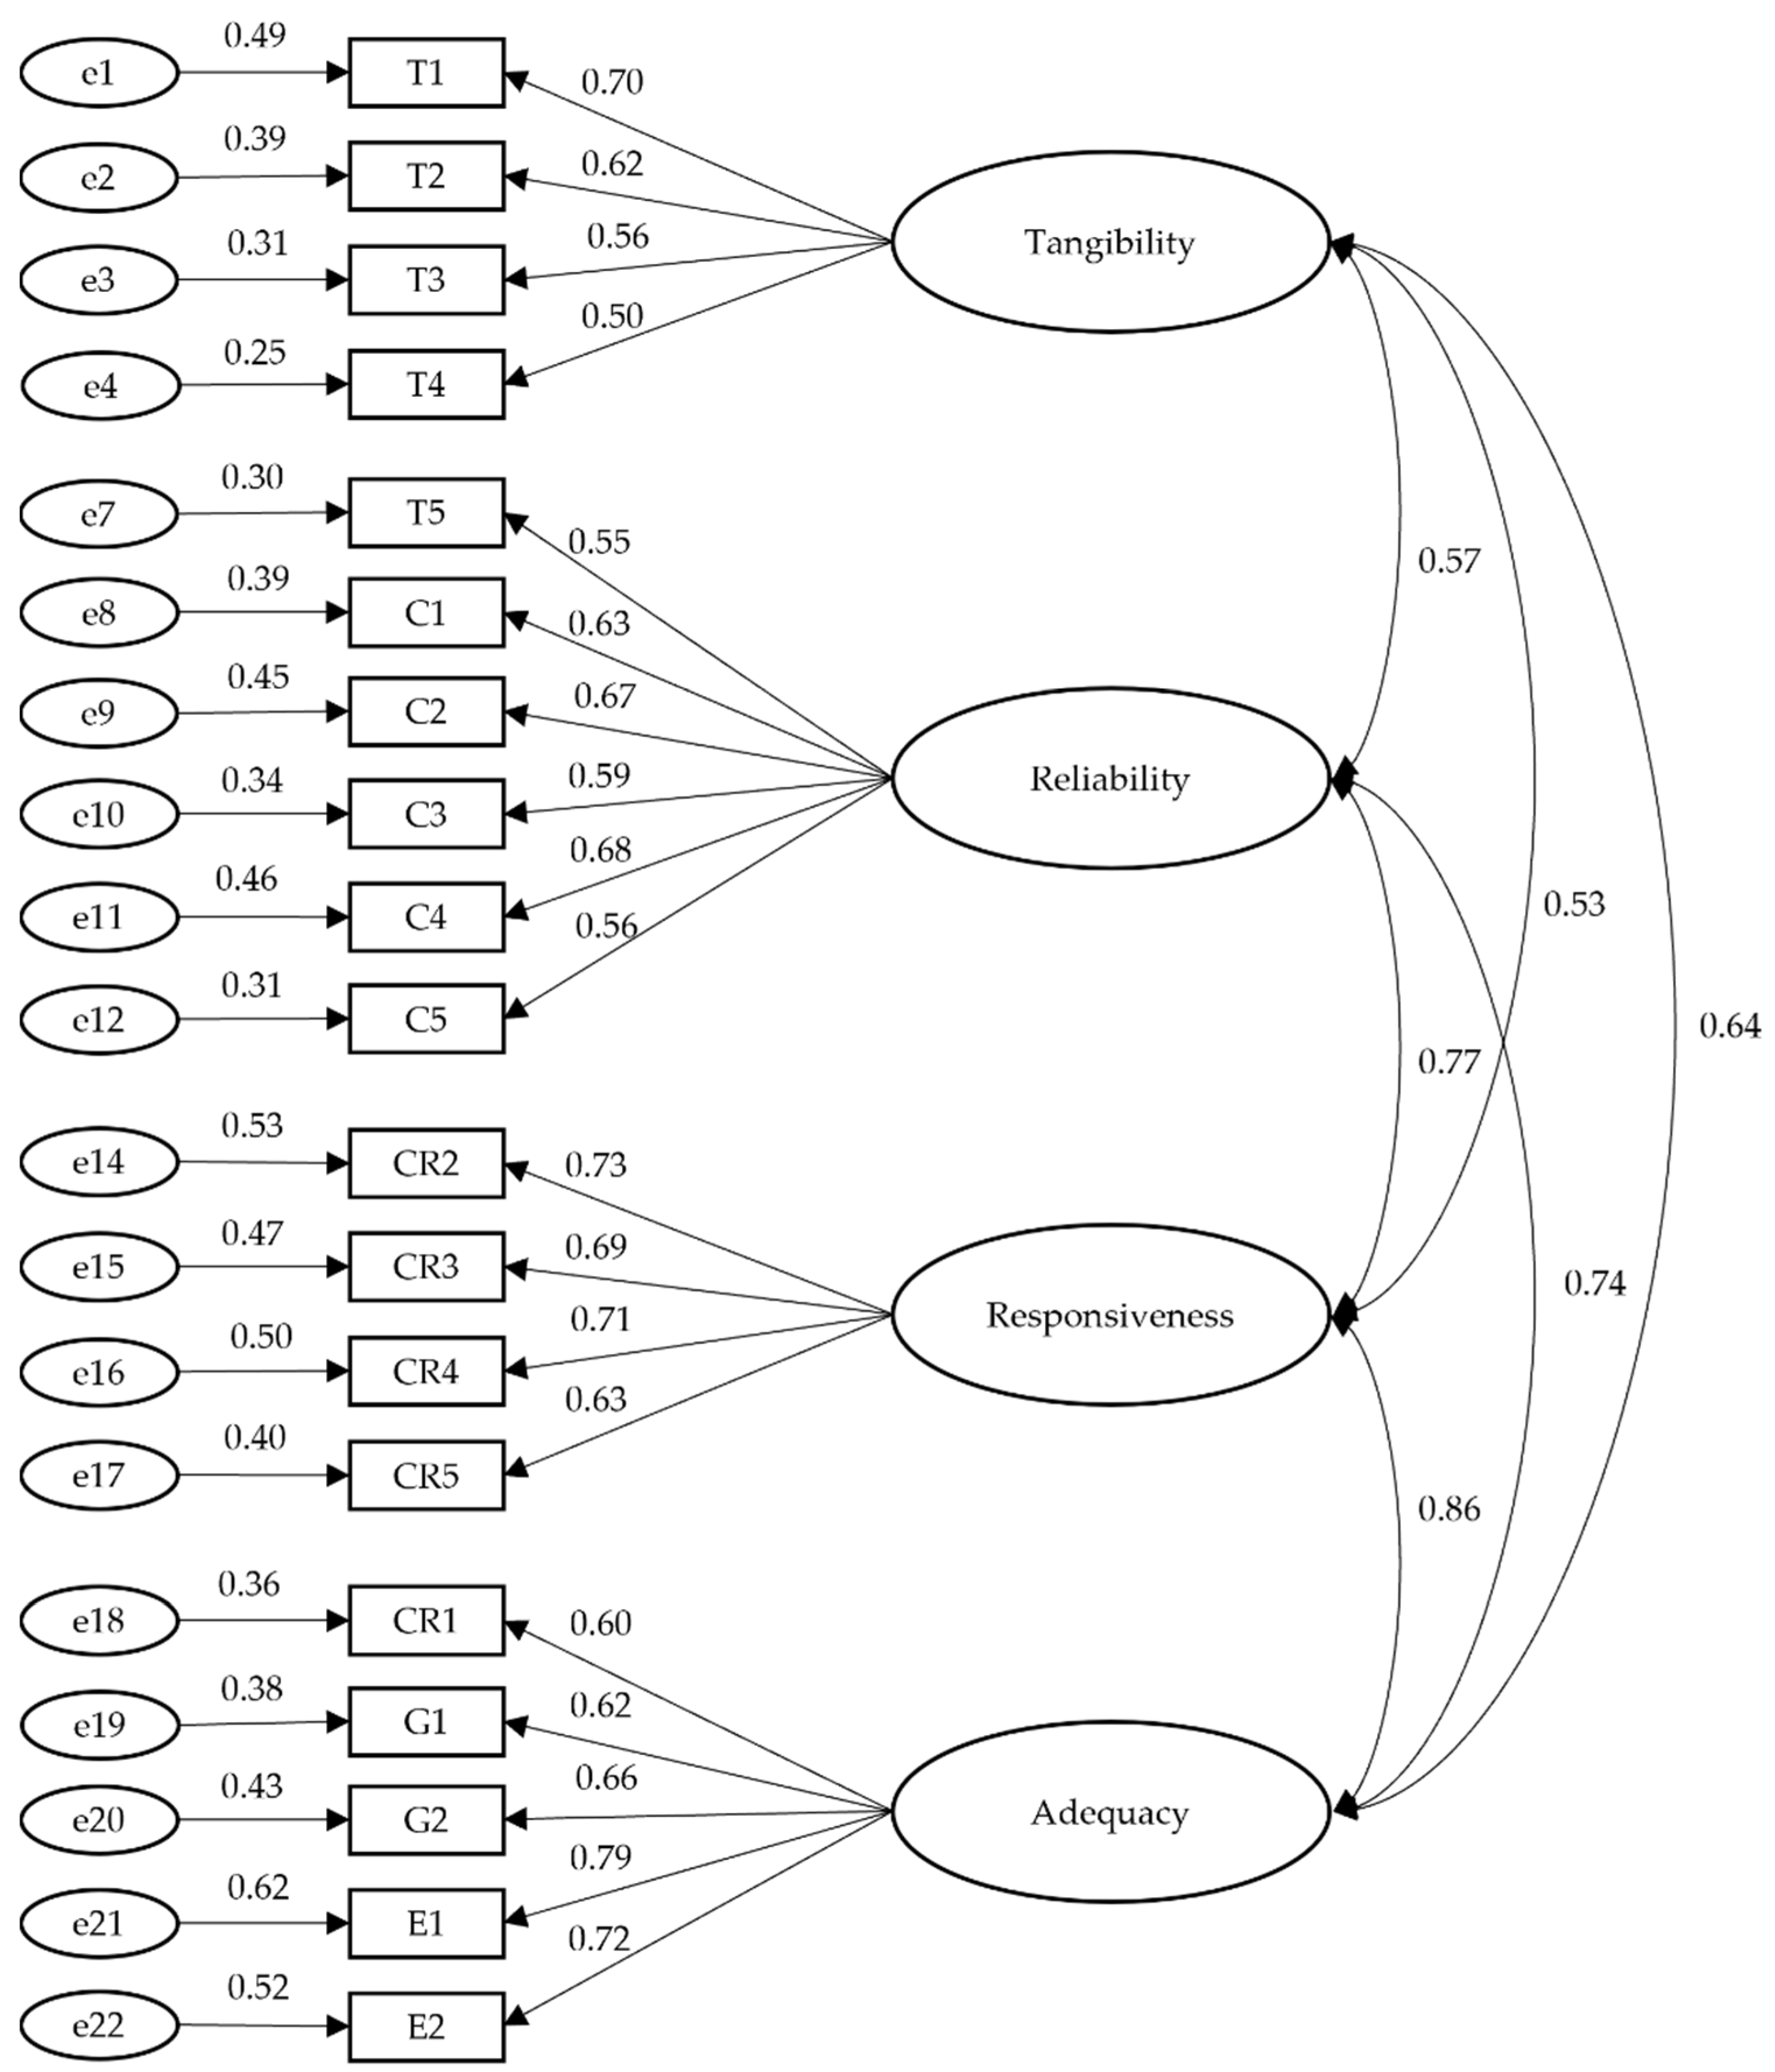
Finally, following the objectives of this study, a confirmatory factor analysis (CFA) was performed to validate the dimensionality of the proposed model. The quality of gastronomic services was evaluated using a four-dimensional factorial structure: tangibility, reliability, responsiveness, and adequacy. Item 6 of tangibility, whose factorial load was less than 0.5, was eliminated during the measurement because it did not contribute to the response capacity dimension. According to the results, the goodness-of-fit indices (CFI = 0.924; TLI = 0.902; RMSEA = 0.057 (90% CI: 0.051–0.063)) were adequate. The complete model is shown in Figure 3.

6. Discussion

The SERVQUAL model has been one of the most used models for the evaluation of quality in different types of services and in different contexts, sometimes having adjustments that can affect its factorial structure. However, in this type of study, the validation of the scale is usually carried out by confirmatory methods without searching for the factorial structure that best fits the type of service being evaluated. For this reason, in the present study, we are aware of the adjustment of the original scales and that it has been applied in a little-studied context, for which, through exploratory methods, we sought to refine the original model and identify the factorial structure that best fits the study.
The results of the exploratory factor analysis, for the case of the SERVQUAL model adapted for gastronomic festivals, show a model with four dimensions: (a) tangibility, (b) reliability, (c) responsiveness, and (d) adequacy. This shows that the items of the SERVQUAL model can be adapted to different types of services and study contexts and their factor structure can change, which can affect their interpretation and practical implications.

7. Conclusions

Social science research has an implicit link between the units of analysis, theory, and methodology. This link is frequently ignored, given the generality of the instruments. For this reason, the present study aimed to demonstrate the applicability of the gastronomic services model in the field of gastronomic festivals.
This work offers theoretical and practical contributions. The perception of quality in gastronomic services was evaluated through a survey built from the models commonly used to assess the quality of gastronomic services. This instrument was selected due to the context in which the research was conducted and to benefit from the advantages of instrument validity, given its wide application in the literature. The instrument was quantitatively adjusted and validated with statistical methods to be later applied to the consumers of the restaurants participating in the Raíces Gastronomic Festival in the city of Guayaquil.
The data obtained showed a global level of 83.67/100, which indicates a positive perception of the general quality of the service. The best-evaluated criteria were amiability and utensil sanitation. In contrast, the worst evaluated criteria corresponded to the available space and agility, which is reasonable considering the number of gastronomic establishments participating in the festival and the large influx of visitors.
Once the survey results were obtained for each item, an analysis was carried out to determine the relevance of factor analysis. First, the non-normality of the data was identified. Based on this, it was decided to use a polychoric correlation matrix, given the ordinal nature of the data and the non-normality. Next, the adequacy of the correlation matrix to be factored in was evaluated.
The estimates were made using the FACTOR statistical software to guarantee the robustness of the results. Subsequently, the AFE was applied to propose a model based on underlying factors that explain the perception of service quality in gastronomic festivals.
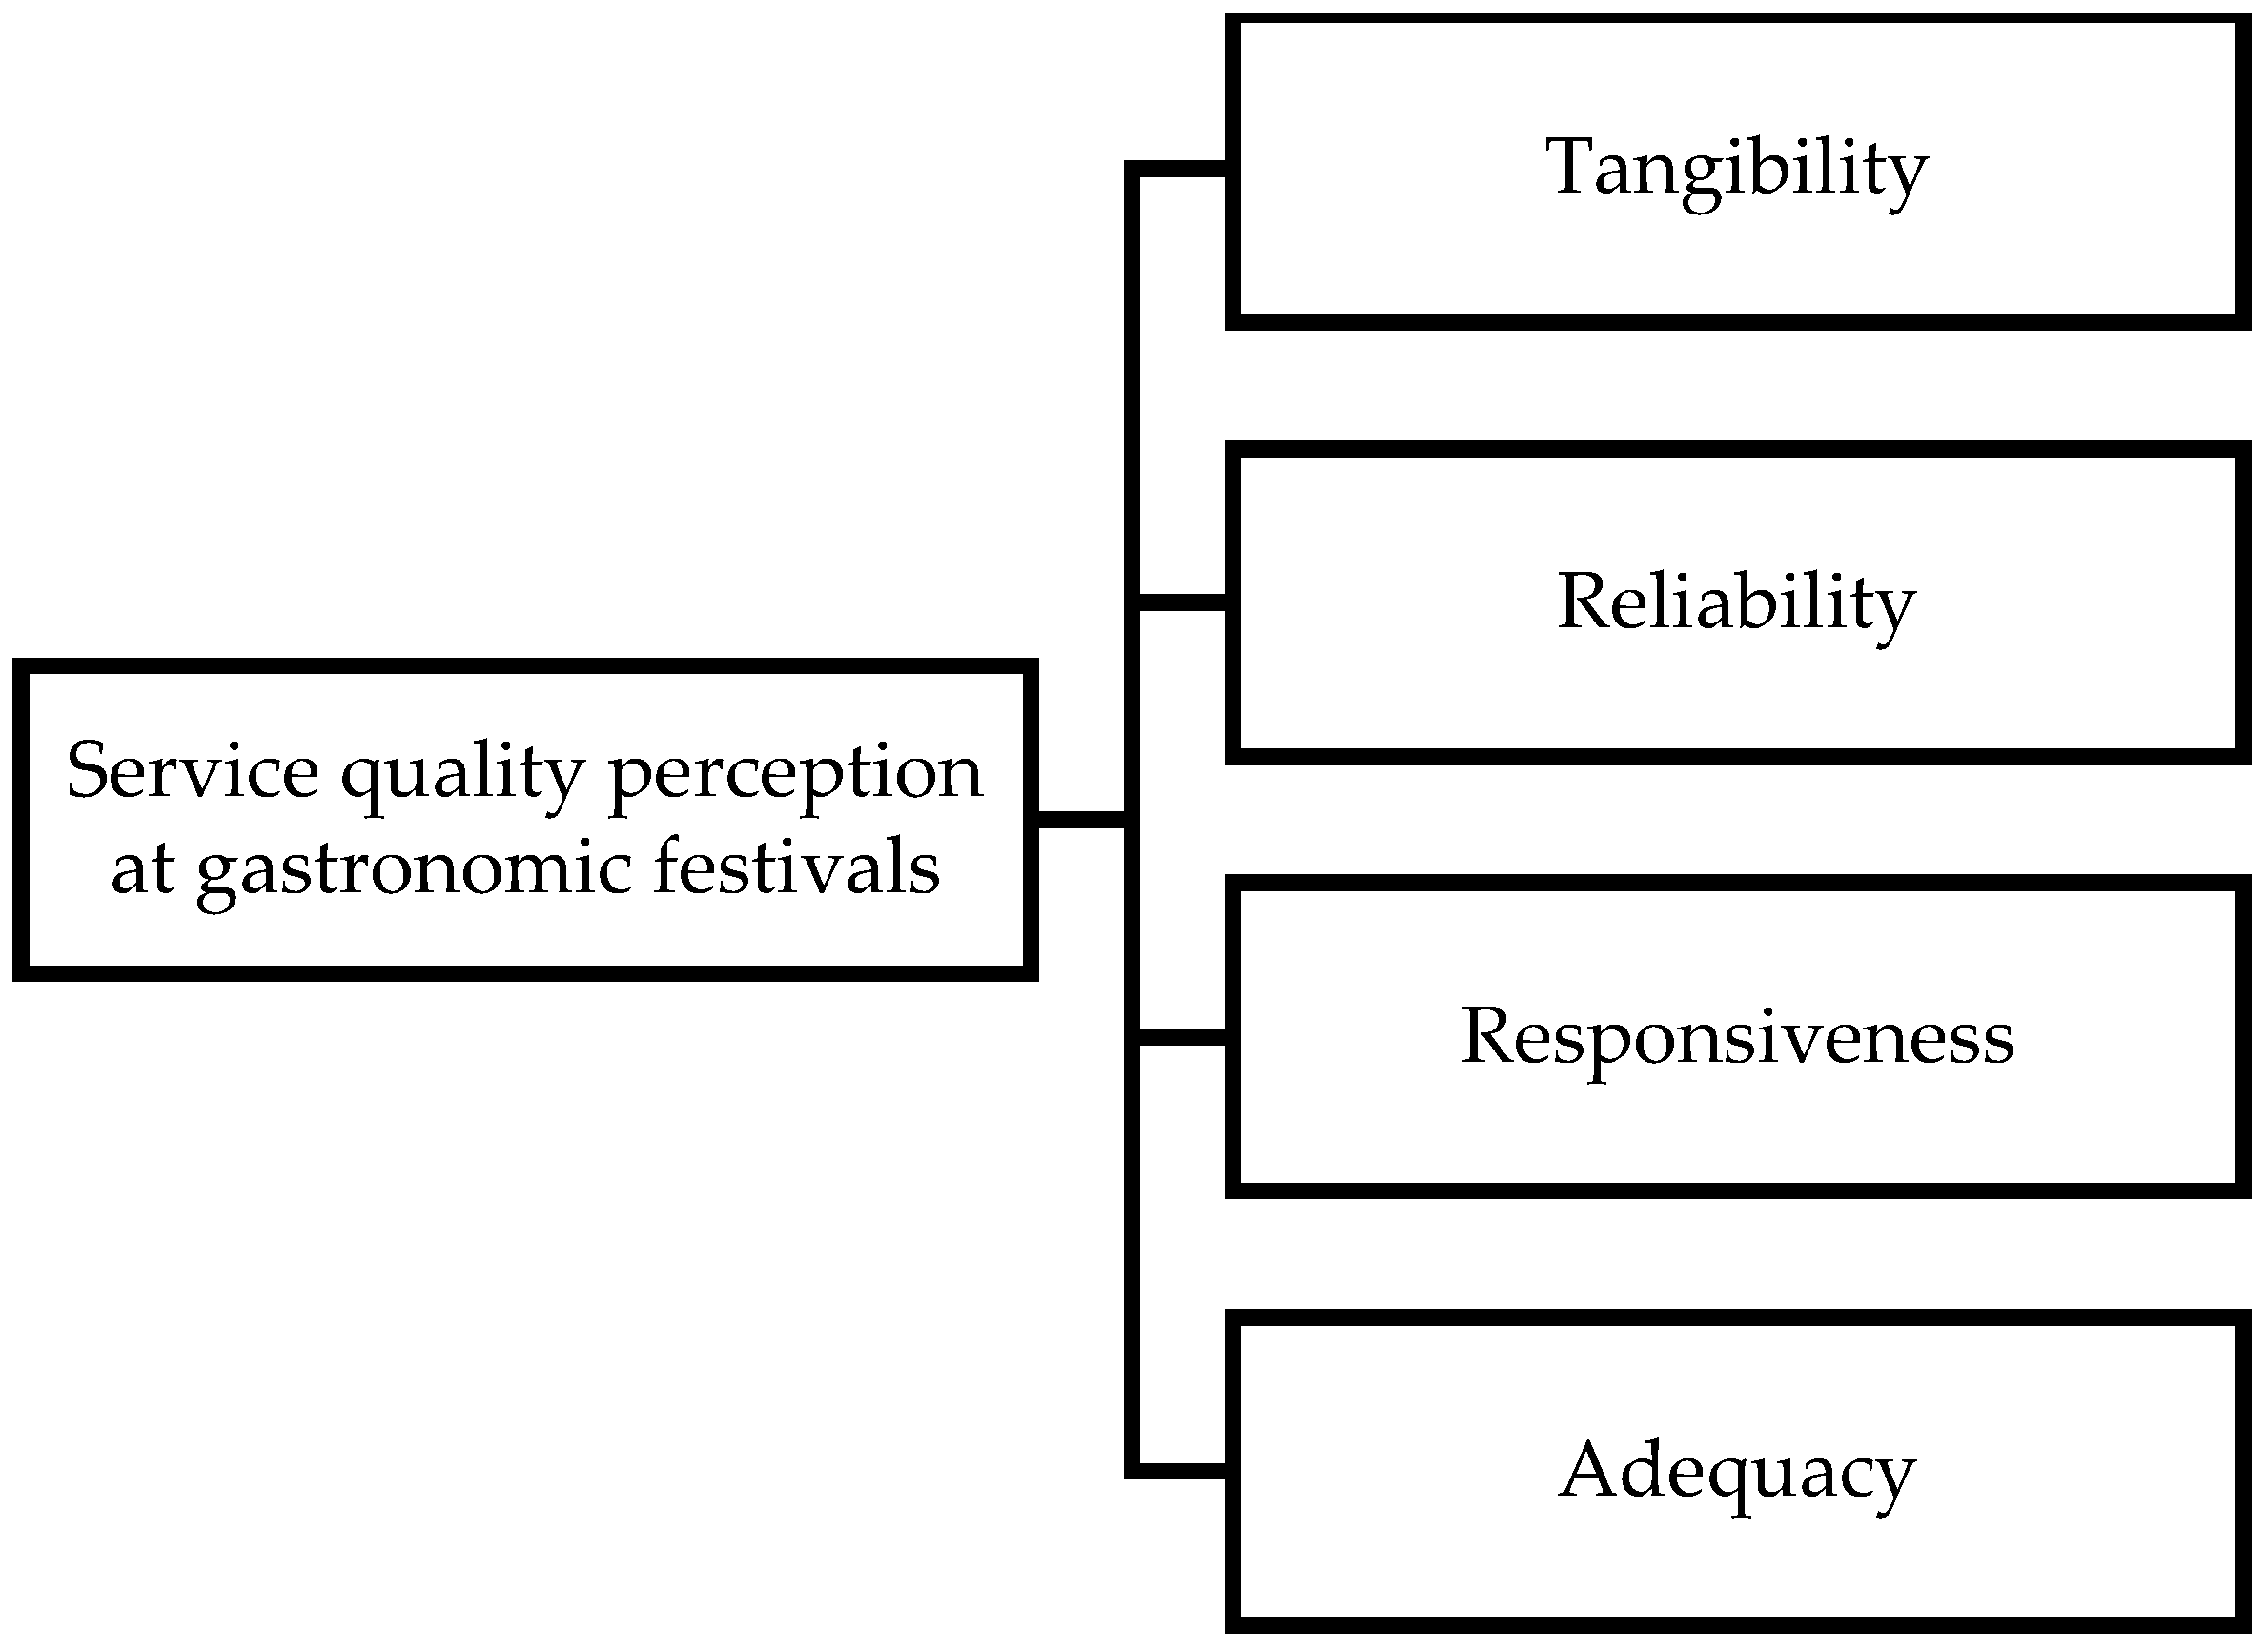
As a result of the multivariate analysis, a model was proposed for the perception of service quality determined by four factors: (a) tangibility, (b) reliability, (c) responsiveness, and (d) adequacy. In addition, the model was subjected to an internal consistency analysis using Cronbach’s alpha to guarantee its reliability.
The models commonly used for evaluating the quality of gastronomic services cannot be used directly to assess the perception of service quality in gastronomic festivals. However, through a refinement stage, the model can explain a significant percentage of the perception of service quality. Therefore, it is recommended that the four-factor model proposed in this paper be replicated and used in little-studied contexts to assess its external consistency; for example, in gastronomic services offered in hotels and airlines, among others.
The main limitation of this study was the temporality with which the sample was taken, since the demand may vary. Another limitation was the convenience method used by taking the survey to the closest respondent. It is suggested to apply the questionnaire proposed in this study for the evaluation of the quality of services in gastronomic fairs, at different events, and in different languages to evaluate the external validity of the factorial restructuring resulting from this study. Finally, future research should seek to determine the relationship between the four-factor model and satisfaction through a structural equation model to identify the dimensions that potentially affect customer satisfaction, so that gastronomic services can redirect their efforts to specifically meet the needs or demands of the target audience.

Author Contributions

Conceptualization, R.C.-A., M.C.-F., W.C.-F. and M.A.-C.; methodology, R.C.-A. and M.C.-F.; software, R.C.-A. and M.C.-F.; validation, R.C.-A. and M.C.-F.; formal analysis, R.C.-A. and M.C.-F.; investigation, R.C.-A., M.C.-F., W.C.-F. and M.A.-C.; resources, R.C.-A., M.C.-F., W.C.-F. and M.A.-C.; data curation, R.C.-A., M.C.-F. and W.C.-F.; writing—original draft preparation, R.C.-A., M.C.-F., W.C.-F. and M.A.-C.; writing—review and editing, R.C.-A., M.C.-F., W.C.-F. and M.A.-C. All authors have read and agreed to the published version of the manuscript.

Funding

This research received no external funding.

Institutional Review Board Statement

Not applicable.

Informed Consent Statement

Not applicable.

Data Availability Statement

Not applicable.

Conflicts of Interest

The authors declare no conflict of interest.

References

  1. Contreras, J.; Gracia, M. Food, Society and Culture; Publisher Fiocruz: Rio de Janeiro, Brazil, 2011; p. 496. Available online: https://scholar.google.com/scholar_lookup?title=Alimentacio%CC%81n+y+cultura&author=Contreras%2C+Jesu%CC%81s.&publication_year= (accessed on 15 July 2022).
  2. Ottenbacher, M.C.; Harrington, R.J. Strategies for achieving success for innovative versus incremental new services. J. Serv. Mark. 2010, 24, 3–15. [Google Scholar] [CrossRef]
  3. Björk, P.; Kauppinen-Räisänen, H. Local food: A source for destination attraction. Int. J. Contemp. Hosp. Manag. 2016, 28, 177–194. [Google Scholar] [CrossRef]
  4. Lee, I.; Arcodia, C. The Role of Regional Food Festivals for Destination Branding. Int. J. Tour. Res. 2011, 13, 355–367. [Google Scholar] [CrossRef]
  5. Hu, Y. An Exploration of the Relationships between Festival Expenditures, Motivations, and Food Involvement among Food Festival Visitors. 2010. Available online: https://uwspace.uwaterloo.ca/handle/10012/5650 (accessed on 15 July 2022).
  6. Wan, Y.K.P.; Chan, S.H.J. Factors that Affect the Levels of Tourists’ Satisfaction and Loyalty towards Food Festivals: A Case Study of Macau. Int. J. Tour. Res. 2013, 15, 226–240. [Google Scholar] [CrossRef]
  7. Pine, B.J., II; Gilmore, J.H. Welcome to the Experience Economy. Harv. Bus. Rev. 1998. Available online: https://hbr.org/1998/07/welcome-to-the-experience-economy (accessed on 15 July 2022).
  8. Meretse, A.; Mykletun, R.; Einarsen, K. Participants’ benefits from visiting a food festival—The case of the Stavanger food festival (Gladmatfestivalen). Scand. J. Hosp. Tour. 2015, 16, 208–224. [Google Scholar] [CrossRef]
  9. Ponce-Ponce, B.I. Strategic organization system of the Mistura Gastronomic Fair and its influence on gastronomic tourism as a social event, Lima 2016–2018. USMP Acad. Repos. 2021. Available online: https://repositorio.usmp.edu.pe/handle/20.500.12727/7765 (accessed on 15 July 2022).
  10. López-Guzmán, T.; Uribe Lotero, C.P.; Pérez Gálvez, J.C.; Ríos Rivera, I. Gastronomic festivals: Attitude, motivation and satisfaction of the tourist. Br. Food J. 2017, 119, 267–283. [Google Scholar] [CrossRef]
  11. Solano, J.; Pazmiño, K.; Fernández, K.; Rojas, K. Measurement of the Quality of Services: Case of Restaurants Located in the Area of Tourist Influx in Puerto Bolívar, Puerto Jelí and Puerto Hualtaco. II Virtual International Congress on the Challenges of Companies in the 21th Century. 2017. Available online: https://www.google.com.hk/url?sa=t&rct=j&q=&esrc=s&source=web&cd=&cad=rja&uact=8&ved=2ahUKEwip0oeT-Jr7AhWZTmwGHTsgB9wQFnoECAwQAQ&url=http%3A%2F%2Fwww.eumed.net%2Flibros-gratis%2Factas%2F2017%2Fturismo%2F40-calidad-del-servicio-y-competitividad.pdf&usg=AOvVaw2iw0C7pLb15DfZvpR-I-ab (accessed on 22 September 2022).
  12. Wishna, V. Great expectations. Restaur. Bus. 2000, 99, 27–30. [Google Scholar]
  13. Crompton, J.L.; Love, L.L. Predictive validity of alternative approaches of evaluating quality of a festival. J. Travel Res. 1995, 34, 11–24. [Google Scholar] [CrossRef]
  14. Crompton, J.L. Adapting Herzberg: A conceptualization of the effects of hygiene and motivator attributes on perceptions of event quality. J. Travel Res. 2003, 41, 305–310. [Google Scholar] [CrossRef]
  15. Lee, Y.K.; Lee, C.K.; Lee, S.K.; Babin, B.J. Festivalscapes and patrons’ emotions, satisfaction, and loyalty. J. Bus. Res. 2008, 61, 56–64. [Google Scholar] [CrossRef]
  16. Gannon, M.; Taheri, B.; Olya, H. Festival quality, self-connection, and bragging. Ann. Tour. Res. 2019, 76, 239–252. [Google Scholar] [CrossRef]
  17. Chang, S.; Gibson, H.; Sisson, L. The loyalty process of residents and tourists in the festival context. Curr. Issues Tour. 2014, 17, 783–799. [Google Scholar] [CrossRef]
  18. Choo, H.; Park, D.B.; Petrick, J.F. Festival tourists’ loyalty: The role of involvement in local food festivals. J. Hosp. Tour. Manag. 2022, 50, 57–66. [Google Scholar] [CrossRef]
  19. Pai, C.K.; Lee, T.; Kang, S. Examining the Role of Service Quality, Perceived Values, and Trust in Macau Food Festival. Int. J. Environ. Res. Public Health 2021, 18, 9214. [Google Scholar] [CrossRef]
  20. Vesci, M.; Botti, A. Festival quality, theory of planned behavior and revisiting intention: Evidence from local and small Italian culinary festivals. J. Hosp. Tour. Manag. 2019, 38, 5–15. [Google Scholar] [CrossRef]
  21. Okech, T.C.; Wawire, N.W.; Mburu, T.K. Contraceptive Use among Women of Reproductive Age in Kenya’s City Slums. Int. J. Bus. Soc. Sci. 2011, 2. Available online: http://erepo.usiu.ac.ke/bitstream/handle/11732/411/Contraceptive%20Use%20among%20Women%20of%20Reproductive%20Age%20in%20Kenya%e2%80%99s%20City%20Slums.pdf?sequence=1&isAllowed=y (accessed on 15 July 2022).
  22. World Tourism Organisation (UNTWO). Affiliate Members Report; Global Report on Food: Madrid, Spain, 2012; Volume 4, Available from Tourism; Available online: https://www.unwto.org/archive/global/publication/unwto-amreport-vol-4-global-repor (accessed on 15 July 2022).
  23. Cleave, P. Food as a leisure pursuit, a United Kingdom perspective. Ann. Leis. Res. 2019, 23, 474–491. [Google Scholar] [CrossRef]
  24. Getz, D. Event tourism: Definition, evolution, and research. Tour. Manag. 2008, 29, 403–428. [Google Scholar] [CrossRef]
  25. Dwyer, L.; Forsyth, P.J.; Spurr, R. Estimating the impacts of special events on an economy. J. Travel Res. 2005, 43, 351–359. [Google Scholar] [CrossRef]
  26. Huang, Z.; Li, M.; Cai, L. A model of community-based festival image. Int. J. Hosp. Manag. 2010, 29, 254–260. [Google Scholar] [CrossRef]
  27. Kim, Y.H.; Kim, M.; Ruetzler, T.; Taylor, J. An examination of festival attendees’ behavior using SEM. Int. J. Event Festiv. Manag. 2010, 1. [Google Scholar] [CrossRef]
  28. Allen, J.; O’Toole, W.; Harris, R.; McDonnell, I. Festival and Special Event Management, 5th ed.; Wiley: Milton, QLD, Australia, 2010. [Google Scholar]
  29. Cohen, E.; Avieli, N. Food in tourism: Attraction and Impediment. Ann. Tour. Res. 2004, 31, 755–778. [Google Scholar] [CrossRef]
  30. Hall, M.; Andrukow, A.; Barr, C.; Brock, K.; Wit, M.; Embuldeniya, D.; Vaillancout, Y. The Capacity to Serve: A Qualitative Study of the Challenges Facing Canada’s Nonprofit and Voluntary Organizations. 2003. Available online: http://sectorsource.ca/resource/file/capacity-serve-qualitative-study-challenges-facing-canadas-nonprofit-and-voluntary (accessed on 15 July 2022).
  31. Hall, M.; Sharples, L. (Eds.) Food and Wine Festivals and Events around the World; Routledge: London, UK, 2008. [Google Scholar] [CrossRef]
  32. Organ, K.; Koenig-Lewis, N.; Palmer, A.; Probert, J. Festivals as agents for behaviour change: A study of food festival engagement and subsequent food choices. Tour. Manag. 2015, 48, 84–99. [Google Scholar] [CrossRef]
  33. Wu, H.-C.; Wong, J.W.-C.; Cheng, C.-C. An Empirical Study of Behavioral Intentions in the Food Festival: The Case of Macau. Asia Pac. J. Tour. Res. 2014, 19, 1278–1305. [Google Scholar] [CrossRef]
  34. Hubbard, G.P.; Elia, M.; Holdoway, A.; Stratton, R.J. A systematic review of compliance to oral nutritional supplements. Clin. Nutr. 2012, 31, 293–312. [Google Scholar] [CrossRef] [PubMed]
  35. Kang, G.-D.; James, J. Service quality dimensions: An examination of Gronroos’s service quality model. Manag. Serv. Qual. 2004, 14, 266–277. [Google Scholar] [CrossRef]
  36. Bhatt, A.; Bhanawat, D. Service Quality in Retail—A Literature Review. Int. J. Bus. Manag. 2016, 2, 27–35. [Google Scholar]
  37. Douglas, T.J.; Judge, W.Q. Total Quality Management Implementation and Competitive Advantage: The Role of Structural Control and Exploration. Acad. Manag. Ann. 2001, 44, 158–169. [Google Scholar] [CrossRef]
  38. Latif, K.F. The Development and Validation of Stakeholder-Based Scale for Measuring University Social Responsibility (USR). Soc. Indic. Res. 2018, 140, 511–547. [Google Scholar] [CrossRef]
  39. Lewis, C.; Booms, B. The Marketing Aspects of Service Quality. En Emerging Perspectives in Service Marketing; American Marketing Assocociation: Chicago, IL, USA, 1983; pp. 99–107. [Google Scholar]
  40. Parasuraman, A.; Zeithaml, V.A.; Berry, L.L. A Conceptual Model of Service Quality and Its Implications for Future Research. J. Mark. 1985, 49, 41–50. [Google Scholar] [CrossRef]
  41. Parasuraman, A.P.; Zeithaml, V.; Berry, L. SERVQUAL A Multiple-item Scale for Measuring Consumer Perceptions of Service Quality. J. Retail. 1988, 64, 12–40. [Google Scholar]
  42. Rubogora, F. Service Quality and Customer Satisfaction in Selected Banks in Rwanda. J. Bus. Financ. Acc. 2017, 6. [Google Scholar] [CrossRef]
  43. Krudthong, S. A Measurement Of Customer Satisfaction Towards Service Quality In A Small Sized Hotel: A Case Of Silom Village Inn, Bangkok, Thailand. 2017. Available online: Https://Www.Semanticscholar.Org/Paper/A-Measurement-Of-Customer-Satisfaction-Towards-In-A-Krudthong/c655e1ada523f3ebb534928a65af5b9e240f3508 (accessed on 15 July 2022).
  44. Gambo, M.K.K. Service quality and customer satisfaction among domestic air passengers in Nigeria. Int. J. Bus. Manag. Stud. 2016, 8, 32–49. Available online: https://dergipark.org.tr/en/download/article-file/255730 (accessed on 15 July 2022).
  45. Siddiqui, M.H.; Sharma, T.G. Analyzing customer satisfaction with service quality in life insurance services. J. Target. Meas. Anal. Mark. 2010, 18, 221–238. [Google Scholar] [CrossRef]
  46. Stevens, P.; Knutson, B.; Patton, M. Dineserv: A Tool for Measuring Service Quality in Restaurants. Cornell Hotel. Restaur. Adm. Q. 1995, 36, 56–60. [Google Scholar] [CrossRef]
  47. Bougoure, U.; Neu, M.-K. Service quality in the Malaysian fast food industry: An examination using DINESERV. Serv. Mark. Q. 2010, 31, 194–212. [Google Scholar] [CrossRef]
  48. Velikova, N.; Slevitch, L.; Mathe-Soulek, K. Application of Kano model to identification of wine festival satisfaction drivers. Int. J. Contemp. Hosp. 2017, 29. [Google Scholar] [CrossRef]
  49. Raajpoot, N. TANGSERV. J. Foodserv. Bus. Res. 2002, 5, 109–127. [Google Scholar] [CrossRef]
  50. Ryu, K.; Jang, S.S.; Sanchez, A. Forecasting Methods and Seasonal Adjustment for a University Foodservice Operation. J. Foodserv. Bus. Res. 2003, 6, 17–34. [Google Scholar] [CrossRef]
  51. Ryu, K.; Jang, S. DINESCAPE: A Scale for Customers’ Perception of Dining Environments. J. Foodserv. Bus. Res. 2008, 11, 2–22. [Google Scholar] [CrossRef]
  52. Obioma, O. Servqual Model as Performance Evaluation Instrument for Small and Medium Sized Enterprises (SME): Evidence From Customers in Nigeria. Eur. Sci. J. 2016, 12, 520–540. [Google Scholar] [CrossRef] [Green Version]
  53. Esmaeilpour, M.; Sayadi, A.; Mirzaei, M. Investigating the Impact of Service Quality Dimensions on Reputation and Brand Trust (SSRN Scholarly Paper Núm. 3155030). Soc. Sci. Res. 2018, 10, 7–17. Available online: https://papers.ssrn.com/abstract=3155030 (accessed on 15 July 2022).
  54. Ngo, V.; Nguyen, H. The Relationship between Service Quality, Customer Satisfaction and Customer Loyalty: An Investigation in Vietnamese Retail Banking Sector. J. Compet. 2016, 8, 103–116. [Google Scholar] [CrossRef] [Green Version]
  55. Jashireh, A.; Slambolchi, A.; Mobarakabadi, H. A literature review of service quality andcustomer satisfaction. Adv. Soc. Humanit. Manag. 2016, 3, 1–12. [Google Scholar]
  56. Oliver, R.L.; Rust, R.T.; Varki, S. Customer delight: Foundations, findings, and managerial insight. J. Retail. 1997, 73, 311–336. [Google Scholar] [CrossRef]
  57. Namkung, Y.; Jang, S. Are highly satisfied restaurant customers really different? A quality perception perspective. Int. J. Contemp. Hosp. 2008, 20, 142–155. [Google Scholar] [CrossRef]
  58. Olorunniwo, F.; Hsu, M.; Udo, G. Service quality, Customer Satisfaction, and behavioral intentions in the service factory. J. Serv. Mark. 2006, 20, 59–72. [Google Scholar] [CrossRef]
  59. Anderson, E.W.; Fornell, C.; Lehmann, D.R. Customer Satisfaction, Market Share, and Profitability: Findings from Sweden. J. Mark. 1994, 58, 53–66. [Google Scholar] [CrossRef] [Green Version]
  60. Woodruff, R.B. Customer value: The next source for competitive advantage. Acad. Mark. Sci. Rev. 1997, 25, 139. [Google Scholar] [CrossRef]
  61. Tripathi, G.; Dave, K. Store format choice and relationship quality in apparel retail: A study of young and early-middle aged shoppers in New Delhi region. J. Retail. Consum. Serv. 2013, 20, 479–487. [Google Scholar] [CrossRef]
  62. Hennayake, Y. Impact of Service Quality on Customer Satisfaction of Public Sector Commercial Banks: A Study on Rural Economic Context. Int. J. Sci. Res. 2017, 7, 156. [Google Scholar]
  63. Kim, W.G.; Lee, Y.-K.; Yoo, Y.-J. Predictors of Relationship Quality and Relationship Outcomes in Luxury Restaurants. J Hosp Tour Res. 2006, 30, 143–169. [Google Scholar] [CrossRef]
  64. Bandalos, D.L.; Finney, S.J. Factor Analysis: Exploratory and Confirmatory. En The Reviewer’s Guide to Quantitative Methods in the Social Sciences, 2nd ed.; Routledge: London, UK, 2018. [Google Scholar]
  65. Long, Z.; Kara, A.; Spillan, J. Market Orientation and Firm Performance: An Empirical Analysis of Chinese IT Enterprises. In Proceedings of the Sixth Asia-Pacific Conference on Global Business, Economics, Finance and Social Sciences, Bangkok, Thailand, 14–16 February 2016. [Google Scholar]
  66. Zaiontz, C. Real Statistics Using Excel. 2015. Available online: www.real-statistics.com (accessed on 15 July 2022).
  67. Lattin, J.M.; Carroll, J.D.; Green, P.E. Analyzing Multivariate Data; Thomson Brooks/Cole: Pacific Grove, CA, USA, 2003. [Google Scholar]
  68. Penny, K.I. Appropriate Critical Values When Testing for a Single Multivariate Outlier by Using the Mahalanobis Distance. J. R. Stat. Soc. Ser. C 1996, 45, 73–81. [Google Scholar] [CrossRef]
  69. Brown, R. Authentic Assessment: Using Assessment to Help Students Learn. RELIEVE. E-J. Educ. Res. Assess. Eval. 2015, 21, 1–10. [Google Scholar]
  70. Kline, R. Principles and Practice of Structural Equation Modeling. 2011. Available online: https://books.google.com.ec/books/about/Principles_and_Practice_of_Structural_Eq.html?id=mGf3Ex59AX0C&redir_esc=y (accessed on 15 July 2022).
  71. Montoya, O. Application of factor analysis to market research. Case study. Sci. Tech. 2007, 3, 281–286. [Google Scholar] [CrossRef]
  72. Lloret-Segura, S.; Ferreres-Traver, A.; Hernández-Baeza, A.; Tomás-Marco, I. The exploratory factor analysis of the items: A practical guide, revised and updated. Ann. Psychol. 2014, 30, 1151–1169. [Google Scholar] [CrossRef]
  73. Chión, S.; Charles, V. Data Analytics for Structural Modeling; Pearson: London, UK, 2016. [Google Scholar]
  74. Ferrando, P.J.; Lorenzo-Seva, U. Exploratory Item Factor Analysis: Some additional considerations. Ann. Psychol. 2014, 30, 1170–1175. [Google Scholar] [CrossRef] [Green Version]
  75. Lorenzo-Seva, U.; Timmerman, M.E.; Kiers, H.A.L. The Hull Method for Selecting the Number of Common Factors. Multivar. Behav. Res. 2011, 46, 340–364. [Google Scholar] [CrossRef] [PubMed]
  76. Mavrou, I. Exploratory factor analysis Conceptual and methodological issues. Artículos Ref. 2015, 19, 71–80. [Google Scholar] [CrossRef]
  77. Beavers, A.S.; Lounsbury, J.W.; Richards, J.K.; Huck, S.W.; Skolits, G.J.; Esquivel, S.L. Practical Considerations for Using Exploratory Factor Analysis in Educational Research. Pract. Assess. Res. Eval. 2013, 18, 6. Available online: https://eric.ed.gov/?q=education+psychology&pg=6&id=EJ1005139 (accessed on 15 July 2022).
  78. Frías-navarro, D.; Pascual-Soler, M. Exploratory factor analysis (EFA) in consumer behavior and marketing research. Suma Psychol. 2012, 19, 47–58. Available online: http://www.scielo.org.co/scielo.php?pid=S0121-43812012000100004&script=sci_abstract&tlng=en (accessed on 15 July 2022).
  79. Hair, J.F. Multivariate Analysis; Pearson Education: London, UK, 1999. [Google Scholar]
  80. Oviedo, H.C.; Campo, A. An Approach to the Use of Cronbach’s Alfa. Colomb. J. Psychiatry 2005, 34, 572–580. [Google Scholar]
  81. Peterson, R. A Meta-Analysis of Cronbach’s Coefficient Alpha. J. Consum. Res. 1994, 21, 381–391. [Google Scholar] [CrossRef]
  82. Taber, K. The Use of Cronbach’s Alpha When Developing and Reporting Research Instruments in Science Education. Res. Sci. Educ. 2018, 48, 1–24. [Google Scholar] [CrossRef] [Green Version]
  83. van Griethuijsen, R.A.L.F.; van Eijck, M.W.; Haste, H.; den Brok, P.J.; Skinner, N.C.; Mansour, N.; Savran Gencer, A.; BouJaoude, S. Global Patterns in Students’ Views of Science and Interest in Science. Res. Sci. Educ. 2015, 45, 581–603. [Google Scholar] [CrossRef]
Figure 1. Guayaquil city, Ecuador.
Sustainability 14 14605 g001
Figure 2. Proposed model of service quality perception.
Sustainability 14 14605 g002
Figure 3. Validation of the dimensionality of the variables.
Sustainability 14 14605 g003
Table 1. Service quality in gastronomic festivals questionnaire.
TTANGIBILITY
T1 The dining area where the establishments are located looks orderly.Kim et al. [63]; Parasuraman et al. [41]; Ryu and Jang [51]; Stevens et al. [46].
T2The dining room has enough space and chairs for people to sit down to eat food.Kim et al. [63]; Parasuraman et al. [41]; Raajpoot [49]; Ryu and Jang [51]; Stevens et al. [46].
T3The chairs in the dining area are comfortable.Kim et al. [63]; Ryu and Jang [51]; Stevens et al. [46].
T4The tables in the area of the establishments were clean for use. The dining area is spotless.Kim et al. [63]; Raajpoot [49]; Ryu and Jang [51]; Stevens et al. [46].
T5The staff takes care of food hygiene when serving, wearing gloves, mesh, and apron.Kim et al. [63]; Parasuraman et al. [41]; Raajpoot [49]; Stevens et al. [46].
T6The establishments make a detailed menu of each dish available or visible to the visitor.Raajpoot [49]; Stevens et al. [46].
CRRESPONSIVENESS
CR1The dishes are served quickly.Parasuraman et al. [41]; Stevens et al. [46].
CR2They go the extra mile to accommodate special requests when serving the dishes.Kim et al. [63]; Parasuraman et al. [41]; Raajpoot [49]; Stevens et al. [46].
CR3The staff of the establishments is well trained to answer questions about the dishes.Kim et al. [63]; Parasuraman et al. [41]; Stevens et al. [46].
CR4They are willing to quickly correct mistakes they may make when serving visitors.Kim et al. [63]; Parasuraman et al. [41]; Raajpoot [49]; Stevens et al. [46].
CR5They are trained to dispatch food at peak times.Kim et al. [63]; Parasuraman et al. [41]; Stevens et al. [46].
GASSURANCE
G1You feel confident in the hygienic handling of the ingredients used in food preparation.Parasuraman et al. [41]; Raajpoot [49]; Stevens et al. [46].
G2You feel confident in the staff’s recommendations about the dishes to be served.Parasuraman et al. [41]; Raajpoot [49]; Stevens et al. [46].
EEMPATHY
E1During service, the staff of the establishments makes visitors feel comfortable.Kim et al. [63]; Raajpoot [49]; Ryu and Jang [51]; Stevens et al. [46].
E2The staff of the establishments has a friendly treatment of visitors.Kim et al. [63]; Parasuraman et al. [41]; Raajpoot [49]; Ryu and Jang [51]; Stevens et al. [46].
Table 2. Research methodology.
Geographic areaRaíces Festival (Guayaquil-Ecuador)
PopulationNational and foreign visitors
Time periodJuly 2018
ProcessConvenience sampling
Confidence level95%
Error range+/− 3.98%
Valid questionnaires600
Table 3. Explained variance based on eigenvalues.
VariableEigenvalueProportion of VarianceCumulative Proportion of Variance
19.3070.4430.443
21.4460.0680.512
31.2950.0610.573
41.0670.0500.624
50.8330.0390.664
60.7490.035
70.7030.033
80.6560.031
90.5960.028
100.5880.028
110.5240.024
120.4780.022
130.4350.020
140.4240.020
150.3640.017
160.3320.015
170.3150.015
180.2860.013
190.2420.011
200.2110.010
210.1400.006
Table 4. Non-rotated loading matrix.
F1F2F3F4Commonality
Order0.6990.048−0.0550.0270.531
Space0.788−0.085−0.0900.0610.544
Comfortable chairs0.4750.0250.140−0.0710.352
Clean tables0.5530.151−0.1620.1550.392
Staff hygiene0.2870.5030.0890.0220.502
Menu0.2130.2890.325−0.2980.366
Food service0.2150.4150.121−0.1260.545
Fresh ingredients−0.0060.7550.0770.0250.686
Taste−0.0700.737−0.2720.3250.575
Utensil sanitation0.1420.6480.1230.0740.654
Attractive dishes0.1210.3610.162−0.0510.468
Quantity of food0.1040.0790.0530.0120.706
Agility0.1610.0950.0730.3760.443
Special requests0.0180.0430.5760.1290.576
Trained employees0.0070.1750.6650.0660.617
Error correction0.050−0.0670.896−0.1030.683
Office (food dispatch)0.0350.0320.4180.1380.516
Confidence in ingredients0.0930.377−0.0800.4500.583
Staff recommendations0.0290.1800.0160.5460.593
Customer care0.175−0.0090.2930.5790.796
Amiability0.074−0.0400.1510.7150.727
Note: Weighted least squares estimate.
Table 5. Tangibility factor.
ItemsF1
Order0.699
Space0.788
Comfortable chairs0.475
Clean tables0.553
Note: Data correspond to the correlation between attribute and common factor.
Table 6. Reliability factor.
ItemsF2
Special requests0.576
Trained employees0.665
Error correction0.896
Office0.418
Note: Data correspond to the correlation between attribute and common factor.
Table 7. Responsiveness factor.
ItemsF3
Agility0.376
Confidence in ingredients0.450
Staff Recommendations0.546
Customer care0.579
Amiability0.715
Note: Data correspond to the correlation between attribute and common factor.
Table 8. Adequacy factor.
ItemsF4
Food service0.415
Fresh ingredients0.755
Taste0.737
Utensil sanitation0.648
Attractive dishes0.361
Note: Data correspond to the correlation between attribute and common factor.
Table 9. Internal consistency of the tangibility factor.
Cronbach’s AlphaN° de Ítems
0.6874
Note: Critical value of Cronbach’s alpha is 0.7.
Table 10. Internal consistency of the reliability factor.
Cronbach’s AlphaN° de Ítems
0.7675
Note: Critical value of Cronbach’s alpha is 0.7.
Table 11. Internal consistency of the responsiveness factor.
Cronbach’s AlphaN° de Ítems
0.8025
Note: Critical value of Cronbach’s alpha is 0.7.
Table 12. Internal consistency of the adequacy factor.
Cronbach’s AlphaN° de Ítems
0.7786
Note: Critical value of Cronbach’s alpha is 0.7.
Publisher’s Note: MDPI stays neutral with regard to jurisdictional claims in published maps and institutional affiliations.

