Article

The Diversity and Composition of Soil Microbial Community Differ in Three Typical Wetland Types of the Sanjiang Plain, Northeastern China

1
Engineering Research Center of Agricultural Microbiology Technology, Ministry of Education & Heilongjiang Provincial Key Laboratory of Ecological Restoration and Resource Utilization for Cold Region & Key Laboratory of Microbiology, College of Heilongjiang Province & School of Life Sciences, Heilongjiang University, Harbin 150800, China
2
Heilongjiang Provincial Key Laboratory of Ecological Restoration and Resource Utilization for Cold Region, School of Life Sciences, Heilongjiang University, Harbin 150080, China
3
Insititute of Nature and Ecology, Heilongjiang Academy of Sciences, Harbin 150040, China
4
Forest Dynamics Research Unit, Swiss Federal Research Institute WSL, 8903 Birmensdorf, Switzerland
*
Author to whom correspondence should be addressed.
Sustainability 2022, 14(21), 14394; https://doi.org/10.3390/su142114394
Submission received: 2 October 2022 / Revised: 28 October 2022 / Accepted: 1 November 2022 / Published: 3 November 2022

Abstract

:
The wetlands in China’s Sanjiang Plain have experienced intensive anthropogenic disturbance recently, and this has obviously changed their environmental characteristics. Soil microorganisms play an important role in wetland ecosystems. However, the effects of different wetland types on soil microbial diversity and community composition remain largely unclear. Therefore, we assessed the effects of three typical wetland types—permanently flooded wetlands, seasonally flooded wetlands and non-flooded wetlands—on soil microbial communities in the Sanjiang Plain, using phospholipid fatty acid analysis (PLFA) technology. A total of 56 different PLFA compounds were identified, of which 10 are typically produced by uncharacterized bacteria, 15 by Gram-positive bacteria, and 11 by Gram-negative bacteria. In addition, 2 fungal groups were identified, based on four PLFAs, and four PLFAs typical for protozoa were detected. High levels were detected for 16:0 (attributed to bacteria) and i17:1ω9c (produced by Gram-positive bacteria). The latter (i17:1ω9c) was exceptionally high in non-flooded soil (8407.15 ± 2675.84 ng/g). High levels of 18:1ω7c (1939.15 ± 666.13 ng/g) and 18:1ω9c (1713.26 ± 360.65 ng/g) were detected in permanently flooded wetlands and about the same in seasonally flooded wetlands, but lower ranks were present in the drier non-flooded wetlands. The Shannon-Wiener diversity index decreased with permanently flooded wetlands (3.05) > seasonally flooded wetlands (3.02) > non-flooded wetlands (2.12). Redundancy analysis showed that the two axes could explain a total of 94.48% of soil microbial communities. Soil water content, total and available phosphorus, and total and available nitrogen correlated significantly with soil microbial communities of three wetland types. Cluster analysis of correlations between individual PLFA biomarkers and soil physiochemical properties demonstrated the complexity of the community responses to the three different habitats. This study demonstrates that microbial diversity and composition changed sensitivity among the three wetland types, and soil moisture content was the key environmental factor to affect the soil microbial communities.

1. Introduction

Wetlands are important terrestrial ecosystems, accounting for 4–6% of the global land surface area [1]. Past and present human activity significantly impacts the structure and function of wetlands, and present and future climate change will additionally affect soil biodiversity and function. The soil microbiome plays an important role in the function of an ecosystem and its biogeochemical cycles [2] and is involved in regulating the dynamics of organic matter decomposition and plant growth [3]. Soil microbial communities are largely shaped by the feedback between plants and soil [4]. Different wetland types have specific vegetation compositions related to the local soil habitat, largely affecting the composition and diversity of soil microorganisms [5]. Despite the critical contributions of soil microorganisms towards the functions and services of wetland ecosystems, only a limited number of studies have focused on the effects of different wetland types on the composition of soil microorganisms [6,7].
Soil microorganisms play important roles in biogeochemical cycles [8], litter depositions [9], and other ecosystem functions and services [10]. Previous studies have indicated that changes in the community composition and diversity could affect the nutrient uptake of nitrogen and phosphorus, and adversely influence the vegetation composition and diversity in temperate wetland ecosystems [11]. Changes occur in the abundance and diversity of soil microbial communities in response to external factors, such as global climate change and human activity. Understanding the implications of global climate change and human activity for soil ecosystem processes, changes in soil microbial communities, and diversity is of great significance for understanding soil quality and nutrient turnover [12].
The structure, function and diversity of soil microbial communities in the wetlands of the Sanjiang Plain, China, have been studied in some detail. These studies revealed little difference in soil bacterial and fungal α-diversity, but significant differences in their β-diversity, depending on the location of the samples [13,14]. Local wetlands at different degradation states revealed that bacterial α diversity and composition were significantly altered, with inverse effects for fungi [15]. Sites that were restored produced a higher fungal diversity after fallowing and wetting [16]. These findings illustrate that the diversity and structure of wetland soil microorganisms in the Sanjiang Plain are not consistent, and vary over location, land use, and water management practices. Therefore, further research is needed on the structure and function of soil microorganisms in the Sanjiang Plain.
The Sanjiang Plain is the largest freshwater wetland in China. There are three typical wetland types there, namely PF (permanently flooded wetlands), SF (seasonally flooded wetlands), and NF (non-flooded wetlands). In recent years, the vegetation composition and relative areas of these three wetland types have changed, due to reclamation activity and climate change [17]. Previous studies have reported that the vegetation species decreased, and Shannon -Wiener and Pielou diversity increased, for NF compared to SF and then PF [18]. A study by Sui et al. [19] demonstrated a decrease in metabolic capacity of soil bacteria towards carbon sources from SF and then PF. However, the patterns of soil microbial community composition and diversity in these three wetland types are still unclear, and the driving mechanisms of soil microbial changes remain uncertain.
Therefore, we used the PFLA technique to investigate the changes in soil microbial diversity and community composition of the three wetland types in the Sanjiang Plain. This study aims to reveal (i) if significant differences in soil microbial diversity and composition occurred, and (ii) if so, whether soil physicochemical properties were the main reason for these differences. Furthermore, it seeks to clarify the change patterns of soil microorganisms and their drivers in the wetlands of the Sanjiang Plain in the context of human activity and climate change, and to explore the mechanisms of human activity and global changes in soil microorganisms in the region, and to provide references for predicting future changes in the ecological structure and function of wetlands in the context of human activity and global warming.

2. Materials and Methods
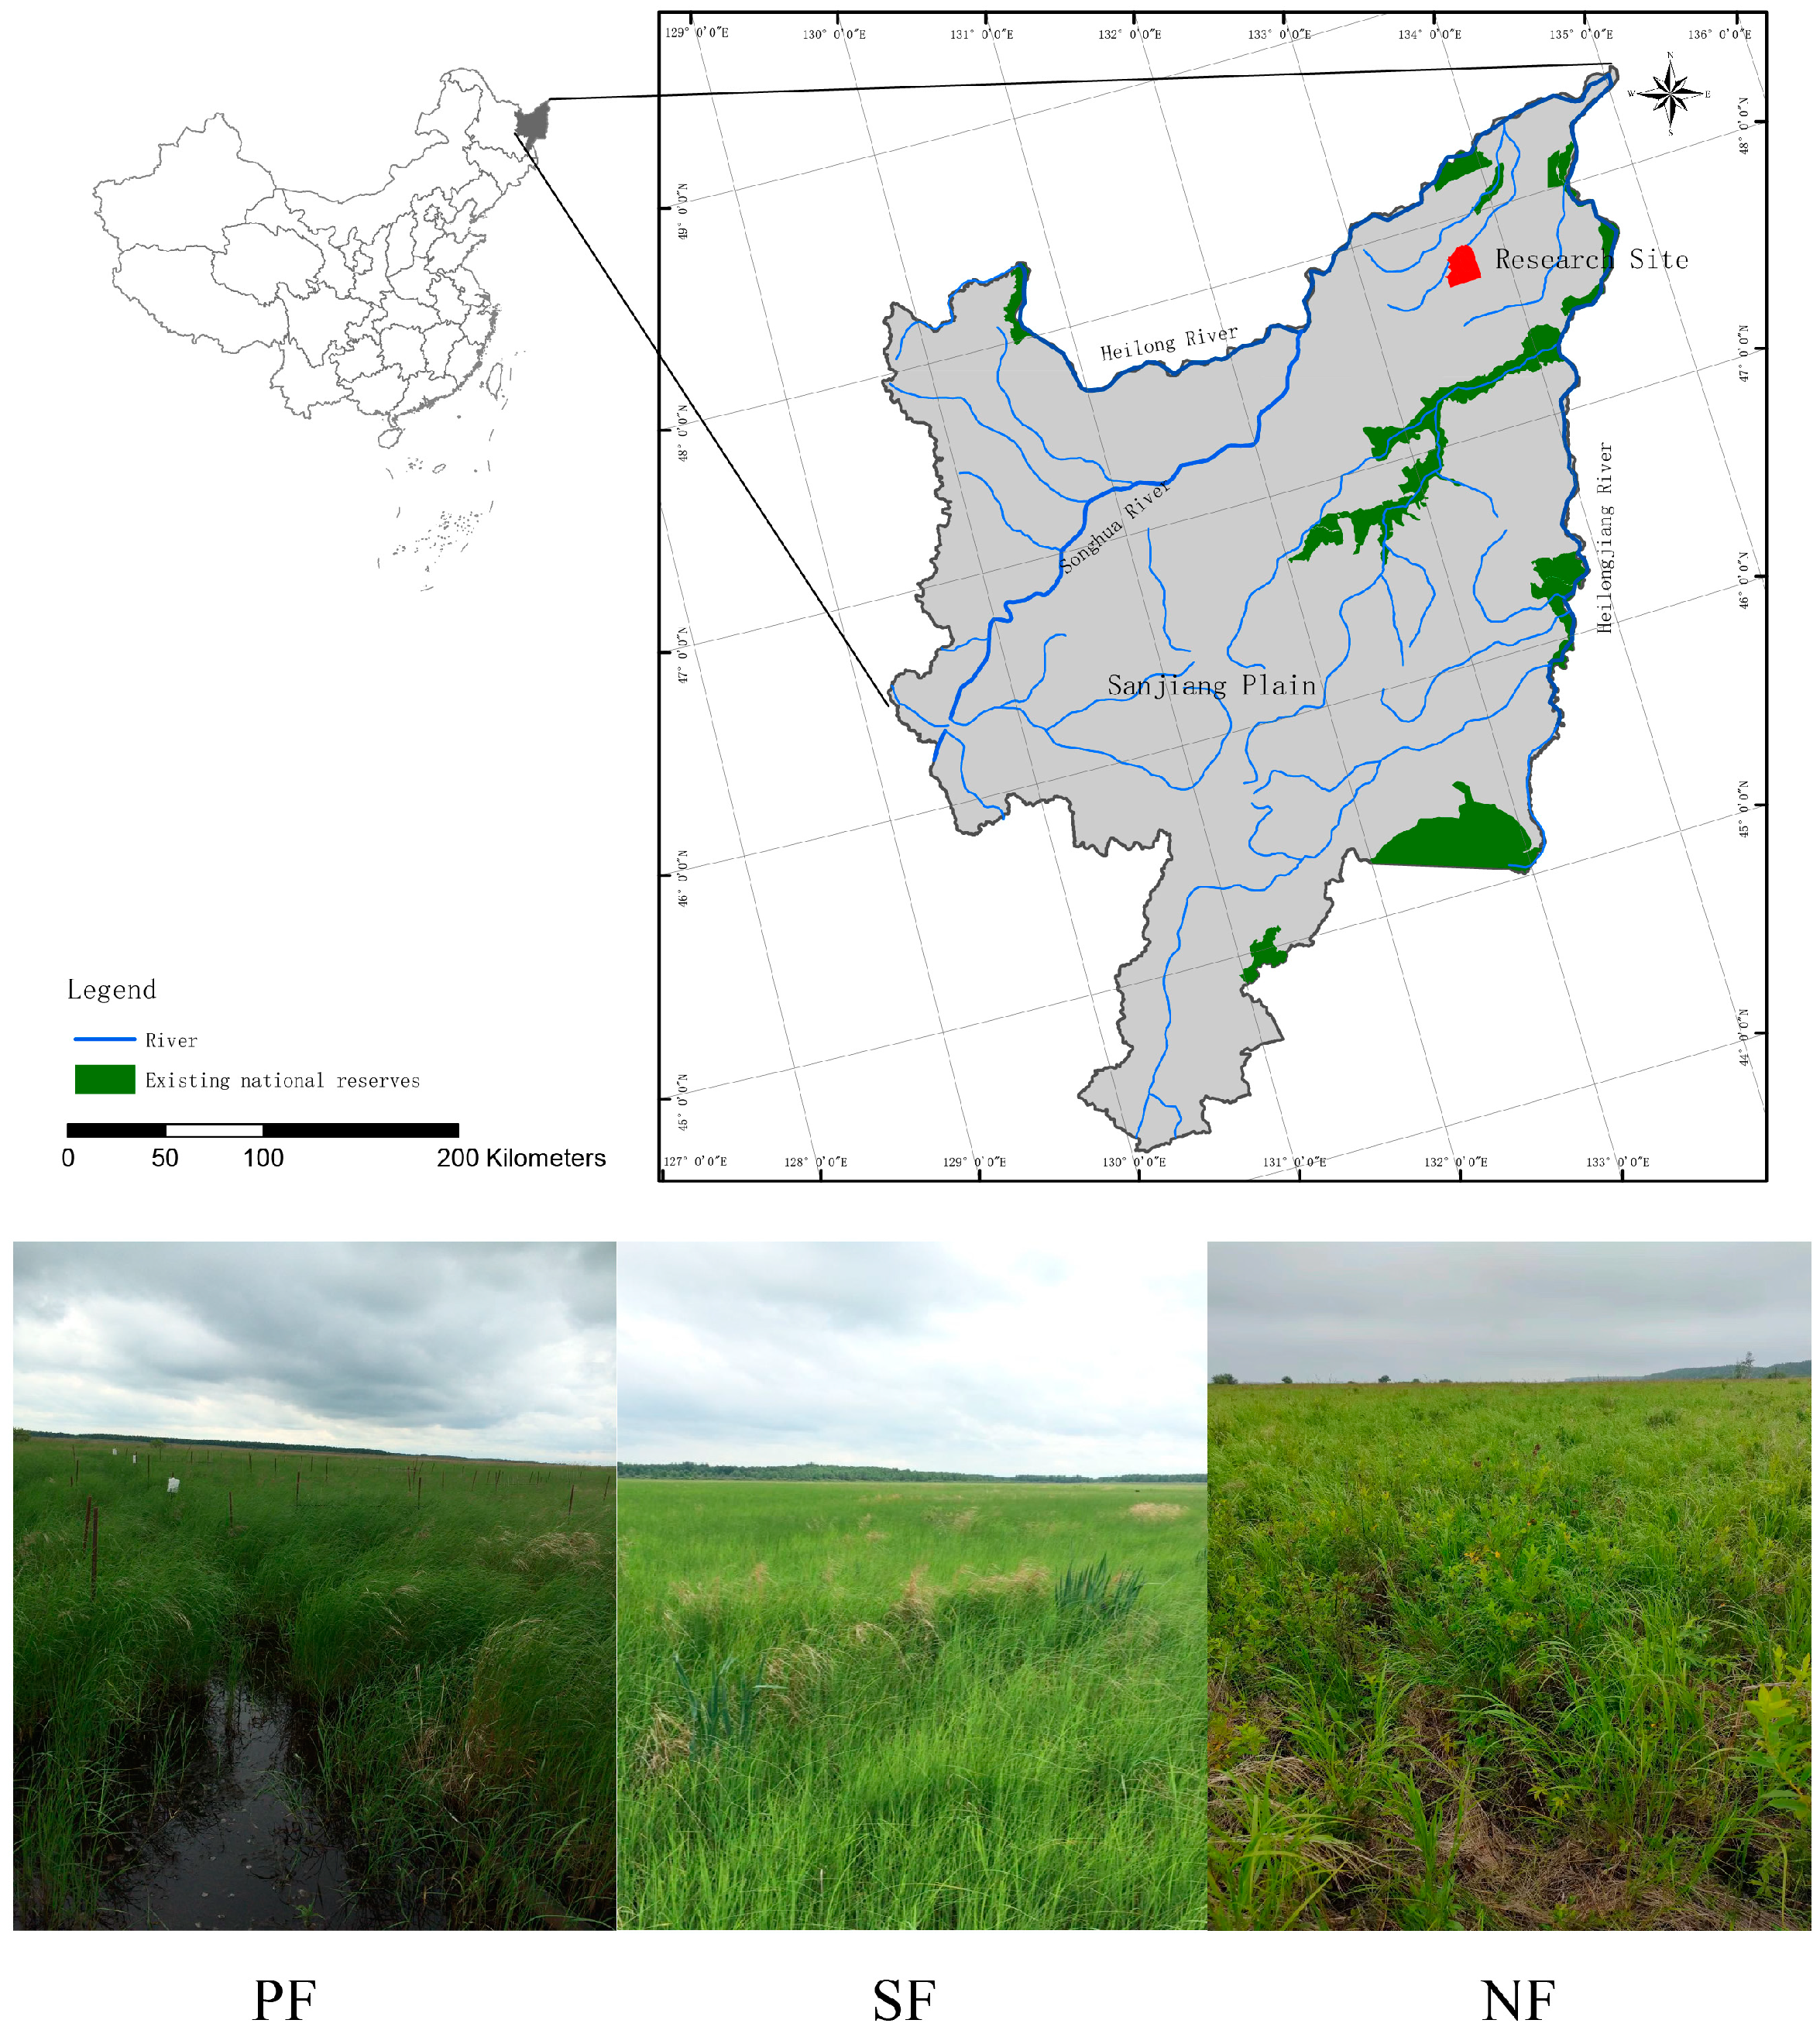
2.1. Study Site

The study sites of the investigated wetlands are in the Hohong national nature reserve, Sanjiang Plain (47°42′18″–47°52′07″ N, 133°34′38″–133°46′29″ E) (Figure 1). The average annual temperature is 1.9 °C, the average annual precipitation of 585 mm is mostly concentrated in summer, and the altitude is 55–65 m. The area has a humid continental climate with an average annual temperature of about 5 to 15 °C and annual precipitation between 700 and 1000 mm. The vegetation in this area is mainly herbaceous marsh vegetation and aquatic vegetation, and the dominant plant species are Calamagrostis angustifolia. In this study, three representative wetland types, including PF, NF, and SF wetland, were investigated. The GPS information is shown in Table 1.

2.2. Sampling Method

We selected three wetland types, representing PF (permanently flooded wetlands), SF (seasonally flooded wetlands) and NF (non-flooded wetlands), respectively. A random sampling method was used. In July 2017, three 10 m × 10 m plots were set up in each wetland type, and the distance of each plot from another was >50 m. After removing the litters, each plot was sampled at 10~20 soils and then mixed into one soil sample per point. The soil was collected from the top soil layer (0–20 cm) using a 5 cm diameter soil auger. It was passed through a sieve (2 mm mesh size) in order to remove the sand, gravel, and coarse plant material, and then placed in plastic bags on an ice box and kept at 4 °C. When the soil samples were transported to the laboratory, they were separated into two groups: one was stored at −20 °C for microbial analysis, and the other was dried to assess the soil’s physical and chemical properties.

2.3. Analysis of Physical and Chemical Properties of Soil

Soil organic carbon (SOC) content was determined spectrophotometrically according to a set method [19]. After the addition of 25 mL 0.3 mol/L KMnO4 solution to 0.5 g soil, shaking for 30 min at room temperature, and centrifugation (5000 r/min) for 5 min, the supernatant was diluted 250X with distilled water, and absorbance at 565 nm was spectrophotometrically determined. A blank control was served without added soil. A mmol/L change in KMnO4 concentration was equivalent to the oxidation of 9 mg of carbon. Total nitrogen (TN) and available nitrogen (AN) in soil were determined by the semi-micro Kjeldahl method as previously described [20]. Soil pH was determined with a pH meter after mixing 1 g of soil with 2.5 mL water. The total phosphorus (TP) content of the soil was determined by the alkali fusion-molybdenum antimony anti-spectrophotometric method [21], measuring absorbance at 700 nm. Available P (AP) was determined by combining this with 0.5 mol/L sodium bicarbonate extraction as per the literature [22]. For this, the leaching agent was adjusted to pH 8.5 before use, and the liquid-soil ratio was 20:1. Absorbance was determined at 880 nm. All analyses were performed in triplicate.

2.4. Phospholipid Fatty Acid Analysis (PLFA)

A modified Bligh-Dyer method with esterified C18:0 as an internal standard was used by means of an Agilent 5890 gas chromatograph (GC). The chromatographic conditions were as follows: HP-5 column (30.0 µm × 320 µm × 0.25 µm); injection volume 1 µL; and carrier gas (N2) flow rate 0.8 mL/min. The initial temperature of 140 °C was maintained for 3 min, and then increased in two stages: from 140 to 190 °C with 4 °C/min and maintained for 1 min; and from 190 to 230 °C with 3 °C/min and kept at 1 min. A flame ionization detector was used for detection. The identification and quantification of each fatty acid were determined with the use of BAME (Bacterial Acid Methyl Esters) Mix and Supelco 37 Component FAME Mix (Sigma-Aldrich, Burlington, MA, USA). The classification of microbial groups based on detected PLFAs as listed in Table 2 was based on the literature [23].

2.5. Data Analysis

The raw PLFA data were collated, including information on the total PLFA mass, the composition, and the content of fractions expressed as a percentage of total PLFA amounts for each sample. The individual characteristic PLFA biomarker amount was obtained by converting the reaction value of the internal standard 18:0 in ng/g with the following equation:
N = Target   Response ( 18 : 0 ) Response × ( 18 : 0 ) Concentration ( ng / g ) × Dissolved   sample   volume   ( uL ) Sample   dry   weight   ( g )
where N is the biomarker amount of a characteristic fatty acid type (ng/g); Response is the response value of the biomarker; 18:0 is the internal standard C18:0 (ng/µL); the volume of the dissolved sample is given in µL and the dry mass of the sample in g.
The data were initially processed using Excel for the various characteristic fatty acid biomarker amounts obtained by transformation calculations, and displayed in a trilinear table showing the corresponding characteristic fatty acid types and PLFA marker amounts for each microrganism (as per Table 1). The data were normalized for means distribution ahead of further analysis. One-way ANOVA analysis and Duncan tests were performed using SPSS, and Origin 2018 was used for the analysis of bacterial, Gram-positive, Gram-negative, and fungal marker totals or ratios. H RDA analysis and heat maps were produced using R (Vegan package). We calculated a diversity index as follows:
  • Shannon-Wiener (H): H = ∑(Pi)(lnPi)
  • Simpson (D): D = 1 − ΣPi2
Note: Pi = Ni/N, where Ni is the number of characteristic fatty acids in treatment; n1 is the number of individuals with the first characteristic fatty acid biomarker; n2 is the number of individuals with the second characteristic fatty acid biomarker; n is the number of individuals with the nth characteristic fatty acid biomarker.
3.
Margalef (M): M = (S − 1)/lnN
4.
Menhinick (E): E = S/√N
5.
Brillouin (B): B = N − 1lg(N!/n1!n2!…n!)
Where N represents the number of total characteristic fatty acids in the experiment, S is the total number of characteristic fatty acid markers.

3. Results

3.1. Physical and Chemical Properties of the Soil in Different Wetland Types

Table 3 summarizes the physical and chemical properties of the soil from the three different wetland types. Significant differences in the pH of the soil (p < 0.05) were observed, with the lowest pH found for SF (5.48) and the highest for PF (6.0) (Table 3). SOC levels were highest in PF (52.96 g/kg) and lowest in SF (35.05 g/kg) soil (Table 3). The AP and TP levels were all highest in NF (AP: 43.58 mg/kg and TP: 21. 79 mg/kg) and lowest in SF (30.43 mg/kg and 6.03 mg/kg) (Table 3). The TN levels were all highest in SF (7.62 g/kg) and lowest in PF (4.29 g/kg) (Table 3). However, the difference in AN levels was not significant, and PF soil and SF soil also did not significantly differ in AP or TP (Table 3).

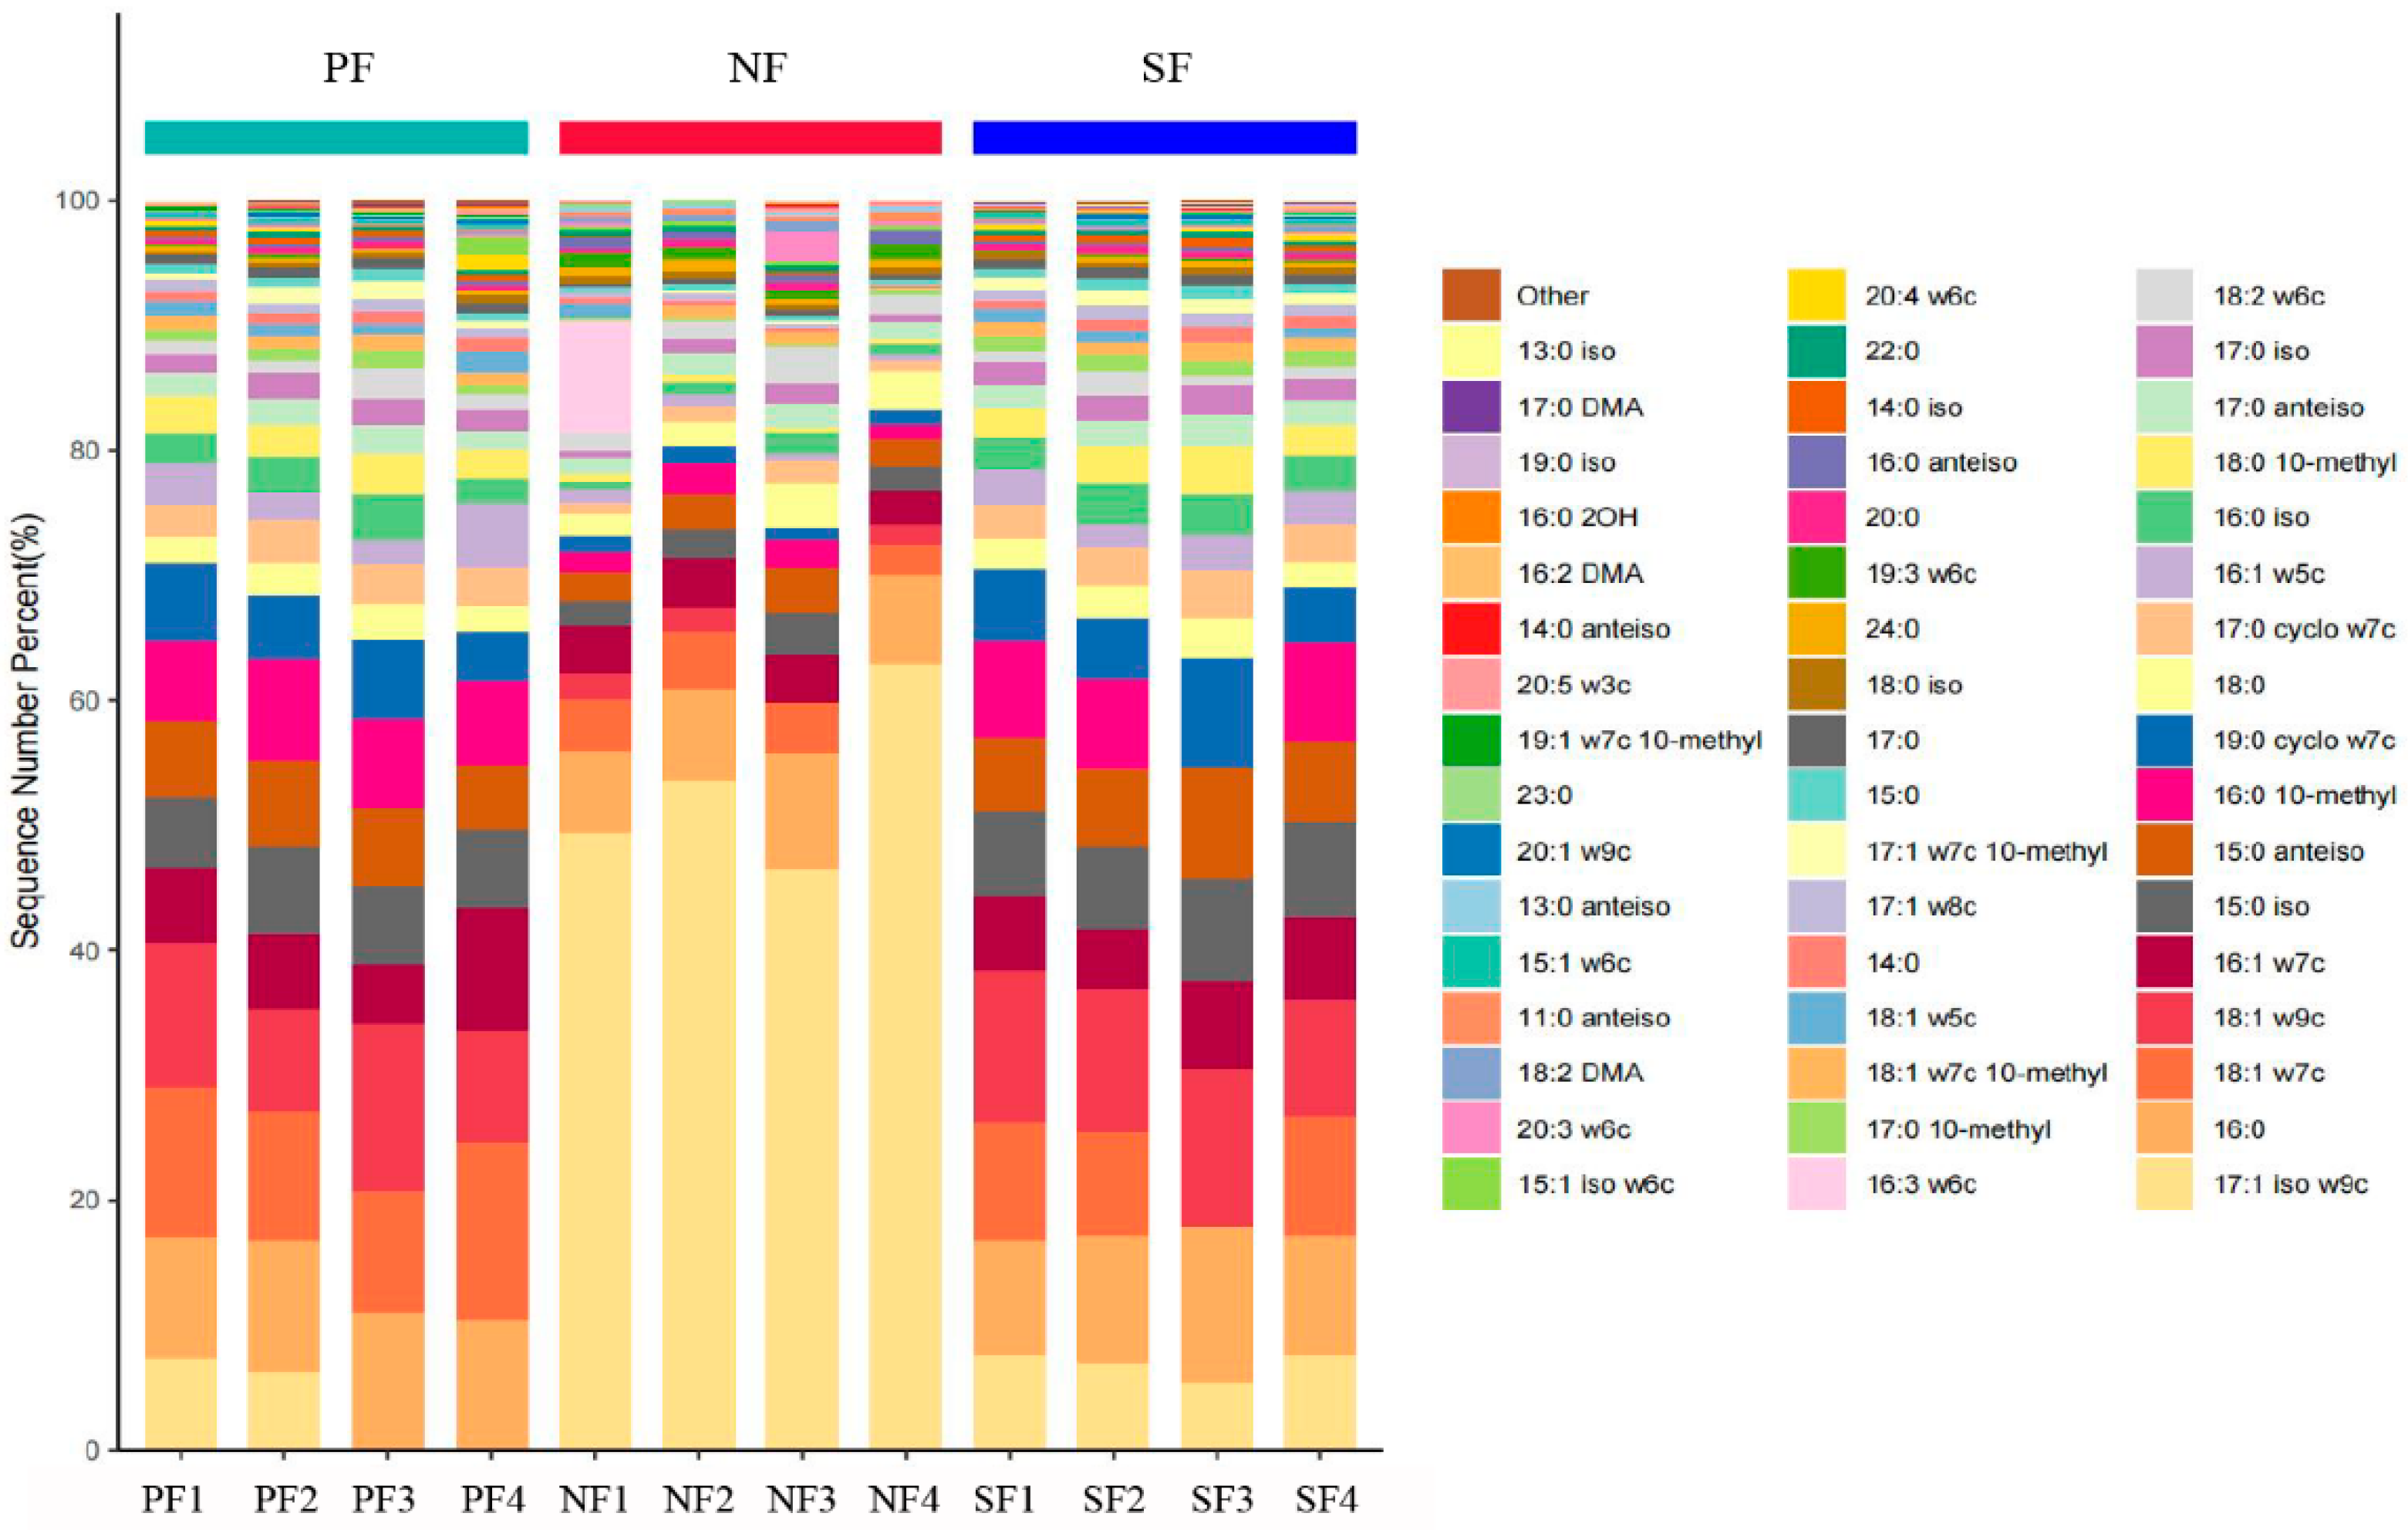
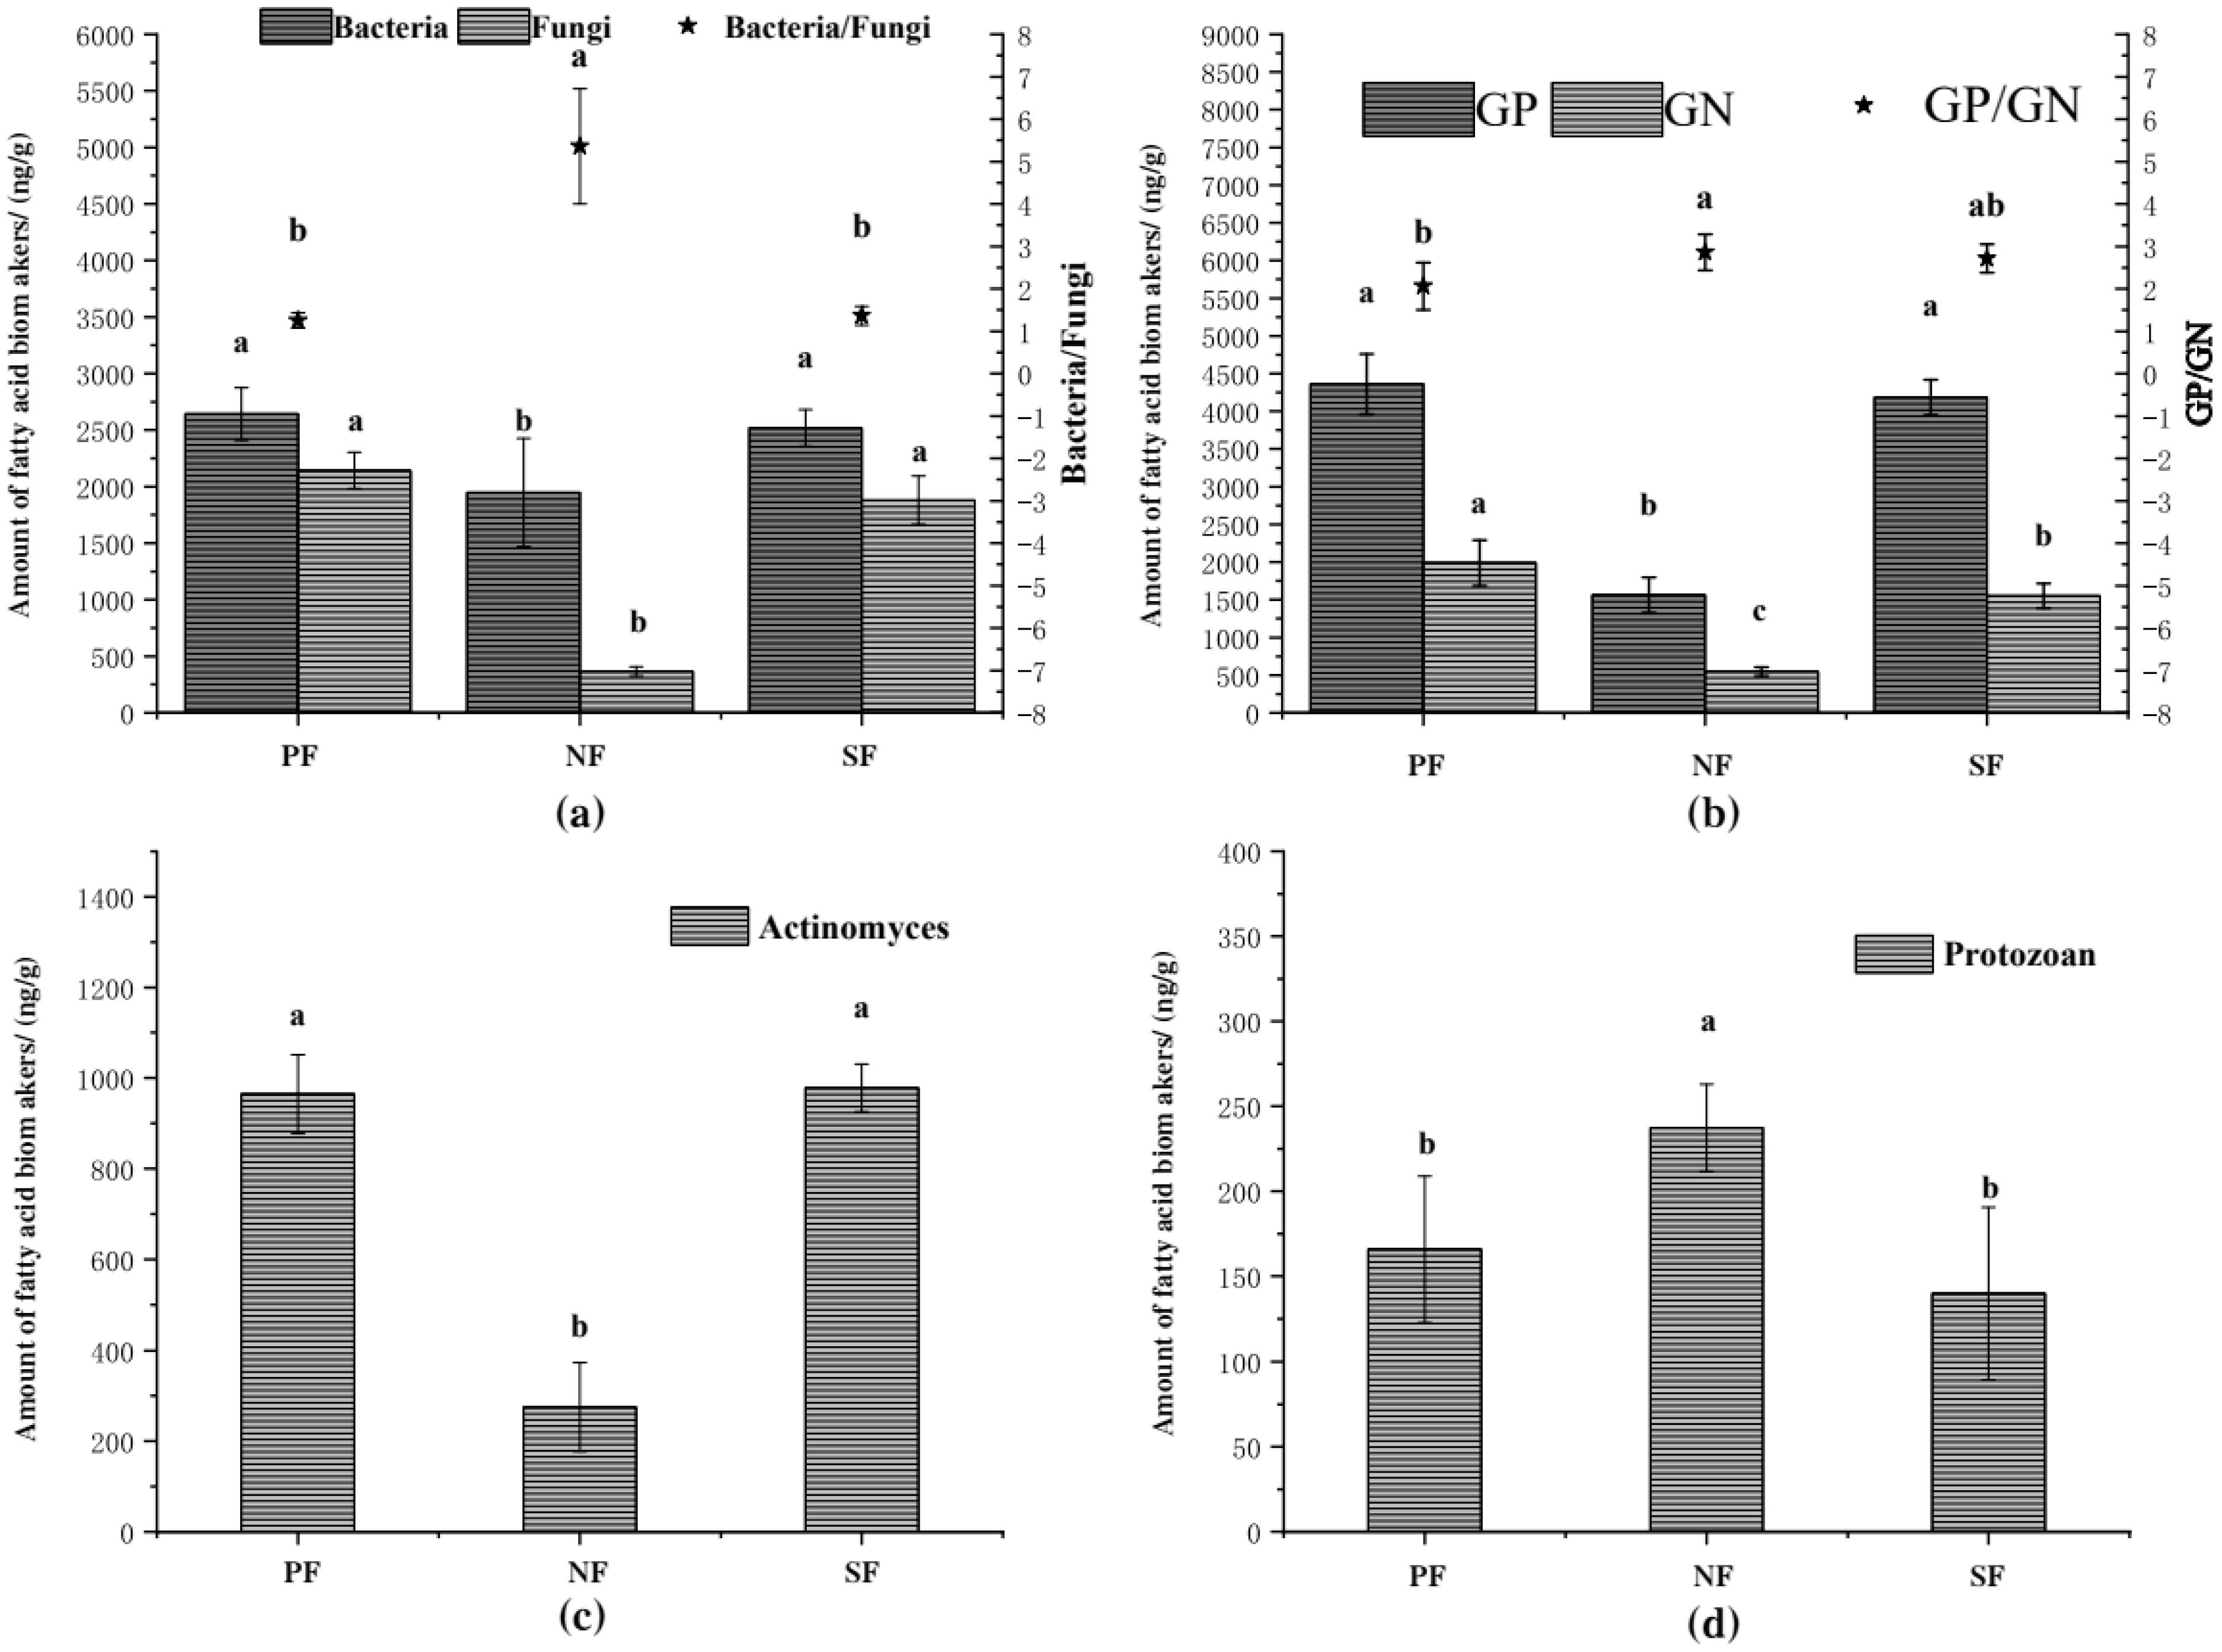
3.2. Relative Abundance of Soil Microbial PLFA in the Wetlands of the Sanjiang Plain

PLFA markers of different species of soil microorganisms are shown in Figure 2. The highest accumulative concentration of all PLFA biomarkers combined was found in NF (15,930.40 ± 5445.23 ng/g), which was mainly due to the exceptionally high level of Gram-positive i17:1ω9c (8407.15 ± 2675.84 ng/g). Slightly lower total results were obtained for PF (15,577.43 ± 2540.62 ng/g) and SF (14,762.58 ± 2769.25 ng/g), but the differences were not statistically significant. High levels of 18:1ω7c (1939.15 ± 666.13 ng/g) and 18:1ω9c (1713.26 ± 360.65 ng/g) were detected in permanently flooded wetlands, and levels of 18:1ω7c (1481.5 ± 285.71 ng/g) and 18:1ω9c (1695.81 ± 175.6 ng/g) were detected in seasonally flooded wetlands, but the lowest ranks were present in the drier non-flooded wetlands. The main contributors to these total scores were biomarkers for general bacteria (16:0), Gram-positives (i15:0, a15:0, i17:1ω9c), and Gram-negatives (16:1ω7c), as well as desulfobacteria (16:0-methyl) (Figure 2).
In general, the findings indicate there was little difference between the soil of PF and of SF, but the NF was distinct, with 43 PLFA markers in common with PF and 41 PLFA biomarkers in common with SF.
The individual PLFA fractions attributed to general bacteria (see Table 1) were combined per wetland type and these were compared with those of the general fungal group in Figure 3. Figure 3a shows that the combined amounts of PLFA biomarkers indicative for the general group of bacteria were similar between PF and SF, but lower in NF (p < 0.05). The difference was stronger for fungi, resulting in a 5-fold higher fungi level in PF and SF (Figure 3a). Based on combined biomarkers for Gram-negative bacteria (GN), it can be seen in Figure 3b that fewer of these were detected in NF compared to the other two types, and the difference was even more pronounced for Gram-positive bacteria (GP), so that the ratio of GP/GN was significantly (p < 0.05) higher in NF compared to the other two types (Figure 3b). One specific PLFA biomarker was only detected in one soil type (10:0-2OH for Gram-negative bacteria in SF). PLFA levels typical for actinomycetes were notably lower compared to those of the other bacterial groups and were particularly low in NF (Figure 3c), but this soil contained the largest levels of protozoan PLFAs (Figure 3d).

3.3. Soil Diversity Index Analysis of the Different Wetland Types

The PLFA findings were used to calculate the following indices: Shannon-Wiener, Simpson, Margalef, Menhinick, and Brillouin, with results summarized in Table 4. All indices were significantly lower for NF compared to the two other wetland types (p < 0.05). The Shannon-Wiener index showed that PF (3.05) > SF (3.02) > NF (2.12); the Simpson showed that PF (0.93) = SF (0.93) > NF (0.71); the Margalef showed that SF (4.94) > PF (4.79) > NF (3.38); the Menhinick showed that SF (0.42) > PF (0.39) > NF (0.27); the Brillouin showed that PF (3.02) > SF (2.99) > NF (2.10).

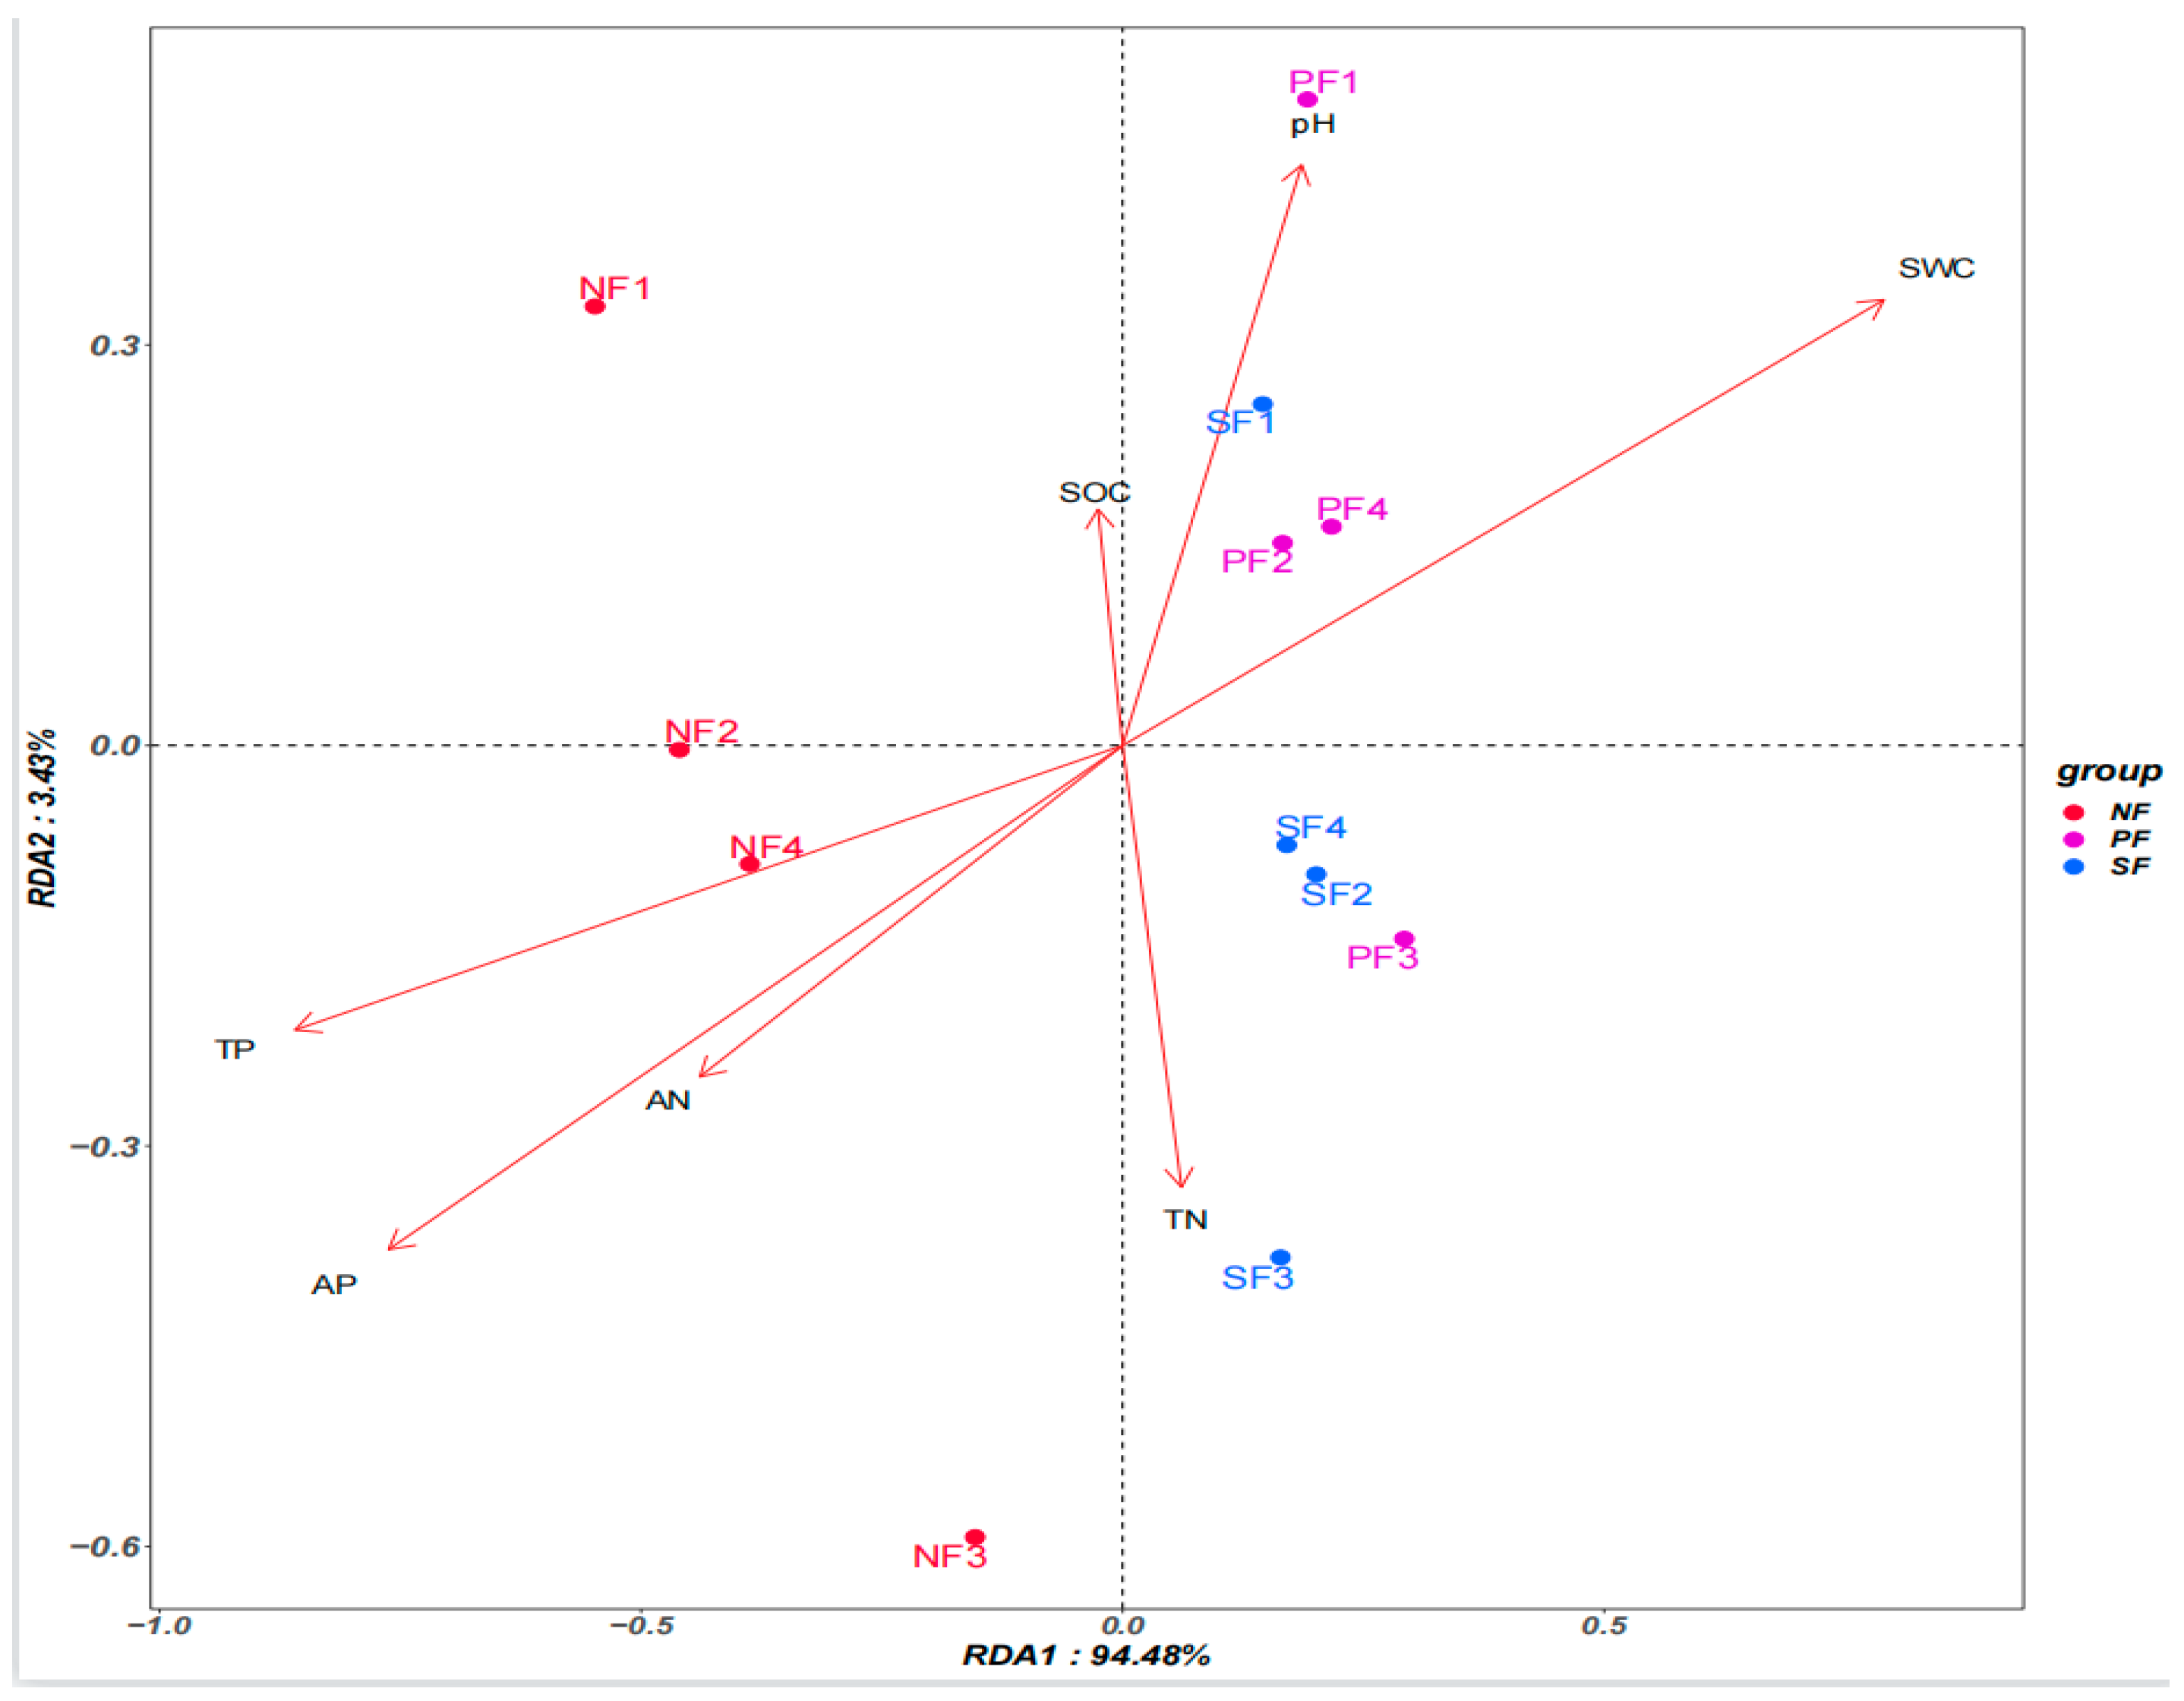
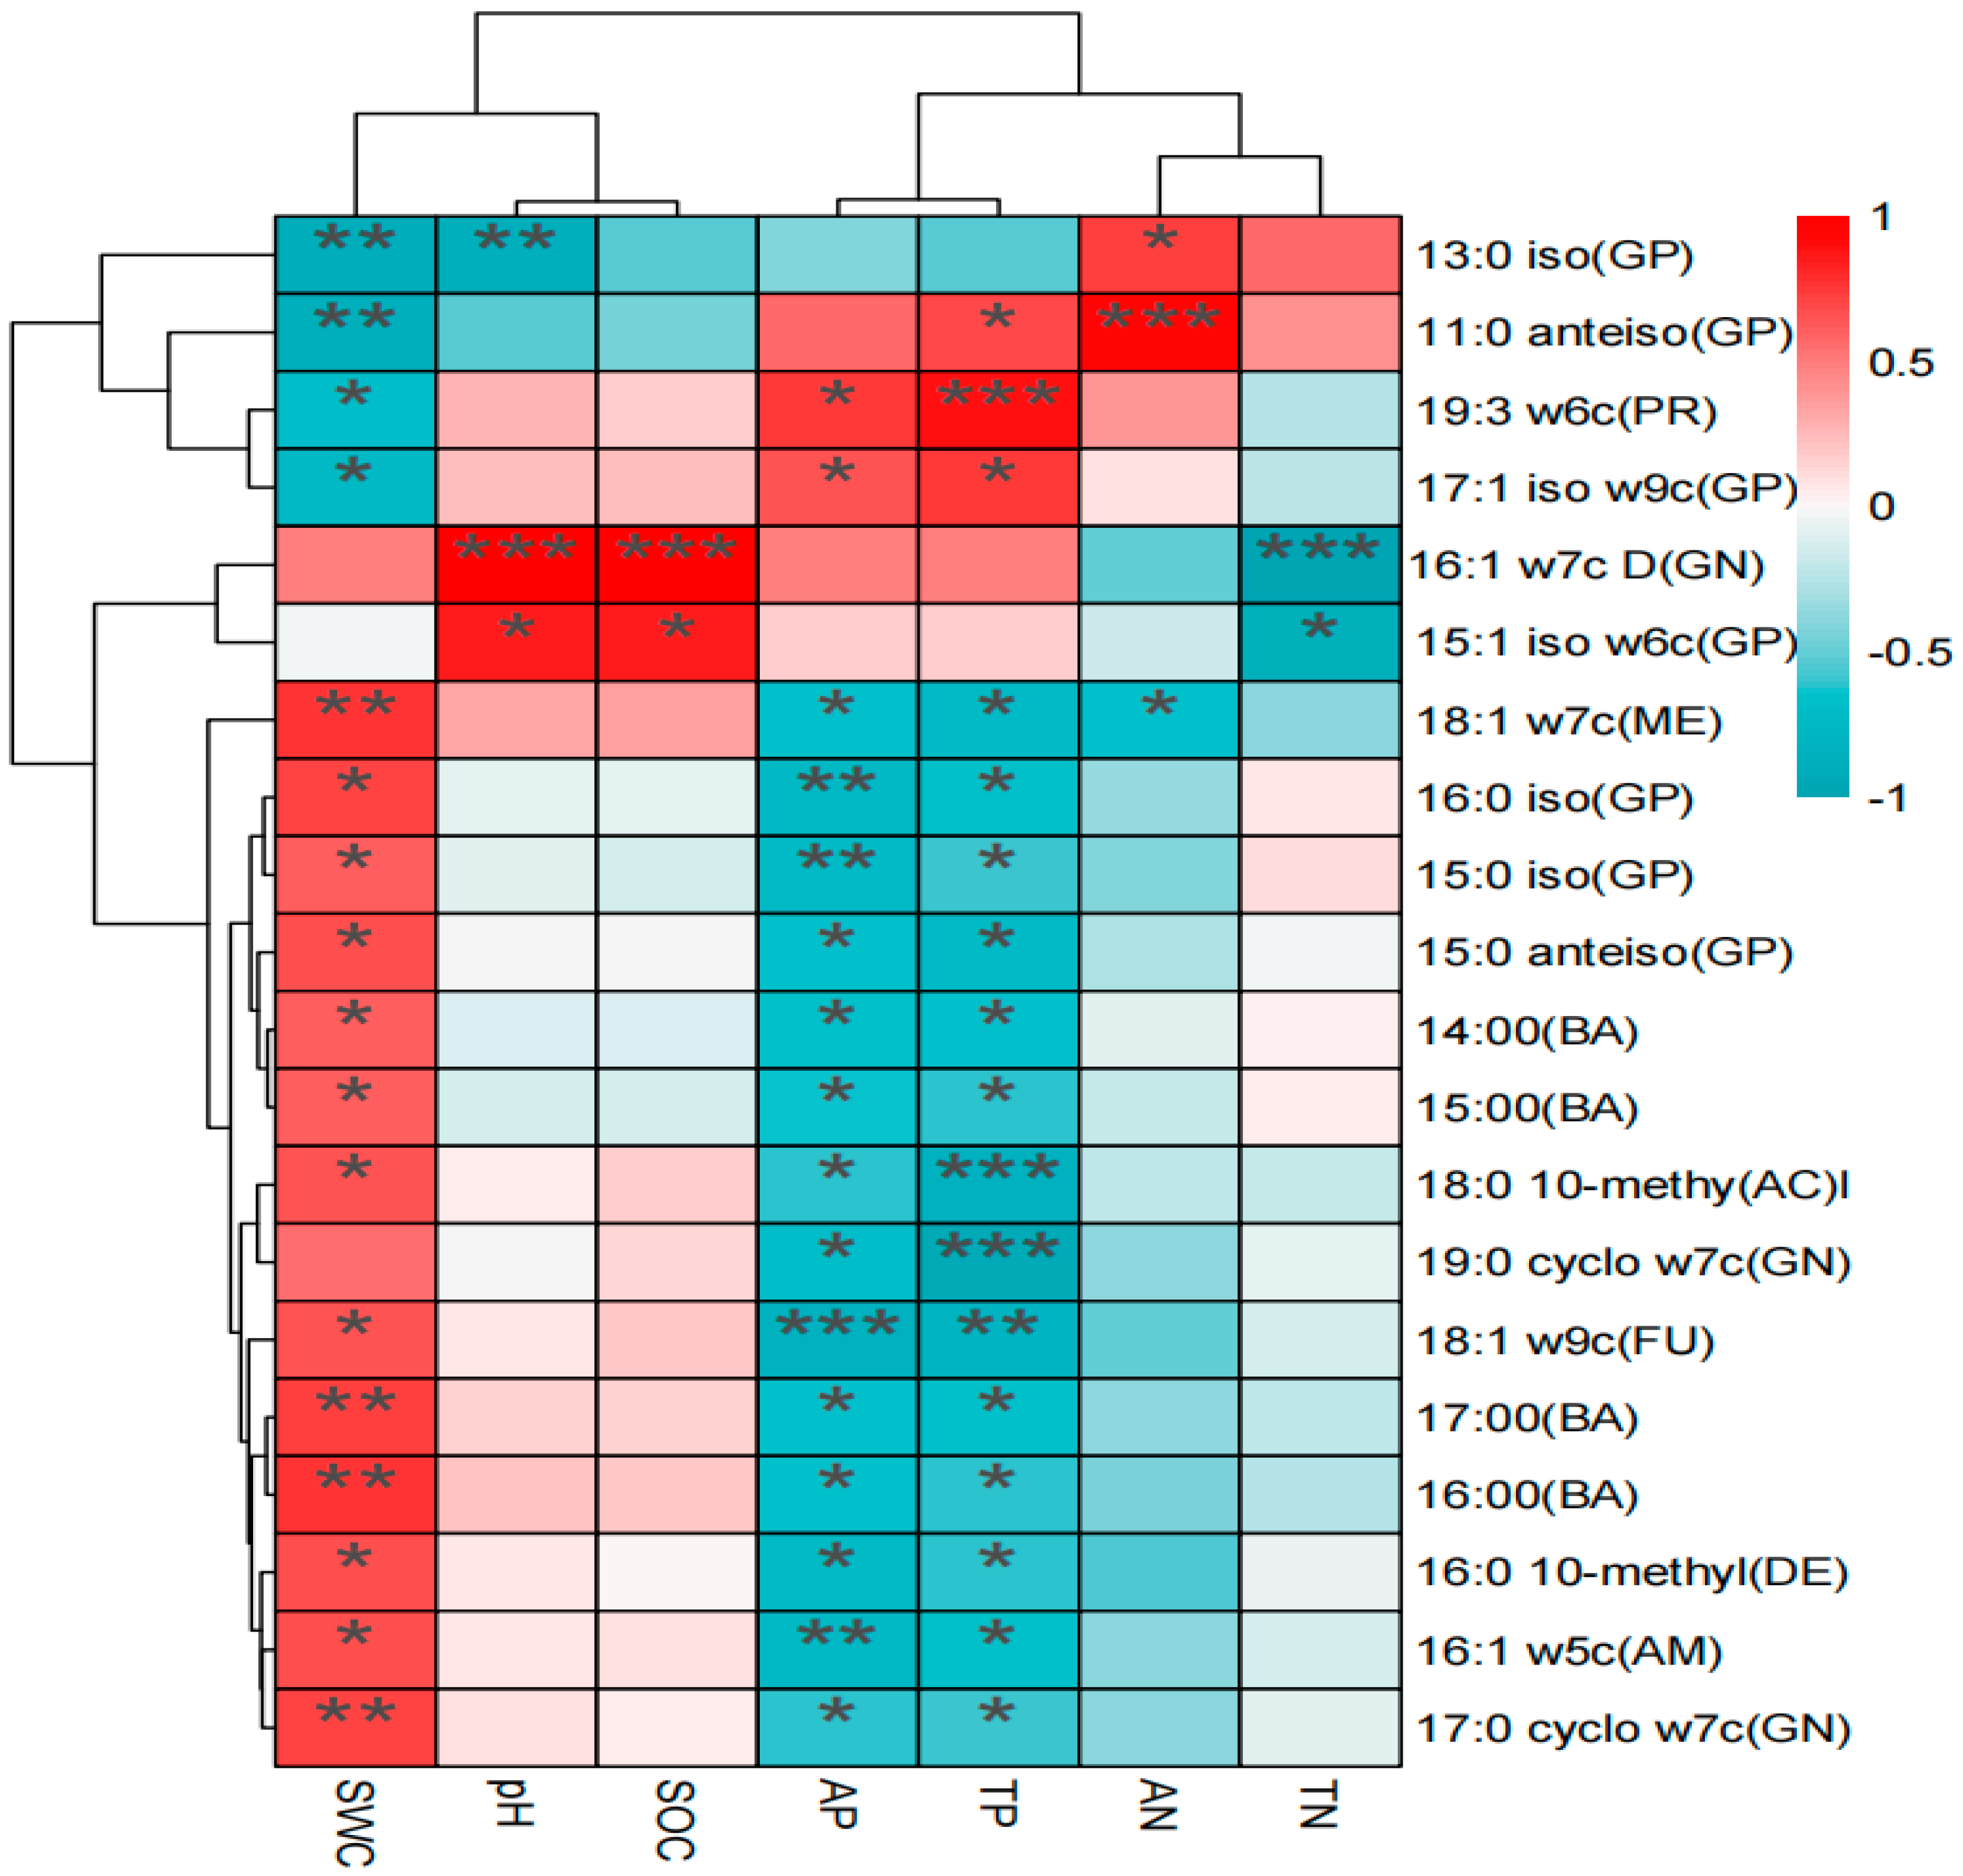
3.4. Relationship between Soil Microbial Structure and Soil Chemical Properties

Redundancy analysis was caried out with various soil microbial contents and the soil properties of the three wetland types. Figure 4 shows that 94.48% of the data was explained by RDA1 and 3.43% by RDA2, so that 97.91% was explained by RDA in total. The soil microbial community structure of PF significantly and positively correlated with SWC (r2 = 0.806, p = 0.001) and negatively correlated with TP (r2 = 0.879, p = 0.002) and AP (r2 = 0.7839, p = 0.001). The soil microbial structure of NF significantly correlated with TP and AP, but negatively correlated with SWC, while TN did not show significant correlations.
The calculated indices were also correlated with soil properties (Table 4). All indices produced significant negative correlations with TP (p < 0.01), and AP (p < 0.01 for all but Menhinick which gave p < 0.05) and positive correlation with SWC (p < 0.05), while there were no correlations with the other soil physicochemical properties (Table 5 p > 0.05). Thus, the level of phosphorus and soil water content seems to have a high impact on soil microbial diversity.
We analyzed the correlation between particular PLFAs and soil properties, and showed 20 PLFA markers with the highest correlation with soil properties in the heat map (Figure 5). Immediately obvious in this heat map is the distinction between correlations for SWC, pH and SOC on the one hand (left columns of the heat map) and TP, AP, AN and TN on the other (right columns of Figure 5). SWC was positively correlated with most particular PLFAS, while TP and AP were negatively correlated. This corroborates the opposite effects of these parameters that were already observed in the RDA plot (Figure 4). Also obvious is the strong positive correlation of protozoan PLFA 19:3w6c, and of the Gram-positive compounds i17:0ω9c (which was very abundant in NF) and i15:1ω6c (which was undetectable in SF) with AP and TP. The correlations with AP and TP were strongly negative for all other compounds, and this parameter produced the strongest correlations overall (Figure 4). Lastly, a clustering of PLFA biomarkers was observed, based on the presented correlation, that did not group according to their biological producers. This may indicate that microbial communities respond to various conditions as a mixed community of bacteria (Gram-positive and Gram-negative) as well as fungi and protozoa. Not all members of each such group respond in the same manner, and that explains the clusters indicated by the clustogram to the middle of the figure. Of course, SWC has a positive correlation with many PLFAs, which also confirms that soil water content plays a positive role in promoting the growth of a variety of microorganisms.

4. Discussion

4.1. Changes in Soil Physicochemical Properties in Different Wetland Types of Sanjiang Plain

In this study, soil physicochemical properties differed significantly among the three wetland types (Table 3, p < 0.05). Varying natural hydrological conditions may account for this. For example, soil water content showed that PF (permanently flooded wetlands) > SF (seasonally flooded wetlands) > NF (non-flooded wetlands) (Table 3). The three wetland soils were all slightly acidic, ranging from 5.48 to 6.0. The pH and SOC of the PF was the highest and the pH of the SF was the lowest. However, the soil TP and AP was significantly higher in the non-flooded wetlands than the other two wetlands. The TN in the soil was the highest in SF and the lowest in PF.
The difference in SOC content may be caused by the different moisture conditions of the three different wetland soils. SOC is one of the important indicators of soil quality [24], NF and SF soils were unsaturated and often exposed to the air, so the soil could accelerate the absorption and utilization of organic carbon by soil microorganisms, resulting in a relatively low SOC content, which is consistent with the research results of Yang et al. [25]. The wetlands of the Sanjiang Plain were disturbed by human activity and the surrounding farmland, and resulted in decreased soil quality [26]. The soil water content decreased, and the soil also had a tendency to acidify. The pH value in PF was significantly higher than the other two wetland types; pH and SOC content were also closely related, consistent with Tu et al. who found that pH directly or indirectly controls the level of soil SOC [27]. In this study, NF had the highest content of TP and AP compared to other wetland types. The discrepancy may be caused by continuous fertilization in order to maintain the high yield of food crops after many natural wetlands were reclaimed for farmland, consistent with the research results of Luo et al. [28].

4.2. Effects of Wetland Types on Soil Microbial Composition

We used the PLFA marker amount (ng/g) to represent the microbial biomass. The total bacterial and fungal biomass in PF and SF was similar, but both were significantly higher than in NF (Figure 3a). Additionally, the Gram-positive, Gram-negative (Figure 3b) and actinomycetes (Figure 3c) in PF and SF were significantly higher than that in NF. This may be correlated with the soil water content and soil nutrient. The microbial community composition was influenced by hydrological conditions through soil moisture, aeration and vegetation type. The key factor of soil microbial community is significantly related to the functional potential of soil microorganisms [29]. Soil water content may affect the transcription and activity of microorganisms, which may lead to changes in soil microbial communities [30,31]. Our results were consistent with many studies [32,33]. However, some studies produced results that were not consistent with our own [34,35,36]. This may be because of the season in which we carried out this research, and other factors (e.g., climate and temperature) which could lead to differences in soil microbial composition. Therefore, future studies should take seasonal factors into account.
Phosphorus can affect the soil microbial biomass and community composition [37,38]. In this study, TP and AP were found to be significantly negatively correlated with soil microbial biomass (PLFA). This is possible due to agricultural activity. Agricultural fertilization influences the TP and AP of wetland. The enrichment of inorganic elements increases the circulation rate of phosphorus, which in turn has an impact on soil microbial biomass, as noted by anthropogenic phosphorus limitation by Vitoousek et al. [39]. There are now multiple mechanisms to explain the effect of phosphorus on soil microbes. For example, Liu et al. [40] and Li et al. [41] proposed that addition of phosphorus can increase litter fall and fine root biomass, thereby increasing soil microbial carbon availability, and ultimately increasing soil microbial biomass and changing community composition; Liu et al. [42] believed that after the addition of phosphorus, the soil pH and osmotic potential would also change, thus accelerating the growth of microorganisms; while Huang et al. [43] found that phosphorus had a significant effect on soil microbial biomass. The soil microbial biomass of the high phosphorus addition treatment was significantly higher than that of the control treatment and the low phosphorus addition treatment. However, in our study, TP and AP were negatively correlated with the microbial biomass. Some studies are consistent with ours in this regard [44,45]. The farmland around the wetland in the Sanjiang Plain continues to increase. After the application of fertilizers, phosphorus will accumulate in the soil. After the runoff flows into the wetland, the excessive phosphorus accumulation will form a phosphorus limit, breaking the normal element cycle and affecting the soil. The absorption and transformation of other nutrients by microorganisms may reduce soil microbial biomass.

4.3. Effects of Wetland Types on Soil Microbial Diversity

In this study, the soil microbial diversity in the three different wetland types was significantly different. The diversity indices of PF and SF were significantly higher than those in NF (Table 4). Correlation analysis showed that SWC was positively associated with soil microbial diversity, but TP and AP showed a significant negative correlation with soil microbial diversity. This is consistence with some studies. For example, Cai et al. [46] found that the activity of soil microorganisms in alpine grassland would reach the maximum under certain interference. NF wetland was the driest and had the lowest soil water content compared to other wetland types. PF wetland is typical wetland and has a stable structure and function. When the soil water content decreases, the PF transfers into NF and SF, so the high structure and function of the ecosystem may be the reason why PF had the highest soil microbial diversity. Another reason may be that soil nutrient factors, such as SWC, TP, and AP, differed significantly among the three wetland types. We speculate that the reduction in water content and phosphorus transport efficiency greatly reduces the concentration of phosphorus in the soil. An appropriate concentration of phosphorus is beneficial to biological growth and development, but an excessively high concentration may form phosphorus limitation, resulting in low soil microbial diversity.
The PLFA technique that was applied to characterize the soil microbial community of different wetland types has certain shortcomings: (1) Since not all characteristic fatty acids of all soil microorganisms are known, a particular fatty acid that can be detected cannot always be accurately correlated with the soil microorganisms responsible for their production, so there is some bias in the interpretation. (2) The method depends on labeling fatty acids and judging the microbial community structure based on the position of the fatty acids. If the position of the marker changes or the marker is not accurate, the final result will be affected. (3) Due to the limitations of PLFA, it does not capture changes in metabolic activity and functional patterns of soil microbial communities as a result of changes in the environment. Nevertheless, the method is supplemental to other existing technologies, such as high-throughput sequencing and biology technologies.

5. Conclusions

Phospholipid fatty acid (PLFA) analysis was employed to quantify the types and contents of soil microbial PLFA in different wetland types of the Sanjiang Plain. This study demonstrated that permanently flooded wetland had the most diverse soil microbial community, while non-flooded wetland had the least diverse. Soil water content, total and available phosphorus, and total and available nitrogen correlated significantly with soil microbial communities in the three wetland types. In response to the various soil parameters tested, microbial diversity in the different wetland types clustered for different PLFA biomarkers, which represented complex communities. The diversity of such communities can be high and unique for each wetland type. The diversity indices showed that soil microbial diversity was highest in permanently flooded wetland, which can be considered the most stable. Differences in soil microbial community structure and diversity in these wetland types were demonstrated, offering a theoretical basis for high-quality management of wetland reserves. These findings suggest that future studies should deploy other technologies, e.g., metagenomic, to achieve a deeper understanding of the changes in soil microbial communities and functions in wetland ecosystems.

Author Contributions

M.W., X.W. and R.Z. designed and performed the experiment and prepared this manuscript. L.Y. helped to finish the bioinformatic analysis. X.S. revised this manuscript and language editing. Y.L. was in field work to collect the samples. All coauthors contributed to manuscript editing. All authors have read and agreed to the published version of the manuscript.

Funding

This work was funded by the Natural Sciences Foundation of Heilongjiang Province (LH2020C088); the Heilongjiang Province Postdoctoral Research Start-up Fund Project (LBH-Q21167);the Outstanding Youth Foundation of Heilongjiang University (JCL202006); and the China Scholarship Council Visiting Scholar Program (201908230401).

Institutional Review Board Statement

Not applicable.

Informed Consent Statement

Not applicable.

Data Availability Statement

Data are contained within the article.

Conflicts of Interest

The authors declare that the research was conducted in the absence of any commercial or financial relationships that could be construed as a potential conflict of interest.

References

  1. Zhang, R.T.; Sui, X.; Fu, X.Y.; Liu, Y.N. Effects of elevated CO2 concentration on litter decomposition in wetland ecosystems. Territ. Nat. Resour. Study 2019, 2, 75–78. [Google Scholar] [CrossRef]
  2. Zhang, R.T.; Sui, X.; Fu, X.Y.; Liu, Y.N.; Ni, H.W. Influence of Simulation Nitrogen Deposition on Soil Microbial Functional Diversity of Calamagrostis Angustifolia Wetland in Sanjiang Plain. Acta Agrestia Sin. 2016, 24, 1226–1233. [Google Scholar] [CrossRef]
  3. Kotzé, E.; Sandhage-Hofmann, A.; Amelung, W.; Oomen, R.J.; du Preez, C.C. Soil microbial communities in different rangeland management systems of a sandy savanna and clayey grassland ecosystem, South Africa. Nutr. Cycl. Agroecosyst. 2017, 107, 227–245. [Google Scholar] [CrossRef]
  4. Sui, X.; Zhang, R.; Frey, B.; Yang, L.; Liu, Y.; Ni, H.; Li, M. Soil physicochemical properties drive the variation in soil microbial communities along a forest successional series in a degraded wetland in northeastern China. Ecol. Evol. 2021, 11, 2194–2208. [Google Scholar] [CrossRef]
  5. Sieben, E.J. Zonal and azonal vegetation revisited: How is wetland vegetation distributed across different zonobiomes. Austral Ecol. 2019, 44, 449–460. [Google Scholar] [CrossRef]
  6. Chen, X.; Chen, H.; Zhao, J.; Xin, Y.; Li, Y. Bacterial community structure and diversity in the rhizospheric soil of Robinia pseudoacacia and Juniperus sabina planted in iron tailings matrix. Environ. Sci. Pollut. Res. 2022, 1–13. [Google Scholar] [CrossRef]
  7. Yang, Y.; Yang, Y.; Geng, Y.; Huang, G.; Cui, X.; Hou, M. Effects of Different Land Types on Soil Enzyme Activity in the Qinghai Lake Region. Wetlands 2018, 38, 711–721. [Google Scholar] [CrossRef]
  8. White, C.; Sayer, J.; Gadd, G. Microbial solubilization and immobilization of toxic metals: Key biogeochemical processes for treatment of contamination. FEMS Microbiol. Rev. 1997, 20, 503–516. [Google Scholar] [CrossRef]
  9. Kunito, T.; Akagi, Y.; Park, H.-D.; Toda, H. Influences of nitrogen and phosphorus addition on polyphenol oxidase activity in a forested Andisol. Forstwiss. Cent. 2009, 128, 361–366. [Google Scholar] [CrossRef]
  10. Bell, J.K.; Siciliano, S.; Lamb, E.G. A survey of invasive plants on grassland soil microbial communities and ecosystem services. Sci. Data 2020, 7, 86. [Google Scholar] [CrossRef]
  11. Schlatter, D.C.; Bakker, M.; Bradeen, J.; Kinkel, L.L. Plant community richness and microbial interactions structure bacterial communities in soil. Ecology 2015, 96, 134–142. [Google Scholar] [CrossRef] [PubMed] [Green Version]
  12. Simpson, A.J.; Simpson, M.J.; Smith, E.; Kelleher, B.P. Microbially Derived Inputs to Soil Organic Matter: Are Current Estimates Too Low? Environ. Sci. Technol. 2007, 41, 8070–8076. [Google Scholar] [CrossRef] [PubMed]
  13. Zhou, X.; Zhang, Z.; Tian, L.; Li, X.; Tian, C. Microbial communities in peatlands along a chronosequence on the Sanjiang Plain, China. Sci. Rep. 2017, 7, 9567. [Google Scholar] [CrossRef] [PubMed] [Green Version]
  14. Zhang, Z.; Zhou, X.; Tian, L.; Ma, L.; Luo, S.; Zhang, J.; Li, X.; Tian, C. Fungal communities in ancient peatlands developed from different periods in the Sanjiang Plain, China. PLoS ONE 2017, 12, e0187575. [Google Scholar] [CrossRef] [PubMed] [Green Version]
  15. Wu, Y.; Xu, N.; Wang, H.; Li, J.; Zhong, H.; Dong, H.; Zeng, Z.; Zong, C. Variations in the diversity of the soil microbial community and structure under various categories of degraded wetland in Sanjiang Plain, northeastern China. Land Degrad. Dev. 2021, 32, 2143–2156. [Google Scholar] [CrossRef]
  16. Ji, Y.; Wang, J.H.; Yuan, Z.N.; Guan, J.F.; Liu, C.Y.; Zhu, Y.N. Impact of different restoration methods on fungal community diversity in Qixing River wetland. J. Eng. Heilongjiang Univ. 2017, 8, 60–66. [Google Scholar] [CrossRef]
  17. Wang, J.F.; Han, D.Y.; Wang, J.B.; Fu, X.L. Variations in plant species composition and diversity of Calamagrostis angustifolia community along soil water level gradient in the Sanjiang Plain. Acta Ecol. Sin. 2017, 37, 3515–3524. [Google Scholar] [CrossRef] [Green Version]
  18. Wang, Q.B.; Wang, Z.Y.; Wu, L.H.; Yang, D.Q.; Ding, C.H.; Wang, M.; Wang, R.; Fu, X.; Wang, Z.B. Conversion of wetlands to farmland and forests reduces soil microbial functional diversity and carbon use intensity. Appl. Ecol. Environ. Res. 2022, 20, 4553–4564. [Google Scholar] [CrossRef]
  19. Blair, G.; Lefroy, R.; Lisle, L. Soil carbon fractions based on their degree of oxidation, and the development of a carbon management index for agricultural systems. Aust. J. Agric. Res. 1995, 46, 1459–1466. [Google Scholar] [CrossRef]
  20. Zeng, Q.T. The Influence Factors and Elimination Methods of the Determination of Nitrogen in Geochemical Samples by Sei-micro Kjeldahl Method. Guangdong Chem. Ind. 2018, 45, 225–226+220. [Google Scholar]
  21. Pang, Y.Q.; Zhang, Q.Q. Improvement of alkali fusion-molybdenum antimony anti-spectrophotometric method for the determination of soil phosphorus indicators. Acta Geol. Sichuan 2021, 41, 167–168. [Google Scholar] [CrossRef]
  22. De Silva, C.S.; Koralage, I.S.A.; Weerasinghe, P.; Silva, N.R.N. The Determination of Available Phosphorus in Soil: A Quick and Simple Method. OUSL J. 2015, 8, 1. [Google Scholar] [CrossRef] [Green Version]
  23. Ma, J.P.; Pang, D.B.; Chen, L.; Wan, H.Y.; Chen, G.L.; Li, X.B. Phospholipid fatty acid analysis of soil microbes in typical vegetation types at different elevation on the east slope of Helan Mountain. Acta Ecol. Sin. 2022, 42, 5045–5058. [Google Scholar] [CrossRef]
  24. Yang, G.S.; Song, C.C.; Song, Y.Y.; Hou, C.C. Characteristics of microbial activities in soil profiles of Calamagrostis angustifolia wetlands in Sanjiang Plain. Acta Ecol. Sin. 2010, 30, 6146–6153. [Google Scholar]
  25. Yang, G.S.; Song, C.C.; Wang, L.; Wang, L.L.; Li, Y.C. Influence of water level gradient on marsh soil microbial activity of Calamagrostis angustifolia. Environ. Sci. 2010, 31, 444–449. [Google Scholar] [CrossRef]
  26. Ji, Y.H.; Lu, X.G.; Yang, Q.; Zhao, K.Y. Recent thirty years evolvement trend of Calamagrostis angustifolia community in Sanjiang Plain. Chin. J. Ecol. 2006, 25, 1328–1332. [Google Scholar] [CrossRef]
  27. Tu, C.; He, T.; Lu, X.; Luo, Y.; Smith, P. Extent to which pH and topographic factors control soil organic carbon level in dry farming cropland soils of the mountainous region of Southwest China. CATENA 2018, 163, 204–209. [Google Scholar] [CrossRef]
  28. Lou, H.; Yang, S.; Zhao, C.; Zhou, Q.; Bai, J.; Hao, F.; Wu, L. Phosphorus risk in an intensive agricultural area in a mid-high latitude region of China. CATENA 2015, 127, 46–55. [Google Scholar] [CrossRef]
  29. Brockett, B.F.; Prescott, C.E.; Grayston, S.J. Soil moisture is the major factor influencing microbial community structure and enzyme activities across seven biogeoclimatic zones in western Canada. Soil Biol. Biochem. 2012, 44, 9–20. [Google Scholar] [CrossRef]
  30. Yu, S.; Ehrenfeld, J.G. The effects of changes in soil moisture on nitrogen cycling in acid wetland types of the New Jersey Pinelands (USA). Soil Biol. Biochem. 2009, 41, 2394–2405. [Google Scholar] [CrossRef]
  31. Gartzia-Bengoetxea, N.; Kandeler, E.; de Arano, I.M.; Arias-González, A. Soil microbial functional activity is governed by a combination of tree species composition and soil properties in temperate forests. Appl. Soil Ecol. 2016, 100, 57–64. [Google Scholar] [CrossRef]
  32. Wang, J.F.; Li, M.S.; Zhang, R.T.; Sui, X.; Ma, W.C.; Ni, H.W. Assessment of microbial diversity of Deyeuxia angustifolia wetland through phospholipid fatty acids (PLFA) in Sanjiang plain. Int. J. Agric. Biol. 2018, 20, 1463–1470. [Google Scholar] [CrossRef]
  33. Wang, Q.L.; Cao, G.M.; Wang, C.T. Quantitative characters of soil microbes and microbial biomass under different vegetations in alpine meadow. Chin. J. Ecol. 2007, 26, 1002–1008. [Google Scholar] [CrossRef]
  34. Xu, S.; Wang, Y.; Guo, C.; Zhang, Z.; Shang, Y.; Chen, Q.; Wang, Z.-L. Comparison of Microbial Community Composition and Diversity in Native Coastal Wetlands and Wetlands that Have Undergone Long-Term Agricultural Reclamation. Wetlands 2017, 37, 99–108. [Google Scholar] [CrossRef]
  35. Bossio, D.A.; Scow, K.M. Impact of carbon and flooding on the metabolic diversity of microbial communities in soils. Appl. Environ. Microbiol. 1995, 61, 4043–4050. [Google Scholar] [CrossRef] [PubMed] [Green Version]
  36. Drenovsky, R.; Vo, D.; Graham, K.; Scow, K. Soil Water Content and Organic Carbon Availability Are Major Determinants of Soil Microbial Community Composition. Microb. Ecol. 2004, 48, 424–430. [Google Scholar] [CrossRef]
  37. Xu, F.; Zhang, T.; Huai, B.D.; Sui, W.Z.; Yang, X. Effects of Land Use Changes on Soil Fungal Community Structure and Function in the Riparian Wetland Along the Downstream of the Songhua River. Environ. Sci. 2021, 42, 2531–2540. [Google Scholar] [CrossRef]
  38. Anderson, I.C.; Cairney, J.W.G. Diversity and ecology of soil fungal communities: Increased understanding through the application of molecular techniques. Environ. Microbiol. 2010, 6, 769–779. [Google Scholar] [CrossRef]
  39. Vitousek, P.M.; Porder, S.; Houlton, B.Z.; Chadwick, O.A. Terrestrial phosphorus limitation: Mechanisms, implications, and nitrogen–phosphorus interactions. Ecol. Appl. 2010, 20, 5–15. [Google Scholar] [CrossRef] [Green Version]
  40. Liu, L.; Gundersen, P.; Zhang, T.; Mo, J. Effects of phosphorus addition on soil microbial biomass and community composition in three forest types in tropical China. Soil Biol. Biochem. 2012, 44, 31–38. [Google Scholar] [CrossRef]
  41. Li, J.; Li, Z.; Wang, F.; Zou, B.; Chen, Y.; Zhao, J.; Mo, Q.; Li, Y.; Li, X.; Xia, H. Effects of nitrogen and phosphorus addition on soil microbial community in a secondary tropical forest of China. Biol. Fertil. Soils 2015, 51, 207–215. [Google Scholar] [CrossRef]
  42. Liu, L.; Zhang, T.; Gilliam, F.S.; Gundersen, P.; Zhang, W.; Chen, H.; Mo, J. Interactive Effects of Nitrogen and Phosphorus on Soil Microbial Communities in a Tropical Forest. PLoS ONE 2013, 8, e61188. [Google Scholar] [CrossRef] [PubMed]
  43. Huang, J.; Hu, B.; Qi, K.; Chen, W.; Pang, X.; Bao, W.; Tian, G. Effects of phosphorus addition on soil microbial biomass and community composition in a subalpine spruce plantation. Eur. J. Soil Biol. 2016, 72, 35–41. [Google Scholar] [CrossRef]
  44. Teng, Z.; Zhu, Y.; Li, M.; Whelan, M.J. Microbial community composition and activity controls phosphorus transformation in rhizosphere soils of the Yeyahu Wetland in Beijing, China. Sci. Total Environ. 2018, 628–629, 1266–1277. [Google Scholar] [CrossRef] [Green Version]
  45. Wang, D.P.; Song, Q.; Liu, Z.K.; Zhao, K.; Liu, Y.L.; Xiao, H.; Cao, J.; Rong, Y.P. Effects of grassland utilization on microbial community structure in Hulunbuir grassland. Pratacul. Sci. 2022, 39, 421–430. [Google Scholar] [CrossRef]
  46. Cai, X.B.; Zhang, Y.Q.; Shao, W. Characteristics of soil fertility in alpine steppes at different degradation grades. Acta Ecol. Sin. 2008, 28, 1034–1044. [Google Scholar] [CrossRef]
Figure 1. Location of the sampling sites (red) within the Sanjiang Plain, Honghe farm, Heilongjiang Province in North-Western China. PF: permanently flooded wetlands; NF: non-flooded wetlands; SF: seasonally flooded wetlands.
Sustainability 14 14394 g001
Figure 2. Percent-stacked histograms of different soil microbial PLFA marker amounts in three different wetlands. PF: permanently flooded wetlands; NF: non-flooded wetlands; SF: seasonally flooded wetlands.
Sustainability 14 14394 g002
Figure 3. Totals of detected PLFA (ng/g) of characteristic soil microbial communities from different wetlands in the Sanjiang Plain. (a): Accumulative PLFA biomarkers indicative of unspecified bacteria and fungi, respectively, and bacteria/fungi ratio. “★” represents the ratio of bacteria to fungi. (b): ac-cumulative PLFAs for Gram-positive (GP) and Gram-negative (GN) bacteria and their ratio.“★” represents the ratio of Gram-positive to Gram-negative bacteria. (c): accumulative PLFA levels in-dicative of Actinobacteria, and (d) of protozoa. PF: permanently flooded wetlands; NF: non-flooded wetlands; SF: seasonally flooded wetlands. The different letters (a,b,c) represent significant differ-ences between treatments.
Sustainability 14 14394 g003
Figure 4. Redundancy analysis (RDA) conducted with the soil microbial PLFA-derived data and soil physicochemical properties of the three different wetland types in the Sanjiang Plain. SWC: Soil Water Content; SOC: Soil Organic Carbon; TN: Total Nitrogen; AN: Available Nitrogen; TP: Total Phosphorus; AP: Available Phosphorus; PF: permanently flooded wetlands; NF: non-flooded wetlands; SF: seasonally flooded wetlands.
Sustainability 14 14394 g004
Figure 5. Heat map showing correlations between individual PLFA biomarkers and soil physicochemical properties in the three wetlands. Statistical significance is given as * p < 0.05, ** p < 0.01, *** p < 0.001. AN: available nitrogen, AP: available phosphorous, TP: total phosphorus, TN: total nitrogen, SOC: soil organic carbon, SWC: Soil Water Content.
Sustainability 14 14394 g005
Table 1. The GPS and vegetation information of three wetland types in Sanjiang Plain.
Wetland TypesLongitudeLatitudeVegetations
PF133°37′43″47°47′16″Calamagrostis Angustifolia, Phragmites australis, Carex miyabei var. maopengensis, Stachys baicalensis, Glyceria spiculosa
NF133°37′51″47°47′21″Calamagrostis Angustifolia, Anemone rivularis, Stachys lanata, Sanguisorba tenuifolia, Carex korshinskyi, Lathyrus quinquenervius
SF133°37′04″47°45′39″Calamagrostis Angustifolia, Carex korshinskyi, Trollius paluster, Sanguisorba tenuifolia, Geranium linearilobum
PF, permanently flooded wetland; SF, seasonally flooded wetland; NF, non-flooded wetland.
Table 2. The phospholipid fatty acid (PLFA) markers used to identify particular soil microbial community groups.
Microbial Group *PLFA Biomarkers
Unspecified bacteria (BA)12:0, 13:0, 14:0, 15:0, 16:0, 17:0, 18:0, 22:0, 24:0
Gram-positive bacteria (GP)a11:0, i13:0, a13:0, i14:0, a14:0, i15:0, a15:0, i15:1ω6c, a16:0, i16:0, a17:0, i17:0, i17:1ω9c, i18:0, i19:0
Gram-negative bacteria (GN)10:0-2OH, 14:1ω5c, 16:1ω7c, 16:0-2OH, 16:1ω7cDMA, 17:0DMA, 17:1ω8c, 17:0cycloω7c, 19:0cycloω7c, 20:1ω9c, 22:1ω9c
Actinomycetes (AC)10Me17:0, 10Me17:1ω7c, 10Me18:0, 10Me18:1ω7c, 10Me19:1ω7c
Anaerobic Bacteria (AB)* 16:2DMA, 18:2DMA
Aerobic bacteria (AE)15:1ω6c
Desulfobacteria (DE)16:0-methyl
Methanotrophs (ME)18:1ω5c, 18:1ω6c, 18:1ω7c
Unspecified Fungi (FU)18:1ω9c, 23:0
Arbuscular Mycorrhiza (AM)16:1ω5c
Saprophytic Fungi (SF)18:2ω6c
Protozoa (PR)19:3ω6c, 20:3ω6c, 20:4ω6c, 20:5ω3c
* After Ma et al., 2022 [15].
Table 3. Soil physicochemical properties of the different wetland types.
Wetland TypepHAN
(mg/kg)
AP
(mg/kg)
TP
(g/kg)
TN
(g/kg)
SOC
(g/kg)
SWC
(%)
Permanently flooded (PF)6.00 ± 0.09 a496.77 ± 89.02 a33.12 ± 1.82 b6.36 ± 2.02 b4.29 ± 0.08 c52.96 ± 2.86 a82.67 ± 2.05 a
Seasonally flooded (SF)5.48 ± 0.05 c594.4 ± 66.98 a30.43 ± 3.61 b6.03 ± 1.82 b7.62 ± 0.2 a35.05 ± 1 c52.33 ± 2.05 b
Non-flooded (NF)5.65 ± 0.05 b613.56 ± 17.74 a43.58 ± 2.67 a21.79 ± 1.34 a5.62 ± 0.69 b46.57 ± 4.46 b35.00 ± 2.45 c
Values are given as mean ± standard error; different letters represent significant differences between treatments (p < 0.05). AN: available nitrogen; AP: available phosphorous; TP: total phosphorus, TN: total nitrogen, SOC: soil organic carbon; SWC: Soil Water Content.
Table 4. Microbial diversity indices of the three different wetlands, based on PLFA data.
Diversity IndexPermanently Flooded WetlandsNon-Flooded WetlandsSeasonally
Flooded Wetlands
Shannon-Wiener (H)3.05 ± 0.04 a2.12 ± 0.09 b3.02 ± 0.07 a
Simpson (D)0.93 ± 0.00 a0.71 ± 0.03 b0.93 ± 0.01 a
Margalef (M)4.79 ± 0.27 a3.38 ± 0.23 b4.94 ± 0.11 a
Menhinick (E)0.39 ± 0.02 a0.27 ± 0.04 b0.42 ± 0.02 a
Brillouin (B)3.02 ± 0.04 a2.10 ± 0.09 b2.99 ± 0.07 a
Different letters in the same row indicate significant differences between different wetland types (p < 0.05).
Table 5. Correlation between microbial diversity indices and soil physicochemical properties.
Diversity IndexpHTPAPTNANSOCSWC
Shannon-Wiener (H)0.212−0.959 **−0.913 **0.072−0.432−0.1180.864 **
Simpson (D)0.188−0.964 **−0.901 **0.080−0.427−0.1070.855 **
Margalef (M)0.134−0.935 **−0.940 **0.157−0.320−0.2280.791 *
Menhinick (E)−0.063−0.871 **−0.790 *0.298−0.271−0.2820.682 *
Brillouin (B)0.215−0.959 **−0.914 **0.069−0.433−0.1160.866 **
Statistical significance is given as * p < 0.05, ** p < 0.01. AN: available nitrogen, AP: available phosphorous, TP: total phosphorus, TN: total nitrogen, SOC: soil organic carbon, SWC: Soil Water Content.
Publisher’s Note: MDPI stays neutral with regard to jurisdictional claims in published maps and institutional affiliations.

