Article

Toward Feeds for Circular Multitrophic Food Production Systems: Holistically Evaluating Growth Performance and Nutrient Excretion of African Catfish Fed Fish Meal-Free Diets in Comparison to Nile Tilapia

1
Department of Fish Biology, Fisheries and Aquaculture, Leibniz Institute of Freshwater Ecology and Inland Fisheries, Müggelseedamm 310, 12587 Berlin, Germany
2
Albrecht Daniel Thaer Institute of Agricultural and Horticultural Sciences, Faculty of Life Sciences, Humboldt University Berlin, 10115 Berlin, Germany
3
Institute of Biology, Faculty of Life Sciences, Humboldt University Berlin, 10115 Berlin, Germany
*
Author to whom correspondence should be addressed.
Sustainability 2022, 14(21), 14252; https://doi.org/10.3390/su142114252
Submission received: 16 September 2022 / Revised: 24 October 2022 / Accepted: 26 October 2022 / Published: 1 November 2022

Abstract

:
In aquaponics and circular multitrophic food production systems, dietary protein source, as well as fish species choice, particularly in cases of different nutritional physiology, could be factors affecting excreted nutrient profiles. Accordingly, growth performance, dissolved nutrient accumulation and feces nutrient profiles were evaluated for African catfish (Clarias gariepinus) reared in recirculating aquaculture systems (RAS) and fed single protein source diets based on black soldier fly larvae meal (BSF), poultry by-product meal (PM), poultry blood meal (PBM) and fish meal (FM) and the results were compared to previous findings for Nile tilapia (Oreochromis niloticus). All diets resulted in significantly different growth performances of African catfish, with FM producing the best growth performance, followed by PM, BSF and PBM. PM resulted in the highest soluble reactive phosphorus concentrations (SRP) in the RAS water; whereas, BSF resulted in the highest K, Mg and Cu concentrations. The highest feces nutrient density was recorded for PBM; whereas, FM and PM yielded the lowest feces nutrient density. Comparing African catfish to Nile tilapia revealed that the former showed significantly better growth performance with FM and PM, however, significantly weaker performance with BSF. Although dissolved K accumulation was similar between species across diets, significant differences were recorded for total inorganic nitrogen and SRP production per unit of feed for individual diets. Despite similar feces nutrient profiles, African catfish produce significantly less feces dry matter per unit of feed for each diet compared to Nile tilapia. Findings are discussed regarding their implications for aquafeed development in the context of circular multitrophic food production systems.

1. Introduction

Recirculating aquaculture systems (RAS) represent a technology that allows for intensive farming practices with comparably low requirements for water and space per unit of production while having the potential to internalize some of the negative externalities associated with other forms of aquaculture [1,2,3,4] and thus embody the concept of sustainable intensification [5,6]. By making use of the nutrient-rich RAS water, aquaponic systems [7,8,9,10] can be viewed as the natural evolution of RAS. They increase the productive value of the initially introduced nutrients (the fish feed) by making nutrients excreted by the fish available to plant production as encouraged by the principles of the circular bioeconomy [11,12] and the value pyramid of the bio-based economy [11,13]. However, although aquaponic systems optimize the use of valuable input nutrients, a higher degree of nutrient recycling and eventually true circularity could be achieved by introducing a third trophic production level in the form of insect larvae such as black soldier fly larvae (Hermetia illucens). As upcycling agents, larvae could transform fish feces and harvest waste from plant production into higher value proteins and lipids that can then be reintroduced into the trophic cascade as an ingredient of the fish feed [14]. This specific integration of fish, plant and insect larvae cultivation into a single water, energy and nutrient efficient circular multitrophic food production system (CMFS) [14,15] may present a further step toward the development of intensive yet sustainable food production systems.
Nevertheless, the principles of cascading and circularity have to extend beyond production system internal matters and pertain to the nutrient inputs into the system as well. As one of the main nutrient inputs into a CMFS, as specified above, the fish feed provides the nutritional basis for fish and, subsequently, plants and insect larvae in the form of the dissolved and solid nutrients excreted by the fish. Therefore, the fish feed should also be investigated as one of the primary sources of nutrition for all three trophic production levels. In a previous study [15], the concept of holistically evaluating fish feeds based on sustainable protein sources of the circular bioeconomy was introduced in the context of CMFSs. This concept suggests comparing the growth performance of fish reared in RAS between diets alongside the nutritional quality and quantity of their solid and dissolved nutrient excretion with regard to downstream plant and insect larvae production. In the above study, Nile tilapia (Oreochromis niloticus) were used as the model species since they are the most commonly reared species in aquaponic systems [16,17,18,19] due to their sturdy and fast-growing nature, their ability to thrive at high rearing densities and their capacity to tolerate a wide range of water qualities with elevated levels of dissolved nutrients and suspended solids [20,21]. However, with the great diversity of cultured fish species, not only the effect of protein ingredient choice and dietary composition is of interest when it comes to fish performance and nutrient excretion, but also how fish species with different nutritional physiologies compare in terms of the nutrient profiles and quantities made available to the lower trophic production levels in multitrophic systems. African catfish (Clarias gariepinus), a promising species for intensive aquaculture [22,23,24,25,26], have received increased attention as a species for aquaponics [27,28,29,30,31,32,33,34,35,36,37], not least due to its fast growth and good feed conversion [23,38,39,40,41,42], air-breathing capability [43], ability to be reared at high densities [39,44,45] and tolerance of suboptimal water quality [46,47,48,49]. Compared to the Nile tilapia, which is considered herbivorous-omnivorous [50,51,52], the African catfish is more carnivorous in feeding habit [53,54,55]. This is also reflected in morphological, histological and chemical differences in the gastrointestinal tracts of the two species [56,57,58]. Since nutrient and mineral absorption (and thus perhaps excretion) are influenced by species-specific nutritional physiology and diet composition [59,60,61,62], differences between species might be expected.
In this sense, the purpose of this study was to (1) determine the performance of African catfish when entirely replacing fish meal (FM), respectively, with black soldier fly larvae meal (BSFM), poultry by-product meal (PM) and poultry blood meal (PBM) in single protein source diets; (2) compare the dissolved nutrient profiles developing in the RAS water between diets to judge the potential of the protein sources to be used in tailored aquaponic feeds that improve these dissolved nutrient profiles for plants; (3) to evaluate the quantity and nutritional quality of the fish feces as an internal raw material of a CMFS [14,15]; and (4) analyze key results in comparison to the prior findings for Nile tilapia as a species with a different nutritional physiology than African catfish.

2. Materials and Methods

The experimental concept introduced in detail in [15] for Nile tilapia was performed with African catfish as another suitable candidate species for aquaponic and multitrophic systems and the trial in this study was conducted accordingly. Materials and methods are again summarized below. For further details on the experimental diets (e.g., ingredient origin), RAS design and experimental procedure, please refer to [15].

2.1. Experimental Design

Four experimental diets, i.e., a fish meal-based diet (FM), a black soldier fly larvae meal-based diet (BSF), a poultry blood meal-based diet (PBM), and poultry by-product meal-based diet (PM), were formulated and extruded at SPAROS I&D, Olhão, Portugal, (SPAROS) to be isonitrogenous (40% crude protein) and isocaloric (20 MJ/kg) with a crude fat content of 12%. The diets incorporated fish meal (positive control), black soldier fly larvae meal, poultry blood meal, and poultry by-product meal as the single main protein source, respectively, and upon arrival at the Leibniz Institute of Freshwater Ecology and Inland Fisheries (IGB) in Berlin, Germany, they were stored at −20 °C until use. Table 1 summarizes diet formulation, proximate composition, as well as essential amino acid and mineral composition.
The experimental systems consisted of 16 rectangular glass tanks with an operational water volume of 160 L that were designed as independent recirculating aquaculture systems (RAS), each being divided into four sections by perforated PVC boards in this order: a fish rearing compartment (64 L), two fixed-bed biofilter compartments (32 L each) equipped with 10 cm thick aquarium filter sponges and a moving-bed bioreactor (MBBR) compartment (32 L) including a heater. Water recirculation was ensured by an air lift, transporting the water from the MBBR to the fish rearing section. Four weeks before the start of the trial, biofilters were matured and synchronized by running the entire 16 tanks over a shared pump sump with a separate batch of Nile tilapia. The day before initiation of the trial, tanks were emptied, cleaned and refilled with pre-heated tap water (26 °C) and subsequently operated separately via the use of the individual air lifts.
Thirty mixed-sex African catfish fry, acquired from Nutrition and Food Part of Bio-energie Lüchow GmbH & Co. KG, Altkalen, Germany, and reared on a standard catfish diet in a flow-through system at 26 °C prior to the trial, were individually measured (initial total length: 11.9 ± 0.5 cm), weighed (initial body weight: 11.4 ± 1.4 g) and randomly allocated to each of the 16 experimental RAS. Fish were not fed for 48 h before transfer. Total trial duration was 49 days, and each dietary treatment was replicated in four randomly defined tanks (n = 4). Dead fish were removed from the tanks, and mortality was recorded. Fish were hand-fed twice per day at a daily ration 2.5% of the initial biomass. Biomass was redetermined per tank at the end of the second and fourth week and the daily ration was adjusted according to the mean biomass of all 16 tanks. At the end of the experiment, fish were again weighed and measured individually. In total, 578 g of feed were fed per tank.
A daily water exchange of 5% (8 L) was performed by siphoning the water including the fish feces from the sedimentation chambers. The feces were collected daily by filtering the water through 90 µm nylon mesh and were subsequently stored at −80 °C. The removed water was replenished by pre-heated (26 °C) tap water.
Oxygen, pH, temperature (HQ40d, Hach Lange, Berlin, Germany), and electrical conductivity (pH/Cond 740i, WTW, Weilheim in Oberbayern, Germany) were measured daily prior to feeding and water exchange in the fish rearing sections. On a weekly basis, starting from day 1, the RAS water (rearing section) and the tap water were sampled for dissolved nutrient analysis. The trial was conducted at the IGB in Berlin, Germany, from September to November 2021.

2.2. Sample Preparation and Chemical Analysis

Experimental diets and feces were analyzed for proximate composition (dry matter (DM), crude protein (CP), crude fat (CF), crude fiber (CFB), starch, ash) and amino acid composition at SGS Analytics Germany (Augsburg, Germany) according to official standard methods [64,65,66,67]. The Kjeldahl method [65] was used to determine CP in the diets, while the Dumas method was used for the feces [64]. The CP of the diets was determined with the Dumas method as well as for CP recovery calculations. Diets and feces were further analyzed for mineral composition. Samples were freeze-dried, homogenized in a mortar under liquid nitrogen and re-dried until achieving constant weight. For analysis, 150 mg of dry sample were microwave-digested in aqua regia according to DIN EN 16174 [68] with a ratio of HCL to HNO3 of 1:3 and then analyzed for Ca, P, S, Mg, Fe, Na, K, Al, Zn, Mn and Cu according to DIN EN ISO 11885 [69] by inductively coupled plasma optical emission spectrometry (ICP-OES) (iCAP 7400 ICP-OES, Thermo Fisher Scientific, Waltham, MA, USA). Water samples (15 mL) were filtered (0.45 µm, Sartorius, Göttingen, Germany) and fixed with 150 µL 2M HCl. NH4-N, NO2-N, NO3-N (as a sum referred to as total inorganic nitrogen—TIN) and PO4-P (soluble reactive phosphorus—SRP) were measured with continuous flow analysis (CFA) (FSR Seal High-Resolution AA3 chemical analyzer, Seal Analytical, Norderstedt, Germany). B, Na, Mg, Si, S, K, Ca, Mn, Fe, Cu, and Zn were determined by inductively coupled plasma optical emission spectrometry (ICP-OES) (iCAP 7400 ICP-OES, Thermo Fisher Scientific, Waltham, MA, USA) [69].

2.3. Calculations

The formulas for calculating nitrogen-free extract (NFE), gross energy (GE), and protein-to-energy ratio (P/E ratio) of the diets and the feces as well as for the fish performance indicators body weight gain (BWG), total length gain (LG), feed conversion ratio (FCR), specific growth rate (SGR), condition factor (CF), protein efficiency ratio (PER), thermal growth coefficient (TGC), and mean daily ration (MDR) are given as footnotes under the respective tables. FCR and PER were calculated on the basis of the average total amount that each individual remaining at the end of the trial has received, i.e., the sum of the average daily individual feed ration in case of FCR and CP ration in case of PER. This was done to rule out a potentially distorting effect of mortality between tanks which in any case was low due to similarly high survival rates. Feed ingredient costs are calculated as EUR per kg of body weight gain and are based on the ingredient prices paid by SPAROS excluding production and transaction costs. Recovery of DM, macronutrients, and GE through feces collection is expressed as percentage of the respective component administered to the fish by feeding over the duration of the entire trial and further as recovery per kg of feed (as fed).
In order to directly compare the results obtained with African catfish on the accumulation of dissolved TIN, SRP and K in the RAS water to the prior trial with Nile tilapia, concentrations were recalculated to mg dissolved nutrient produced per g of feed input (as fed) to account for differing feed rations and tap water concentrations between the trials. This was done by subtracting the nutrient load in the RAS at the start of the trial (originating from tap water) and the load introduced through daily tap water replenishment over a specific period of time from the final nutrient load at the end of this time period and adding the load that was concomitantly removed from the RAS through water exchange. The nutrient load from tap water was calculated by multiplying the mean concentration in the tap water over the entire trial by the volume introduced over the time period in question. The nutrient load from RAS water removal was calculated on a weekly basis according to the mean concentrations between sampling days and the corresponding water volume introduced over the period in question. Finally, the produced nutrient load was divided by the amount of feed that was administered over the period in question.

2.4. Statistical Analysis

All data are presented as mean ± standard deviation. Differences in the means between dietary treatments were determined by a one-way analysis of variance (ANOVA), followed by a Bonferroni post hoc test for multiple comparisons or, in case of a significant Leven’s test, a Games–Howell post hoc test. Independent samples t-tests were performed for the comparison of growth performance, dissolved nutrient accumulation and feces nutrient recovery between species. Statistical significance was set at p < 0.05. All statistical analyses were performed using IBM SPSS.

3. Results

3.1. Fish Rearing and Performance

Rearing conditions were suitable for rearing African catfish and homogeneous within a practically achievable range between tanks and treatments (Table 2). Temperature and oxygen concentration were consistent while electrical conductivity and pH stayed within reasonable ranges. Ammonium and nitrite concentrations remained at uncritical levels. With a daily system water exchange rate of 5%, the final water exchange reached 507 L/kg feed/day.
Survival, initial body weight, initial total length and initial biomass did not differ significantly between dietary treatments (Table 3). Fish fed the FM diet showed significantly better growth and feed conversion performance compared to fish fed the other experimental diets across almost all recorded measures. Only final body weight and total length were not significantly different compared to fish fed the PM diet, which in turn produced significantly better fish performance versus the BSF and PBM diet across all measures. Fish fed the PBM diet showed the significantly lowest growth and feed conversion performance regarding all indices except for final total length, which was non-significantly different compared to fish fed the BSF diet. The CF at the end of the trial was similar between the FM, BSF and PM groups and differences were non-significant, whereas the PBM diet resulted in a significantly lower CF in comparison to the FM and BSF diet. Since the same quantity of feed was fed in the treatments throughout the trial, the faster growth of fish fed the FM and PM diet resulted in a significantly lower MDR as a percentage of biomass compared to the other two dietary treatments which among each other also differed significantly with the PBM group receiving the overall highest MDR. Finally, feed ingredient costs (EUR per kg of body weight gain) were the lowest for the PM diet followed by the FM diet, PBM diet and lastly, as the most expensive, the BSF diet, with all costs differing significantly from each other.

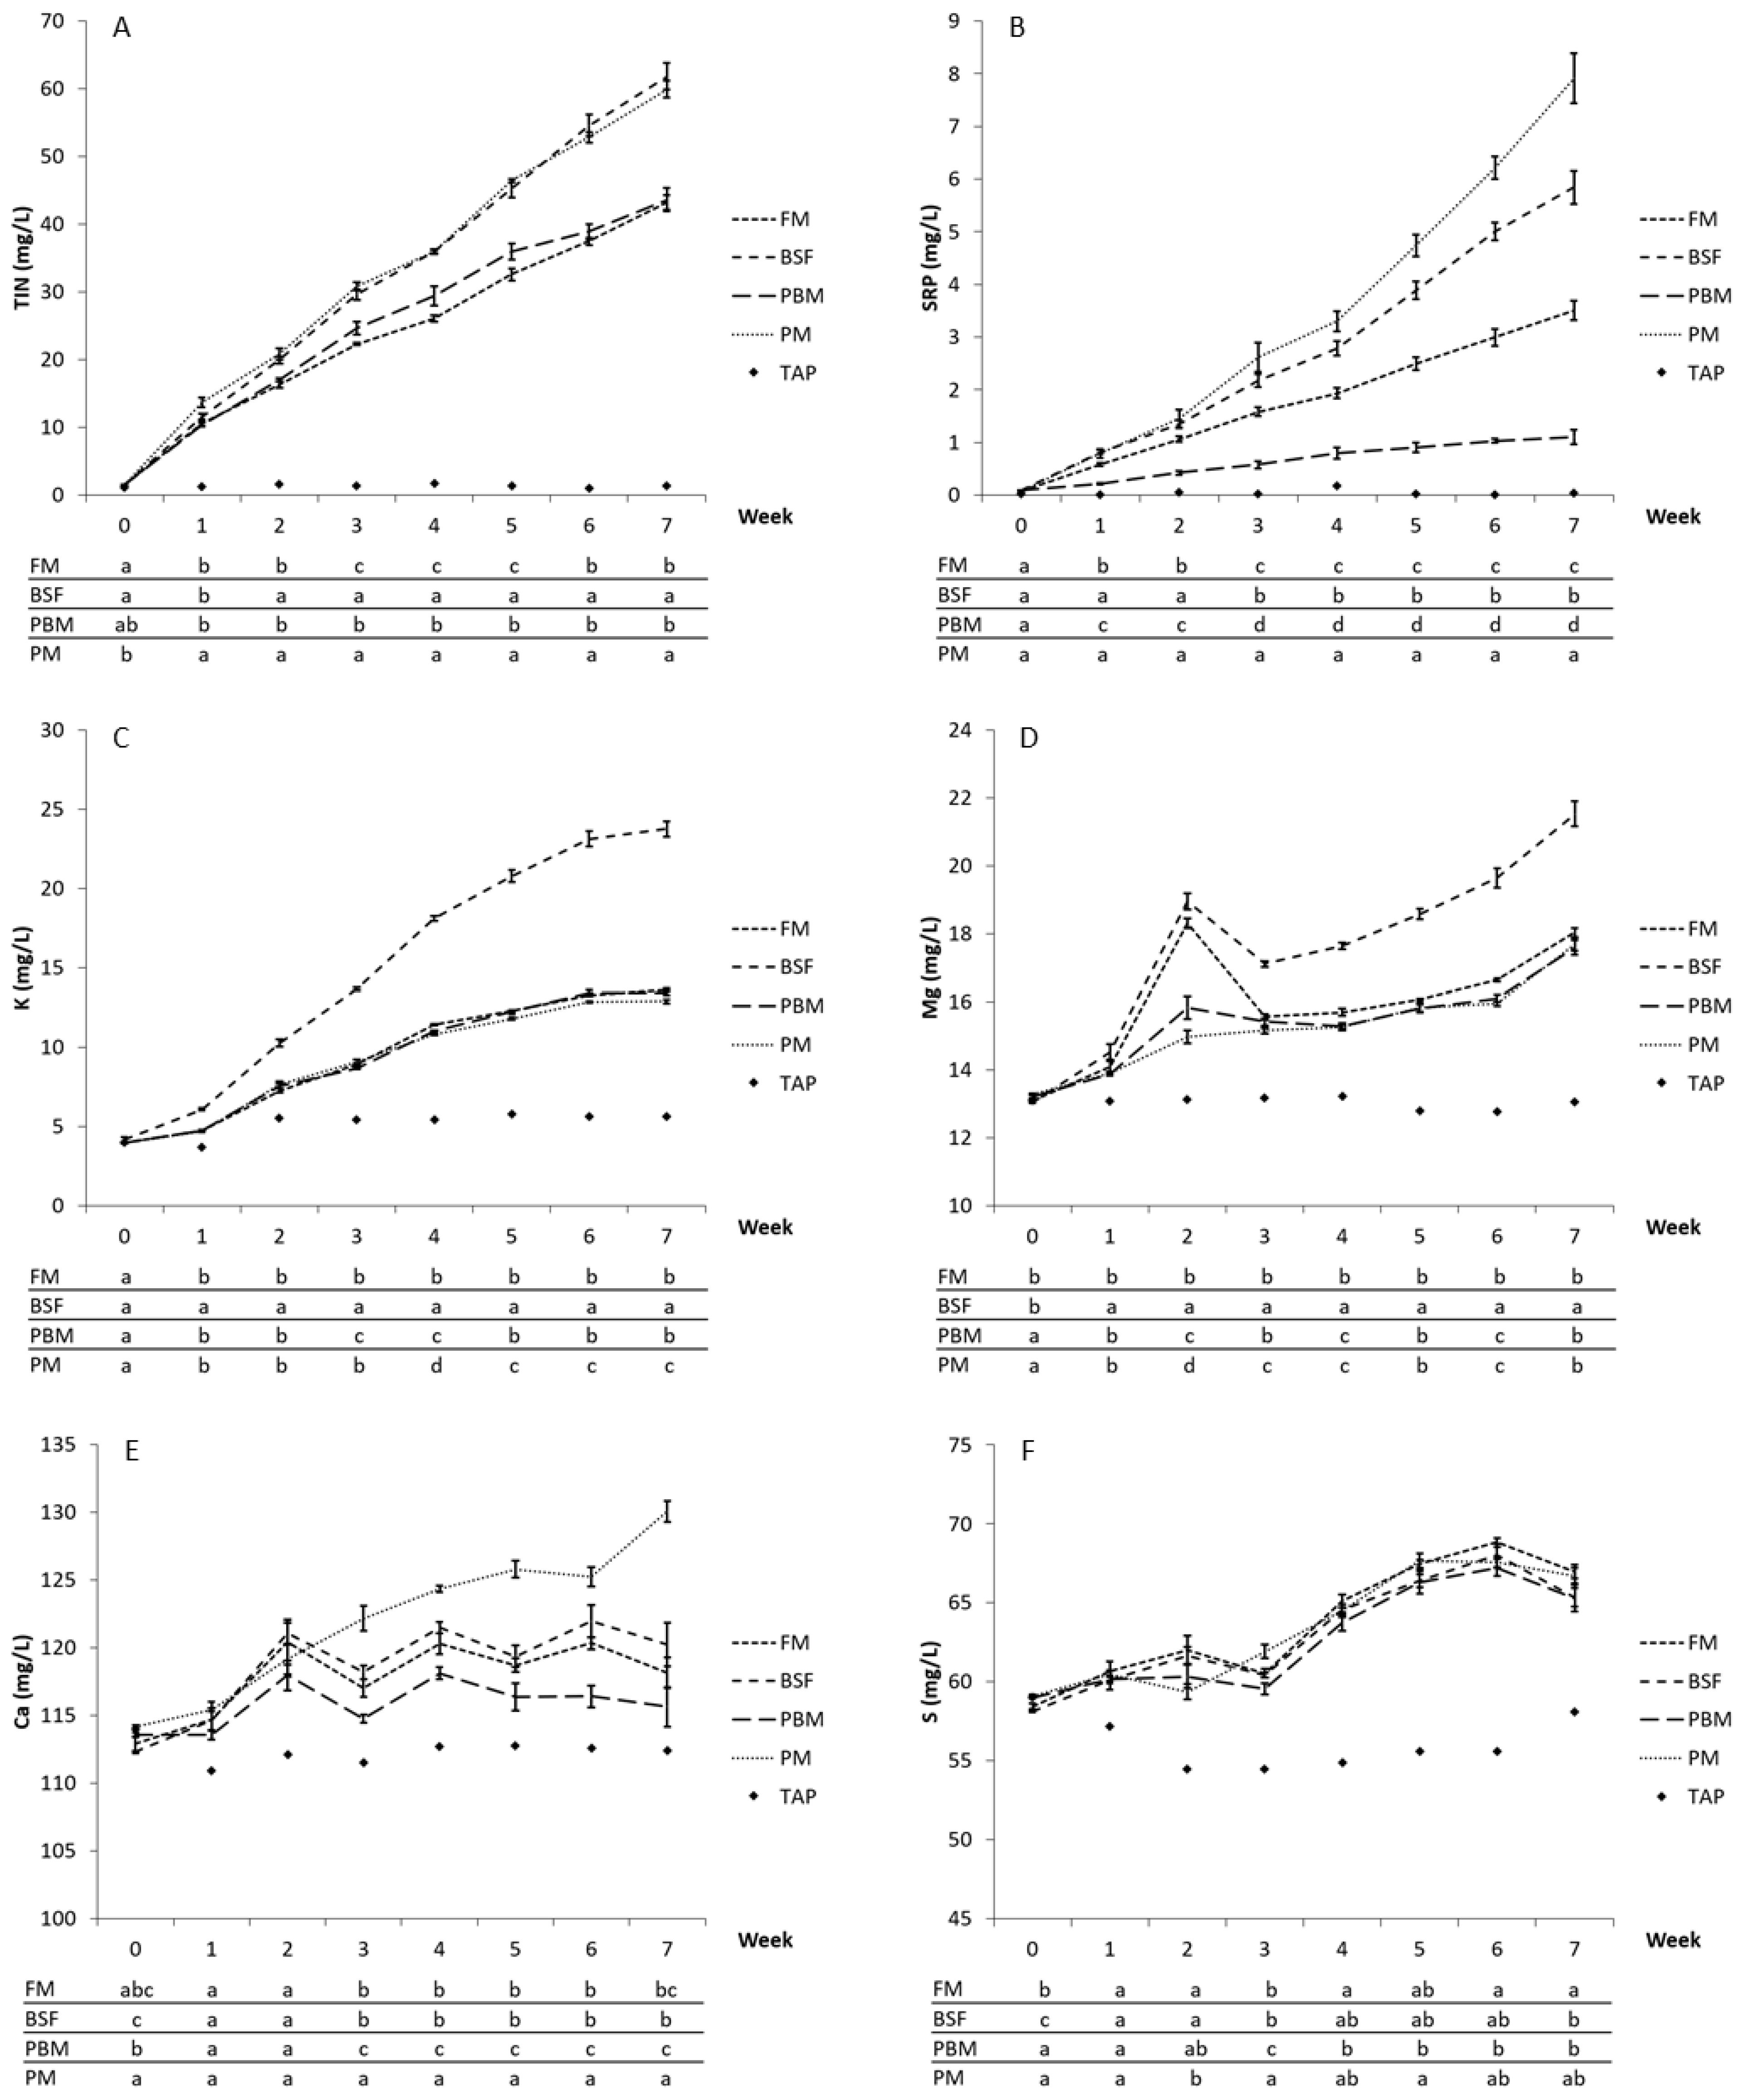
3.2. Water—Dissolved Nutrient Excretion Patterns

A consistent accumulation of the dissolved plant macronutrients TIN, SRP, K and Mg in the RAS water was observed for all diets, whereas comparably little to no accumulation was recorded for S and Ca (Figure 1). The PM and the BSF diet resulted in the fastest accumulation and highest final concentrations of TIN and SRP, reaching mean concentrations of 60 and 61.8 mg/L TIN and 7.9 and 5.8 mg/L SRP, respectively, compared to 43.3 and 43.6 mg/L TIN and 3.5 and 1.1 mg/L SRP for the FM and PBM diet, respectively. Differences for the PM and BSF diet were significant from week 2 for TIN and week 1 for SRP until the end of the trial compared to the FM and PBM diet. Although TIN concentrations differed non-significantly between the PM and BSF diet, the PM diet did result in significantly higher SRP concentrations from week 3 onward in contrast to the BSF diet. Differences in terms of TIN concentration were minor between the FM and PBM diet and only partly significant midway through the trial, whereas the PBM diet produced considerably and significantly lower SRP concentrations versus the FM diet from week 1 onward. With regard to Mg and especially K, the BSF diet produced the consistently and significantly highest values with final mean concentrations of 21.5 mg/L Mg and 23.8 mg/L K compared to the FM (18 mg/L Mg/13.6 mg/L K), PM (17.7 mg/L Mg/13 mg/L K) and PBM diet (17.6 mg/L Mg/13.4 mg/L K) which, while partly significant among each other, resulted in only minor absolute concentration differences. Although slightly above tap water concentrations for the most part, Ca and S concentrations were primarily influenced by the tap water (exchange water) with no clear pattern or meaningful differences emerging between the diets for the most part. A slight decoupling with significantly higher Ca concentrations from week 3 onward was observed for the PM diet compared to the other diets, whereas the PBM showed the significantly lowest Ca concentrations from week 3 until week 6.
By and large, there were little to no accumulative trends observed for the plant micronutrients B, Fe, Na, Cu, Mn or Zn (Figure 2). Concentrations generally remained near or at times even below tap water concentrations with differences between diets, although at times significant, being mostly marginal for B, Na and Mn with no clear differentiating pattern between diets emerging with respect to these nutrients. Notably, the BSF diet was the only diet that produced a clear increase in Cu and, from week 6 onward, Zn up and above tap water concentrations and differences in comparison to the other diets were significant from week 1 and week 2 onward, respectively. On the contrary, no clear pattern of significance was observed for the other diets with concentrations for Cu and Zn being largely below tap water levels. The PBM and the BSF diet produced slightly higher Fe concentrations than found in the tap water and the PBM diet produced significantly higher concentrations than the BSF diet from week 2 onward. The PM and FM diet, which among each other showed no significant differences in their Fe concentrations, never exceeded tap water Fe levels.

3.3. Feces—Solid Nutrient Excretion Patterns

3.3.1. Proximate Composition and Nutrient Recovery

Proximate composition analysis revealed that fish fed the FM and PM diets produced feces that were similar to each other in several regards on a dry matter basis with CP, CF, starch and P/E ratio showing no significant differences (Table 4). Nevertheless, the PM feces had a slightly yet significantly higher content of CFB, NFE and GE compared to the FM feces. However, the FM feces showed a significantly and considerably higher ash content compared to the PM feces, both nevertheless being significantly higher in ash content than the BSF and PBM feces. Furthermore, the FM and the PM feces both had a significantly lower CP and GE content as well as PE ratio compared to the BSF and PBM feces while having a significantly higher NFE content.
In contrast, the PBM feces showed the overall significantly highest values with respect to CP and GE content as well as PE ratio, whereas its CF, CFB and ash contents were significantly lower compared to the other feces types. The lowest starch and NFE contents were also recorded for the PBM feces, but starch content was only significantly lower compared to the BSF feces and NFE content only compared to the FM and PM feces. The BSF feces recorded the significantly highest CF, CFB and starch contents among all feces types and occupied the mid-range in terms of CP and GE content as well as PE ratio which all were significantly higher compared to the FM and PM feces.
The daily collection of feces added up to the significantly highest recovery of feces DM for the PBM diet, whereas the FM diet, the PM diet and the BSF diet occupied a similar range with only the DM recovery for the PM diet significantly below recovery for the BSF diet (Table 5). Measured as a percentage of the total amount of the respective component fed throughout the trial (i.e., DM, GE, CP, CF, etc.), the FM and PM treatments resulted in the lowest recovery values for DM, CP, CF and GE, differences among each other being non-significant except for CP, whereas differences compared to the other diets were significant except for DM between FM and BSF and for CF between PM and PBM (Table 5A). Expressed as recovery per kg of feed (as fed), the FM and PM diet also recorded for the most part the significantly lowest values for DM, CP, CF and GE as well as CFB and starch compared to the other diets, whereas the recovery of ash for the FM and PM diet was significantly higher in comparison, with ash recovery for the FM diet significantly higher than for the PM diet (Table 5B).
In comparison to the FM and PM diet, the BSF diet resulted in a significantly higher percentage recovery of CP, CF and GE as well as recovery per kg of feed of CP, CF, GE, CFB. Although the BSF diet accounted for the significantly highest CFB recovery per kg of feed of all diets, CFB recovery as a percentage of the originally fed CFB was the significantly lowest. Furthermore, the BSF diet yielded the significantly lowest values for NFE regarding both of the recovery measures. Finally, the highest recovery values were recorded for the PBM diet which made for the significantly highest percentage recovery of DM, CP, ash, GE through feces collection while also resulting in the significantly highest per kg of feed recovery of DM, CP, GE and NFE.

3.3.2. Minerals and Amino Acids

With regard to all measured amino acids except for leucine, the PBM feces showed the significantly and for the most part substantially highest contents and, subsequently, the significantly highest sums of EAAs and NEAAs compared to the other feces types. Aside from Arg, Met and Gly, the BSF feces featured a significantly higher content of all AAs compared to the FM and PM feces and also a significantly higher sum of EAAs, as well as the sum of NEAAs compared to both. Accordingly, the FM and PM feces showed the significantly lowest content for almost all AAs among the feces types.
The amino acid profile of the FM and PM feces was comparatively similar with non-significant differences in the EAAs Arg, Lys, Phe and Trp and the NEAAs Ala, Asp+Asn, Glu+Gln and Tyr, as well as a non-significant difference in the sum of EAAs. However, compared to the FM feces, the PM feces had a significantly higher content of the EAAs Ile, Leu, Thr, Val and the NEAAs Cys, Gly, Pro and Ser, as well as a significantly higher sum of NEAAs. Only the His and Met content was significantly higher in the FM feces versus the PM feces. Met content in the FM feces was also significantly higher than found in the BSF feces, while Arg and Cys did not differ significantly between these two feces types.
In terms of the mineral content, the most prevalent constituents of all four feces types were Ca and P. Ca content in the FM, PM and BSF feces was particularly dominant, amounting to more than twice the P content. Unlike the high AA content found in the PBM feces, this feces type had the overall lowest mineral content in the DM with significantly lower levels of Ca, P, Mg, Na, K, Al, Zn, Mn and Cu in comparison to all other feces types. However, S and Fe content was in fact the significantly highest in the PBM feces. While the FM feces shared some similarity with the PM feces with non-significant differences in S, Zn and Cu, it did show the overall significantly highest Ca, P, Mg, Na, K and Al content. Nonetheless, the PM feces featured a significantly higher Ca, P and Na content compared to the BSF feces, which on the contrary had a significantly higher Fe, K and Al content compared to the PM feces, as well as the significantly highest Zn and Mn content of all feces types. S, Mg and Cu, however, did not differ significantly between the PM and BSF feces.

3.4. Comparison between African Catfish and Nile Tilapia

3.4.1. Growth Performance

Initial body weight of the two species at the beginning of the respective trials was similar and non-significantly different within dietary treatments (Figure 3). African catfish (AC) and Nile tilapia (NT) both showed the best growth when fed the FM and PM diet. Nevertheless, African catfish performed better concerning all measures when fed the FM and PM diet, achieving significantly higher final body weights (AC: FM—38.02 g/PM—34.82 g; AC: FM—31.81 g/PM—30.88 g) and BWGs (AC: FM—26.38 g/PM—23.69 g; NT: FM—20.61 g/PM—19.65 g), significantly higher SGRs (AC: FM—2.42/PM—2.33; NT: FM—2.12/PM—2.05) and PERs (AC:FM—3.4/PM—2.81; NT: FM—2.88/PM—2.47), as well as significantly lower FCRs (as fed) (AC: FM—0.73/PM—0.81; NT: FM—0.86/PM—0.92) for these two diets compared to Nile tilapia.
In contrast, however, Nile tilapia performed better than African catfish when fed the BSF diet with a significantly higher final body weight (AC: 24.77 g; NT: 26.67 g), BWG (AC: 13.25 g; NT: 15.44 g), SGR (AC: 1.56; NT: 1.76) and PER (AC: 1.71; NT: 2.23), as well as a significantly lower FCR (AC: 1.45; NT: 1.11). The PBM diet resulted in the worst growth performance of both fish species which in comparison showed more similarity in performance for this diet in contrast to the other diets. Although the African catfish reached a slightly yet significantly higher BWG (AC: 10.96; NT: 9.96 g) and SGR (AC: 1.39; NT: 1.30), no significant differences were detected for final body weight (AC: 22.17 g; NT: 21.1 g), FCR (AC: 1.76; NT: 1.79) and PER (AC: 1.39; NT: 1.37) between the two species when fed the PBM diet.

3.4.2. Production of Dissolved Plant Macronutrients per g of Feed—TIN, SRP and K

As described previously, results for the concentrations of dissolved TIN, SRP and K were normalized to account for the unequal total feed rations, tap water nutrient concentrations and initial dissolved nutrient loads in the RAS to obtain a measure of mg dissolved TIN, SRP and K produced per g of feed input (as fed) that is comparable between species. In terms of TIN produced per g of feed input, calculated cumulatively for the entire trial, values ranged between a minimum of 23.6 mg/g (AC—PBM) and a maximum of 43 mg/g (NT—PM), whereas the minimum for K was calculated at 5.2 mg/g (AC—PM) and the maximum at 11.9 mg/g (NT—BSF) (Figure 4). For SRP, the lowest value came in at 0.7 mg/g (AC—PBM) and the highest value at 4.2 mg/g (AC—PM). From the early to mid-stages up to the end of the trial, TIN production was significantly higher for Nile tilapia than for African catfish for the FM diet (AC: 26.1 mg/g; NT: 35.8 mg/g) and the PM diet (AC: 36.5 mg/g; NT: 43 mg/g). This was the opposite for TIN produced with the PBM diet (AC: 27.2 mg/g; NT: 23.6 mg/g), although differences, despite being entirely non-significant, were smaller between species compared to the FM and PM diet. The BSF diet resulted in very similar and from week 2 onward non-significantly different TIN production for both species (AC: 36.8 mg/g; NT: 37.1 mg/g).
The lowest SRP production per g of feed was recorded in both species for the PBM diet and differences were entirely non-significant (AC: 0.67 mg/g; NT: 0.77 mg/g). The largest differences in SRP production between species were found for the BSF diet, with African catfish producing significantly more dissolved SRP per g of feed over the course of the trial (AC: 3.3 mg/g; NT: 1.8 mg/g). Although not as clear in the earlier stages of the trials, African catfish also produced increasingly and significantly more SRP than Nile tilapia when fed the PM diet as the trials progressed (AC: 4.2 mg/g; NT: 3.1 mg/g). For the FM diet, however, Nile tilapia reached significantly higher SRP production values with the only exception being the period of the first three weeks of the trial over which the difference was non-significant. Both species showed a slight upward trend in cumulative SRP production for the FM, PM and BSF diet in the latter half of the trial, whereas this was neither the case for TIN nor for K which both showed a more stable trajectory, or in the case of TIN, perhaps even a slight decline.
In contrast to TIN and SRP, K production per g of feed was similar between species for all diets and the overall range reached for the FM (AC: 5.5 mg/g; NT: 6.6 mg/g), PM (5.2 mg/g; NT: 5.7 mg/g) and PBM diet (AC: 5.4 mg/g; NT: 5.3 mg/g was also similar. However, for both species, the BSF diet resulted in a considerably higher K production (AC: 11.8 mg/g; NT: 11.9 mg/g) which, at the end of the trial, was non-significantly different between species. For the PBM diet, no significant differences were detected for K production between species except for the first week of the trial. Even though absolute differences in K production between species for the FM and PM diet were comparably small, Nile tilapia did show a significantly higher K production at the end of the trial for these two diets.

3.4.3. Feces Nutrient Composition and DM Recovery

Proximate and summed AA composition of the feces DM were roughly similar between African catfish and Nile tilapia in absolute terms, especially when fed the FM and PBM diet (Figure 5). Differences in the PBM feces between species regarding all nutrients were non-significant except for ash content, which was significantly higher in the Nile tilapia feces (AC: 5.25% DM; NT: 6.18% DM). The only significant differences with regard to the FM feces were detected for EAA (AC: 4.68% DM; NT: 4.29% DM) and starch content (AC: 1.98% DM; NT: 1.50% DM) which were both higher in the African catfish feces, though differences were small in absolute terms.
Greater differences were detected for the PM and BSF feces. Concerning the PM feces, all differences between species were significant except for CF (AC: 3.7% DM; NT: 3.05% DM), with CP (AC: 14.85% DM; NT: 17.23% DM), total AA (AC: 12.23% DM; NT: 14.47% DM), EAA (AC: 5.46% DM; NT: 6% DM), NEAA (AC: 6.77% DM; NT: 8.46% DM), and ash content (AC: 14.65% DM; NT: 21.40% DM) significantly higher in the Nile tilapia feces, while the African catfish feces only showed a significantly higher content of CFB (AC: 17.33% DM; NT: 14.33% DM), starch (AC: 2.28% DM; NT: 1.5% DM) and NFE (AC: 49.48% DM; NT: 44% DM). In terms of the BSF feces, almost all differences between species were significant with ash (AC: 9.68% DM; NT: 10.48% DM) being the exception. In contrast to the PM feces, the African catfish BSF feces showed higher nutrient density this time with significantly higher CP (AC: 28.1% DM; NT: 26.58% DM), total AA (AC: 15.53% DM; NT: 11.92% DM), EAA (AC: 7.64% DM; NT: 5.47% DM), NEAA (AC: 7.89% DM; NT: 6.45% DM), CF (AC: 4.95% DM; NT: 2.78% DM), starch (AC: 3.4% DM; NT: 2.5% DM) and NFE content (AC: 30.65% DM; NT: 26.28% DM) than in the Nile tilapia BSF feces. CFB content (AC: 26.63% DM; NT: 33.90% DM), however, was significantly lower in the African catfish feces. Although the feces for all diets were similar between species in terms of their nutrient composition apart from the differences outlined above, significantly less feces DM was collected in African catfish per kg of feed for all diets (FM: AC—134.43 g/kg/NT—162.31 g/kg; PM: AC—119.5 g/kg/NT—167.39 g/kg; BSF: AC—140.03 g/kg/NT—154.39 g/kg; PBM: AC—257.66 g/kg/NT—310.42 g/kg).

4. Discussion

4.1. Fish Performance

Against the background of the highly conceptual nature of the fishmeal-devoid, single protein source experimental diets, almost all relevant fish performance indicators point toward clear differences in the suitability of the chosen protein sources in support of growth in African catfish.
Poultry by-product meal is a valuable and widely used protein source in aquafeeds due to its high protein content, balanced amino acid profile and ample mineral content [71,72,73] and can successfully replace up to 50–100% of fish meal in diets for a variety of freshwater fish species [74]. Considering that 100% of the FM was replaced in the present study and diets only incorporated a single main protein ingredient at high absolute inclusion levels, the PM diet held up fairly well against the FM control diet, especially in comparison to the BSF and the PBM diet, and results are in general agreement with [74]. Although for the most part, fish performed significantly better when fed the FM diet, differences in final body weight and length were in fact non-significant. Results from other trials on PM in diets for African catfish are mostly in line with the results of the present study. Authors testing up to 100% FM replacement with PM at an absolute level of PM inclusion of 6–47% (versus 56.4% in this study) generally recorded growth reduction and feed conversion impairment at the highest replacement levels in comparison to their control diets [75,76,77,78,79,80,81,82] and recommend FM replacement levels of 65% (30.6% PM inclusion) [82], 56% [80], 40% (17% PM inclusion) [78] and 30% (6.3% PM inclusion) [79]. However, [77] did not find significant differences in growth performance and feed conversion at 75–100% FM replacement (26–34.5% PM inclusion) compared to the FM control diet. Other authors found that Lys was the first limiting AA in PM for African catfish [75] and that supplementation with Lys [75,76] as well as a mix of Lys, Met, Trp and Arg [75] can ameliorate some of the deficiencies and improve growth at high FM replacement (75–100%) and PM inclusion levels (23–46%). Reduced growth performance in various fish species at high PM inclusion levels has been attributed to a lower content of the EAAs Lys, Met, and His in comparison to FM [74] and the content of these AA in the PM diet was in fact lower compared to the FM diet in the present study. Nevertheless, considering Lys [83], Met [84,85] and His [86] requirements for African catfish, these AA seem unlikely to have been limiting in the PM diet. However, Trp content (0.37%) was lower in the PM diet compared to the other diets and could have contributed to the somewhat reduced fish performance compared to the FM diet when considering the dietary Trp requirement of African catfish [87]. Despite the reduced fish performance recorded for the PM diet versus the FM diet, the significantly lower ingredient cost per kg of body weight gain (EUR 0.59/kg) illustrates the economic advantages of the PM over FM diet (EUR 0.81/kg).
Similar to the present results on African catfish, Nile tilapia also showed significantly better growth performance and feed conversion across the board when fed the PM diet compared to the BSF and PBM diet [15]. However, the PM diet and the FM diet produced similar performance in Nile tilapia, with only PER being significantly lower in the PM fed fish, indicating that PM could be a comparatively better FM replacer at high dietary inclusion levels in Nile tilapia than in African catfish. This is also supported by the results from [81], revealing that protein in PM and FM is similarly well digested by tilapia (Oreochromis aureus × O. niloticus), while the protein in PM is digested significantly better in tilapia compared to African catfish, whereas African catfish shows a better protein digestibility for FM than for PM. However, the results of [15] and the present study indicate that African catfish can nevertheless convert the FM and PM diet into significantly better growth performance and feed conversion than Nile tilapia.
Even though African catfish performed significantly better when fed the BSF diet compared to the PBM diet with regard to all measures except for the final total length, performance was nevertheless significantly and substantially impaired in comparison to the FM and PM diet. Insect meals in general [88,89,90,91] and BSFM specifically [92,93,94] have received much attention as a potential alternative protein and lipid source and FM replacer in aquafeeds. However, meta-analyses have revealed mixed results as to safe levels of inclusion and FM replacement. Although [88] suggest a maximum insect meal inclusion level for uncompromised fish performance of 25–30% and [89] see BSFM inclusion levels of above 29% result in growth depression, [92] are more optimistic with regard to BSFM incorporation by including abiotic factors, species and life stage into their models. Nevertheless, an inclusion of 61.6% BSFM in the BSF diet of the present study is far above these levels and higher than in most other published feeding trials. Although there are several studies on various insect meals (e.g., Gryllus bimaculatus, Zonocerus variegatus, Musa domestica, Bombyx mori) in diets for African catfish [95,96,97,98,99,100,101,102], there are currently only few studies published which specifically focused on BSFM. On the one hand, refs. [103,104] replaced up to 100% (15% BSFM inclusion) and 50% (33% inclusion) of the FM in their control diets with BSFM and did not find growth or feed conversion impairment at 25–50% (3.75–7.5% BSFM inclusion) and 25% FM replacement (20.2% BSFM inclusion), respectively, whereas higher replacement reduced overall fish performance. On the other hand, [105] found improved growth and feed conversion over the control diet at 50% FM replacement (11.45% BSFM inclusion) as well as no significant differences at 75% FM replacement (17.18% BSFM inclusion). In comparison to the present study, all of the above studies on BSFM in African catfish diets, however, incorporated substantial quantities of poultry meal (21.2–22%) and/or soybean meal (18–40%) to complement the already comparably low inclusion of BSFM. Ref. [106] used a similar diet formulation (40% CP) to the present study with the only protein ingredients being FM and BSFM and replacing up to 100% of the FM, which led to depressed fish performance at absolute inclusion levels of 29.3% up to 70.4% BSFM, which is in line with the results of this trial (61.6% BSFM inclusion). Despite being often regarded as having a balanced amino acid profile [93,94] reminiscent of FM [91], it appears that at higher inclusion levels, especially as the sole protein ingredient, BSFM leads to reduced growth performance of African catfish and other species. In fact, the BSF diet in this trial had lower Arg, Lys, Met, Phe, Thr, Met + Cys levels and a lower sum of EAAs compared to all other diets as well as lower levels of all AAs except for Trp, Val, Phe + Tyr, Tyr and Pro compared to the FM diet. Other authors also point to the reduced nutrient digestibility caused by the presence of chitin when explaining depressed growth performance at higher levels of dietary insect meal inclusion in African catfish [100,103,104,105,107,108] and other fish species [109,110,111].
In the prior trial, Nile tilapia also showed reduced performance compared to the FM and PM diet when fed the BSF diet [15]. However, when directly comparing between species, results show that Nile tilapia can better utilize the BSF diet compared to African catfish with significantly higher body weight gain and final body weight as well as a better FCR, PER and SGR. This may be explained by Nile tilapia perhaps having a relatively better capacity to digest chitin due to its more omnivorous feeding habits, including higher levels of zooplanktonic organisms [112]. Nevertheless, the depressed growth and high raw material price resulted in the highest feed cost per kg of body weight gain of all diets for both species (AC: EUR 2.89/kg; NT: EUR 2.21/kg), emphasizing the economic challenges of high dietary inclusion of BSFM at current market prices. Thus, results clearly point toward lower BSFM inclusion levels in viable diets for African catfish and Nile tilapia and are in line with the more cautious recommendations of [88,89].
Of all diets, African catfish performed worst when fed the PBM diet. Similar results were recorded by other authors which found that higher than 5–7% dietary blood meal inclusion negatively affected growth and feed conversion in African catfish and African catfish hybrids [113,114,115], which generally is in line with other authors also reporting growth reduction at higher blood meal inclusion levels in Nile tilapia [116,117,118]. The results of the present study and [15] confirm these findings with African catfish and Nile tilapia, showing similarly weak performance metrics for the PBM diet and non-significantly different final body weights, FCRs and PERs, while only differing significantly with respect to body weight gain and SGR. Supposedly, the low Ca (5.7 g/kg) and P level (7.8 g/kg) and their suboptimal ratio [119,120,121] were important factors depressing the growth of fish fed the PBM diet. Even though most EAAs were abundantly available in the PBM diet, Met and Met + Cys were below levels found in the FM and PM diet which may have played a role as well. The high CP and AA recovery through feces collection as well as the low dissolved TIN concentration in the RAS waters for both species is indicative of poor protein and AA digestibility [15]. Lower inclusion levels, blending with additional P-rich protein sources such as PM or other terrestrial animal by-products [122] and/or P supplementation are likely to improve the suitability of PBM for African catfish and Nile tilapia. It should, nevertheless, be pointed out that despite the suboptimal growth performance, the ingredient cost per kg of body weight gain came in considerably lower for the PBM diet in both species (AC: EUR 1.27/kg; NT: EUR 1.29/kg) compared to the BSF diet, which stresses the economic potential of strategically utilizing this cheap and protein-dense ingredient at lower inclusion levels in optimized feed formulations.

4.2. Water—Implictions for Plant Production

Commercially available aquafeeds are generally formulated to fulfill the nutritional needs of fish and their environmental footprint has continuously been reduced through the formulation of more energy-dense and better digestible diets with lower animal protein inclusion (FM, terrestrial animal by-products), decreasing the release of eutrophication inducing nutrients such as N and P into water bodies [123,124,125,126]. However, since nutrients such as P, K, Ca, Mg, S, Fe, Mn, Zn, B and Cu often accumulate insufficiently or in inappropriate ratios for optimal plant production in aquaponic systems and thus require artificial fertilizer supplementation [10,19,127,128,129,130,131], the reduction in nutrient excretion means that such feeds are not simultaneously optimized for plant nutrition. The notion of improving aquafeed formulations for aquaponics was already introduced by [128] but only recently received increased attention [19,132,133]. Although most authors focused on specific plant nutrients by, e.g., investigating the effect of inorganic Fe or K incorporation into their experimental diets [33,34], looking at the effect of dietary phytase addition on phosphorus dynamics [134] or manipulating dietary protein levels [135], the effect of protein ingredient choice on overall dissolved nutrient profiles in RAS has received little attention.
Results of the present study showed neither a clear upward trajectory nor meaningful differences between dietary treatments in African catfish with regard to dissolved Ca, S, Na, B and Mn in the RAS water, with concentrations clearly related to tap water levels. It could be argued that the Ca concentrations for the PM treatment decoupled upward compared to the other diets midway through the trial, which would be in line with the diets higher Ca content, but absolute differences in Ca concentration were nonetheless small. Similar results were recorded for Nile tilapia by [15] and also findings of other authors corroborate that dissolved Ca, S, B and Na [129] as well as Ca and S [136] predominantly originate from the tap water rather than the fish feed. Considering these findings as well as the fact that the experimental diets are quite different with regard to their Ca, S, Na, B and Mn content, it appears rather unlikely that these nutrients can be manipulated through protein ingredient choice to improve plant availability, at least under similar conditions (physico-chemical conditions, water exchange rate, feeding rate, sludge removal rate) and with regard to the chosen species.
However, clear accumulative trends were recorded for TIN, SRP, K and, to a somewhat lesser extent, Mg for all diets. The PM and the BSF diet resulted in similar and significantly higher TIN concentrations than the FM and the PBM diet, which among each other were also similar. Supposedly, the PM and the BSF diet resulted in higher amino acid catabolism and subsequent branchial nitrogen excretion, while supposedly the superior growth performance and amino acid utilization with the FM diet yielded roughly 40% less TIN at the end of the trial. The low TIN accumulation with the PBM diet was likely caused by the inferior growth performance and was further corroborated by substantially elevated CP and AA recovery in the feces. For Nile tilapia [15], the PM and BSF also produced the highest TIN concentrations; however, the FM diet produced similarly high and non-significantly different levels, while the poorly digested PBM diet resulted in the by far lowest TIN levels.
The clear differences between all diets for SRP accumulation point to the fact that dissolved SRP can be manipulated through dietary protein choice. Especially PM seems suitable as a FM alternative and major protein ingredient in aquaponic diets for African catfish that aim to increase SRP provision to plants and thus reduce the need for mineral P fertilizer. This also corroborates the findings for Nile tilapia with regard to PM [15]. Although the FM and PM diet had a similar P content (FM: 19.1 g/kg; PM: 18.6 g/kg), the FM diet resulted in a significantly lower accumulation of SRP for African catfish in comparison to the PM diet and, despite its lower P content, even the BSF diet (12.1 g/kg). This was not found for Nile tilapia which showed a similarly high and non-significantly different SRP accumulation for the FM and the PM diet, while the BSF diet resulted in significantly lower accumulation than both [15]. Considering these results, African catfish appear to utilize the P in the FM diet better than in the PM diet and relatively better than Nile tilapia, which may indicate the African catfish’s natural adaptation to a more piscivorous diet compared to Nile tilapia [50,51,52,53,54,55] and is in line with the comparative gross nutrient digestibility for PM and FM for both species reported by [81].
Corroborating the findings from the study on Nile tilapia [15], K concentration in the BSF treatment reached by far the highest level among diets (23.8 mg/L) for African catfish, which was almost 75% above the next highest concentration recorded (FM: 13.64 mg/L). Considering that the roughly similar K content in the FM (8.6 g/kg), PM (7.7 g/kg) and PBM diet (6 g/kg) produced only minor differences in dissolved K accumulation, while the considerably higher K content of the BSF diet (12.6 g/kg) translated into a definitively higher K accumulation, it appears that increasing the K content in diets through strategic combination of K-rich ingredients could present a promising avenue in the development of specialized aquaponic diets. Provided insect larvae are fed with raw materials high in K [137] and the resulting BSFM is incorporated in fish diets at high enough levels to increase dietary K content, yet low enough levels to allow for uncompromised growth and feed conversion performance, BSFM seems a promising protein ingredient for aquaponic diets which aim to lessen the need for mineral K supplementation in aquaponic plant production. Although not accumulating as quickly as K and being generally more closely related to tap water concentrations as similarly found by other authors [129,136], Mg also reached the significantly highest concentration in the BSF treatment. This was also seen in Nile tilapia [15] and is in line with the higher Mg content of the BSF diet. Under the same constraints as mentioned before with regard to the level of dietary inclusion, this makes BSFM a potential option in aquaponic diets to alleviate Mg deficiencies sometimes encountered on the plant production side in aquaponic systems [131].
Even though partly showing some accumulation, dissolved Fe, Cu and Zn were low and mostly tap water related and their concentrations seem comparatively unlikely to be manipulated solely through dietary protein choice, at least under the physico-chemical conditions maintained during the trial. It should, nevertheless, be noted that the higher Fe content in the PBM diet did result in higher dissolved Fe concentrations compared to the other dietary treatments and that the BSF diet, in accordance with its higher Cu und Zn content, was the only diet resulting in higher Cu and Zn concentrations than found in the tap water. Therefore, under conditions of increased mineralization of organics and subsequent solubilization depending on, e.g., system type, operation, sludge removal frequency or water pH, it may be possible to increase the dietary contribution towards the dissolved concentration of less soluble nutrients such as Fe, Mn or Zn relative to the influence of tap water as was likely the case in other studies [129,136]. Such conditions may then perhaps exacerbate potentially existing differences between varying diet formulations in this regard.
When comparing production of the major dissolved plant nutrients TIN, SRP and K directly between species on the basis of feed input, it becomes apparent that for all experimental diets K production per g of feed, although at times significantly different between species (e.g., higher K production by Nile tilapia for PM diet), was still roughly similar between African catfish and Nile tilapia in absolute terms and consistent throughout the trials. For TIN and SRP, however, partly substantial differences were recorded between species. African catfish appeared to incorporate the protein in the FM and PM diet better and catabolize less of it than Nile tilapia with significantly less TIN produced per g of feed, meaning lower availability for downstream plant production. This fits with the comparatively better growth and feed conversion achieved by African catfish on these diets. Similar to the lower production of TIN for the FM diet, African catfish also produces less SRP per g of the FM diet than Nile tilapia, which together with the excellent growth performance again stresses the high suitability of FM in support of growth in African catfish as a primarily piscivorous species. However, beyond the ecological and economic concerns surrounding marine FM [138,139], it also results in less supply of the important dissolved plant nutrients TIN, SRP, and also K if incorporated as the sole main protein source in African catfish diets. Alternatively, PM still enables good growth performance while not only achieving the highest TIN and SRP production per g of feed of all the experimental diets in African catfish, but also higher SRP production in direct comparison to Nile tilapia. Even though Nile tilapia grew better compared to African catfish when fed the BSF diet, TIN and K produced per g of feed was very similar between the species, while the substantially higher SRP production in African catfish is supposedly a testimony to the comparatively low suitability of BSFM for this species at the high dietary inclusion in this study.
Results of this study as well as the comparison between African catfish and Nile tilapia [15] reveal that there is potential for modifying the dissolved nutrient profile of RAS water regarding important and often insufficiently available plant nutrients, such as TIN, SRP, K and Mg, through protein ingredients and species choice. Considering the conceptual nature of the experimental diets as single protein ingredient diets, the question remains if and how these nutrient profiles can be influenced in highly and similarly digestible diets that include lower levels of the respective protein ingredients and/or are composed of blends with other complementary protein ingredients. With the primary objective needing to be economically viable aquaponic diets that ensure optimal fish performance and health, the main challenge will be to secure good diet digestibility, feed conversion and growth while simultaneously improving dissolved nutrient profiles for downstream plant production.

4.3. Fish Feces—A Resource in CMFS

Adding a third trophic production level to aquaponic systems in the form of insect larvae as recycling agents could improve the productive use of input nutrients, reduce waste and, in essence, present an example of a CMFS for more sustainable food production. In order to map out the possibilities, challenges and boundaries of such systems, internally available resource streams such as the fish feces have to be analyzed in terms of available quantity and nutritional quality. Especially in the process of designing novel aquafeed formulations for multitrophic systems that aim to support optimal fish performance while additionally supplying the best possible nutrient profile for the lower trophic production levels, it is important to define and compare the resulting fish feces as components of system specific insect larvae diets.
The mineral composition of all experimental feces was dominated by Ca followed by P, which combined together made up 24.3 g (PBM), 44.7 g (BSF), 78.8 g (PM) and 106 g (FM) of feces per kg DM and 46.2% (BSF), 46.4% (PBM), 48.7% (FM) and 53.8% (PM) of the feces ash content. The same Ca and P dominance as well as pattern between diets was also found in Nile tilapia [15], yet generally lower Ca + P contents were recorded in the feces (PBM: 22.9 g/kg; BSF: 37.5 g/kg; FM: 93.5 g/kg; PM: 94.1 g/kg) except for the PM diet, and a lower percentage of the feces ash content was made up of these two minerals compared to the African catfish feces (BSF: 35.8%; PBM: 37%; FM: 42.8%; PM: 44%). Considering the notable difference in dietary mineral composition and fish performance in this study, feces mineral compositions and patterns were overall similar to results for Nile tilapia [140,141,142] and African catfish [136,142] published by other authors which also found feces DM mainly constituted by Ca > P > S > Mg. Generally, the Ca, P, S and Mg content in the feces reflected their high abundance in the experimental diets relative to other minerals. With conventional feed formulations and regardless of species, it is therefore likely that the mineral composition of fish feces as an internal resource stream in CMFS and potential dietary component of insect larvae diets will be dominated by Ca, P, S and Mg. K content in all feces types on the other hand was comparably low considering it was the third most abundant mineral in all diets behind Ca and P. Together with the finding that dissolved K accumulates readily in the process water for all diets, this corroborates the notion that K is a key nutrient of focus in aquaponic diet development.
As seen with lower Ca and P levels in the BSF and PBM diet and the higher Ca and P levels in the FM and PM diet leading to a lower and higher Ca and P content in the feces, respectively, also the high Zn and Mn content in the BSF diet, the high Fe content in the PBM diet and the high Al content in the FM diet translated into significantly higher levels of these metals in the respective feces. However, even though the significantly highest S content was found in the PBM feces and the highest Mg content in the FM feces, this was not reflected in these diets having the highest dietary content of S and Mg, respectively. The above findings for Zn and Mn in the BSF feces, for Fe and S in the PBM feces and for Al and Mg in the FM feces were also recorded for Nile tilapia [15]. The tendency of BSF larvae to reflect the mineral composition of the growing substrate [91,137,143,144,145] can be beneficial in the context of CMFSs as it may be possible to recycle important minerals such P and K from the fish feces into larvae which can then serve as a mineral-enriched protein and lipid source for specialized multitrophic aquaponic diets. However, the risk of accumulating certain toxic (heavy) metals potentially present at higher concentrations in the fish feces depending on the dietary ingredients used, as testified by the comparably high Al content of the FM diet and feces, has to be treated with caution [145,146].
All experimental diets resulted in feces characterized by a low CF and starch content, which in combination with the low percentage recovery of these nutrients through feces collection, indicates generally high digestibility of CF and starch regardless of diet formulation. On the contrary, NFE content was high in all feces types and constituted the dominant proximate component in the FM, PM and BSF feces by making up >30% of the DM; whereas, in the PBM diet, only CP content was higher than NFE content.
The FM and PM feces reflected the superiority of the respective diets regarding fish performance by exhibiting the lowest energy density, P/E ratio and content of important nutrients such as CP and AAs, which was also confirmed by low recovery values for DM, CP and GE. Both feces types shared reasonable similarity in terms of proximate and AA composition. The superior fish performance with the FM diet nevertheless resulted in a lower total EAA and NEAA content as well as lower energy density of the FM feces compared to the PM feces, although only significantly lower for total NEAAs. In contrast to their comparably lower energy and CP density, and as suggested by the higher ash content of the FM and PM diet, the ash content of the FM and PM feces as well as recovery of ash per kg of feed were higher compared to the BSF and PBM feces. However, the nonetheless significantly lower feces ash content as well as percentage recovery of ash for the PM diet compared to the FM diet could mean higher incorporation of dietary minerals and/or increased release of minerals into a dissolved state by excretion or solubilization from feces. Indicative of the latter would be the higher dissolved Ca and SRP concentrations recorded for the PM diet versus the FM diet as well as the significantly lower content of Ca and P in the PM feces, considering that these two minerals were present at similar levels in the PM and FM diet.
In contrast to the low nutrient density of the FM and PM feces caused by the high conversion of the dietary nutrients into growth, the percentage and per kg of feed recovery of DM CP, CF, starch and GE of the nutrients in the BSF diet was for the most part significantly higher compared to the FM and PM diet. This caused the BSF feces to have a higher density of valuable nutrients, including a significantly higher CP, CF, CFB, starch, GE, and P/E ratio. Despite the BSF diet already having lower levels of EAAs and NEAAs and significantly more DM having been recovered through feces collection as a percentage of the originally fed DM, also the content of EAAs and NEAAs were higher in the BSF compared to the FM and PM feces. The CFB content in the BSF diet was the highest among diets, although the inclusion of cellulose, lignin, and hemicellulose from wheat bran and corn meal was lower, suggesting that much of the CFB measured must have come from the chitin in the exoskeleton of the BSF larvae. This also led to the BSF feces having the significantly highest CFB content and recovery of fiber per kg of feed through feces collection also being the significantly highest. However, the percentage recovery of CFB through feces collection in relation to the amount of dietary CFB fed was significantly lower than for all other dietary treatments, which points to the notion that chitin is at least better digested by African catfish than the CFB originating from plant sources. This relationship was also encountered in Nile tilapia [15].
The suboptimal fish performance and protein utilization recorded for the PBM diet in comparison to the other diets was clearly reflected by the strongly elevated nutrient density of the feces which had the by far highest CP, AA and GE content as well as the highest P/E ratio of all feces types. The excessive recovery (percentage + per kg of feed) of the originally fed DM, CP and GE through feces collection further corroborated the inadequacy of the PBM diet in the current form. The above deems the nutrient-dense PBM feces highly unlikely to originate from fish production in any kind of real-world production scenario and should not be expected as a realistic potential dietary ingredient for insect larvae production.
The comparison between African catfish and Nile tilapia regarding feces proximate and AA composition revealed, despite some significant differences emerging between species, that feces nutrient profiles were quite similar with respect to each diet, meaning absolute differences between species were mostly small for the considered nutrients. However, for all experimental diets significantly less raw material in the form of feces DM was recovered for African catfish per kg of feed (FM: 134 g/kg; PM: 120 g/kg; BSF: 140 g/kg; PBM: 258 g/kg) than for Nile tilapia (FM: 162 g/kg; PM: 167 g/kg; BSF: 154 g/kg; PBM: 310 g/kg). Taking the specific method of feces collection applied in the present trial into account, this in turn suggests that generally less raw material of nevertheless similar nutritional quality to Nile tilapia feces would need to be recycled by insect larvae when deciding to produce African catfish in the proposed CMFS. This could be beneficial from a recycling point of view. Nevertheless, some species-specific differences in feces nutrient profiles did emerge and were not consistent across diets. Although the differences between species for the compared nutrients in the PBM and FM feces were almost entirely non-significant, most of the nutrients in the PM and BSF feces were in fact significantly different between African catfish and Nile tilapia. For the PM diet, the Nile tilapia feces showed significantly higher levels of nitrogenous compounds (CP, EAAs, NEAAs, total AA) and ash, whereas the African catfish feces was characterized by significantly higher non-nitrogenous compounds (CFB, NFE, starch). For the BSF diet in contrast, African catfish feces showed significantly higher levels of nitrogenous compounds (CP, EAAs, NEAAs, total AA), as well as CF, starch and NFE, while Nile tilapia feces only showed significantly higher CFB content.
In summary, protein choice influences growth performance and good growth performance tends to result in a lower content of valuable nitrogenous nutrients (CP, AAs) and a higher content of CFB, NFE and ash in the feces, regardless of species. The results suggest that the differential effect of protein choice on growth performance, as seen with the better growth of African catfish on the PM diet and the better growth of Nile tilapia on the BSF diet, can be reflected accordingly in the content of nutrients in the feces. Nevertheless, this cannot necessarily be generalized as seen by the similar nutrient profile found in the FM feces, despite the significantly better growth of African catfish on this diet. Comparing within species differences and between species differences across diets and nutrients revealed that differences in feces’ nutrient composition within species across diets were larger on average than between species differences across diets. However, more similar growth performance between diets within each species resulted in on average increasingly similar feces nutrient profiles for both species. Bearing in mind this gross similarity between the species’ feces nutrient profiles in the context of the proximate and AA composition comparison of Nile tilapia feces with other relevant raw materials (animal manures, poultry feed, BSF larvae whole body composition) conducted by [15], it firstly remains to be seen how well BSF larvae can generally utilize fish feces as single feed source or ingredient of compound diets and secondly how strongly species or protein source dependent differences in feces nutrient profiles affect larvae growth.

5. Conclusions

Despite not enabling the same growth performance as FM, PM proved to be a suitable and cheap alternative protein source for African catfish that facilitates clearly superior growth performance over BSFM and especially PBM at high dietary inclusion levels as the sole dietary protein source. Generally, this corroborated the growth results recorded for Nile tilapia fed the same diets. Differences in natural feeding habits and nutritional physiologies between the two species nevertheless likely led to the observed differences in growth performance and feed conversion, i.e., African catfish translating the FM and PM diet and Nile tilapia the BSF diet more effectively into growth.
Furthermore, results reveal the potential for modifying dissolved nutrient excretion patterns of African catfish through dietary protein choice, especially with respect to major plant nutrients such as TIN, SRP, K and Mg. Most notably, the PM appears to be a suitable source for increased levels of dissolved TIN and SRP in RAS process water, while BSFM seems a promising ingredient to raise dissolved K levels. Considering that the experimental diets featured high inclusion levels of only one of the tested protein sources, future research should simultaneously investigate the effect of more realistic protein source blends on growth performance and dissolved nutrient accumulation in the process water. Additionally, species-specific differences were found regarding the excretion of important dissolved plant nutrients as, e.g., evidenced by the higher SRP production per gram of feed for the PM and BSF diet in African catfish or the higher production of TIN for the FM and PM diet, as well as SRP for the FM diet in Nile tilapia. The results, therefore, also warrant closer attention to species choice when investigating the optimization of the fish-plant interface in aquaponic and multitrophic systems.
Finally, insect larvae (e.g., BSF larvae) could represent a sensible addition to aquaponic systems as upcycling agents which transform system-internal waste streams into valuable nutrients which could be reintroduced into the trophic cascade via the fish feed. Considering that well digested feeds such as the FM and PM diet lead to less nutrient-dense feces as shown for African catfish as well as Nile tilapia, dietary modification to improve feces nutritional quality appears only possible within narrow margins. Insect larvae trials need to determine growth performance with less nutrient-dense and more realistic feces types when used as the primary feed substrate and when blended with other substrates, such as the harvest waste from plant production or other system external feed sources. This can help to assess the recycling potential of insect larvae production in comparison to other alternative recycling options such as remineralization or biogas production. Even though feces quality for all diets was similar when comparing between species, the quantity of feces produced per unit of feed was consistently lower for African catfish, which would be beneficial from a recycling point of view in a multitrophic production setting since less raw material of a similar nutritional quality would need to be recycled.

Author Contributions

C.S.: Conceptualization, methodology and execution of the experiment, data acquisition, curation, analysis and visualization, writing—preparation of original draft and editing; K.K.: conceptualization, supervision, resources, writing—review and editing; W.K.: conceptualization, supervision, project administration, funding acquisition, resources, writing—review and editing. All authors have read and agreed to the published version of the manuscript.

Funding

This research was funded by the Federal Ministry of Education and Research/PtJ Project Management Agency as part of Agricultural Systems of the Future (CUBES Circle), grant number 031B0733E.

Institutional Review Board Statement

This study did not require an application for approval according to communication with the Ethics Committee of the Landesamt für Gesundheit und Soziales (LAGeSo), Berlin.

Data Availability Statement

The data is available online via the following link: https://doi.org/10.6084/m9.figshare.21130136.v1 (accessed on 14 September 2022).

Acknowledgments

The authors would like to thank Tobias Goldhammer, Thomas Rossoll, Paul Hawelitschek and Marvin Sens from Dept. 1 and Viola Schöning, Hendrik Monsees and Laura Klatt from Dept. 4 of the Leibniz Institute of Freshwater Ecology and Inland Fisheries for their support in laboratory analytics as well as planning and execution of this research.

Conflicts of Interest

The authors declare no conflict of interest.

References

  1. Naylor, R.L.; Hardy, R.W.; Buschmann, A.H.; Bush, S.R.; Cao, L.; Klinger, D.H.; Little, D.C.; Lubchenco, J.; Shumway, S.E.; Troell, M. A 20-year retrospective review of global aquaculture. Nature 2021, 591, 551–563. [Google Scholar] [CrossRef] [PubMed]
  2. Martins, C.I.M.; Eding, E.H.; Verdegem, M.C.J.; Heinsbroek, L.T.N.; Schneider, O.; Blancheton, J.P.; D’Orbcastel, E.R.; Verreth, J.A.J. New developments in recirculating aquaculture systems in Europe: A perspective on environmental sustainability. Aquac. Eng. 2010, 43, 83–93. [Google Scholar] [CrossRef] [Green Version]
  3. Ebeling, J.M.; Timmons, M.B. Recirculating aquaculture systems. In Aquaculture Production Systems; Tidwell, J.H., Ed.; John Wiley & Sons, Inc.: Hoboken, NJ, USA, 2012; pp. 245–277. [Google Scholar]
  4. Badiola, M.; Mendiola, D.; Bostock, J. Recirculating aquaculture systems (RAS) analysis: Main issues on management and future challenges. Aquac. Eng. 2012, 51, 26–35. [Google Scholar] [CrossRef] [Green Version]
  5. Godfray, H.C.J.; Beddington, J.R.; Crute, I.R.; Haddad, L.; Lawrence, D.; Muir, J.F.; Pretty, J.; Robinson, S.; Thomas, S.M.; Toulmin, C. Food security: The challenge of feeding 9 billion people. Science 2010, 327, 812–818. [Google Scholar] [CrossRef] [Green Version]
  6. Baulcombe, D.; Crute, I.; Davies, B.; Dunwell, J.; Gale, M.; Jones, J.; Pretty, J.; Sutherland, W.; Toulmin, C. Reaping the Benefits—Science and the Sustainable Intensification of Global Agriculture; The Royal Society: London, UK, 2009. [Google Scholar]
  7. Baganz, G.F.M.; Junge, R.; Portella, M.C.; Goddek, S.; Keesman, K.J.; Baganz, D.; Staaks, G.; Shaw, C.; Lohrberg, F.; Kloas, W. The aquaponic principle—It is all about coupling. Rev. Aquac. 2022, 14, 252–264. [Google Scholar] [CrossRef]
  8. Kloas, W.; Groß, R.; Baganz, D.; Graupner, J.; Monsees, H.; Schmidt, U.; Staaks, G.; Suhl, J.; Tschirner, M.; Wittstock, B.; et al. A new concept for aquaponic systems to improve sustainability, increase productivity, and reduce environmental impacts. Aquac. Environ. Interact. 2015, 7, 179–192. [Google Scholar] [CrossRef] [Green Version]
  9. Monsees, H.; Kloas, W.; Wuertz, S. Decoupled systems on trial: Eliminating bottlenecks to improve aquaponic processes. PLoS ONE 2017, 12, e0183056. [Google Scholar] [CrossRef] [Green Version]
  10. Eck, M.; Körner, O.; Jijakli, M.H. Nutrient cycling in aquaponics systems. In Aquaponics Food Production Systems; Goddek, S., Joyce, A., Kotzen, B., Burnell, G., Eds.; Springer: Cham, Switzerland, 2019; pp. 231–246. [Google Scholar]
  11. Stegmann, P.; Londo, M.; Junginger, M. The circular bioeconomy: Its elements and role in European bioeconomy clusters. Resour. Conserv. Recycl. X 2020, 6, 100029. [Google Scholar] [CrossRef]
  12. Carus, M.; Dammer, L. The “circular bioeconomy”—Concepts, opportunities and limitations. Ind. Biotechnol. 2018, 14, 83–91. [Google Scholar] [CrossRef]
  13. Davis, C.B.; Aid, G.; Zhu, B. Secondary resources in the bio-based economy: A computer assisted survey of value pathways in academic literature. Waste Biomass Valoriz. 2017, 8, 2229–2246. [Google Scholar] [CrossRef]
  14. Ulrichs, C. CUBES Circle. Available online: https://www.cubescircle.de/en/home/project (accessed on 25 January 2022).
  15. Shaw, C.; Knopf, K.; Kloas, W. Fish feeds in aquaponics and beyond: A novel concept to evaluate protein sources in diets for circular multitrophic food production systems. Sustainability 2022, 14, 4064. [Google Scholar] [CrossRef]
  16. Villarroel, M.; Junge, R.; Komives, T.; König, B.; Plaza, I.; Bittsánszky, A.; Joly, A. Survey of aquaponics in Europe. Water 2016, 8, 468. [Google Scholar] [CrossRef] [Green Version]
  17. Love, D.C.; Fry, J.P.; Li, X.; Hill, E.S.; Genello, L.; Semmens, K.; Thompson, R.E. Commercial aquaponics production and profitability: Findings from an international survey. Aquaculture 2015, 435, 67–74. [Google Scholar] [CrossRef] [Green Version]
  18. Rakocy, J.E.; Masser, M.P.; Losordo, T.M. Recirculating Aquaculture Tank Production Systems: Aquaponics—Integrating Fish and Plant Culture; SRAC Publication No. 454; Southern Regional Aquaculture Center: Stoneville, MS, USA, 2006. [Google Scholar]
  19. Yep, B.; Zheng, Y. Aquaponic trends and challenges–A review. J. Clean. Prod. 2019, 228, 1586–1599. [Google Scholar] [CrossRef]
  20. Popma, T.J.; Lovshin, L.L. Worldwide Prospects for Commercial Production of Tilapia; International Center for Aquaculture and Aquatic Environments Department of Fisheries and Allied Aquacultures Auburn University: Auburn, AL, USA, 1996. [Google Scholar]
  21. El-Sayed, A.-F.M. Tilapia Culture; CABI Publishing, CABI International: Willingford, UK, 2006. [Google Scholar]
  22. Haylor, G.S. The case for the African catfish, Clarias gariepinus Burchell, 1822, Clariidae: A comparison of the relative merits of tilapiine fishes, especially Oreochromis niloticus (L.) and C. gariepinus Burchell, for African aquaculture. Aquac. Res. 1989, 20, 279–285. [Google Scholar] [CrossRef]
  23. Pasch, J.; Palm, H.W. Economic analysis and improvement opportunities of African catfish (Clarias gariepinus) aquaculture in northern Germany. Sustainability 2021, 13, 3569. [Google Scholar] [CrossRef]
  24. Huisman, E.A.; Richter, C.J.J. Reproduction, growth, health control and aquacultural potential of the African catfish, Clarias gariepinus (Burchell 1822). Aquaculture 1987, 63, 1–14. [Google Scholar] [CrossRef]
  25. Hecht, T.; Uys, W.; Britz, P.J. The Culture of Shartooth Catfish, Clarias gariepinus in Southern Africa; South African National Scientific Programmes Report No. 153; National Scientific Programmes Unit (CSIR): Pretoria, South Africa, 1988. [Google Scholar]
  26. Bovendeur, J.; Eding, E.H.; Henken, A.M. Design and performance of a water recirculation system for high-density culture of the African catfish, Clarias gariepinus (Burchell 1822). Aquaculture 1987, 63, 329–353. [Google Scholar] [CrossRef]
  27. Endut, A.; Jusoh, A.; Ali, N.; Wan Nik, W.B.; Hassan, A. A study on the optimal hydraulic loading rate and plant ratios in recirculation aquaponic system. Bioresour. Technol. 2010, 101, 1511–1517. [Google Scholar] [CrossRef]
  28. Endut, A.; Jusoh, A.; Ali, N.; Wan Nik, W.N.S.; Hassan, A. Effect of flow rate on water quality parameters and plant growth of water spinach (Ipomoea aquatica) in an aquaponic recirculating system. Desalin. Water Treat. 2009, 5, 19–28. [Google Scholar] [CrossRef]
  29. Suhl, J.; Dannehl, D.; Baganz, D.; Schmidt, U.; Kloas, W. An innovative suction filter device reduces nitrogen loss in double recirculating aquaponic systems. Aquac. Eng. 2018, 82, 63–72. [Google Scholar] [CrossRef]
  30. Oladimeji, S.A.; Okomoda, V.T.; Olufeagba, S.O.; Solomon, S.G.; Abol-Munafi, A.B.; Alabi, K.I.; Ikhwanuddin, M.; Martins, C.O.; Umaru, J.; Hassan, A. Aquaponics production of catfish and pumpkin: Comparison with conventional production systems. Food Sci. Nutr. 2020, 8, 2307–2315. [Google Scholar] [CrossRef] [PubMed] [Green Version]
  31. Diatin, I.; Shafruddin, D.; Hude, N.; Sholihah, M.; Mutsmir, I. Production performance and financial feasibility analysis of farming catfish (Clarias gariepinus) utilizing water exchange system, aquaponic, and biofloc technology. J. Saudi Soc. Agric. Sci. 2021, 20, 344–351. [Google Scholar] [CrossRef]
  32. Knaus, U.; Zimmermann, J.; Appelbaum, S.; Palm, H.W. Spearmint (Mentha spicata) cultivation in decoupled aquaponics with three hydro-components (grow pipes, raft, gravel) and African catfish (Clarias gariepinus) production in northern Germany. Sustainability 2022, 14, 305. [Google Scholar] [CrossRef]
  33. Siqwepu, O.; Salie, K.; Goosen, N. Evaluation of chelated iron and iron sulfate in the diet of African catfish, Clarias gariepinus to enhance iron excretion for application in integrated aquaponics systems. J. World Aquac. Soc. 2020, 51, 1034–1053. [Google Scholar] [CrossRef]
  34. Siqwepu, O.; Salie, K.; Goosen, N. Evaluation of potassium diformate and potassium chloride in the diet of the African catfish, Clarias gariepinus in a recirculating aquaculture system. Aquaculture 2020, 526, 735414. [Google Scholar] [CrossRef]
  35. Pasch, J.; Appelbaum, S.; Palm, H.W.; Knaus, U. Growth of basil (Ocimum basilicum) in aeroponics, DRF, and raft systems with effluents of African catfish (Clarias gariepinus) in decoupled aquaponics (s.s.). AgriEngineering 2021, 3, 559–574. [Google Scholar] [CrossRef]
  36. Baßmann, B.; Brenner, M.; Palm, H.W. Stress and welfare of African catfish (Clarias gariepinus Burchell, 1822) in a coupled aquaponic system. Water 2017, 9, 504. [Google Scholar] [CrossRef] [Green Version]
  37. Baßmann, B.; Harbach, H.; Weißbach, S.; Palm, H.W. Effect of plant density in coupled aquaponics on the welfare status of African catfish, Clarias gariepinus. J. World Aquac. Soc. 2020, 51, 183–199. [Google Scholar] [CrossRef]
  38. Alltech Coppens. RAS-Zucht von Welsen—Einen Blick hinter die Kulissen. Available online: https://www.alltechcoppens.com/de/aktuelles/farming-catfish-in-ras (accessed on 14 September 2022).
  39. van de Nieuwegiessen, P.G.; Olwo, J.; Khong, S.; Verreth, J.A.J.; Schrama, J.W. Effects of age and stocking density on the welfare of African catfish, Clarias gariepinus Burchell. Aquaculture 2009, 288, 69–75. [Google Scholar] [CrossRef]
  40. Palm, H.W.; Knaus, U.; Wasenitz, B.; Bischoff, A.A.; Strauch, S.M. Proportional up scaling of African catfish (Clarias gariepinus Burchell, 1822) commercial recirculating aquaculture systems disproportionally affects nutrient dynamics. Aquaculture 2018, 491, 155–168. [Google Scholar] [CrossRef]
  41. Conceição, L.E.C.; Houlihan, D.F.; Verreth, J.A.J. Fast growth, protein turnover and costs of protein metabolism in yolk-sac larvae of the African catfish (Clarias gariepinus). Fish Physiol. Biochem. 1997, 16, 291–302. [Google Scholar] [CrossRef]
  42. Conceição, L.E.C.; Dersjant-Li, Y.; Verreth, J.A.J. Cost of growth in larval and juvenile African catfish (Clarias gariepinus) in relation to growth rate, food intake and oxygen consumption. Aquaculture 1998, 161, 95–106. [Google Scholar] [CrossRef]
  43. Belão, T.C.; Leite, C.A.C.; Florindo, L.H.; Kalinin, A.L.; Rantin, F.T. Cardiorespiratory responses to hypoxia in the African catfish, Clarias gariepinus (Burchell 1822), an air-breathing fish. J. Comp. Physiol. B Biochem. Syst. Environ. Physiol. 2011, 181, 905–916. [Google Scholar] [CrossRef] [PubMed]
  44. van de Nieuwegiessen, P.G.; Boerlage, A.S.; Verreth, J.A.J.; Schrama, J.W. Assessing the effects of a chronic stressor, stocking density, on welfare indicators of juvenile African catfish, Clarias gariepinus Burchell. Appl. Anim. Behav. Sci. 2008, 115, 233–243. [Google Scholar] [CrossRef]
  45. Haylor, G.S. Controlled hatchery production of Clarias gariepinus (Burchell 1822): Growth and survival of fry at high stocking density. Aquac. Fish. Manag. 1991, 22, 405–422. [Google Scholar] [CrossRef]
  46. Roques, J.A.C.; Schram, E.; Spanings, T.; van Schaik, T.; Abbink, W.; Boerrigter, J.; de Vries, P.; van de Vis, H.; Flik, G. The impact of elevated water nitrite concentration on physiology, growth and feed intake of African catfish Clarias gariepinus (Burchell 1822). Aquac. Res. 2015, 46, 1384–1395. [Google Scholar] [CrossRef]
  47. Schram, E.; Roques, J.A.C.; Abbink, W.; Yokohama, Y.; Spanings, T.; de Vries, P.; Bierman, S.; van de Vis, H.; Flik, G. The impact of elevated water nitrate concentration on physiology, growth and feed intake of African catfish Clarias gariepinus (Burchell 1822). Aquac. Res. 2014, 45, 1499–1511. [Google Scholar] [CrossRef]
  48. Ip, Y.K.; Chew, S.F.; Wilson, J.M.; Randall, D.J. Defences against ammonia toxicity in tropical air-breathing fishes exposed to high concentrations of environmental ammonia: A review. J. Comp. Physiol. B Biochem. Syst. Environ. Physiol. 2004, 174, 565–575. [Google Scholar] [CrossRef]
  49. Ip, Y.K.; Zubaidah, R.M.; Liew, P.C.; Loong, A.M.; Hiong, K.C.; Wong, W.P.; Chew, S.F. African sharptooth catfish Clarias gariepinus does not detoxify ammonia to urea or amino acids but actively excretes ammonia during exposure to environmental ammonia. Physiol. Biochem. Zool. 2004, 77, 242–254. [Google Scholar] [CrossRef]
  50. FishBase. Oreochromis Niloticus (Linnaeus, 1758)—Nile Tilapia. Available online: https://www.fishbase.se/summary/oreochromis-niloticus.html (accessed on 20 July 2022).
  51. Tesfahun, A.; Temesgen, M. Food and feeding habits of Nile tilapia Oreochromis niloticus (L.) in Ethiopian water bodies: A review. Int. J. Fish. Aquat. Stud. 2018, 6, 43–47. [Google Scholar]
  52. Oso, J.A.; Ayodele, I.A.; Fagbuaro, O. Food and feeding habits of Oreochromis niloticus (L.) and Sarotherodon galilaeus (L.) in a tropical reservoir. World J. Zool. 2006, 1, 118–121. [Google Scholar]
  53. Kadye, W.T.; Booth, A.J. Integrating stomach content and stable isotope analyses to elucidate the feeding habits of non-native sharptooth catfish Clarias gariepinus. Biol. Invasions 2012, 14, 779–795. [Google Scholar] [CrossRef]
  54. Dadebo, E. Reproductive biology and feeding habits of the catfish in Lake Awassa, Ethiopia. Ethiop. J. Sci. 2000, 23, 231–246. [Google Scholar] [CrossRef] [Green Version]
  55. FishBase. Clarias gariepinus (Burchell, 1822)—North African catfish. Available online: https://www.fishbase.se/summary/1934# (accessed on 20 July 2022).
  56. Phrompanya, P.; Saenphet, K.; Saenphet, S. Comparative histochemical study of the gastrointestinal tracts of the Nile tilapia (Oreochromis niloticus) and the hybrid catfish (Clarias batrachus × Clarias gariepinus). Acta Histochem. 2019, 121, 261–267. [Google Scholar] [CrossRef] [PubMed]
  57. El Nahass, E.E.M.; Elwan, M.M.M. Comparitive histological, histochemical and ultrastructural studies on the ileum of African catfish (Clarias gariepinus) and (Oreochromis niloticus). Egypt. J. Exp. Biol. 2019, 15, 295–303. [Google Scholar] [CrossRef]
  58. Elwan, M.M.M.; El Nahass, E.E.S.M. Comparitive histological and ultrastructural studies on the stomach of African catfish (Clarias gariepinus) and (Oreochromis niloticus). J. Histol. Histopathol. 2019, 6, 7243. [Google Scholar] [CrossRef] [Green Version]
  59. Rust, M.B. Nutritional physiology. In Fish Nutrition; Halver, J.E., Hardy, R.W., Eds.; Academic Press: Cambridge, MA, USA, 2003; pp. 367–452. [Google Scholar]
  60. Lall, S.P. The minerals. In Fish Nutrition; Halver, J.E., Hardy, R.W., Eds.; Academic Press: Cambridge, MA, USA, 2003; pp. 259–308. [Google Scholar]
  61. Watanabe, T.; Kiron, V.; Satoh, S. Trace minerals in fish nutrition. Aquaculture 1997, 151, 185–207. [Google Scholar] [CrossRef]
  62. Bureau, D.P.; Kaushik, S.J.; Cho, C.Y. Bioenergetics. In Fish Nutrition; Halver, J.E., Hardy, R.W., Eds.; Academic Press: Cambridge, MA, USA, 2003; pp. 1–59. [Google Scholar]
  63. Kleiber, M. The Fire of Life. An Introduction to Animal Energetics; Krieger Publishing: New York, NY, USA, 1975. [Google Scholar]
  64. DIN EN ISO 16634-2; Food Products—Determination of the Total Nitrogen Content by Combustion according to the Dumas Principle and Calculation of the Crude Protein Content—Part 2: Cereals, Pulses and Milled Cereal Products. DIN Deutsches Institut für Normung e.V.: Berlin, Germany, 2016.
  65. EC (European Commission). Commission Regulation (EC) No 152/2009 of 27 January 2009 Laying Down the Methods of Sampling and Analysis for the Official Control of Feed; European Commission: Brussels, Belgium, 2009. [Google Scholar]
  66. DIN EN ISO 13903; Animal Feeding Stuffs—Determination of Amino Acids Content. DIN Deutsches Institut für Normung e.V.: Berlin, Germany, 2005.
  67. FOOD-PA 662; Bestimmung des Gehaltes an Gesamt-Tryptophan (Summe: Frei und gebunden) in Lebens- und Futtermitteln mittels LC-Aminosäureanalysator mit Ninhydrin. SGS (SGS Analytics GmbH Germany): Berlin, Germany, 2021.
  68. DIN EN 16174; Sludge, Treated Biowaste and Soil—Digestion of Aqua Regia Soluble Fractions of Elements. DIN Deutsches Institut für Normung e.V.: Berlin, Germany, 2012.
  69. DIN EN ISO 11885; Water Quality—Determination of Selected Elements by Inductively Coupled Plasma Optical Emission Spectrometry (ICP-OES). DIN Deutsches Institut für Normung e.V.: Berlin, Germany, 2009.
  70. Cho, C.Y. Feeding systems for rainbow trout and other salmonids with reference to current estimates of energy and protein requirements. Aquaculture 1992, 100, 107–123. [Google Scholar] [CrossRef]
  71. Bureau, D.P. Rendered products in fish aquaculture feeds. In Essential Rendering—All About the Animal By-Products Industry; Meeker, D.L., Ed.; The National Renderers Association (NRA): Alexandria, VA, USA, 2006; pp. 179–184. [Google Scholar]
  72. Ataguba, G.A.; Kamble, M.T.; Salin, K.R. Food industry by-products as protein replacement in aquaculture diets of tilapia and catfishs. In Food Processing By-Products and their Utilization; Anal, A.K., Ed.; Wiley-Blackwell: Hoboken, NJ, USA, 2017; pp. 471–507. [Google Scholar]
  73. Luthada-Raswiswi, R.; Mukaratirwa, S.; O’brien, G. Animal protein sources as a substitute for fishmeal in aquaculture diets: A systematic review and meta-analysis. Appl. Sci. 2021, 11, 3854. [Google Scholar] [CrossRef]
  74. Galkanda-Arachchige, H.S.C.; Wilson, A.E.; Davis, D.A. Success of fishmeal replacement through poultry by-product meal in aquaculture feed formulations: A meta-analysis. Rev. Aquac. 2020, 12, 1624–1636. [Google Scholar] [CrossRef]
  75. El-Husseiny, O.M.; Issoufou, H.M.; Ashraf, S. Determination of the order of amino acid limitation in slaughterhouse poultry by-product meal in African catfish diet by amino acid addition assay. J. Arab. Aquac. Soc. 2013, 8, 373–384. [Google Scholar]
  76. El-Husseiny, O.M.; Hassan, M.I.; El-Haroun, E.R.; Suloma, A. Utilization of poultry by-product meal supplemented with l-lysine as fish meal replacer in the diet of African catfish Clarias gariepinus (Burchell, 1822). J. Appl. Aquac. 2018, 30, 63–75. [Google Scholar] [CrossRef]
  77. Goda, A.M.; El-Haroun, E.R.; Kabir Chowdhury, M.A. Effect of totally or partially replacing fish meal by alternative protein sources on growth of African catfish Clarias gariepinus (Burchell, 1822) reared in concrete tanks. Aquac. Res. 2007, 38, 279–287. [Google Scholar] [CrossRef]
  78. Abdel-Warith, A.A.; Russell, P.M.; Davies, S.J. Inclusion of a commercial poultry by-product meal as a protein replacement of fish meal in practical diets for African catfish Clarias gariepinus (Burchell 1822). Aquac. Res. 2001, 32, 296–305. [Google Scholar] [CrossRef]
  79. Falaye, A.E.; Omoike, A.; Ajani, E.K.; Kolawole, O.T. Replacement of fishmeal using poultry offal meal in practical feeds for fry of the African catfish (Clarias gariepinus). Isr. J. Aquac.-Bamidgeh 2011, 63, 1–6. [Google Scholar] [CrossRef]
  80. Olugbenga, O. Utilisation of a poultry wastes meal as a replacement for fishmeal in diets of Clarias gariepinus. Afr. J. Fish. Aquat. Resour. Manag. 2018, 3, 1–7. [Google Scholar]
  81. Degani, G.; Revach, A. Digestive capabilities of three commensal fish species: Carp, Cyprinus carpio L., tilapia, Oreochromis aureus × O. niloticus, and African catfish, Clarias gariepinus (Burchell 1822). Aquac. Res. 1991, 22, 397–403. [Google Scholar] [CrossRef]
  82. García-Pérez, O.D.; Cruz-Valdez, J.C.; Ramírez-Martínez, C.; Villarreal-Cavazos, D.; Gamboa-Delgado, J. Exploring the contribution of dietary protein from poultry by-product meal and fish meal to the growth of catfish Ictalurus punctatus by means of nitrogen stable isotopes. Lat. Am. J. Aquat. Res. 2018, 46, 37–44. [Google Scholar] [CrossRef]
  83. Fagbenro, O.A.; Balogun, A.M.; Bello-Olusoji, O.A.; Fasakin, E.A. Dietary lysine requirement of the African catfish, Clarias gariepinus. J. Appl. Aquac. 1998, 8, 71–77. [Google Scholar] [CrossRef]
  84. Fagbenro, O.A.; Balogun, A.M.; Fasakin, E.A. Dietary methionine requirement of the African catfish, Clarias gariepinus. J. Appl. Aquac. 1999, 8, 47–54. [Google Scholar] [CrossRef]
  85. Elesho, F.E.; Sutter, D.A.H.; Swinkels, M.A.C.; Verreth, J.A.J.; Kröckel, S.; Schrama, J.W. Quantifying methionine requirement of juvenile African catfish (Clarias gariepinus). Aquaculture 2021, 532, 736020. [Google Scholar] [CrossRef]
  86. Khan, M.A.; Abidi, S.F. Optimum histidine requirement of fry African catfish, Clarias gariepinus (Burchell). Aquac. Res. 2009, 40, 1000–1010. [Google Scholar] [CrossRef]
  87. Fagbenro, O.A.; Nwanna, L.C. Dietary tryptophan requirement of the African catfish, Clarias gariepinus. J. Appl. Aquac. 1999, 9, 65–72. [Google Scholar] [CrossRef]
  88. Liland, N.S.; Araujo, P.; Xu, X.X.; Lock, E.; Radhakrishnan, G.; Prabhu, A.J.P.; Belghit, I. A meta-analysis on the nutritional value of insects in aquafeeds. J. Insects Food Feed 2021, 7, 743–759. [Google Scholar] [CrossRef]
  89. Hua, K. A meta-analysis of the effects of replacing fish meals with insect meals on growth performance of fish. Aquaculture 2021, 530, 735732. [Google Scholar] [CrossRef]
  90. Rapatsa, M.; Moyo, N. A review and meta-analysis of the effects of replacing fishmeal with insect meals on growth of tilapias and sharptooth catfish. Aquac. Nutr. 2022, 2022, 9367587. [Google Scholar] [CrossRef]
  91. Henry, M.; Gasco, L.; Piccolo, G.; Fountoulaki, E. Review on the use of insects in the diet of farmed fish: Past and future. Anim. Feed Sci. Technol. 2015, 203, 1–22. [Google Scholar] [CrossRef]
  92. Gougbedji, A.; Detilleux, J.; Lalèyè, P.A.; Francis, F.; Caparros Megido, R. Can insect meal replace fishmeal? A meta-analysis of the effects of black soldier fly on fish growth performances and nutritional values. Animals 2022, 15, 1700. [Google Scholar] [CrossRef]
  93. Priyadarshana, K.C.; Ruwandeepika, D. Substitution of fishmeal with black soldier fly Hermetia illucens Linnaeus, 1758 larvae in finfish aquaculture—A review. Asian Fish. Sci. 2021, 34, 114–126. [Google Scholar] [CrossRef]
  94. Barragan-Fonseca, K.B.; Dicke, M.; van Loon, J.J.A. Nutritional value of the black soldier fly (Hermetia illucens L.) and its suitability as animal feed—A review. J. Insects Food Feed 2017, 3, 105–120. [Google Scholar] [CrossRef]
  95. Mohd, N.; Firdaus, T.; Hasniyati, A. The effect of dietary cricket meal (Gryllus bimaculatus) on growth performance, antioxidant enzyme activities, and haematological response of African catfish (Clarias gariepinus). Fish Physiol. Biochem. 2016, 42, 1143–1155. [Google Scholar] [CrossRef]
  96. Taufek, N.M.; Muin, H.; Raji, A.A.; Alias, Z.; Razak, S.A. Potential of field crickets meal (Gryllus bimaculatus) in the diet of African catfish (Clarias gariepinus). J. Appl. Anim. Res. 2018, 2119, 541–546. [Google Scholar] [CrossRef] [Green Version]
  97. Alegbeleye, W.O.; Obasa, S.O.; Olude, O.O.; Otubu, K.; Jimoh, W. Preliminary evaluation of the nutritive value of the variegated grasshopper (Zonocerus variegatus L.) for African catfish Clarias gariepinus. Aquac. Res. 2012, 43, 412–420. [Google Scholar] [CrossRef]
  98. Fasakin, E.A.; Balogun, A.M.; Ajayi, O.O. Evaluation of full-fat and defatted maggot meals in the feeding of clariid catfish Clarias gariepinus fingerlings. Aquac. Res. 2003, 34, 733–738. [Google Scholar] [CrossRef]
  99. Kurbanov, A.R.; Milusheva, R.Y.; Rashidova, S.S.; Kamilov, B.G. Effect of replacement of fish meal with silkworm (Bombyx mori) pupa protein on the growth of Clarias gariepinus fingerling. Int. J. Fish. Aquat. Stud. 2015, 2, 25–27. [Google Scholar]
  100. Ng, W.K. Potential of mealworm (Tenebrio molifor) as an alternative protein source in practical diets for African catfish, Clarias gariepinus. Aquac. Res. 2001, 32, 273–280. [Google Scholar] [CrossRef]
  101. Grace, O.I. Effects of grasshopper meal in the diet of Clarias gariepinus fingerlings. J. Aquac. Res. Dev. 2015, 6, 321. [Google Scholar] [CrossRef] [Green Version]
  102. Taufek, N.M.; Muin, H.; Raji, A.A.; Shaharudin, A.; Yusof, H.M. Apparent digestibility coefficients and amino acid availability of cricket meal, Gryllus bimaculatus, and fishmeal in African catfish, Clarias gariepinus, diet. J. World Aquac. Soc. 2016, 47, 798–805. [Google Scholar] [CrossRef]
  103. Adeoye, A.A.; Akegbejo-samsons, Y.; Fawole, F.J.; Davies, S.J. Preliminary assessment of black soldier fly (Hermetia illucens) larval meal in the diet of African catfish (Clarias gariepinus): Impact on growth, body index, and hematological parameters. J. World Aquac. Soc. 2020, 51, 1024–1033. [Google Scholar] [CrossRef]
  104. Azri, N.A.M.; Chun, L.K.; Hasan, H.A.; Jaya-Ram, A.; Kari, Z.A.; Hamid, N.K.A. The effects of partial replacement of fishmeal with Hermetia meal on the growth and fatty acid profile of African catfish fry. Agric. Rep. 2022, 1, 17–27. [Google Scholar]
  105. Fawole, F.J.; Adeoye, A.A.; Tiamiyu, L.O.; Ajala, K.I.; Obadara, S.O.; Ganiyu, I.O. Substituting fishmeal with Hermetia illucens in the diets of African catfish (Clarias gariepinus): Effects on growth, nutrient utilization, haemato-physiological response, and oxidative stress biomarker. Aquaculture 2020, 518, 734849. [Google Scholar] [CrossRef]
  106. Gana, A.B.; Tijani, S.; Ibrahim, R. Nutrient utilization, haematological indices and carcass compositions of heteroclarias fingerlings fed Hermetia illucens (Linnaeus, 1758) larvae meal. Int. J. Fish. Aquat. Stud. 2020, 8, 42–48. [Google Scholar]
  107. Elesho, F.E.; Kröckel, S.; Sutter, D.A.H.; Nuraini, R.; Chen, I.J.; Verreth, J.A.J.; Schrama, J.W. Effect of feeding level on the digestibility of alternative protein-rich ingredients for African catfish (Clarias gariepinus). Aquaculture 2021, 544, 737108. [Google Scholar] [CrossRef]
  108. Anvo, M.P.M.; Aboua, B.R.D.; Compaoré, I.; Sissao, R.; Zoungrana-Kaboré, C.Y.; Kouamelan, E.P.; Toguyéni, A. Fish meal replacement by Cirina butyrospermi caterpillar’s meal in practical diets for Clarias gariepinus fingerlings. Aquac. Res. 2017, 48, 5243–5250. [Google Scholar] [CrossRef]
  109. Kroeckel, S.; Harjes, A.G.E.; Roth, I.; Katz, H.; Wuertz, S.; Susenbeth, A.; Schulz, C. When a turbot catches a fly: Evaluation of a pre-pupae meal of the black soldier fly (Hermetia illucens) as fish meal substitute—Growth performance and chitin degradation in juvenile turbot (Psetta maxima). Aquaculture 2012, 364–365, 345–352. [Google Scholar] [CrossRef]
  110. St-Hilaire, S.; Sheppard, C.; Tomberlin, J.K.; Irving, S.; Newton, L.; McGuire, M.A.; Mosley, E.E.; Hardy, R.W.; Sealey, W. Fly prepupae as a feedstuff for rainbow trout, Oncorhynchus mykiss. J. World Aquac. Soc. 2007, 38, 59–67. [Google Scholar] [CrossRef]
  111. Shiau, S.Y.; Yu, Y.P. Dietary supplementation of chitin and chitosan depresses growth in tilapia, Oreochromis niloticus × O. aureus. Aquaculture 1999, 179, 439–446. [Google Scholar] [CrossRef]
  112. Fontes, T.V.; Oliveira, K.R.B.; Almeida, I.L.G.; Orlando, T.M.; Borges, R.P.; Costa, D.V.; Rosa, P.V. Digestibility of insect meals for Nile tilapia fingerlings. Animals 2019, 9, 181. [Google Scholar] [CrossRef] [Green Version]
  113. Ogunji, J.O.; Iheanacho, S.C.; Abe, G.A.; Ikeh, O.R. Assessing effects of substituting dietary fish meal with boiled donkey and cow blood meal on growth performance and digestive enzyme activities of Clarias gariepinus juvenile. J. World Aquac. Soc. 2020, 51, 1066–1079. [Google Scholar] [CrossRef]
  114. Ogunji, J.; Iheanacho, S. Alternative protein source: Acceptability of cow blood meal in place of fish meal assessed via growth, antioxidant enzymes functions and haematological response in Clarias gariepinus (Burchell, 1822). Aquac. Res. 2021, 52, 2651–2661. [Google Scholar] [CrossRef]
  115. Olukunle, O.A.; Ogunsanmi, A.O.; Taiwo, V.O.; Samuel, A.A. The nutritional value of cow blood meal and its effects on growth performance, haematology and plasma enzymes of hybrid catfish. Trop. J. Anim. Sci 2002, 5, 75–85. [Google Scholar] [CrossRef]
  116. Otubusin, S.O. Effects of different levels of blood meal in pelleted feeds on tilapia, Oreochromis niloticus, production in floating bamboo net-cages. Aquaculture 1987, 65, 263–266. [Google Scholar] [CrossRef]
  117. El-Sayed, A.F.M. Total replacement of fish meal with animal protein sources in Nile tilapia, Oreochromis niloticus (L.), feeds. Aquac. Res. 1998, 29, 275–280. [Google Scholar] [CrossRef] [Green Version]
  118. Kirimi, J.G.; Musalia, L.M.; Magana, A.; Munguti, J.M. Performance of Nile tilapia (Oreochromis niloticus) fed diets containing blood meal as a replacement of fish meal. J. Agric. Sci. 2016, 8, 79–87. [Google Scholar] [CrossRef]
  119. Nwanna, L.C.; Adebayo, I.A.; Omitoyin, B.O. Phosphorus requirements of African catfish, Clarias gariepinus, based on broken-line regression analysis methods. ScienceAsia 2009, 35, 227–233. [Google Scholar] [CrossRef]
  120. Nwanna, L.; Oni, O. Determination of optimum calcium and phosphorous ratio for the production of African catfish Clarias gariepinus (Burchell, 1822). J. Appl. Sci. Environ. Manag. 2018, 22, 689. [Google Scholar] [CrossRef]
  121. Lall, S.P.; Kaushik, S.J. Nutrition and metabolism of minerals in fish. Animals 2021, 11, 2711. [Google Scholar] [CrossRef]
  122. Sugiura, S.H.; Babbitt, J.K.; Dong, F.M.; Hardy, R.W. Utilization of fish and animal by-product meals in low-pollution feeds for rainbow trout Oncorhynchus mykiss (Walbaum). Aquac. Res. 2000, 31, 585–593. [Google Scholar] [CrossRef]
  123. Lazzari, R.; Baldisserotto, B. Nitrogen and phosphorus waste in fish farming. Bol. Do Inst. Pesca 2008, 34, 591–600. [Google Scholar]
  124. Munguti, J.M.; Kirimi, J.G.; Obiero, K.O.; Ogello, E.O.; Kyule, D.N.; Liti, D.M.; Musalia, L.M. Aqua-feed wastes: Impact on natural systems and practical mitigations—A review. J. Agric. Sci. 2021, 13, 111. [Google Scholar] [CrossRef]
  125. Teodósio, R.; Engrola, S.; Colen, R.; Masagounder, K.; Aragão, C. Optimizing diets to decrease environmental impact of Nile tilapia (Oreochromis niloticus) production. Aquac. Nutr. 2020, 26, 422–431. [Google Scholar] [CrossRef]
  126. Turcios, A.E.; Papenbrock, J. Sustainable treatment of aquaculture effluents—What can we learn from the past for the future? Sustainability 2014, 6, 836–856. [Google Scholar] [CrossRef] [Green Version]
  127. Graber, A.; Junge, R. Aquaponic systems: Nutrient recycling from fish wastewater by vegetable production. Desalination 2009, 246, 147–156. [Google Scholar] [CrossRef]
  128. Seawright, D.E.; Stickney, R.R.; Walker, R.B. Nutrient dynamics in integrated aquaculture-hydroponics systems. Aquaculture 1998, 160, 215–237. [Google Scholar] [CrossRef]
  129. Delaide, B.; Delhaye, G.; Dermience, M.; Gott, J.; Soyeurt, H.; Jijakli, M.H. Plant and fish production performance, nutrient mass balances, energy and water use of the PAFF Box, a small-scale aquaponic system. Aquac. Eng. 2017, 78, 130–139. [Google Scholar] [CrossRef]
  130. Suhl, J.; Dannehl, D.; Kloas, W.; Baganz, D.; Jobs, S.; Scheibe, G.; Schmidt, U. Advanced aquaponics: Evaluation of intensive tomato production in aquaponics vs. conventional hydroponics. Agric. Water Manag. 2016, 178, 335–344. [Google Scholar] [CrossRef]
  131. Villarroel, M.; Alvariño, J.M.R.; Duran, J.M. Aquaponics: Integrating fish feeding rates and ion waste production for strawberry hydroponics. Span. J. Agric. Res. 2011, 9, 537. [Google Scholar] [CrossRef]
  132. Robaina, L.; Pirhonen, J.; Mente, E.; Sánchez, J.; Goosen, N. Fish diets in aquaponics. In Aquaponics Food Production Systems; Springer: Cham, Switzerland, 2019; pp. 333–352. [Google Scholar] [CrossRef] [Green Version]
  133. Roy, K.; Kajgrova, L.; Mraz, J. TILAFeed: A bio-based inventory for circular nutrients management and achieving bioeconomy in future aquaponics. N. Biotechnol. 2022, 70, 9–18. [Google Scholar] [CrossRef]
  134. da Silva Cerozi, B.; Fitzsimmons, K. Effect of dietary phytase on phosphorus use efficiency and dynamics in aquaponics. Aquac. Int. 2017, 25, 1227–1238. [Google Scholar] [CrossRef]
  135. Stoyanova, S.; Sirakov, I.; Velichkova, K.; Ali, M. Effect of feed protein level on water chemical and technological parameters of a recirculating aquaponics system for carp (Cyprinus carpio L.) and lettuce (Lactuca sativa L.) farming. Turk. J. Fish. Aquat. Sci. 2019, 19, 885–891. [Google Scholar] [CrossRef]
  136. Strauch, S.M.; Wenzel, L.C.; Bischoff, A.; Dellwig, O.; Klein, J.; Schüch, A.; Wasenitz, B.; Palm, H.W. Commercial African catfish (Clarias gariepinus) recirculating aquaculture systems: Assessment of element and energy pathways with special focus on the phosphorus cycle. Sustainability 2018, 10, 1805. [Google Scholar] [CrossRef] [Green Version]
  137. Liland, N.S.; Biancarosa, I.; Araujo, P.; Biemans, D.; Bruckner, C.G.; Waagbø, R.; Torstensen, B.E.; Lock, E.J. Modulation of nutrient composition of black soldier fly (Hermetia illucens) larvae by feeding seaweed-enriched media. PLoS ONE 2017, 12, e0183188. [Google Scholar] [CrossRef] [PubMed] [Green Version]
  138. Tacon, A.G.J.; Metian, M. Global overview on the use of fish meal and fish oil in industrially compounded aquafeeds: Trends and future prospects. Aquaculture 2008, 285, 146–158. [Google Scholar] [CrossRef]
  139. Deutsch, L.; Gra, S.; Folke, C.; Troell, M.; Huitric, M. Feeding aquaculture growth through globalization: Exploitation of marine ecosystems for fishmeal. Glob. Environ. Chang. 2007, 17, 238–249. [Google Scholar] [CrossRef]
  140. Marsh, L.; Subler, S.; Mishra, S.; Marini, M. Suitability of aquaculture effluent solids mixed with cardboard as a feedstock for vermicomposting. Bioresour. Technol. 2005, 96, 413–418. [Google Scholar] [CrossRef] [PubMed]
  141. Monsees, H.; Keitel, J.; Paul, M.; Kloas, W.; Wuertz, S. Potential of aquacultural sludge treatment for aquaponics: Evaluation of nutrient mobilization under aerobic and anaerobic conditions. Aquac. Environ. Interact. 2017, 9, 9–18. [Google Scholar] [CrossRef]
  142. Goddek, S.; Delaide, B.P.L.; Joyce, A.; Wuertz, S.; Jijakli, M.H.; Gross, A.; Eding, E.H.; Bläser, I.; Reuter, M.; Keizer, L.C.P.; et al. Nutrient mineralization and organic matter reduction performance of RAS-based sludge in sequential UASB-EGSB reactors. Aquac. Eng. 2018, 83, 10–19. [Google Scholar] [CrossRef]
  143. Tschirner, M.; Simon, A. Influence of different growing substrates and processing on the nutrient composition of black soldier fly larvae destined for animal feed. J. Insects Food Feed 2015, 1, 249–259. [Google Scholar] [CrossRef]
  144. Abd El-Hack, M.E.; Shafi, M.E.; Alghamdi, W.Y.; Abdelnour, S.A.; Shehata, A.M.; Noreldin, A.E.; Ashour, E.A.; Swelum, A.A.; Al-sagan, A.A.; Alkhateeb, M.; et al. Black soldier fly (Hermetia illucens) meal as a promising feed ingredient for poultry: A comprehensive review. Agriculture 2020, 10, 339. [Google Scholar] [CrossRef]
  145. Schmitt, E.; Belghit, I.; Johansen, J.; Leushuis, R.; Lock, E.J.; Melsen, D.; Ramasamy Shanmugam, R.K.; Van Loon, J.; Paul, A. Growth and safety assessment of feed streams for black soldier fly larvae: A case study with aquaculture sludge. Animals 2019, 9, 189. [Google Scholar] [CrossRef] [PubMed] [Green Version]
  146. Zhang, Z.; Chen, L.; Yang, K.; Wang, T.; Wang, Y.; Jia, Y.; Yin, Y.; Gu, P.; Miao, H. Toxic effects of industrial flocculants addition on bioconversion of black soldier fly larvae (Hermetia illucens L.). Insects 2022, 13, 683. [Google Scholar] [CrossRef] [PubMed]
Figure 1. Dissolved plant macronutrients (A) total inorganic nitrogen (TIN), (B) soluble reactive phosphorus (SRP), (C) potassium (K), (D) magnesium (Mg), (E) calcium (Ca) and (F) sulfur (S) in RAS water. Error bars represent standard deviations; different letters in each column of the tables below the graphs indicate a significant difference for each time point between groups (p < 0.05); n = 4.
Sustainability 14 14252 g001
Figure 2. Dissolved micronutrients (A) boron (B), (B) iron (Fe), (C) sodium (Na), (D) copper (Cu), (E) manganese (Mn) and (F) zinc (Zn) in RAS water. Error bars represent standard deviations; different letters in each column of the tables below the graphs indicate a significant difference for each time point between groups (p < 0.05); n = 4.
Sustainability 14 14252 g002
Figure 3. Comparison of growth performance between African catfish and Nile tilapia across the experimental diets characterized by (A) initial body weight (n = 120), (B) final body weight (n = 99–120), (C) body weight gain (n = 4), (D) feed conversion ratio (FCR) (n = 4), (E) specific growth rate (SGR) (n = 4) and (F) protein efficiency ratio (PER) (n = 4); n.s. (non-significant); asterisks indicate a significant difference between groups (p < 0.05).
Sustainability 14 14252 g003
Figure 4. Comparison of the development of cumulative dissolved (A) total inorganic nitrogen (TIN), (B) soluble reactive phosphorus (SRP) and (C) potassium (K) production per g of feed input between African catfish and Nile tilapia for each of the experimental diets; (1) FM, (2) PM, (3) BSF, (4) PBM; n.s. (non-significant); asterisks indicate a significant difference between groups (p < 0.05); n = 4.
Sustainability 14 14252 g004
Figure 5. Comparison of (A) feces DM recovery (g/kg of feed administered) and (B) feces nutrient composition (crude protein, total amino acids, essential amino acids, non-essential amino acids, crude fat, crude fiber, ash, starch, nitrogen free extract) between Nile tilapia and African catfish; n.s. (non-significant); asterisks indicate a significant difference between groups (p < 0.05); n = 4.
Sustainability 14 14252 g005
Table 1. Experimental diet formulation, ingredient costs, proximate composition, essential amino acid composition and mineral composition.
Ingredient Composition (% Incorporation)Experimental Diets
FMBSFPBMPM
Fish meal51.0---
Black soldier fly larvae meal-61.6--
Poultry blood meal--37.2-
Poultry meal---56.4
Wheat bran29.819.939.426.0
Corn meal11.011.011.011.0
Vitamin and mineral premix1.01.01.01.0
Dicalcium phosphate (DCP)1.21.21.21.2
Fish oil3.03.03.03.0
Poultry fat3.02.37.21.4
Ingredient cost (EUR/kg)1.111.990.720.72
Proximate composition (%—as fed) 1
Dry matter (DM)91.90 ± 0.1092.30 ± 0.1091.60 ± 0.1093.05 ± 0.15
Crude protein (N × 6.25) (CP)40.30 ± 0.4040.35 ± 0.0540.90 ± 0.1043.70 ± 0.10
Crude fat (CF)11.55 ± 0.1511.10 ± 0.2011.60 ± 0.1011.85 ± 0.25
Crude fiber (CFB)2.85 ± 0.058.05 ± 0.154.20 ± 0.003.10 ± 0.00
Ash11.65 ± 0.058.25 ± 0.054.35 ± 0.0510.85 ± 0.05
Starch12.05 ± 0.4512.65 ± 0.2513.45 ± 0.059.00 ± 1.00
Nitrogen-free extract (NFE) 225.55 ± 0.0524.55 ± 0.5530.55 ± 0.3523.55 ± 0.45
Gross energy (GE) (MJ/kg) 318.48 ± 0.0318.14 ± 0.0019.49 ± 0.0019.05 ± 0.05
P/E ratio (g protein/MJ GE)21.81 ± 0.0322.25 ± 0.0320.98 ± 0.0522.93 ± 0.00
Essential amino acids (EAAs) (%—as fed)
Arginine (Arg)2.481.882.323.07
Histidine (His)1.241.182.070.99
Isoleucine (Ile)1.791.591.711.60
Leucine (Leu)3.202.524.242.96
Lysine (Lys)3.111.913.222.51
Methionine (Met)1.100.530.530.78
Phenylalanine (Phe)1.711.432.431.67
Threonine (Thr)1.751.471.961.63
Tryptophan (Trp)0.510.530.770.37
Valine (Val)1.861.892.291.71
Met + Cys1.530.851.091.26
Phe + Tyr2.923.063.422.85
Minerals (g/kg—as fed)
Ca26.7114.225.7227.60
P19.1212.107.8318.64
S4.992.983.434.34
Mg2.213.481.411.76
Fe0.310.160.850.13
Na3.270.931.252.78
K8.5712.635.957.68
Al0.250.040.010.02
Zn0.0890.1510.0550.092
Mn0.0470.2420.0500.046
Cu0.0150.0210.0140.018
1 Analyzed in duplicate; percentages given on as-fed basis; values represent means ± standard deviations. 2 NFE = 100% − (% CP + % CF + % CFB + % ash + % moisture). 3 Calculated using the factors 17.15, 23.64, 39.54 MJ/kg for NFE (carbohydrates), CP and CF, respectively [63].
Table 2. Experimental rearing conditions.
FMBSFPBMPM
O2 (mg/L) 17.50 ± 0.167.58 ± 0.197.55 ± 0.137.53 ± 0.14
Temperature (°C) 126.6 ± 0.7026.7 ± 0.8826.8 ± 0.6026.7 ± 0.63
pH 17.88 ± 0.267.73 ± 0.477.90 ± 0.257.72 ± 0.44
Conductivity (µS/cm) 1980 ± 64.021014 ± 85.34972 ± 59.111011 ± 83.45
NH4+-N (mg/L) 20.28 ± 0.170.30 ± 0.160.26 ± 0.160.27 ± 0.14
NO2-N (mg/L) 2<0.05<0.05<0.05<0.05
Values represent means ± standard deviations; n = 4. 1 Measured once daily before water exchange and feeding (n = 196). 2 Sampled once weekly before water exchange and feeding (n = 32).
Table 3. Fish performance indices and feed costs.
Fish Performance
FMBSFPBMPM
Survival (%) A100.0 ± 0.0 a100.0 ± 0.0 a99.2 ± 1.7 a99.2 ± 1.7 a
Initial body weight (g) C11.64 ± 1.42 a11.52 ± 1.35 a11.21 ± 1.34 a11.14 ± 1.39 b
Final body weight (g) B38.02 ± 9.97 a24.77 ± 7.01 b22.17 ± 4.98 c34.82 ± 9.64 a
BWG (g) 1,A26.38 ± 0.27 a13.25 ± 0.08 c10.96 ± 0.15 d23.69 ± 0.86 b
Initial total length (cm) C11.96 ± 0.54 a11.98 ± 0.51 a11.85 ± 0.51 a11.85 ± 0.53 a
Final total length (cm) C18.23 ± 1.52 a15.77 ± 1.44 b15.40 ± 1.14 b17.74 ± 1.61 a
LG (cm) 2,A6.27 ± 0.10 a3.79 ± 0.08 c3.50 ± 0.07 d5.89 ± 0.14 b
Initial biomass (g) A349 ± 9 a345 ± 10 a336 ± 6 a334 ± 6 a
Final biomass (g) A1141 ± 9 a743 ± 7 c660 ± 8 d1036 ± 17 b
Feed administered (g—as is)578578578578
MDR (% biomass/d) 3,D1.74 ± 0.36 c2.20 ± 0.45 b2.39 ± 0.51 a1.84 ± 0.37 c
FCR (as fed) 4,A0.73 ± 0.01 d1.45 ± 0.01 b1.76 ± 0.02 a0.81 ± 0.03 c
FCR (DM basis) 4,A0.67 ± 0.01 d1.34 ± 0.01 b1.61 ± 0.02 a0.76 ± 0.03 c
SGR 5,A2.42 ± 0.05 a1.56 ± 0.04 c1.39 ± 0.01 d2.33 ± 0.03 b
CF 6,B0.62 ± 0.03 a0.62 ± 0.04 a0.60 ± 0.03 b0.61 ± 0.03 ab
PER 7,A3.40 ± 0.03 a1.71 ± 0.01 c1.39 ± 0.02 d2.81 ± 0.10 b
TGC 8,A0.84 ± 0.02 a0.50 ± 0.01 c0.43 ± 0.00 d0.79 ± 0.02 b
Feed ingredient cost (EUR/kg body weight gain) A0.81 ± 0.01 c2.89 ± 0.02 a1.27 ± 0.02 b0.59 ± 0.02 d
Values represent means ± standard deviations; means in rows with different superscript letters are significantly different (p < 0.05). A n = 4; B n = 119–120; C n = 120; D n = 196. 1 BWG—mean body weight gain (g) = final mean body weight (g) − initial mean body weight (g). 2 LG—body length gain (cm) = final mean body length (cm) − initial mean body length (cm). 3 MDR—mean daily ration (%/d) = sum (ri × 100)/trial duration (days); where i = day of trial (1–49) such that ri = ration (g)/biomass (g) of day i. 4 FCR—feed conversion ration = total feed fed per individual (g as fed or DM)/[final mean body weight (g) − initial mean body weight (g)]. 5 SGR—specific growth rate = [[ln (final mean body weight(g)) − ln (initial mean body weight (g))]/trial duration (days)] × 100. 6 CF—condition factor = (body weight (g)/total length (cm)3) × 100. 7 PER—protein efficiency ratio = (mean individual body weight gain (g)/CP fed per individual (g)). 8 TGC—thermal growth coefficient = 1000 × (final body weight (g) 1/3 − initial body weight (g) 1/3) × (trial duration (days) × average temperature (°C)) [70].
Table 4. Feces proximate, amino acid, and mineral composition (DM basis).
Proximate Composition (%)Feces
FMBSFPBMPM
Crude protein (CP)14.50 ± 0.22 c28.10 ± 0.45 b51.43 ± 1.37 a14.85 ± 0.66 c
Crude fat (CF)3.05 ± 0.13 b4.95 ± 0.41 a2.08 ± 0.60 c3.70 ± 0.14 b
Crude fiber (CFB)15.18 ± 0.55 c26.63 ± 0.74 a12.03 ± 0.53 d17.33 ± 0.13 b
Ash21.78 ± 0.13 a9.68 ± 0.31 c5.25 ± 0.24 d14.65 ± 0.62 b
Starch1.98 ± 0.10 b3.40 ± 0.43 a1.58 ± 0.30 b2.28 ± 0.40 b
Nitrogen-free extract (NFE)45.50 ± 0.85 b30.65 ± 0.19 c29.23 ± 1.90 c49.48 ± 1.36 a
Gross energy (GE) (MJ/kg)12.44 ± 0.07 d13.86 ± 0.26 b17.99 ± 0.21 a13.46 ± 0.11 c
P/E ratio (g protein/MJ GE)11.66 ± 0.22 c20.28 ± 0.24 b28.59 ± 0.84 a11.03 ± 0.51 c
EAAs/NEAAs (%)
Arginine (Arg)0.61 ± 0.02 b0.67 ± 0.02 b2.62 ± 0.09 a0.75 ± 0.09 b
Histidine (His)0.29 ± 0.02 c0.67 ± 0.03 b2.87 ± 0.11 a0.23 ± 0.01 d
Isoleucine (Ile)0.48 ± 0.02 d0.84 ± 0.05 b2.21 ± 0.09 a0.61 ± 0.03 c
Leucine (Leu)0.71 ± 0.03 d1.32 ± 0.07 a5.16 ± 1.60 a0.96 ± 0.04 c
Lysine (Lys)0.46 ± 0.04 c0.77 ± 0.04 b3.94 ± 0.10 a0.47 ± 0.02 c
Methionine (Met)0.33 ± 0.01 b0.29 ± 0.02 c0.63 ± 0.02 a0.21 ± 0.01 d
Phenylalanine (Phe)0.56 ± 0.01 c0.88 ± 0.05 b3.36 ± 0.14 a0.65 ± 0.04 c
Threonine (Thr)0.49 ± 0.02 d0.79 ± 0.03 b2.57 ± 0.08 a0.64 ± 0.03 c
Tryptophan (Trp)0.18 ± 0.01 c0.31 ± 0.01 b1.08 ± 0.05 a0.19 ± 0.01 c
Valine (Val)0.56 ± 0.02 d1.13 ± 0.05 b3.29 ± 0.20 a0.78 ± 0.06 c
Sum EAAs4.68 ± 0.18 c7.64 ± 0.34 b27.71 ± 2.00 a5.46 ± 0.32 bc
Alanine (Ala)0.79 ± 0.02 c1.36 ± 0.04 b4.18 ± 0.11 a0.86 ± 0.04 c
Cysteine (Cys)0.22 ± 0.01 c0.24 ± 0.01 c0.76 ± 0.01 a0.34 ± 0.03 b
Glycine (Gly)1.01 ± 0.03 d1.49 ± 0.04 b2.15 ± 0.05 a1.12 ± 0.07 c
Proline (Pro)0.61 ± 0.02 d0.97 ± 0.05 b2.15 ± 0.04 a0.80 ± 0.05 c
Serine (Ser)0.52 ± 0.02 d0.81 ± 0.06 b2.15 ± 0.07 a0.66 ± 0.05 c
Aspartic acid (Asp) + asparagine (Asn)1.05 ± 0.04 c1.39 ± 0.09 b4.51 ± 0.15 a1.15 ± 0.06 c
Glutamic acid (Glu) + glutamine (Gln)1.21 ± 0.06 c1.63 ± 0.08 b5.31 ± 0.12 a1.32 ± 0.09 c
Tyrosine (Tyr)0.43 ± 0.03 b-1.05 ± 0.05 a0.53 ± 0.06 b
Sum NEAAs5.84 ± 0.17 d7.89 ± 0.35 b22.27 ± 0.56 a6.77 ± 0.42 c
Mineral composition (g/kg)
Ca72.48 ± 6.77 a31.11 ± 0.45 c14.67 ± 0.14 d53.62 ± 2.10 b
P33.58 ± 2.51 a13.60 ± 0.26 c9.67 ± 0.15 d25.21 ± 0.57 b
S2.94 ± 0.09 c3.16 ± 0.05 b5.56 ± 0.13 a3.00 ± 0.03 bc
Mg2.74 ± 0.10 a1.69 ± 0.04 b1.21 ± 0.02 c1.63 ± 0.04 b
Fe1.12 ± 0.06 b0.61 ± 0.05 c2.19 ± 0.03 a0.51 ± 0.02 d
Na1.07 ± 0.07 a0.60 ± 0.01 c0.38 ± 0.01 d0.77 ± 0.02 b
K0.84 ± 0.01 a0.79 ± 0.02 b0.43 ± 0.01 d0.55 ± 0.01 c
Al0.81 ± 0.04 a0.18 ± 0.01 b0.04 ± 0.00 d0.10 ± 0.01 c
Zn0.44 ± 0.05 b0.57 ± 0.02 a0.20 ± 0.01 c0.44 ± 0.03 b
Mn0.14 ± 0.01 b0.45 ± 0.01 a0.07 ± 0.00 d0.11 ± 0.01 c
Cu0.07 ± 0.00 a0.07 ± 0.01 a0.04 ± 0.00 b0.07 ± 0.00 a
Values represent means ± standard deviations; means in rows with different superscript letters are significantly different (p < 0.05).
Table 5. DM, nutrient, and GE recovery through feces collection expressed as % of the total amount of DM, the respective nutrient and energy fed throughout the trial (A), and as g per kg of feed fed (as is) (B).
Nutrient Recovery
FMBSFPBMPM
Feed administered (g—as is)578578578578
Feed administered (g DM)531533529538
Feces collected (g—as is)674 ± 13 c793 ± 30 b1063 ± 57 a664 ± 20 c
Feces collected (g DM)77.67 ± 1.17 b,c80.91 ± 2.48 b148.88 ± 8.15 a69.05 ± 3.29 c
(A) Recovery (% of the total amount of DM/the respective nutrient/energy fed throughout the trial)
DM14.63 ± 0.22 b,c15.24 ± 0.47 b28.04 ± 1.54 a13.00 ± 0.62 c
Crude protein4.84 ± 0.13 c9.75 ± 0.37 b32.41 ± 2.19 a4.06 ± 0.15 d
Crude fat3.55 ± 0.14 b6.24 ± 0.54 a4.60 ± 1.31 a,b3.73 ± 0.15 b
Crude fiber71.57 ± 2.59 b46.30 ± 1.63 c73.72 ± 4.17 ab66.77 ± 2.79 b
Ash25.13 ± 0.40 b16.43 ± 0.91 c31.12 ± 2.50 a16.13 ± 0.86 c
Starch2.20 ± 0.10 b3.77 ± 0.53 a3.01 ± 0.53 ab3.02 ± 0.57 a,b
NFE23.94 ± 0.60 a17.48 ± 0.54 b24.64 ± 2.02 a25.12 ± 1.69 a
Gross energy (MJ/kg)9.05 ± 0.16 c10.70 ± 0.39 b23.78 ± 1.38 a8.44 ± 0.41 c
(B) Recovery per kg of feed (as is) (g/kg)
DM134.43 ± 2.03 b,c140.03 ± 4.30 b257.66 ± 14.11 a119.50 ± 5.70 c
Crude protein19.49 ± 0.52 c39.35 ± 1.49 b132.55 ± 8.94 a17.73 ± 0.65 d
Crude fat4.10 ± 0.16 b6.93 ± 0.60 a5.34 ± 1.52 a,b4.42 ± 0.18 b
Crude fiber20.40 ± 0.74 c37.27 ± 1.31 a30.96 ± 1.75 b20.70 ± 0.86 c
Ash29.27 ± 0.47 a13.55 ± 0.75 c13.54 ± 1.09 c17.50 ± 0.93 b
Starch2.65 ± 0.13 b4.76 ± 0.67 a4.05 ± 0.71 a2.72 ± 0.51 b
NFE61.17 ± 1.52 b42.92 ± 1.32 c75.28 ± 6.17 a59.16 ± 3.98 b
Gross energy (MJ/kg)1.67 ± 0.03 c1.94 ± 0.07 b4.64 ± 0.27 a1.61 ± 0.08 c
Values represent means ± standard deviations; means in rows with different superscript letters are significantly different (p < 0.05).
Publisher’s Note: MDPI stays neutral with regard to jurisdictional claims in published maps and institutional affiliations.

