Article

Research on the Use of Aerial Scanning and Gis in the Design of Sustainable Agricultural Production Extension Works in an Agritourist Farm in Romania

1
Faculty of Agronomy, University of Craiova, A.I. Cuza No. 13, 200585 Craiova, Romania
2
Faculty of Management and Rural Tourism, Banat’s University of Agricultural Sciences and Veterinary Medicine “King Michael I of Romania” from Timisoara, Calea Aradului, No. 119, 300645 Timisoara, Romania
*
Authors to whom correspondence should be addressed.
Sustainability 2022, 14(21), 14219; https://doi.org/10.3390/su142114219
Submission received: 20 September 2022 / Revised: 28 October 2022 / Accepted: 28 October 2022 / Published: 31 October 2022
(This article belongs to the Special Issue Sustainable Agricultural Economy)

Abstract

:
The use of scanning technologies and digital photogrammetry with the help of drones in the field of agritourism activities in Romania is a topic of novelty, because all the data necessary for the implementation or development of such research can be collected very quickly and with maximum efficiency. The classic methods are cumbersome and with a high consumption of inputs, and human and financial resources. The case study presents a practical method of applying this technology in the case of the agritourist farm REMMAR, from Vâlcea county, Romania, which wants to expand its agricultural production capacity with ecological products. Graphic support was obtained by scanning or digitizing existing maps in the physical/printed format and by acquiring data of interest in the digital format by photogrammetric methods and aerial field scanning of the studied area. The original elements of the topic are: how to obtain images by using photogrammetric methods; developing the methodology of the research and the actual development, from setting the basic objectives to obtaining and presenting the final results; elaboration of the methodology of the needs analysis and designing the specific data model; designing and the practical implementation of the geographic information system in terms of structure, methods, and means of software implementation. The successful implementation of the system was achieved only under the conditions of the existence of a data model specific to the field of action, and first realizing the conceptual foundation of the applicable data model, which would allow the registration, storage, extraction, processing, and effective analysis of the data of interest. From a theoretical and practical point of view, the research has a unique character in Romania, because it presents for the first time the development of a standard methodology for the design, expansion, and promotion of agritourism farms. The built geographic information system (GIS) is an effective tool for the management and control of the quality and efficiency of works specific to sustainable agricultural production.

1. Introduction

The relevance of the topic in agritourism activities is determined by the decisive im-portance given to the efficiency of any economic activity, but especially of tourism, in the context of limited resources (quantitative and qualitative) [1]. Making the best decisions and taking the best measures involve accessing a large amount of information, analyzing, and synthesizing it [2]. To overcome these limitations, information processing and information technology are used in the decision-making process, and in particular information technology for decision support (SSD) [3]. A special category of existing decision support systems is the geographic information systems (GIS): systems that allow the definition and use of thematic maps that facilitate a multicriteria analysis, which is a very important aspect in the management of tourist and agritourism reception structures [4,5,6].
Starting from the main feature of geographical information systems (the ability to lo-cate various points of interest or objects in space), we considered that GIS find their applicability both globally or regionally, as well as in research that takes place on relatively small areas, such as design, development, and tourism promotion [7,8]. In this sense, in conjunction with the limited resources allocated to small-scale research, the current study presents how to approach, go through, and complete the working steps necessary to achieve the objectives, as well as the presentation of the main obtained results. The results of the research may be used in the future for the development of significant lines of photogrammetry in order to establish GIS databases for the design and expansion of agritourist farm and other activities in the field of tourism, regardless of their geographical location [9,10].
At the international level, due to the wide area of applicability of GIS and the accelerated development of related technologies, the need has arisen for the standardization and interconnection of working methods. Thus, given the existence of a communication standard, the information stored in the databases can be interconnected with other databases (even those of other manufacturers), but also with other types of software that can use geographic data (e.g., CAD type products) [11,12,13,14]. We are currently moving towards a common standard, which is reflected in the OpenGIS concept. It should be noted at the outset that OpenGIS is not a software product, nor a company name, a document, or a commodity. OpenGIS is a project that began in 1993 with the support of several US federal agencies and commercial organizations. OpenGIS is defined as transparent access to heterogeneous geographic (spatial) data resources and resource processing in a distributed (network) environment [15,16,17,18,19,20,21].
Based on the preconditions of the current research study, it was noted that SSD systems are a valuable resource for local authorities or for final beneficiaries of individuals who intend to design, expand, and/or promote tourism in an area or punctual promotion of a unit, regardless of its type: resort, hotel, tourist, or agritourist farm, etc.
GIS complement SSD systems and provide details on the spatial location of items of interest, regardless of their type: locations, relief details, details of unevenness and spatial accessibility, topographic and cadastral information, information on public transport and utility networks, etc. [1,9,22,23,24]. Although there are different approaches to SSD and GIS at the national/regional level, it has been found that there are no (or could not be identified) approaches at the local and/or individual level related to the needs of tourism design, extension, and promotion. Thus, the needs for the effective management and promotion of agritourist farms in Romania, a particularly important segment in national tourism, were identified. Their promotion must be carried out in accordance with the specific objectives at the national and European level, with the main impediment being the lack of specific methodologies or studies.
The lack of specific methodologies, studies, or research dedicated to agritourism was the basis for addressing this research topic, namely, a case study on the use of aerial scanning to develop a GIS database for the development and promotion of rural tourism and agritourism. The importance of this research topic is supported by the specifics of the final beneficiaries, who are usually natural persons or individual entrepreneurs who want to enter the field of tourism by setting up a tourist or agritourist farm. Often, their resources are limited (material, financial, time, knowledge), and the existence of specific methodologies, studies, and research (stages of estimating and carrying out activities) can contribute decisively to achieving the proposed objectives.
At the European level, strategies for the sustainable development of the rural regions have been developed [25]. Therefore, a major line of action for rural development is agritourism, which is also included in Romania’s National Strategy for Tourism Development 2019–2030. To support agritourism, funding lines for the establishment and the development of non-agricultural activities in rural areas have been identified and proposed at the national level.
However, specialists in the field claim that there is potential for the sustainable development of agritourism in Romania [26,27,28,29]. In recent years, agritourism has registered a significant increase, with addressability for both Romanian and foreign tourists. As a result of the conducted studies, it was found that in rural areas, the main forms of accommodation are agritourism boarding houses [30].
The COVID-19 pandemic and the restrictions imposed by the authorities have significantly influenced the profile and preferences of tourists. Thus, more and more tourists of all age groups prefer agritourism and areas where they can spend time in nature, away from the urban environment. They choose destinations that offer them a wide range of activities in nature, from walks to direct involvement in the activities of the host household [31].
In order to lay the foundations of a sustainable agritourism, it is essential to identify the preferences of tourists regarding activities, food, accommodation, etc. [32].
However, there are no studies with a macroeconomic approach to agritourism. There are various studies with a microeconomic approach, at the level of the agritourism unit, but there are very few studies with a macroeconomic approach, which correlates the development of agritourism with macroeconomic indicators, such as gross income per capita [33].
Agritourism is growing rapidly and requires modern means to effectively manage the land and available resources. Thus, this study aims to present, integrate, and use modern techniques (UAV flights, photogrammetry, GIS) for the sustainable development of agritourism and for the organization and monitoring of agritourism farms.
As a necessity of the lack of specific methodologies and studies in the field of tourism and agritourism, the fundamental objective is to develop and design a working methodology and a geographic information system that integrates various information and data types necessary for the design activities, extension, and tourist promotion of an agritourist farm in the Malaia–Vâlcea area, from forecast to post-factum measures.
Specifically, the study aims to analyze the opportunities for elaboration and implementation of a working methodology designed to support the design, extension, and tourism promotion of an agritourist farm. In order to fulfill the fundamental objective of the research topic, with applicability to the REMMAR agritourist farm located in Mălaia commune, Vâlcea county, Romania, it is necessary to achieve partial objectives, namely: the elaboration of the working model and testing its practical applicability through effective implementation; obtaining an orthophotoplan by using photogrammetric methods (orthophotoplan which will be the image support of GIS), and in fact three orthophotoplans will be obtained because this involves covering three distinct areas within the same research; design, validation, and implementation of a data model (database); implementation of the data model designed by using specialized software products.
The motivation of this research was the creation of a methodology for building a GIS, using some of the most efficient data collection devices, drones. This was a system that in the end proved very effective, because remarkable results were obtained by applying it in the first phase at the local level, the REMMAR guesthouse, following that after an appropriate improvement and calibration, it can be applied in any region of the country. The GIS contributed substantially to the improvement of the quality of decision-making management in terms of the design of the expansion and promotion of the agritourism activity carried out at the respective guesthouse. Additionally, through the use of high-performance work devices, a maximum yield and efficiency were obtained, in terms of the design system, compared to the classical methodology, which is very cumbersome and with a high consumption of material, monetary, and human resources. The methodology created by us is a high-performance one that can lead to considerable savings of money and working time (human resources), with the achievement of high precision in the design, which falls within the legal norms and regulations in Romania, and which can contribute decisively to pursuing the practice of sustainable agrotourism.

2. Materials and Methods

The theoretical, scientific, and material resources required to carry out the research activities can be classified as follows.
  • Equipment and software resources: existing equipment in the profile laboratories at the University of Craiova and INCESA—Research Hub in Applied Sciences; existing equipment within S.C. Info World S.R.L. (software developer with over 15 years of experience in the field); resources (documents, resources in digital format) available at the local authorities (City Hall); own equipment.
  • Facilities: access to the book fund of the University of Craiova and the University of Petroșani; access to public libraries, including in digital format (local and central libraries); access to the specialized library of S.C. Info World S.R.L.; access to Internet resources.
  • Financial resources: were not budgeted and are being assumed by the members of the research team.
The development of this research began with the detailing of the scientific importance of the addressed topic, and it continued with the establishment of the fundamental/general and specific/partial objectives, as well as the development of the planned activities. Various technical procedures and material resources (equipment, software, identified resources, etc.) were used in the research stages, as well as various methods of data collection: the interview method (individual and group), questionnaire method, group discussions (brainstorming), etc. [15,17,34].
In order to ensure the fulfillment of the research objectives, the stages of carrying out the activities were established as follows: [2,16,35,36,37,38,39].
Activity planning and establishing the necessary resources (equipment, software, data, etc.). In this stage, the following were achieved: activity planning; identifying the resources needed to carry out the activities.
Field stage: obtaining raw data by aerial photography. In this stage, the following were achieved: field marking of known coordinate points that would be used for georeferencing the obtained orthophotoplan; planning and performing the flight to obtain the photograms based on which the orthophotoplan would be generated.
Carrying out the analysis process to identify the data of interest. At this stage, the needs analysis process was carried out by: studying of similar situations/systems; application of questionnaires or by the interview method; inventory of information of interest.
Office stage: processing raw data and obtaining an orthophotoplan. In this stage, the data processing process took place through: use of raw data acquired (photograms); use of a software product for frame processing and obtaining an orthophotoplan; use of a software product for georeferencing the orthophotoplan.
Design and implementation of the data model (database). At this stage, the following took place: data model design process (database); the process of structuring input data; the process of structuring the output data (valid data, results); implementation of the established data model, by using a specialized software product; obtaining a functional information system.
Development of technical documentation and instructions for use. At this stage, the following were developed: technical documentation for the design of the geographical information system; manual/working procedures for the use of the geographical information system (case study).
The proposed objective was to create a GIS database to facilitate the design and expansion of an agritourist farm in the Mălaia–Vâlcea area. Thus, photogrammetric processing and GIS procedures were used to achieve the proposed objective.
In order to achieve the research objectives, certain specific needs were identified, as well as the main means of fulfillment, as follows: (Table 1, Table 2 and Table 3).

3. Results

The direct beneficiary of this case study is the REMMAR tourist boarding house, a boarding house operating in a single location (point called A—Village, with sublease A1—Headquarters) located in Mălaia commune, Vâlcea county. The owner wants both the extension of the activity in three other locations (points called B—Rudărașu, C—Față, respectively, D—Zăpodie), and the modification of the specific activity, so that the tourist boarding house can be transformed into an agritouristic farm. The owner wants, in a later stage (which is not the object of the activity of this research), to extend the activity in another five locations (called E—Padina, F—Căprărețe, G—Fântânele, H—Comandă, respectively, I—Vătășel) which are to be integrated with the first three locations. The extension of the activity in the five mentioned locations will be achieved by applying the procedures and methods designed in this research.
The following needs were identified during the planning of activities and the establishment of the resources necessary to carry out this work (Table 4).

3.1. Obtaining Raw Data by Aerial Photography

During this stage, the following were performed: marking (materialization) on the field of some control points that would be used for the georeferencing of the obtained orthophotoplan; determining the coordinates of the points marked on the ground; flights were planned and carried out to obtain the photograms on the basis of which the orthophotoplans will be generated; having three areas/locations of interest, three photogrammetric flights were performed [40,41,42,43].
Marking points on the ground: based on the recognition of the details of the land to be subject to aerial photography, it was decided to materialize the ground points by using FENO type terminals, metal bolts, as well as the use of existing elements that do not require additional markings (existing terminals, gutters, etc.). Even if the research did not require permanent marking of control points (temporary markings could be used), it was decided to materialize them for later use, in the design and execution of the works to extend the agritourist farm. For the easy recognition on photograms of the points marked on the ground, reference panels with a size of 50 × 50 cm, painted in two colors (white/red) [44,45,46,47] were made and used (by positioning centered on the ground markings). At the same time, for the areas that allowed, the marking was made directly on the ground, by applying a layer of paint (white, red). Disc-shaped ground markings with a radius of 15 cm and concentric red/black circles were occasionally used.
Determining the coordinates of the points marked on the ground.
The coordinates of the points were determined in the Stereogeographic 1970 coordinate system, by using the South S82 V type GNSS equipment by the RTK method using the recordings of the permanent stations Petroșani (PET2) and Horezu (HORE) (Figure 1).
Given that the target/target size of the pixel on the ground was about 3 cm and the accuracy of the GPS, it was decided to use the RTK method at the expense of the static method. The coordinates were determined for 23 points marked or identified on the ground and which provided visibility on the purchased photograms. The control points were arranged at the corners of the areas of interest, which will allow for the high precision georeferencing of the obtained orthophotoplans. The accuracy of determining the coordinates of the ground points was 1–2 cm and no compensation or accuracy calculations have been performed, as the aim was to obtain a ground resolution of 3 cm/pixel, so no such determination was warranted (Table 5).
At the time of the field measurements, landmarks were drawn up for the materialized points or natural points determined and used in the work.
Flight planning and execution (3 flights—one flight for each area of interest).
The purpose of each graphical data acquisition flight was to obtain data that met certain minimum technical and functional (content) requirements, such as: ensuring a resolution of the orthophotoplan of at least 3 cm/pixel; observance of the degree of lateral and longitudinal overlap (minimum 60°/70°); ensuring visibility on the ground.
Flight planning was completed with the licensed software product UgCS PRO. Within it, a flight plan was made for each area of interest, going through the following configuration steps: [19,49,50,51].
-
aircraft/UAV/drone model configuration and selection: DJI Mavic 2 PRO predefined profile; the profile includes the technical specifications provided by the manufacturer (battery details, GPS/GNSS, telemetry, speeds, limitations, etc.), specifications on the basis of which the flight plan will be generated (including limitations, restrictions, warnings).
-
flight type selection: photogrammetric/photogrammetry tool.
-
marking the area of interest: the area that is the subject of the flight: Google Imagery was used as a background map.
-
technical details configuration: flight speed: 7.00 m/s; return mode: adaptive; camera used: standard Mavic 2 PRO (no other attached camera used); ground resolution: 2.00 cm; longitudinal overlay: 70.00%; side overlay: 60.00%; avoid obstacles: YES; actions performed: at each point; altitude type: AGL (Above Ground Level); action at last point: Return to Home; camera actions:
  • angle: 90 degrees (vertical positioning).
  • self-timer photography: automatic mode (calculation based on speed and degree of longitudinal and lateral overlap).
Based on the configured flight parameters, UgCS will perform the necessary calculations to generate the flight plan (Figure 2, Figure 3 and Figure 4) and display the limitations and warnings in accordance with the profile of the aircraft. You can also view information about the distance to be traveled; the estimated flight time (a very important aspect especially regarding the flight autonomy of the drone, in case of such limitations/restrictions there is the possibility of dividing the flight into several flights); number of waypoints; minimum/maximum altitude; area covered; footprint of a photogram; number of passes/flights; number of photos to be taken; distance between 2 photos; etc. (Figure 5, Figure 6 and Figure 7) [52,53].
It is recommended to optimize the flight plan by positioning the flight routes parallel to the large side of the drawn surface [54,55]. Thus, the decrease of the planned flight time can be observed.
Following the introduction of these data and the calculations performed in the UgCS, the flight details were obtained as follows (Table 6).

3.2. Carrying Out the Analysis Process

The main purpose of the analysis process was to identify primarily the types of information of interest (because it was intended to design a flexible data model, which can be populated with various types of data) [56,57,58]. The needs analysis process took place in three major directions, as follows.
-
study of similar situations/systems: an attempt was made to analyze the geographical information systems with a similar purpose, but none were identified.
-
application of evaluation questionnaires or by the method of the interview: discussions (interviews) were held with the beneficiary and their other representatives to identify the needs that the future information system might meet; trips were made to places of interest to understand the concepts to be implemented; the collection of various existing documentation was carried out, including cadastral documentation, tourist promotion materials, sketches prepared by the beneficiary in order to present the concepts to be developed, etc.; discussions were held with people indirectly involved in the research (neighbors).
-
inventory of information of interest (brainstorming method): in order to identify the information of interest (real or presumed), group discussions were held with the owners of the agritourist farm in the area and with the representatives of the mayor’s office.

Obtained Results

Following the analysis stage, certain types of information of interest were identified.
Depending on the purpose of the information, internal: information that can be extracted and used strictly in the interest of the beneficiary (especially information referring to areas of interest); external: information that can be extracted and used by other beneficiaries (especially information on the component intended for tourism promotion of the Mălaia–Vâlcea area).
Depending on the goal, technical: information directly related to the activities carried out in the 3 areas of interest, as well as to the arrangements to be made in these areas; administrative: involving the registration, processing, management, and extraction of administrative data (data on buildings, their destination, data on how to organize spaces, etc.); financial: involving the registration, processing, management, and extraction of financial data (distribution of budgets by investment centers, records of taxes and authorizations, etc.); tourism promotion: involving the registration, processing, and management of data on the possibilities of tourism promotion of the area Mălaia–Vâlcea; other objectives not specified above.

3.3. Raw Data Processing and Image Obtaining (Orthophotoplan)

During this stage, the following activities were carried out for each of the three areas of interest: processing of raw data obtained in the field stage (sets of photograms); obtaining the main result sought: orthophotoplan (2D digital surface model); obtaining by-products: digital elevation model (DEM); digital model of the 3D surface; point cloud; KMZ map (Google Earth).
The main steps for processing raw data in Agisoft Metashape Professional are [43,54]:
(a) Loading photograms (in raw form) in the program—involves loading into the software the photograms obtained in the aerial photography stage. At this stage of processing, the actual loading of the photograms is not completed, but only references to them are created (Figure 8);
(b) Verifying the uploaded photograms and remove photograms that are of no interest in the processing—the list of uploaded photograms has been displayed in the workspace. At this moment, the photograms that are not of interest are removed (to optimize the consumption of resources necessary for processing);
(c) Photograms alignment and sorting—when loading photograms, they need to be sorted. At this point, the software determines the position and orientation of each photogram (based on the common points determined in the adjacent photograms) and generates a stray/scattered dot cloud pattern. This operation depends very much on the quality of the photograms and compliance with the requirements for transverse and longitudinal overlap, so that it is possible to remove or reposition photograms that do not meet the minimum quality requirements (Figure 9);
(d) Point cloud generation—during this stage, the point cloud is generated and visualized. Based on the estimated positions of the camera (at the time of recording the photograms), the photograms are combined to obtain a dense cloud of dots (which can be further processed or exported);
(e) Generation of the 3D polygonal model—is completed based on the data generated in the previous steps and based on the specified parameters (Figure 10). Surface type: height field—is the setting specific to wide planes (especially in the case of aerial photography); source data: dense cloud—the dense point cloud is used as a source because it aims to obtain an orthophotoplan with a high resolution; face count: high—specifies the maximum number of facets of the generated model; interpolation: enabled—so that any areas not covered by photograms will be generated by interpolation (depending on the information in the surrounding areas); however, areas may remain uncovered.
(f) Structure generation—a proper generation of the structure determines the way and quality of subsequent visualization of the generated model. Thus, the generation of the structure is conducted with the appropriate setting of the generation parameters (Figure 11). Mapping mode: adaptive orthophoto—objects are divided into flat/smooth sections and vertical segments, and this maintains the quality of processing for both smooth sections and vertical surfaces (buildings, walls, etc.); blending mode: mosaic—specifies how pixels of different values (from different photograms) will be combined in the final structure; enable color correction: true—useful option in case of major variations in brightness (also time consuming and hardware resources).
Note: we can notice that the processing resulted in a ground resolution of 2.2 cm/pixel (Figure 12).
Digital elevation model generation (DEM)—involves the generation of the digital elevation model based on the entered processing parameters (Figure 13). Coordinate system: WGS84; data source for generation: dense cloud of points; interpolation mode: active.
A DEM is a raster with elevation values that represents a land surface. The elevation model is used in various applications, such as: mapping, orthorectification, land classification, spatial planning, etc.
(g) Export results—allows the export of the entities obtained in the previous steps (Figure 14). Thus, it is possible to export both the main result followed (orthophotoplan), and the export of other products obtained such as point cloud, digital elevation model (DEM), map in KMZ format, etc.
At the same time, the software product used (Agisoft Metashape Professional) allows the export of an activity report that contains various information of interest of the processing research performed.
The following are some selective processing parameters and the results obtained for each of the 3 areas of interest (Table 7).

3.4. The Design of the Data Model (Database)

The design of the data model (database) was mainly based on the results of the analysis stage (applied questionnaires, group discussions, etc.). Based on these results, a structuring and filtering of the data of interest were performed, including the elimination of data that were not suitable for the design of a GIS (financial data, budgets, records of taxes and duties, etc.). The implementation of these data was not blocked, but it was left to the discretion of the system administrator because all this information could be recorded as attributes of the drawn vectors. At the same time, the research (and the final results to be submitted to the beneficiary) included data or processing that had not been directly requested, but which might serve the final purpose of the research.
The transposition of the data model within GIS was completed by defining and completing the attributes associated with each type of vector (of course, after vectorizing the elements of interest). The defined structures contained relational elements, so that the easy and efficient operation of the system was ensured (Figure 15).

3.5. Implementation of the Data Model (Database)

At this stage, the following activities were performed:
Georeferencing of orthophotoplans obtained previously (based on marked control points on the ground);
Tracing/vectorizing the elements of interest (polygon type, line, point);
Entering the related value sets (descriptive information, attributes).
Most of the vectorizations and processing in the study were based on resources that allocated a geographic reference space system (WGS84), but the results were handed over to the final beneficiary with both a geographic reference spatial system (WGS84) and a geographic reference system national projection (Stereo70). All operations and vectorizations were performed in the WGS84 system. All the elements were later projected into the Stereo70 system (using ArcToolbox) to be handed over to the beneficiary.
Georeferencing the map/orthophotoplan based on the points marked on the ground. ArcGIS for Desktop software version 10.3.1 was used to implement the case study (short presentation at: http://www.esri.com/library/brochures/pdfs/arcgis-desktop.pdf, accessed on 19 September 2022) [59].
The georeferencing of the maps/orthophotoplans was conducted based on the points marked on the ground (Figure 16), for which the coordinates were determined in the Stereo70 coordinate system and then transformed into the WGS84 system using ArtToolbox. The coordinates of the points of interest were determined by GPS measurements using the RTK method, with connection to the Petroșani (PET2) and Horezu (HORE) permanent stations.
In the GIS operation, resources were used (at different times) in both the geographic coordinate system and Stereo70 projection system\within ArcGIS (ArcToolbox).
Tracing/vectorizing elements of interest (polygon type, line, dot).
The vector data representation model is close to the model used to represent the map. GIS objects in the vector model are represented by a well-defined boundary in space. The position and shape of objects are represented using an X, Y coordinate system. There are three primary models of vectorization of elements of interest: point vector; line type vector; polygon type vector (Figure 17).
Basically, in the case study, the users or administrators of the system had the possibility to vectorize new elements of interest as follows: in the ArcCatalog application, a new shape element was added (or in a new database/personal geodatabase), when it was specified with its name, the type of vectors, the coordinate system, etc. At this point, the user had the possibility of vectorizing the elements.
At the same time, considering the tourist specificity of the research, which is characterized by large areas (outside the generated orthophotoplans), the research also used background maps (Basemap) accessible in ArcGIS (especially World Imagery).
Updating the data model (database) and content.
Users and/or the system administrator had the possibility to update at any time the implemented data model (database structure). Being an open system, it supported CRUD (Create/Read/Update/Delete) operations on data structures. These operations were performed by accessing the properties of an existing shapefile in ArcCatalog, at which point you could specify the names of the required fields, their data type, etc.
Following the updating of the structure of the data model (database), users had the opportunity to register new information of interest. Depending on the type of information, it could be entered both manually and by applying calculation formulas (e.g., lengths/distances, surfaces, determining coordinates, etc.) (Figure 18).
In case of using resources/vectors with a planimetric reference system, attributes such as surface, length, and perimeter can be calculated automatically by applying geometric calculation formulas. If the available resources are in geographic system, they can first be designed in planimetric system (using ArcGIS tools), and then the necessary calculations can be performed [20,60].
Resources used in the research
  • Orthophotoplan—orthophotoplans generated for the 3 areas of interest (A—Village, B—Rudărașu, D—Zăpodie); WGS84 system (and georeferenced in Stereo70);
  • Thematic layers—configured and marked according to research requirements. Examples: locations, constructions, arrangements, connection, access roads, routes, etc.;
  • Basemap—World Imagery;
  • Digital Elevation Model (DEM)—generated from photogrammetric processing;
  • Shapefile public resources—administrative boundaries (county, ATU), rivers, roads;
  • Shapefile own resources—an integral part of cadastral documentation;
  • Various other available resources (tourist attractions, points of interest, etc.).

3.6. Analytical Operation of the System

Given that a GIS needs to address a variety of issues, it needs to be particularly flexible in recording, storing, searching, retrieving, processing, and presenting information of interest.

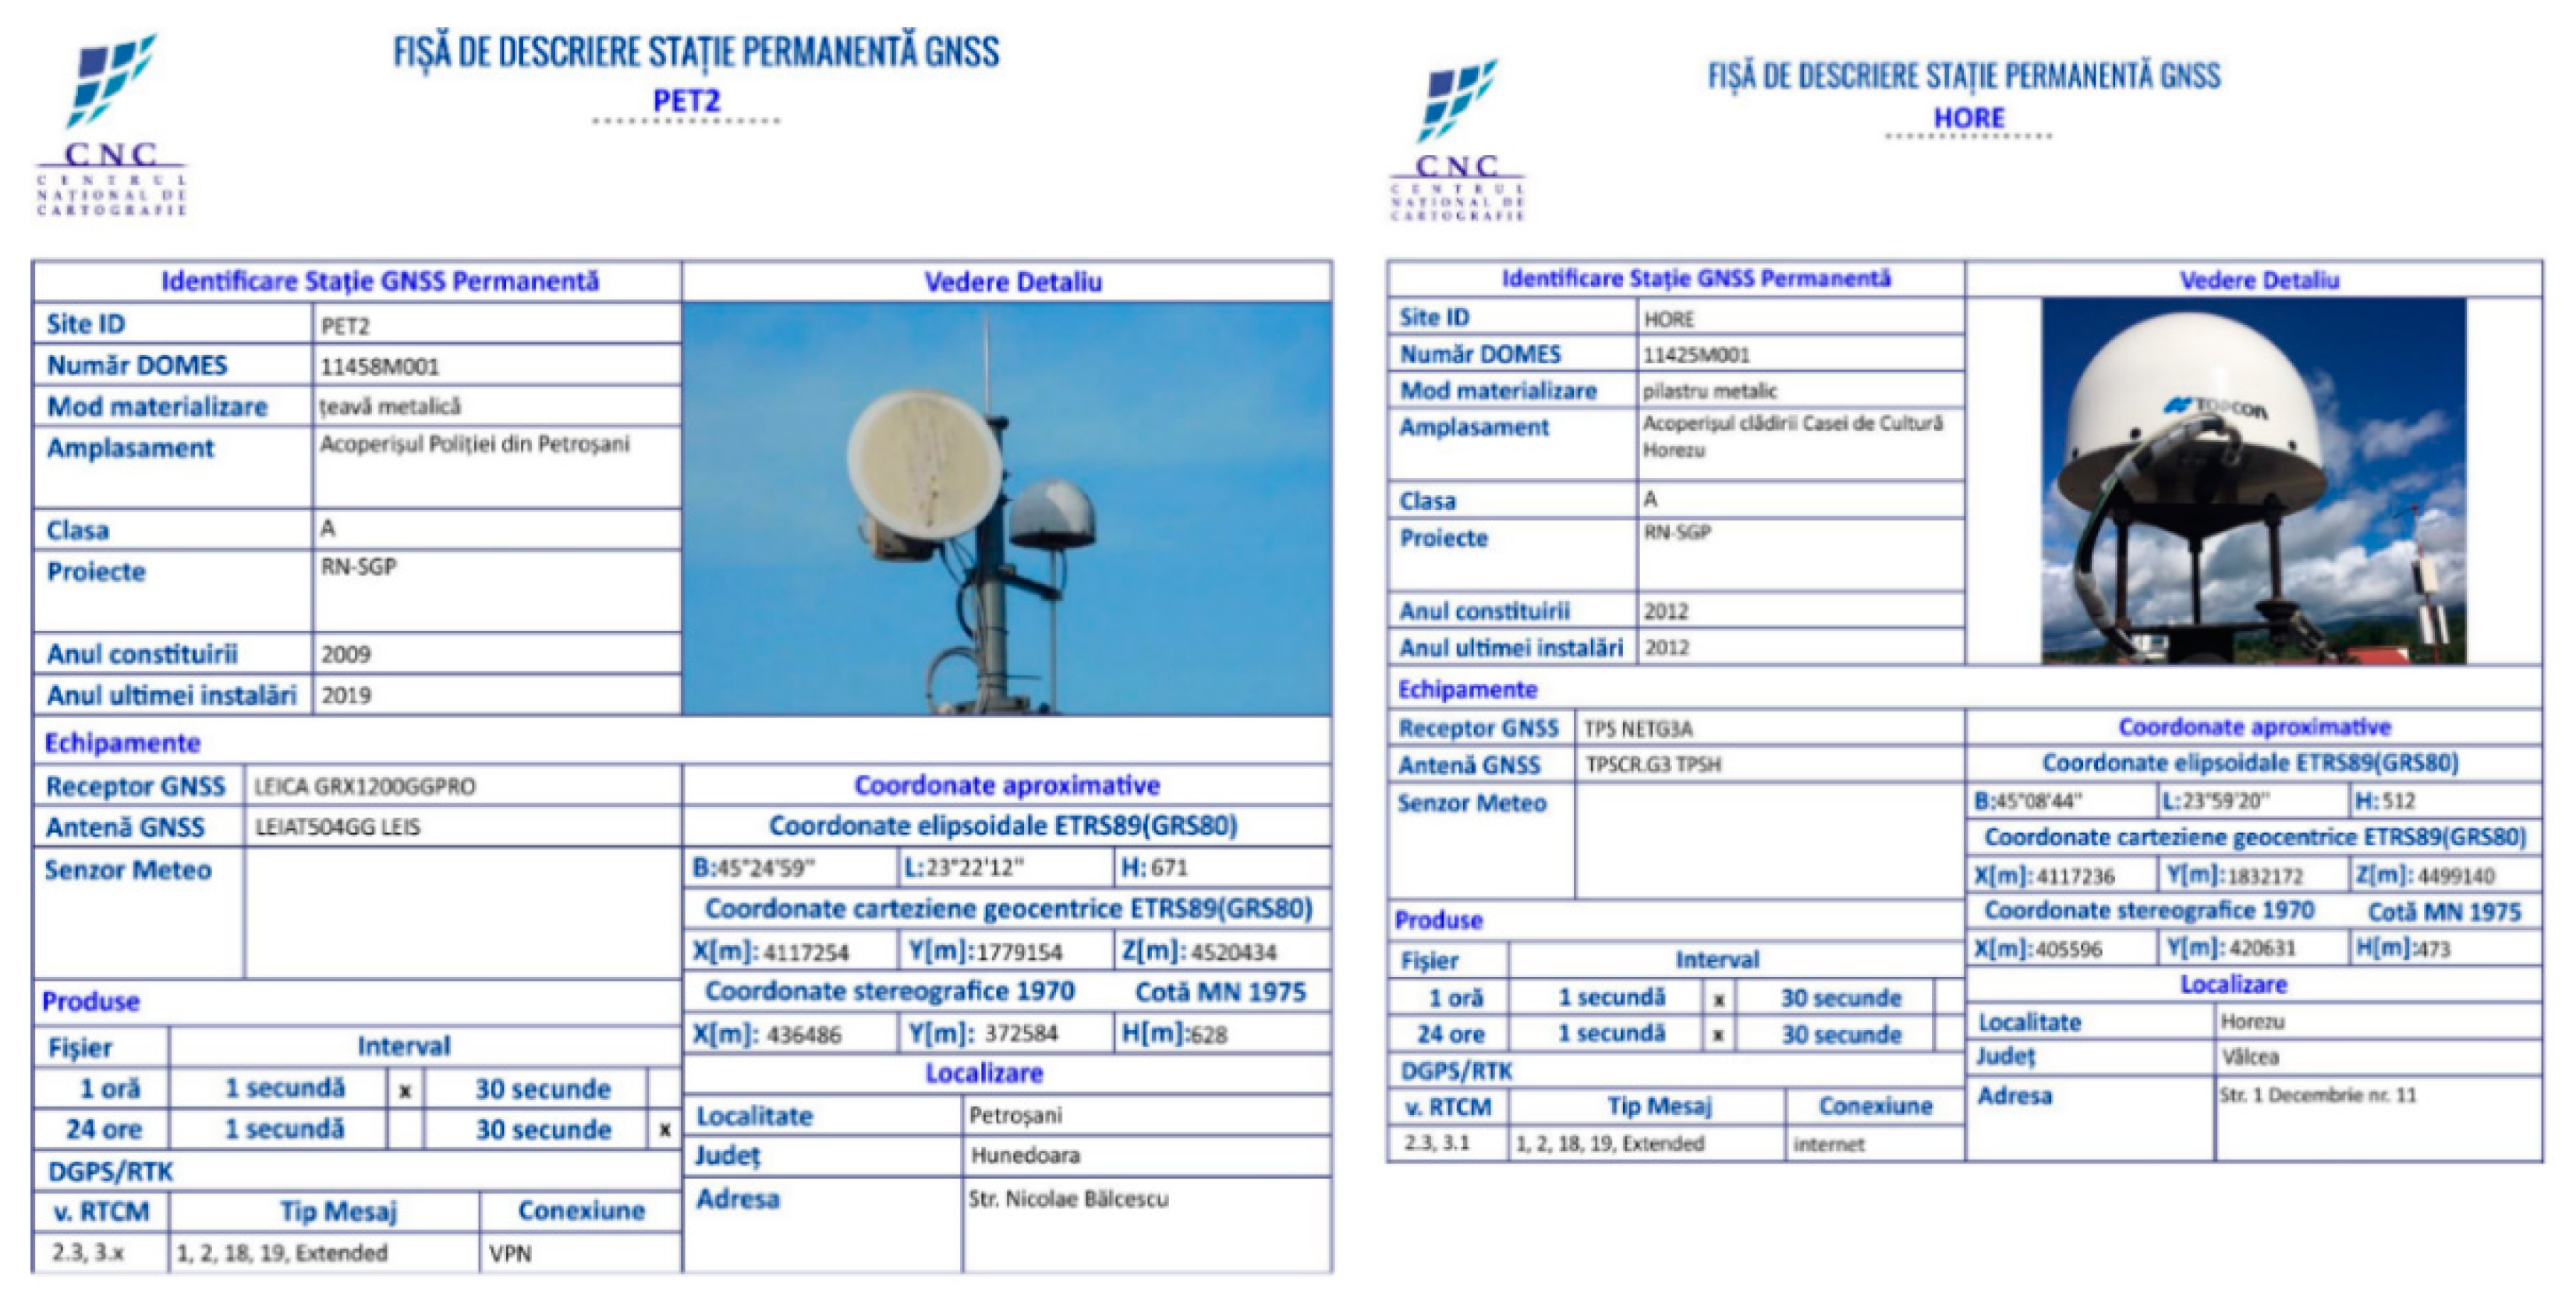
3.6.1. Integration of External Resources (Public Resources)

The research used public resources: the road theme layer, water theme (except lakes) layer, and administrative boundaries’ theme layer (counties, territorial administrative units—ATU). Given that these public resources were vectorized for the entire territory of Romania, and in the research were useful only in those areas of interest (Vâlcea County, Mălaia commune), in ArcGIS they were used as procedures and tools for the selection, cutting, and storage only of elements of interest (Figure 19).

3.6.2. Preparing the Workspace for Operation

To start the functional operation of the research, in the work screen we loaded the following data (thematic layers): background map (basemap) World Imagery—for vectorizing and analyzing the elements of interest that were found outside the surface of the orthophotoplans used (degree of transparency 70%); orthophotoplans—for vectorization and analysis of the main elements of the research (A—Village, B—Rudărașu, C—Zăpodie)—degree of transparency 40%; locations—contained the list of locations of interest for the research/beneficiary (both for the first stage of expansion and the locations that will be subject to the next stages of expansion of the agritourist farm); waters—the river network in the county; roads—the county road network; ATU administrative boundaries in the county; premises—the boundaries of the delimitation of places of interest; constructions—contained the elements of interest for the research (both existing constructions and those to be designed and built in the stages of expansion and development); arrangements—contained the elements of interest for the research (both the existing arrangements and those to be designed and realized in the stages of expansion and development); connection—thematic layer that contained elements specific to utilities (electricity, water); access roads—contained elements regarding the access roads to the research locations (detail of the public road network); routes—thematic layer that included tourist routes; POI—thematic layer that included points of interest (from a tourist point of view).

3.6.3. Research Locations and Vectorized Elements

The activities of designing and extending the agritourist farm, which constituted the basic requirements of the beneficiary and which were reflected in the main elements vectorized in the research locations (Figure 20): maintaining and developing the current location A—Village; changing of destination and development of the secondary location A1—Village; designing and development of location B—Rudărașu; designing and development of location C—Face; designing and development of location D—Zăpodie.
Even though the current research included several locations, they were organized and integrated into a unique concept, which ensured the diversity of activities as follows.
Location A—Village: keeps the specifics of the current activity; accommodation unit, preparation and dining, gaming spaces; minor changes in the physical location, abolition of customer parking, redevelopment of outdoor space; vectorized elements including enclosure, constructions, arrangements (existing and future), and utility connections.
Secondary location A1—Village: change of destination of existing buildings; arranging personal accommodation spaces; customer parking arrangement; maintenance and repair workshop arrangement; arrangement of service dedicated to the means of transport held (motorbikes, ATVs, bicycles, etc.); food block arrangement and food storage; vectorized elements including enclosure, constructions, arrangements (existing and future), and utility connections.
Location B—Rudărașu: newly designed location; arranging wooden houses; camping tent design; arranging customer service spaces; arrangement of administrative space; vectorized elements including premises, constructions, arrangements (existing and future), utility connections, and tourist routes.
Location C—Zăpodie: newly designed location; planned agritourism activities including visiting orchards, fruit maintenance works, fruit harvesting, etc.; arranging wooden houses; caravan camping arrangement; arranging customer service spaces; arrangement of administrative space; arranging spaces for fruit activities; intermediate point for tourist routes; vectorized elements including premises, constructions, arrangements (existing and future), utility connections, tourist routes, and orchards.

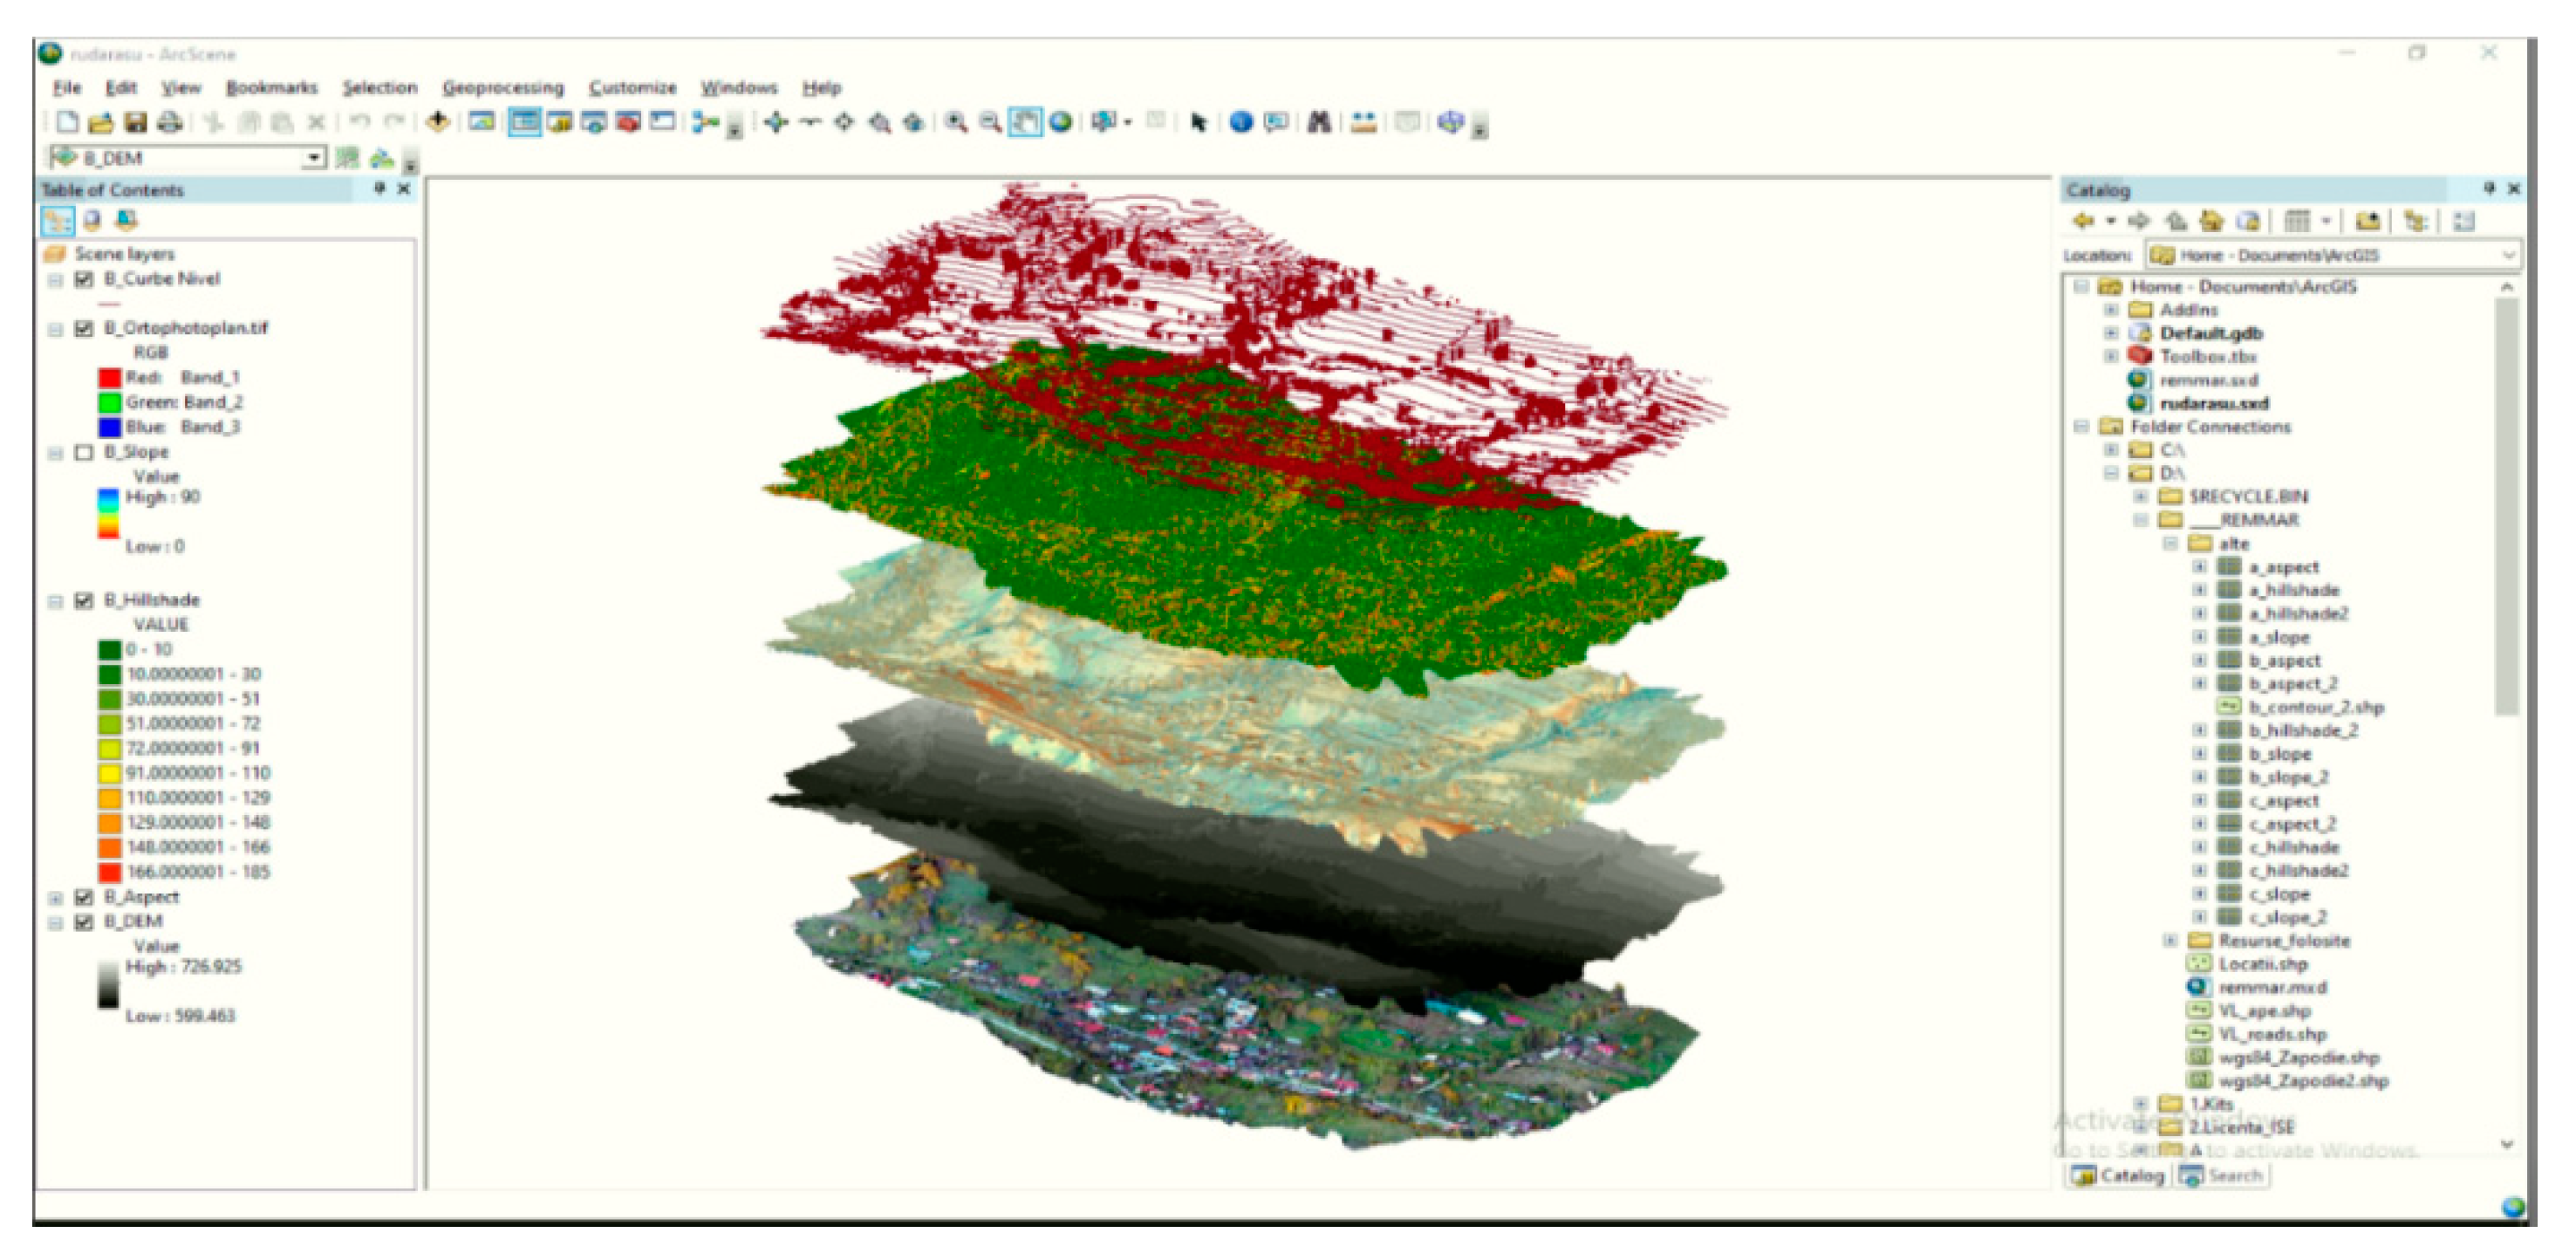
3.6.4. Create a 3D Themed Map

The 3D visualization facilities were used for the graphical/visual representation of content elements, starting from the list of attributes associated with vectorized elements. For example, we generated a 3D thematic map that graphically presented the vectorized buildings according to their height regime (RegimH attribute). In this sense, in the ArcScene module, we accessed the list of properties of the layer of interest (buildings): a list in which we specified the field/attribute, according to which the 3D representation of the vectorized elements was made (Figure 21).

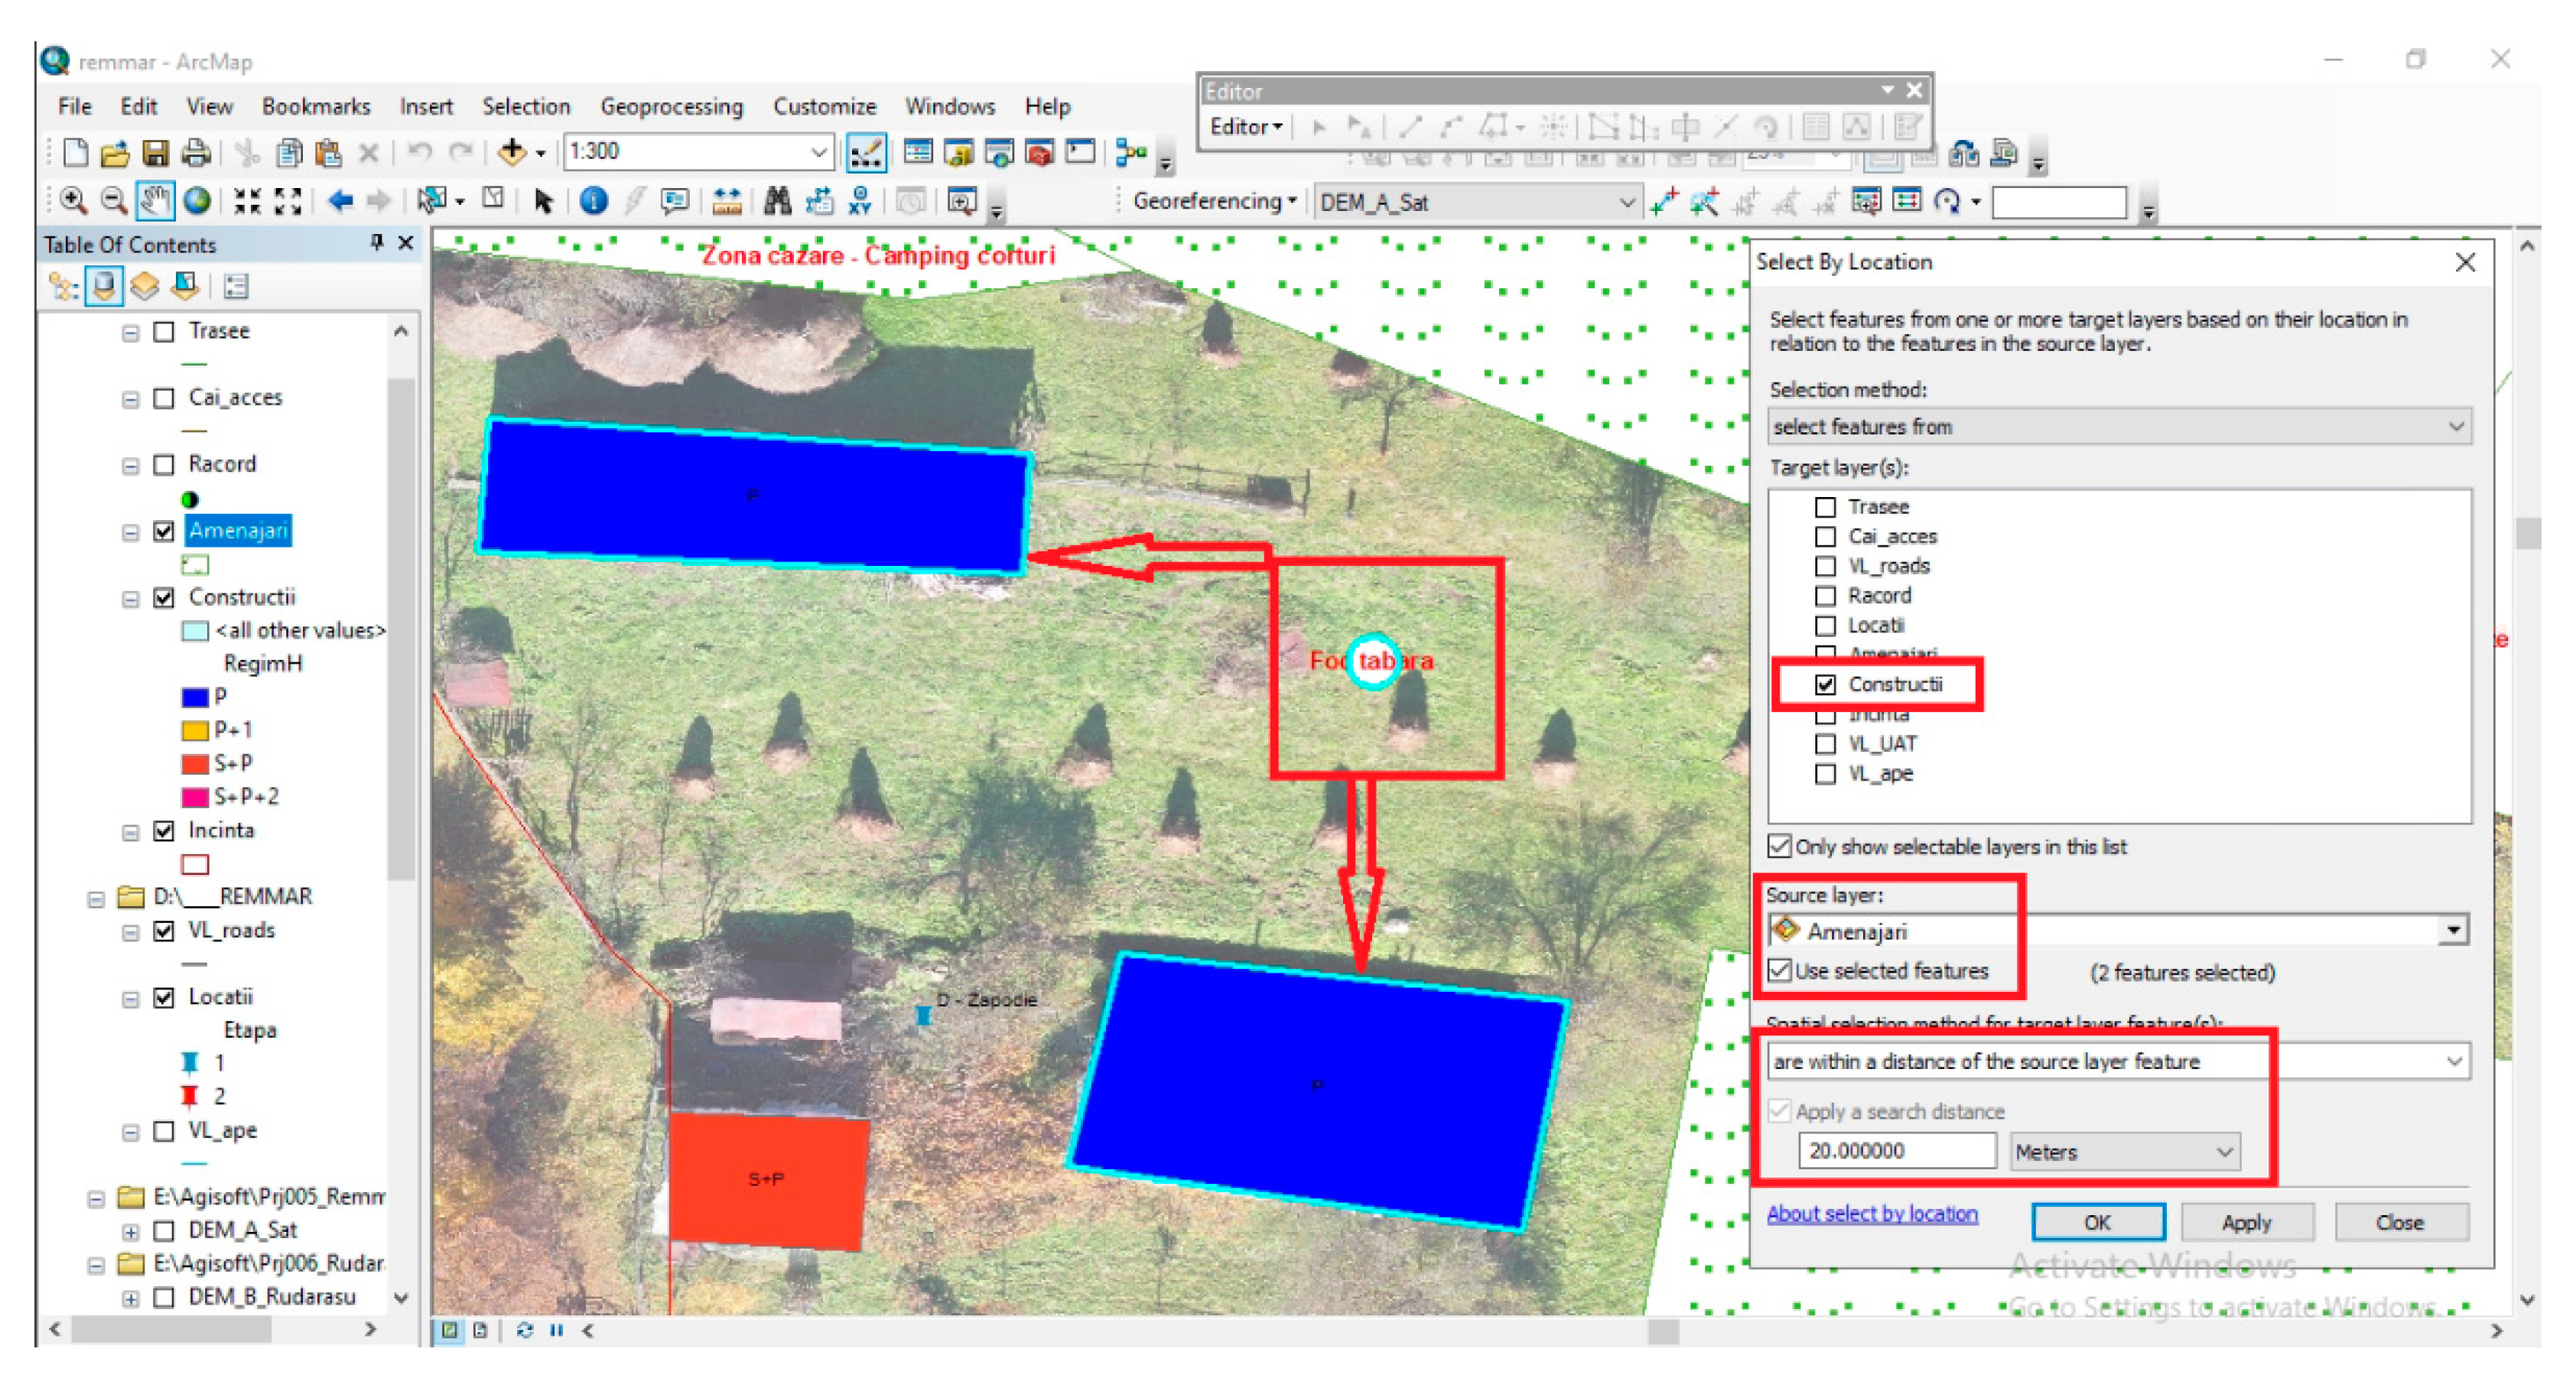
3.6.5. Queries: “By Attributes” and “By Location”

In a spatial database, searches for items that meet certain requirements in accordance with the user’s interest can be performed depending on the location of items of interest (absolute, relative) and attributes (characteristics of the items searched; they are stored in the database map—table attributes). Multicriteria searches (according to several criteria) in spatial databases have wide applications in all fields of activity: real estate, administration, police, medicine, transport, etc.
Attribute-based query. For example, a selection was made based on attributes. Thus, we intended to select the buildings that were already built (existing at the time of research planning), which will be renovated in the first stage of expansion (stage 2 in the context of the research) and are intended for technical spaces (Figure 22).
Location-based query. For example, we aimed to identify buildings that were less than 15 m from the sites designed for “Campfire” (to eliminate the risk of fire).
Given that the thematic layers includes the locations for the campfire and other arrangements to be made, it is necessary to first select the specific elements (campfire), and then apply the filtering of buildings based on their location related to campfire location.
Following the application of all these filtering criteria, it can be seen that three constructions were selected that were too close to the locations designed for campfire (two constructions were located in location D—Zăpodie, and one was located in location B—Rudărașu). Thus, it can be concluded that the campfire locations need to be repositioned (Figure 23).

3.6.6. DEM Operation

Before briefly presenting how to operate DEM, we will present some basic theoretical notions. Thus, we have [61,62]:
The digital elevation model (DEM) is a digital model based on an ordered network of points (usually a raster data structure) for which both the X and Y coordinates and the elevation are known. DEM generation is based on the principle of interpolation.
The digital terrain model (DTM) is a DEM-like digital model, but it is differentiated by the fact that the arrangement of the points is irregular or accidental. Thus, it has the advantage that the density of the points can be modified so that the surface of the land is rendered as accurately as possible, and at the same time points of interest can be incorporated.
The irregular triangular network (TIN) is a way of representing the position and shape of the terrain. By the TIN, the surface of the land is represented by all the adjacent triangular surfaces, without any degree of overlap between them.
Starting from the digital terrain elevation model obtained in the photogrammetric processing process, we had the possibility to extract and exploit, in the 3D environment, certain by-products. These were obtained using specific tools from Arctoolbox (for 3D processing of images). When using these processing tools, the data necessary for processing are filled in, such as the starting raster (from which the primary information is read, the raster or the destination object, other parameters necessary for the processing, etc.
Thus, the following by-products were generated (starting from DEM) [43]:
Appearance—represents the way of horizontal orientation of the surface; each facet is assigned a numeric code that expresses the cardinal orientation of that slope;
Contour—generates the level curves associated with the selected raster; the result is 2D, but based on the attributes, exploitations can also be made in 3D mode;
Hillshade—generates a raster that represents a shading relief; the light source is considered to be infinite;
Slope—generates polygonal structures that represent ranges of slope values starting from triangulated surfaces.
These products can be exploited in a 3D context using the ArcScene module. It provides various representation and management facilities specific to the 3D environment (navigation, animation, specific calculations, etc.) (Figure 24).

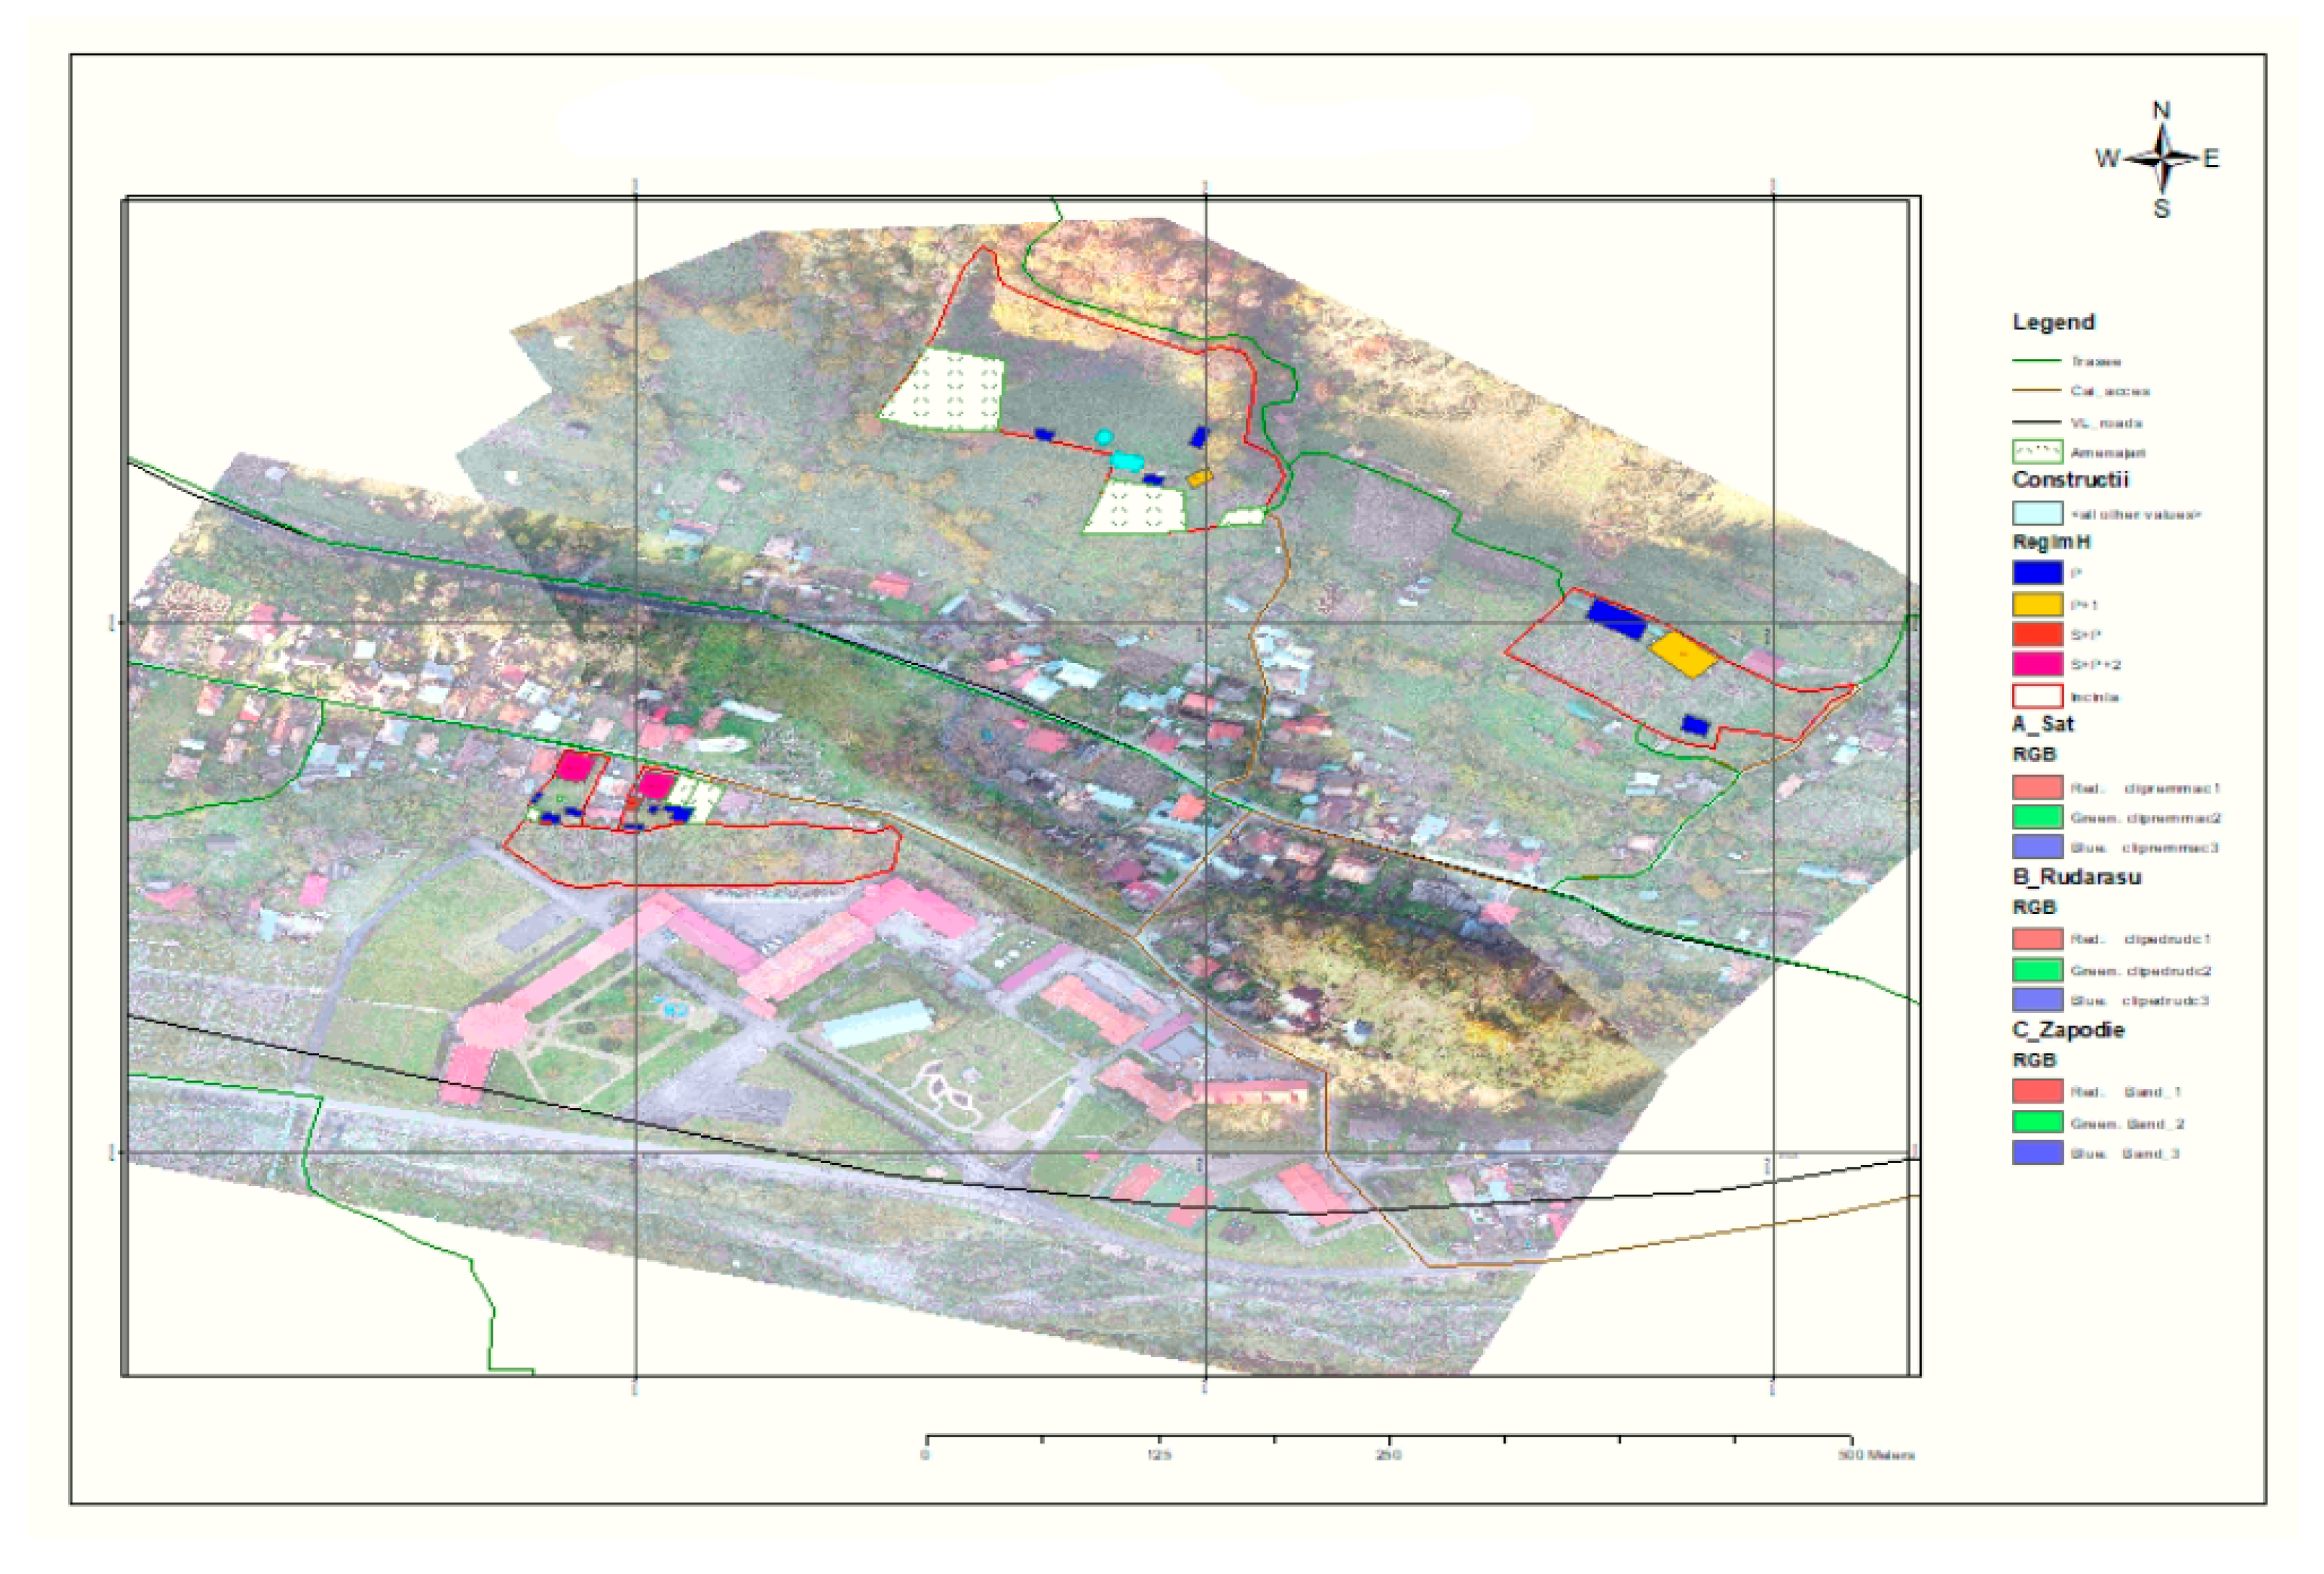
3.6.7. Presentation of Data in MAP LAYOUT Form

ArcMap offers two different ways to view a map: data view is a view used to explore, display, or query data; is the default mode when opening any application; layout view is a collection of elements of a map (map title, legend, scale, projection, etc.) positioned and organized on a virtual page before plotting/printing.
Presenting data in layout view mode allows you to configure the required items before plotting/printing. Thus, users have the opportunity to configure [46,63] grid illustration, northbound insertion, insert legend, insert representation scale, etc. By adding various mandatory or optional elements and configuring the associated parameters, various thematic maps can be configured, previewed, and printed, depending on the requests and interests of the beneficiaries. They can be saved/exported in digital format, or they can be printed on physical media (Figure 25).

4. Discussion

Studies show that in recent years tourists prefer destinations where they can spend as much time as possible in nature and get involved in various activities: outdoor walks, hiking, adventure activities [31], and even the day-to-day activities of a rural household (care and feeding of domestic animals). The choice of agritourism destinations is primarily determined by the diversity of activities that can be carried out, and by the safety and security conditions. Thus, agritourism farms support the sustainable development of agritourism through the wide range of activities offered.
A few years ago, tourists preferred mountain, seaside, and external destinations, and the addressability of rural tourism was low. The COVID-19 pandemic has generated changes in tourists’ preferences, so that nowadays more and more people are choosing rural tourist destinations. An important segment for the development of agritourism is generated by young families, with small children and with financial possibilities, who want to spend more time in rural areas.
There are many rural areas that, through the practice of rural tourism, have generated sustainable economic development [64,65,66]. Even if agritourism is based on individual units (agritourism boarding house), for sustainable development it is necessary to elaborate and implement strategies at the local, regional, and national level. Modern agritourism depends on the innovative management and leadership qualities of decision-making personnel [67]. The basic principle of agritourism is to combine sustainable economic development based on the responsible use of natural resources.
For the sustainable development of agritourism, it is necessary to develop and implement unitary strategies. At the same time, these strategies must regulate and ensure the responsible use of land and natural resources, support biodiversity, and generate protective measures against climate change.
In the presented context, this research paper supports the organization and implementation of activities for the expansion of an agritourism farm in compliance with the requirements regarding environmental protection, the efficient use of land and existing natural resources, and the support of biodiversity. The research work is developed at the local level (agritourism farm REMMAR, Mălaia, Vâlcea) and can be applied to agritourism farms in any area of Romania. At the same time, it can be developed, scaled, and applied at the regional level.
Currently, the owners of agritourism farms tend to allocate available resources to household activities and to underestimate the importance of the tourism component. In order for agritourism to become a factor for the development and economic support of rural areas, it is necessary to adopt some macroeconomic measures and strategies, but also some measures at the local level, such as aligning the tourist offer with the demands of tourists, creating unique products to be known as the local brand of the area, and the association of entrepreneurs and collaboration with public institutions [68].
The approach of the research topic is based on the following hypotheses: the performance of any entity (organization, institution, individual, etc.) is conditioned and depends on the quality of decisions taken at the management level. Identifying and adopting the best decision at a given time and under certain conditions involves accessing and processing a large volume of data and a complex process of analysis and synthesis (regardless of the field in which it operates), which the human factor cannot achieve. The continuous and accelerated development of science and technology has made possible in recent years the accelerated development of advanced decision support systems (including GIS/GIS) with high storage, processing, and analysis capabilities (including location data); therefore, systems that can be applied in various fields of activity [69,70].
Such a system can be successfully implemented only under the conditions of the existence of a data model specific to the field of action, a model that can be obtained by a detailed analysis of that field. In this sense, for the implementation of a decision support system at the REMMAR agritourist farm located in Mălaia-Vâlcea Romania, in this research paper a specific data model was founded and designed. The model designed in this way allows efficient recording, storage, extraction, processing, and analysis of the data of interest.
The designed data model can only be implemented under the conditions of a dedicated graphical support. Graphic support can be obtained by scanning or digitizing existing maps in a physical/printed format, or by acquiring data of interest in a digital format. Due to technological developments, photogrammetric methods are now increasingly used to acquire field data. By applying a data model to a raster-type graphical medium (and populating the database with information of interest), a geographic information system (GIS/GIS) is obtained which is an efficient management tool. In agritourism, geographic information systems can be scaled according to the proposed objectives. Thus, GIS can be applied for the efficient management of an agritourism unit, but it can also be scaled at the regional or national level.
At the level of the agritourism unit (including at the level of the REMMAR agritourist farm located in Mălaia commune, Vâlcea county-Romania), GIS products can be used for activities such as the planning and efficient management of existing resources’ sustainable agricultural production, spatial location of available resources, simulation of landscape and territorial arrangements, technical-financial substantiation of expansion, and development sustainable agricultural production, etc. At the same time, GIS research projects can be used for the documented choice of the location of future agritourism units based on the available information in the existing database (location of competing or partner agritourism units, usable natural resources, protected areas, environmental quality, points of interest, proximity to the urban area, accessibility, segmentation and structuring of the categories of inhabitants, etc.).
At a broad level, GIS products and research projects find their applicability according to the pursued purpose: the promotion and development of agritourism at a local or national level, agritourism promotion by publishing dedicated webgis components, development of tourism promotion platforms in accordance with the promotion strategies at the local or national level, etc. Both from agritourism, and an extended point of view, GIS tools provide useful information for risk management, planning of marketing and business development strategies, and other strategies based on the principles of geolocation of different entities [71,72].
Starting from the addressability of GIS-type research projects specific to agritourism units, and with direct applicability to the REMMAR agritourist farm located in Mălaia commune, Vâlcea-Romania county, a third perspective was identified, namely the utility for the consumption segment (services of agritourism). By publishing webgis components dedicated to agritourism, tourists (potential customers) have access to a wide range of information (services offered, facilities, location, access roads, land accessibility, etc.), which allows them to select the destination and plan the stay.
Following the solution of the proposed objectives, the following main results were obtained: design and validation of a data model dedicated to the case study (REMMAR agritourist farm located in Mălaia commune, Vâlcea county); application of photogrammetric methods for the acquisition of data of interest on the studied objective (three distinct locations); processing of raw data (photograms) and obtaining image support (one orthophotoplan for each research location); population of the database with information of interest (geographical and descriptive); implementation of a geographical information system.
Secondary results which can be used in other research: points materialized on the ground by FENO-type topographic terminals; raw photograms; orthophoto planes, resolution ~2 cm/pixel, raster format; non-relational data model; model analysis form [72].
In terms of the contributions and originality of the research topic from a theoretical and practical point of view, this paper is a step forward in the development of a standard methodology (methods, means, resources, and tools) for the design, extension of sustainable agricultural production, and tourism promotion of the agritourist farm, by using photogrammetry techniques and the integration of geographical information.
The original elements of the paper are based on the approach of four main research directions.
  • Obtaining image support by using photogrammetric methods for data acquisition: developing models for planning field and office activities, as well as models for establishing the necessary resources; the applicability of the generated models was verified by using them in the 3 locations of the research; development of the methodology for marking and materialization of ground points both to ensure the possibility of georeferencing the graphic support (orthophotoplan) and for subsequent use during the implementation stages of the research; development of the model sketch, in order to ensure the easy identification of the points for later use; establishing the optimal processing parameters of the raw photograms for meeting the minimum quality requirements of the graphic support.
  • Development of the research implementation methodology and actual implementation, from the establishment of the fundamental objectives to the obtaining and presentation of the final results: research planning and development in accordance with the principles of project management; monitoring and permanent management of the main components (human resource management, financial resource management, time management, quality management, risk management, etc.); maintaining constant contact with the beneficiary in order to ensure the requirement–result correspondence.
  • Development of the needs analysis methodology and design of the specific data model: establishing the methodology for carrying out the analysis activities; selection and application of analysis methods suitable for this type of research; designing the data model specific to the case study; the application of cross-cutting methods to validate needs and the data model.
  • Design and practical implementation of the geographical information system in terms of structure, methods, and means of software implementation: validation of the data model through the effective implementation within a specialized software product (ArcGis); establishing the specific elements and vectorizing them for the case study; presentation of the ways of efficient exploitation of the geographical information system; publishing a specific webgis component.
With the development and expansion of the REMMAR agritourism farm, the methodologies and techniques used for its management can also be expanded, such as photogrammetric methods, UAVs, sensors specific to agriculture, LIDAR techniques, etc. Through procedures similar to those presented, the owners of agritourism farms can apply drone photogrammetry (UAV photogrammetry) combined with the use of sensors (RGB, NIR, multispectral, thermal, LIDAR) for land management and monitoring, monitoring the crops’ health, intervention in the case of calamity, etc. It should be noted that the use of certain categories of sensors is expensive, so it may exceed the financial capacity of agritourism farms.
The novelty of the paper comes firstly from its research direction. We express the fact that the lack of specific methodologies, studies, or research dedicated to agritourism was the basis for addressing this research topic; thus, first of all, from this point of view, the research can be considered a novelty. For this category, the research carried out resulted in the finalization of a working methodology and a geographic information system that integrates various types of information and data necessary for the design activities of all the works to expand the sustainable agricultural activities in the agritourism guesthouse REMMAR, with the possibility of application, after calibration, at the national level.

5. Conclusions

In the current competitive context of the global economy, performance at the level of an enterprise or at the level of a business project depends on making the best decisions and taking the best measures by accessing a large volume of information and a complex process of analyses and syntheses. In this sense, in conjunction with the limited resources allocated to small-scale research projects, the current study demonstrates and exemplifies how to approach, go through, and complete the work necessary to achieve the objectives for the development of such a GIS. The results obtained can be used in the future for the development of major lines of photogrammetric research in order to establish GIS databases for the design and expansion of agritourist farms, regardless of their geographical location.
It should be noted that the basic entity of a geographical information system is the location (geospatial data), and the graphical representation is made by raster data (as a graphic medium) and vector type (to delimit the elements of interest). Having these aspects as a starting point, the geographical information system developed is a tool dedicated to both management and executives and has a high degree of flexibility, so that at the time of implementation it can be configured as needed. From the beginning, it was considered that the design and implementation of this geographical information system involves the existence of a team of specialists in various fields (cartography, photogrammetry, computer science, etc.), and the development of a data model (database structure), based on activities needs an analysis, especially for expanding sustainable agricultural production.
The implementation of the geographical information system presupposes the existence of a graphic support (raster type), which is ensured by carrying out its own activities of acquisition and processing of raw data, by aerial photography and graphic processing, even if they are large consumers of resources (financial, time, technical). Procurement through this method ensures that the quality requirements are met, which cannot be ensured by the use of external data.
The designed geographic information system provides flexibility in the analysis of data of interest, its success depends on the team’s ability to collect the necessary data, its structure and content can be updated at any time (with greater or lesser effort and, of course, with awareness of all subsequent implications), and it allows the display and extraction of results in various forms such as images, graphs, tables, and maps, for the necessity of expanding sustainable agricultural production.
The results (main and secondary) obtained as a result of the research can be used as follows. The implemented geographical information system can be used as a model for the design and extension of any agritourist farm. The system is based on an open relational model, which allows its adaptation to needs as they arise. The designed data model has applicability on the structure of any farm with specific agritourism, so that it can be implemented on other locations (with the provision of the corresponding graphic support); at the same time, being an open model, it can be easily adapted to the needs/requirements of other beneficiaries. The orthophotoplans obtained can be used as graphic support for any future research that requires geographical information; being generated at a resolution of ~2 cm/pixel, they allow the easy identification of details of interest (for georeferencing, vectorization, etc.). The implemented research is an effective tool for the continuous management of the specific activities of an agritourist farm, from the substantiation of the establishment decision to the organization of the current activity. The published webgis component is a means of tourism promotion with a wide addressability, which facilitates the access of tourists to information, and also the increase of the occupancy rate and the incomes of the agritourist farm. The webgis component can be scaled up and extended to be applied at a regional or national level, as a direct support for the sustainable development of agritourism. The raw photograms can be input data for other graphic processing research.
The designed geographic information system can be considered basic research for the development of other GIS necessary for the expansion of sustainable agricultural production, from agritourist farms, to ensure the avoidance of possible mistakes; the correct estimation of needs; and the adaptation, optimization, and reuse of new, applied techniques and work methods in this specific research.

Author Contributions

Conceptualization, J.C., A.C. and G.M.V.; methodology, J.C., A.C., T.I. and G.M.V.; software, J.C., A.C. and G.M.V.; validation, J.C., A.C., T.I. and G.M.V.; formal analysis, J.C., A.C., G.M.V. and T.I.; investigation, J.C., A.C., T.I. and G.M.V.; resources, J.C., A.C. and G.M.V.; data curation, J.C. and G.M.V.; writing—original draft preparation, G.M.V.; writing—review and editing, J.C., A.C., G.M.V. and T.I.; visualization, J.C.; supervision, A.C. and T.I.; research administration, J.C., A.C., T.I. and G.M.V. All authors have read and agreed to the published version of the manuscript.

Funding

The publication of this paper is made possible by the funds of the “King Mihai I” University of Life Sciences from Timişoara and the Research Institute for Biosecurity and Bioengineering Timisoara.

Institutional Review Board Statement

Not applicable.

Informed Consent Statement

Not applicable.

Data Availability Statement

Not applicable.

Acknowledgments

We thank the University of Craiova, the Faculty of Agronomy, specialization in Land Surveying and Cadastre, “King Mihai I” University of Life Sciences from Timişoara, which provided us with the material basis necessary for the processing of the data collected and the REMMAR agritourist farm.

Conflicts of Interest

The authors declare no conflict of interest.

References

  1. Eltner, A.; Schneider, D. Analysis of different methods for 3D reconstruction of natural surfaces from parallel-axes UAV images. Photogramm. Rec. 2015, 30, 279–299. [Google Scholar] [CrossRef]
  2. Duo, E.; Trembanis, A.C.; Dohner, S.; Grottoli, E.; Ciavola, P. Local-scale post-event assessments with GPS and UAV-based quick-response surveys: A pilot case from the Emilia–Romagna (Italy) coast. Nat. Hazards Earth Syst. Sci. 2018, 18, 2969–2989. [Google Scholar] [CrossRef] [Green Version]
  3. Chen, S.; Laefer, D.; Mangina, E. State of Technology Review of Civilian UAVs. Recent Pat. Eng. 2016, 10, 160–174. [Google Scholar] [CrossRef] [Green Version]
  4. Tonkin, T.N.; Midgley, N.G.; Graham, D.J.; Labadz, J.C. The potential of small unmanned aircraft systems and structure-frommotion for topographic surveys: A test of emerging integrated approaches at Cwm Idwal, North Wales. Geomorphology 2014, 226, 35–43. [Google Scholar] [CrossRef] [Green Version]
  5. James, M.R.; Robson, S.; d’Oleire-Oltmanns, S.; Niethammer, U. Optimising UAV topographic surveys processed with structurefrom-motion: Ground control quality, quantity and bundle adjustment. Geomorphology 2017, 280, 51–66. [Google Scholar] [CrossRef] [Green Version]
  6. Călina, J.; Călina, A.; Miluţ, M.; Croitoru, A.; Stan, I.; Buzatu, C. Use of drones in cadastral works and precision works in silviculture and agriculture. Rom. Agric. Res. 2020, 37, 273–284. [Google Scholar]
  7. Rizzari, J.R.; Semmens, J.M.; Fox, A.; Huveneers, C. Observations of marine wildlife tourism effects on a non-focal species. J. Fish Biol. 2017, 91, 981–988. [Google Scholar] [CrossRef]
  8. Badescu, G.; Calina, J.; Calina, A.; Milut, M.; Stan, I. Use of modern methods of terrestrial laser scanning on preservation of the religious patrimony in Romania. Eur. J. Sci. Theol. 2018, 14, 201–207. [Google Scholar]
  9. Fonstad, M.A.; Dietrich, J.T.; Courville, B.C.; Jensen, J.L.; Carbonneau, P.E. Topographic structure from motion: A new development in photogrammetric measurement. Earth Surf. Process. Landf. 2013, 38, 421–430. [Google Scholar] [CrossRef] [Green Version]
  10. Calina, A.; Calina, J.; Milut, M. Study on Levelling Works Made for Drawing Tridimensional Models of Surface and Calculus of the Volume of Earthwork. Agric. Agric. Sci. Procedia 2015, 6, 413–420. [Google Scholar] [CrossRef] [Green Version]
  11. Zhang, Y.; Xiong, J.; Hao, L. Photogrammetric processing of low-altitude images acquired by unpiloted aerial vehicles. Photogramm. Rec. 2011, 26, 190–211. [Google Scholar] [CrossRef]
  12. Byrne, J.; O’Keeffe, E.; Lennon, D.; Laefer, D.F. 3D reconstructions using unstabilized video footage from an unmanned aerial vehicle. J. Imaging 2017, 3, 15. [Google Scholar] [CrossRef]
  13. Esposito, G.; Salvini, R.; Matano, F.; Sacchi, M.; Danzi, M.; Somma, R.; Troise, C. Multitemporal monitoring of a coastal landslide through SfM-derived point cloud comparison. Photogramm. Rec. 2017, 32, 459–479. [Google Scholar] [CrossRef] [Green Version]
  14. Pepe, M.; Fregonese, L.; Scaioni, M. Planning airborne photogrammetry and remote-sensing missions with modern platforms and sensors. Eur. J. Remote Sens. 2018, 51, 412–436. [Google Scholar] [CrossRef] [Green Version]
  15. Wheaton, J.M.; Brasington, J.; Darby, S.E.; Sear, D.A. Accounting for uncertainty in DEMs from repeat topographic surveys: Improved sediment budgets. Earth Surf. Process. Landf. J. Br. Geomorphol. Res. Group 2010, 35, 136–156. [Google Scholar]
  16. Smith, M.W.; Vericat, D. From experimental plots to experimental landscapes: Topography, erosion and deposition in sub-humid badlands from structure-from-motion photogrammetry. Earth Surf. Process. Landf 2015, 40, 1656–1671. [Google Scholar] [CrossRef] [Green Version]
  17. Gonçalves, J.A.; Henriques, R. UAV photogrammetry for topographic monitoring of coastal areas. ISPRS J. Photogramm. 2015, 104, 101–111. [Google Scholar] [CrossRef]
  18. Schofield, G.; Katselidis, K.A.; Lilley, M.K.S.; Reina, R.D.; Hays, G.C. Detecting elusive aspects of wildlife ecology using drones: New insights on the mating dynamics and operational sex ratios of sea turtles. Funct. Ecol. 2017, 31, 2310–2319. [Google Scholar] [CrossRef] [Green Version]
  19. Antoine, R.; Lopez, T.; Tanguy, M.; Lissak, C.; Gailler, L.; Labazuy, P.; Fauchard, C. Geoscientists in the Sky: Unmanned Aerial Vehicles Responding to Geohazards. Surv. Geophys. 2020, 41, 1285–1321. [Google Scholar] [CrossRef]
  20. Jiang, S.; Jiang, C.; Jiang, W. Efficient structure from motion for large-scale UAV images: A review and a comparison of SfM tools. ISPRS J. Photogramm. Remote Sens. 2020, 167, 230–251. [Google Scholar] [CrossRef]
  21. Pepe, M.; Costantino, D. Techniques, Tools, Platforms and Algorithms in Close Range Photogrammetry in Building 3D Model and 2D Representation of Objects and Complex Architectures. Comput. Aided Des. Appl. 2020, 18, 42–65. [Google Scholar] [CrossRef]
  22. Byrne, J.; Laefer, D.F.; O’Keeffe, E. Maximizing feature detection in aerial unmanned aerial vehicle datasets. J. Appl. Remote Sens. 2017, 11, 025015. [Google Scholar] [CrossRef]
  23. James, M.R.; Robson, S.; Smith, M.W. 3-D uncertainty-based topographic change detection with structure-from-motion photogrammetry: Precision maps for ground control and directly georeferenced surveys. Earth Surf. Proc. Land. 2017, 42, 1769–1788. [Google Scholar] [CrossRef]
  24. Seymour, A.C.; Ridge, J.T.; Rodriguez, A.B.; Newton, E.; Dale, J.; Johnston, D.W. Deploying fixed wing Unoccupied Aerial Systems (UAS) for coastal morphology assessment and management. J. Coast. Res. 2018, 34, 704–717. [Google Scholar] [CrossRef] [Green Version]
  25. Galluzzo, N. Relationships between Agritourism and Certified Quality Food in Italian Rural Areas. Rom. Rev. Reg. Stud. 2015, 11, 77–88. [Google Scholar]
  26. Avram, D. Trends of tourist demand in Romania. Positioning of the rural tourism among the tourists. Cactus Tour. J. 2017, 15, 14–25. [Google Scholar]
  27. Bran, D.; Hincu, F.; Ioan, I. Potential of rural tourism in Romania. J. Tour. 2010, 10, 28–31. [Google Scholar]
  28. Tenie, B.V.-T.; Fintineru, G. What attracts tourists in rural areas? An analysis of the key attributes of agritourist destinations that may influence their choice. AgroLife Sci. J. 2020, 9, 324–333. [Google Scholar]
  29. Vlad, I.M.; Stoian, E. Accomodation preferences of foreign tourists in Romania. Sci. Pap. Ser. Manag. Econ. Eng. Agric. Rural Dev. 2014, 14, 399–404. [Google Scholar]
  30. Pop, C.; Coros, M.; Balint, C. Romanian Rural Tourism: A Survey of Accommodation Facilities. Stud. UBB Negot. 2017, 62, 71–126. [Google Scholar] [CrossRef]
  31. Dumitras, D.E.; Mihai, V.C.; Jitea, I.M.; Donici, D.; Muresan, I.C. Adventure Tourism: Insight from Experienced Visitors of Romanian National and Natural Parks. J. Soc. 2021, 11, 41. [Google Scholar] [CrossRef]
  32. Poruțiu, A.; Tirpe, O.P.; Oroian, C.; Mihai, V.C.; Chiciudean, G.O.; Chiciudean, D.I.; Poruțiu, C. Analysis on Tourists’ Preferences for Rural Tourism Destinations in Romania. Societies 2021, 11, 92. [Google Scholar] [CrossRef]
  33. Drăgoi, M.C.; Iamandi, I.-E.; Munteanu, S.M.; Ciobanu, R.; Țarțavulea, R.I.; Lădaru, R.G. Incentives for Developing Resilient Agritourism Entrepreneurship in Rural Communities in Romania in a European Context. Sustainability 2017, 9, 2205. [Google Scholar] [CrossRef] [Green Version]
  34. Westoby, M.J.; Brasington, J.; Glasser, N.F.; Hambrey, M.J.; Reynolds, J.M. “Structure-from-Motion” photogrammetry: A low-cost, effective tool for geoscience applications. Geomorphology 2012, 179, 300–314. [Google Scholar] [CrossRef] [Green Version]
  35. Lucieer, V.; Hill, N.A.; Barrett, N.S.; Nichol, S. Do marine substrates ‘look’ and ‘sound’ the same? Supervised classification of multi beam acoustic data using autonomous underwater vehicle images. Estuar. Coast. Shelf Sci. 2013, 117, 94–106. [Google Scholar] [CrossRef]
  36. Scarelli, F.M.; Sistilli, F.; Fabbri, S.; Cantelli, L.; Barboza, E.G.; Gabbianelli, G. Seasonal dune and beach monitoring using photogrammetry from UAV surveys to apply in the ICZM on the Ravenna coast (Emilia-Romagna, Italy). Remote Sens. Appl. Soc. Environ. 2017, 7, 27–39. [Google Scholar] [CrossRef]
  37. Bożek, P.; Janus, J.; Mitka, B. Analysis of Changes in Forest Structure using Point Clouds from Historical Aerial Photographs. Remote Sens. 2019, 11, 2259. [Google Scholar] [CrossRef] [Green Version]
  38. Carvalho, R.C.; Kennedy, D.M.; Niyazi, Y.; Leach, C.; Konlechner, T.M.; Ierodiaconou, D. Structure-from-Motion photogrammetry analysis of historical aerial photography: Determining beach volumetric change over decadal scales. Earth Surf. Proc. Land. 2020, 45, 2540–2555. [Google Scholar] [CrossRef]
  39. Calina, J.; Calina, A.; Babuca, N.; Croitoru, A.; Cioboata, M. Study on the use of the land scan to determine the soil volume dislocated by erosion of depth on the practice of sustainable agriculture in agritouristic farms. Sci. Pap. Ser. A—Agron. 2021, 64, 659–668. [Google Scholar]
  40. Hackney, C.; Clayton, A. Unmanned Aerial Vehicles (UAVs) and their application in geomorphic mapping. Geomorphol. Tech. Br. Soc. Geomporl. 2015. Available online: https://www.google.com.hk/url?sa=t&rct=j&q=&esrc=s&source=web&cd=&ved=2ahUKEwibte_a-on7AhWe03MBHW3WB90QFnoECA4QAQ&url=https%3A%2F%2Feprints.soton.ac.uk%2F376639%2F1%2F2.1.7_UAV.pdf&usg=AOvVaw0oOnKEz6t1suBWNlid_AQ5 (accessed on 19 September 2022).
  41. Bădescu, G.; Călina, A.; Călina, J.; Săvescu, P.; Miluț, M.; Băbucă, N.I. Aspects on the use of GNSS technology in maritime and fluvial navigation. In IOP Conference Series: Materials Science and Engineering; IOP Publishing: Bristol, UK, 2020; Volume 916, p. 012005. [Google Scholar]
  42. Călina, J.; Călina, A. Study on designing municipal technical network maps for an agricultural company with the help of a GIS. AgroLife Sci. J. 2021, 10, 29–38. [Google Scholar]
  43. Ishiguro, S.; Yamano, H.; Oguma, H. Evaluation of DSMs generated from multi-temporal aerial photographs using emerging structure from motion–multi-view stereo technology. Geomorphology 2016, 268, 64–71. [Google Scholar] [CrossRef]
  44. Casella, E.; Collin, A.; Harris, D.; Ferse, S.; Bejarano, S.; Parravicini, V.; Rovere, A. Mapping coral reefs using consumer-grade drones and structure from motion photogrammetry techniques. Coral Reefs 2017, 36, 269–275. [Google Scholar] [CrossRef]
  45. Guisado-Pintado, E.; Jackson, D.W.T.; Rogers, D. 3D mapping efficacy of a drone and terrestrial laser scanner over a temperate beach-dune zone. Geomorphology 2019, 328, 157–172. [Google Scholar] [CrossRef]
  46. Zimmerman, T.; Jansen, K.; Miller, J. Analysis of UAS Flight Altitude and Ground Control Point Parameters on DEM Accuracy along a Complex, Developed Coastline. Remote Sens. 2020, 12, 2305. [Google Scholar] [CrossRef]
  47. Specht, C.; Dabrowski, P.S.; Specht, M. 3D modelling of beach topography changes caused by the tombolo phenomenon using terrestrial laser scanning (TLS) and unmanned aerial vehicle (UAV) photogrammetry on the example of the city of Sopot. Geo-Mar. Lett. 2020, 40, 675–685. [Google Scholar] [CrossRef]
  48. Available online: www.rompos.ro (accessed on 27 June 2022).
  49. Colomina, I.; Molina, P. Unmanned aerial systems for photogrammetry and remote sensing: A review. ISPRS J. Photogramm. Remote Sens. 2014, 92, 79–97. [Google Scholar] [CrossRef] [Green Version]
  50. Aguilar, W.G.; Angulo, C. Real-time video stabilization without phantom movements for micro aerial vehicles. EURASIP J. Image Video Process. 2014, 2014, 46. [Google Scholar] [CrossRef] [Green Version]
  51. Clapuyt, F.; Vanacker, V.; Van Oost, K. Reproducibility of UAV-based earth topography reconstructions based on Structure-from-Motion algorithms. Geomorphology 2016, 260, 4–15. [Google Scholar] [CrossRef]
  52. Mancini, F.; Dubbini, M.; Gattelli, M.; Stecchi, F.; Fabbri, S.; Gabbianelli, G. Using unmanned aerial vehicles (UAV) for highresolution reconstruction of topography: The structure from motion approach on coastal environments. Remote Sens. 2013, 5, 6880–6898. [Google Scholar] [CrossRef] [Green Version]
  53. Gomez, C.; Hayakawa, Y.; Obanawa, H. A study of Japanese landscapes using structure from motion derived DSMs and DEMs based on historical aerial photographs: New opportunities for vegetation monitoring and diachronic geomorphology. Geomorphology 2015, 242, 11–20. [Google Scholar] [CrossRef]
  54. Yu, J.J.; Kim, D.W.; Lee, E.J.; Son, S.W. Determining the Optimal Number of Ground Control Points for Varying Study Sites through Accuracy Evaluation of Unmanned Aerial System-Based 3D Point Clouds and Digital Surface Models. Drones 2020, 4, 49. [Google Scholar] [CrossRef]
  55. Casella, E.; Drechsel, J.; Winter, C.; Benninghoff, M.; Rovere, A. Accuracy of sand beach topography surveying by drones and photogrammetry. Geo-Mar. Lett. 2020, 40, 255–268. [Google Scholar] [CrossRef] [Green Version]
  56. Bakker, M.; Lane, S.N. Archival photogrammetric analysis of river–floodplain systems using Structure from Motion (SfM) methods. Earth Surf. Proc. Land. 2017, 42, 1274–1286. [Google Scholar] [CrossRef] [Green Version]
  57. Sevara, C.; Verhoeven, G.; Doneus, M.; Draganits, E. Surfaces from the Visual Past: Recovering High-Resolution Terrain Data from Historic Aerial Imagery for Multitemporal Landscape Analysis. J. Archaeol. Method Theory 2018, 25, 611–642. [Google Scholar] [CrossRef] [PubMed] [Green Version]
  58. Casella, V.; Chiabrando, F.; Franzini, M.; Manzino, A.M. Accuracy Assessment of a UAV Block by Different Software Packages, Processing Schemes and Validation Strategies. ISPRS Int. J. Geo-Inf. 2020, 9, 164. [Google Scholar] [CrossRef] [Green Version]
  59. Available online: http://www.esri.com/library/brochures/pdfs/arcgis-desktop.pdf (accessed on 16 June 2021).
  60. Nikolakopoulos, K.G.; Soura, K.; Koukouvelas, I.K.; Argyropoulos, N.G. UAV vs. classical aerial photogrammetry for archaeological studies. J. Archaeol. Sci. 2017, 14, 758–773. [Google Scholar] [CrossRef]
  61. Calina, A.; Calina, J.; Croitoru, A. Study on building of planimetric network stakeout for a commercial space using combined technology GPS-Total Station. Sci. Pap. Ser. E Land Reclam. Earth Obs. Surv. Environ. Eng. 2015, 4, 127–134. [Google Scholar]
  62. Dohner, S.M.; Pilegard, T.C.; Trembanis, A.C. Coupling Traditional and Emergent Technologies for Improved Coastal Zone Mapping. Estuar. Coast. 2020, 45, 938–960. [Google Scholar] [CrossRef]
  63. Talavera, L.; del Río, L.; Benavente, J. UAS-based High-resolution Record of the Response of a Seminatural Sandy Spit to a Severe Storm. J. Coast. Res. 2020, 95, 679–683. [Google Scholar] [CrossRef]
  64. Euromontana. Towards the integrated development of mountain areas and their recognition within the co-municipal agricultural policy. Shaping the new European space. In Proceedings of the Euromontana Conference, Piatra Neamț, Romania, 4–6 October 2007. [Google Scholar]
  65. European Commission. A Selection of Leader+ Best Practices; European Commission: Brussels, Belgium, 2009; Available online: http://madr.ro (accessed on 8 May 2022).
  66. Stetic, S. Specific features of rural tourism destinations management. J. Settl. Spat. Plan. Spec. Issue 2012, 1, 131–137. [Google Scholar]
  67. Ciolac, R.; Adamov, T.; Iancu, T.; Popescu, G.; Lile, R.; Rujescu, C.; Marin, D. Agritourism-A Sustainable Development Factor for Improving the ‘Health’ of Rural Settlements. Case Study Apuseni Mountains Area. Sustainability 2019, 11, 1467. [Google Scholar] [CrossRef]
  68. Available online: http://www.earthexplorer.com/2008-02/exploration_and_gis_closing_the_productivity_gap.asp (accessed on 5 June 2021).
  69. Available online: http://www.esri.com (accessed on 29 July 2022).
  70. Available online: http://lib.icimod.org/record/21429/files/attachment_85.pdf (accessed on 23 August 2021).
  71. Available online: https://www.nationalgeographic.org/encyclopedia/geographic-information-system-gis/ (accessed on 11 September 2021).
  72. Available online: http://www.opengis.unibuc.ro (accessed on 9 August 2021).
Figure 1. Permanent stations description chart PET2 and HORE (source: www.rompos.ro) [48].
Sustainability 14 14219 g001
Figure 2. The route flown by drone-type equipment (zona A—Village).
Sustainability 14 14219 g002
Figure 3. The route flown by drone-type equipment (area B—Rudărașu).
Sustainability 14 14219 g003
Figure 4. The route flown by drone-type equipment (area C—Zăpodie).
Sustainability 14 14219 g004
Figure 5. Photogrammetric flight planning area A—Village.
Sustainability 14 14219 g005
Figure 6. Photogrammetric flight planning area B—Rudărașu.
Sustainability 14 14219 g006
Figure 7. Photogrammetric flight planning area C—Zăpodie.
Sustainability 14 14219 g007
Figure 8. Uploading the photograms due to be processed.
Sustainability 14 14219 g008
Figure 9. The result of the frame alignment operation.
Sustainability 14 14219 g009
Figure 10. Generation of 3D polygonal model—parameters.
Sustainability 14 14219 g010
Figure 11. Generation of the data structure—parameters.
Sustainability 14 14219 g011
Figure 12. Ground resolution presentation (cm/pixel).
Sustainability 14 14219 g012
Figure 13. Digital elevation model generation (DEM)—parameters. Note 1: We can notice that following the processing, a resolution of the digital elevation model of 3.552 cm/pixel was obtained. Note 2: It should be noted that the results obtained from photogrammetric processing do not show real accuracy, because the frames were obtained using equipment without RTK capabilities, which means that positioning errors (both horizontally and vertically) are relatively large (but acceptable for this research).
Sustainability 14 14219 g013
Figure 14. Export results—options.
Sustainability 14 14219 g014
Figure 15. Relational database model (data structures).
Sustainability 14 14219 g015
Figure 16. Ground control points.
Sustainability 14 14219 g016
Figure 17. Presentation of vectorized elements (points, line, polygon).
Sustainability 14 14219 g017
Figure 18. Visualization of the attribute table.
Sustainability 14 14219 g018
Figure 19. Working area—uploading the elements of interest.
Sustainability 14 14219 g019
Figure 20. ArcMap—general presentation of the working space.
Sustainability 14 14219 g020
Figure 21. 3D visualization—presentation in “data view” format.
Sustainability 14 14219 g021
Figure 22. Attribute-based query—successive filtering results, step 2.
Sustainability 14 14219 g022
Figure 23. Location based query—results presentation.
Sustainability 14 14219 g023
Figure 24. ArcScene—secondary products presentation. Note: the working methodology was presented to demonstrate the analytical capacity of a GIS, but it should be noted that the results obtained (values) show significant errors due to the poor accuracy of the primary data (horizontal and vertical deviation).
Sustainability 14 14219 g024
Figure 25. Map with mandatory elements inserted (grid, legend, north direction, scale).
Sustainability 14 14219 g025
Table 1. Identified needs and means of fulfillment.
Need Means of Fulfillment
Evaluation of the territoryRealization of photogrammetric research with UAV type equipment and subsequent processing of raw data in order to obtain: aerial photograms; orthophotoplan.
DEM: level curves; other data that can be extracted from the photogrammetric processing research.
Integration of products obtained in a GIS to be exploited in order to obtain the necessary information.
Note: all data (both raw and processed) will be handed over to the beneficiary for further processing (except for this research).
Inventory and marking of existing/required resources (e.g., utility networks)
Estimation of required resources
Estimation of landscaping efforts: excavation areas; filling areas; arranging access areas; landscaping; etc.
Design and arrangement of buildings and marking depending on the destination
Technical data requested by designers
Other details that can be obtained by exploiting the results
Ensuring a constant flow of touristsTourism promotion: direct promotion; promote photos/videos; promotion of specialized sites; promotion through online GIS component (with the possibility of integration in the site of the agritourist farm).
Specifically, the objectives pursued by this work are presented in Table 2.
Table 2. Objectives pursued.
ObjectiveWays of Fulfillment
Orthophotoplan Use of photogrammetric equipment (UAV—drone type equipment) for the acquisition of field data and their processing in order to obtain raster images that will be used as graphics.
In order to fulfill the main objectives of this research, the photogrammetric works will be carried out in 3 distinct locations.
Data modelCarrying out the analysis process for identifying the data of interest and designing the data model necessary for the design and extension of an agritourist farm in the Mălaia–Vâlcea area.
Implementation of data model and obtaining GISImplementing the data model by using a specialized software product, vectorizing the details of interest, populating the database, and validating the data model.
For the implementation of the projected data model, both resources obtained within the research and pre-existing resources, obtained from public institutions (ANCPI) will be used.
Use of GISDemonstrating the usefulness of the geographic information system by presenting the analytical capabilities of the system.
GIS component publication for tourism promotion purposesWithin the research, a GIS component accessible via the Internet will be developed and published. This component will contain information on tourism promotion of the Mălaia–Vâlcea area.
In order to ensure the fulfillment of the research objectives, the stages of carrying out the activities (field and office) were established as follows (Table 3).
Table 3. Planning activities.
Activity TypeActivity DescriptionDetails
OfficeActivity planning and establishing the necessary resources (equipment, software, data, etc.). Activity planning: analysis of detailed requirements; primary GIS design; stages of works; raw data processing steps; GIS detail design; elaboration of final documentation; presentation of final results.
Identification of the resources needed to carry out the activities: material resources (drone, graphics processing station, software products, etc.); specific resources (cadastral technical documentation, shapefile resources, etc.); financial and human resources (time).
Throughout the research
FieldObtaining raw data by aerial photography: activities carried out in each work location; field marking of known coordinate points that will be used for georeferencing images (design, construction and location of ground control points, GPS measurements to determine the coordinates of control points); planning and performing the flights in order to obtain the photograms on the basis of which the orthophotoplans will be generated (flight planning, preparation and verification of used equipment, effective realization of the given acquisition flights); planning and carrying out activities to obtain the necessary data for the GIS component of tourism promotion.Estimated time:
60–90 min/location (does not include travel times)
Office/
Field
Carrying out the process of analyzing the needs for identifying the data of interest: the study of similar situations/systems; application of needs assessment questionnaires or by the interview method; inventory of information of interest; obtaining pre-existing resources.
Presentation of partial/final results to the beneficiary: presentation of partial (intermediate) results; application of corrective measures depending on the beneficiary’s response; presentation of final results.
Throughout the research
OfficeProcessing of raw data and obtaining an orthophotoplan (for each targeted location): use of the acquired raw data (photograms); use of a software product for photograms processing and obtaining an orthophotoplan; use of a software product for georeferencing the orthophotoplan; use of a software to generate and export secondary results (DEM, calibrated and optimized photograms, etc.).Estimated time:
10–14 days
(depending on the available hardware resources)
OfficeDesign and implementation of the data model (database):
in this stage, there will be carried out the process of designing the data model (database); the process of structuring input data; the process of structuring the output data (useful data, results); the implementation of the established data model, by using a specialized software product; obtaining a functional information system.
Successive application of corrective measures to meet research objectives
OfficeDevelopment of technical documentation and instructions for use.
In this stage will be elaborated: the technical documentation for the design of the geographical information system; manual/working procedures for using the geographical information system (case study).
Presentation and delivery of the final results of the research; preparation of acceptance documents
Note: given that some planned activities have a long duration, in practice there is the possibility of overlapping intervals.
Table 4. Necessary resources (material, human).
Resource TypeResourceUtility
Technical equipmentTopographic landmarks/
Marking on the ground
Marking on the ground some points for which the coordinates would be determined; these points/coordinates would be used in the office stage for georeferencing the obtained images; the marking would be made in each location of interest.
UAV type equipment—DroneUsed for flight and raw data acquisition (photograms); preferably hexacopter/octacopter type equipment will be used.
The results obtained are directly influenced by the technical capabilities of the equipment used (especially the accuracy in positioning). Thus, to ensure the elimination of positioning errors, it is recommended to use equipment with RTK capabilities.
This is also used to obtain resources for tourism promotion (aerial filming, panoramic photography, etc.).
CameraUsed (along with drone) for raw data acquisition; this equipment must meet the minimum requirements for obtaining photograms; depending on the available UAV equipment, the integrated camera/camera may be used.
Laptop/TabletUsed for flight planning and performance; immediate analysis of gross results; preparation and presentation of documentation.
Graphic stationUsed for: raw data processing (photograms) and orthophotoplan generation; orthophotoplan georeferencing; obtaining and running geographic information system; development of technical documentation and procedures to use.
Software productsUsed for: flight planning and conducting; raw data processing (photograms); obtaining graphic support; georeferencing images (orthophotoplan); design, implementation and operation of a geographic information system; generation and publication of GIS tourism promotion component; development of technical documentation and procedures to use.
GNSS receiverUsed to determine the coordinates of points marked on the ground (control points, marking panels).
Total station/levelUsed to determine on the ground any additional details required (directions, angles, distances, etc.).
Operational resourcesSurveys of buildings, cadastral documentationUsed by integration in GIS (overlapping on orthophotoplans).
Administrative documentsUsed to obtain input data for the geographic information system (authorizations, property titles, tourist promotion materials, etc.).
Other documents of interestUsed to obtain input data for the geographic information system.
Resources
generous
Human resources (time), financial, car, space, etc.General resources that will be used for the research.
Table 5. Coordinates inventory GPS.
Location/
Area
Field Card Presentation
PointStereo70 (m)WGS84 (Decimal Degree)PointStereo70 (m)WGS84 (Decimal Degree)
X CoordinateY CoordinateBLX CoordinateY CoordinateBL
A
Village,
7 points
1417,550.820432,395.13245.38642123.9454275417,504.782432,631.67045.38854423.944799
2417,800.587432,346.97845.38601723.9486246417,998.496432,500.96645.38742623.951126
3417,904.304432,411.53645.38661023.9499387417,655.595432,688.82045.38907623.946715
4417,759.841432,573.99145.38805523.948066
B
Rudărașu,
8 points
8417,915.417432,556.52845.38791623.95005612418,075.225432,630.08245.38859723.952084
9417,719.095432,712.10345.38929323.94752213418,284.246432,642.25345.38873123.954751
10417,858.266432,797.82945.39008123.94928514417,997.438432,501.49545.38743123.951112
11417,981.033432,756.55445.38972423.95086015417,870.437432,488.26645.38729723.949493
C
Zăpodie,
8 points
16418,976.984432,002.40645.38305423.96370420419,262.395431,767.21845.38097123.967387
17418,962.531431,872.09945.38188023.96354121419,227.337431,850.11045.38171323.966926
18418,966.275431,784.01945.38108823.96360322419,071.860431,985.00045.38290923.964918
19419,162.243431,697.13045.38032923.96612023419,170.317431,921.99845.38235323.966186
Table 6. Flight mission planning.
CharacteristicsValue
Area A (Village)Area B (Rudărașu)Area C (Zăpodie)
Flight speed7.00 m/s7.00 m/s7.00 m/s
Return modeAdaptiveAdaptiveAdaptive
Ground resolution2.00 cm2.00 cm2.00 cm
Longitudinal overlay70.00%70.00%70.00%
Side overlay60.00%60.00%60.00%
Flight direction angle (for optimizing)103.66 degrees125.59 degrees103.66 degrees
Even if the direction of the flight path is not optimal, this flight direction was chosen due to the large level differences on the area of interest
Actions performedAt each pointAt each pointAt each point
Action taken at the last pointReturn to the point of departure/take-offReturn to the point of departure/take-offReturn to the point of departure/take-off
Altitude typeAbove ground levelAbove ground levelAbove ground level
Camera tilt90.00 degrees90.00 degrees90.00 degrees
Camera trigger typeAutoAutoAuto
Area13.23 hectares13.20 hectares 13.35 hectares
Ground print (m)97.28 × 72.9697.28 × 72.9697.28 × 72.96
Numbers of crossings/routes9811
Number of photos249221217
Distance between 2 photos21.89 m21.89 m21.89 m
Estimated distance to be covered5.1 km4.5 km4.3 km
Estimated flight time12 min 9 s10 min 55 s10 min 28 s
Maximum altitude (above ground)680 m686 m654 m
Minimum altitude (above ground)78 m76 m76 m
Number of obtained photograms (resolution 20 Mpx)230207208
Table 7. Processing parameters and results obtained from photogrammetric processing.
ParameterArea A (Village)Area B (Rudărașu)Area C (Zăpodie)
OrthophotoplanSustainability 14 14219 i001Sustainability 14 14219 i002Sustainability 14 14219 i003
No. of images230207164
No. of camera stations230207164
Flight altitude105 m105 m92.6 m
Ground resolution2.24 cm/pixel2.31 cm/pixel1.9 cm/pixel
Covered area0.266 km20.201 km20.135 km2
Connection points2,043,0841,719,8911,560,115
No. of projections5,242,9294,131,1143,749,550
Camera positioningSustainability 14 14219 i004Sustainability 14 14219 i005Sustainability 14 14219 i006
Digital Elevation Model (DEM)Sustainability 14 14219 i007Sustainability 14 14219 i008Sustainability 14 14219 i009
DEM resolution2.24 cm/pixel2.31 cm/pixel1.9 cm/pixel
Maximum altitude 661 m730 m674 m
Minimum altitude595 m600 m581 m
Point density0.198 points/cm20.187 points/cm20.278 points/cm2
Coordinate systemWGS 84 (EPSG::4326)WGS 84 (EPSG::4326)WGS 84 (EPSG::4326)
Processing times
Matching photograms2 h 0 min1 h 42 min0 h 0 min 12 s
Aligning photograms0 h 12 min 29 s0 h 12 min 55 s0 h 20 min 8 s
Scattered cloud point generation14 h 54 min10 h 25 min6 h 11 min
Dense cloud point generation2 h 6 min1 h 56 min1 h 30 min
Structure generation1 h 7 min54 min 27 s37 min 58 s
DEM generation8 min 43 s7 min 3 s5 min 58 s
Orthomosaic generation 1 h 41 min21 min 57 s1 h 4 min
Publisher’s Note: MDPI stays neutral with regard to jurisdictional claims in published maps and institutional affiliations.

