Article

Growth Trends and Heterogeneity of Total Factor Productivity in Nine Pan-PRD Provinces in China

1
School of Economics, Guangxi University, Nanning 530004, China
2
School of Business, Guangxi University, Nanning 530004, China
*
Authors to whom correspondence should be addressed.
Sustainability 2022, 14(21), 14154; https://doi.org/10.3390/su142114154
Submission received: 15 August 2022 / Revised: 20 October 2022 / Accepted: 26 October 2022 / Published: 30 October 2022
(This article belongs to the Special Issue Economic Sustainability of the Economy)

Abstract

:
As a national regional development strategy and a vital region of the Belt and Road Initiative, the sustainable development of the Pan-Pearl River Delta (Pan-PRD) region is of great importance. The national development plan emphasizes improving total factor productivity (TFP) and promoting high-quality economic development. This paper uses the DEA-Malmquist index model to measure the TFP of nine provinces in the Pan-PRD region based on inter-provincial panel data from 2003 to 2020. Furthermore, it analyzes its growth trend and heterogeneity characteristics in the inter-provincial spatial, industrial, and city dimensions. The results show that in the time dimension, TFP shows a W-shaped fluctuation trend, technical efficiency grows slowly, and technical progress is the pillar of TFP improvement. The spatial dimension shows a high distribution in the center and low distribution in the south. On the industry dimension, the TFP is in descending order as follows: tertiary industry—secondary industry—primary industry. The spatial distribution is heterogeneous, exacerbating the uneven economic development within the region, and the regional industrial structure needs urgent optimization. The spatial development of city TFP is uneven, and the number of cities with a TFP below 1 is increasing. Finally, we suggest policies to accelerate regional collaborative innovation, cultivate advantageous industrial clusters, create an advantageous industrial ecosystem, and achieve sustainable development in the Pan-PRD region.

1. Introduction

In March 2016, the Guidance on Deepening Pan-Pearl River Delta Regional Cooperation issued by the State Council of China elevated the Pan-Pearl River Delta regional cooperation to a national strategy. The region also became one of the three major national regional development strategies alongside the Beijing-Tianjin-Hebei integration and the Yangtze River Economic Belt, as the Pan-PRD region is an important region in China’s Belt and Road Initiative. Because of its strategic position, the Pan-PRD region has been incorporated into the outline of the 13th and 14th Five-Year Plans of the country. In the 14th Five-Year Plan, a new pattern of China’s economic development will be built to improve total factor productivity (TFP) and promote high-quality economic development. As an important criterion for judging the growth quality and development potential of an economy, the TFP embodies the development concept of “intensive growth” and is in line with China’s concept of innovation-driven high-quality development. Therefore, how to further improve the TFP in the Pan-PRD region relates to the sustainable and high-quality development of the region and thus affects the achievement of the national and regional development strategy goals.
The Pan-PRD region includes nine mainland provinces (i.e., Fujian, Guangdong, Jiangxi, Hunan, Guangxi, Hainan, Guizhou, Sichuan, and Yunnan) and the two special administrative regions of Hong Kong and Macao, or “9 + 2” for short; With a population of around 509 million, it accounts for more than one-third of China’s economic output. In 2004, the GDP of the nine mainland provinces in the Pan-PRD region (only the nine mainland provinces are studied in this study, referred to as the Pan-PRD nine provinces) was 4.9 trillion RMB (equivalent to 0.476 trillion Euros), the GDP per capita was 0.9959 million RMB (0.097 million Euro). In 2020, it will be 34.08 trillion RMB (equivalent to 4.33 trillion Euros), the GDP per capita was 6.318 million RMB (equivalent to €0.802 million, when the global GDP per capita was €0.95 million and the global median GDP per capita was €0.341 million), being nearly seven times higher than the one in 2004and showing a steady increase, along with promoting internal multi-disciplinary collaboration, integrating of the regions, and achieving sustainable development. The Pan-PRD region straddles three different economic development ladders in the east, middle, and west of China, with large differences in internal economic development levels and strong complementarities in natural conditions and social development. This region also connects South Asia, Southeast Asia and the Pacific Ocean, and the Indian Ocean, thus having unique geographical advantages.
The traditional economic theory considers that the total output of each production agent can not be fully explained by the input of production factors, and TFP is understood as the “residual” level of productivity after deducting the contributions of material inputs, mainly referring to the level of contribution of non-productive factor inputs to total output, meaning that it is mainly coming from the technological progress and technical efficiency improvement of enterprises. First, the current scholarly research literature in China in this area mainly focuses on the measurement, influencing factors, and spatial evolution of the TFP by regions (national, regional, and provincial), and industry. For example, Zhang et al. [1] used the Malmquist index method to measure the TFP in China from 1979 to 2005 and analyzed TFP trends and the causes of TFP fluctuations. They concluded that since the reform and opening up in 1979, China has achieved a significant increase in TFP due to the advances in technical efficiency and production technology. However, after 1997, due to the decline in technical efficiency, TFP growth tended to decline. In their time series, the average growth rate of the TFP in China is 1.60% and its contribution to economic growth is 16.57%. Furthermore, the convergence effect of TFP does not occur at this time due to the widening technological gap between regions. Guo et al. [2] comparatively studied the spatial gap of TFP between China and major innovative countries and the main influencing factors of TFP in China from 2001 to 2018. They found that China’s TFP is considered to have improved annually, while the relative gap with the average of innovative countries has steadily narrowed. They also proved that the leading role of the tertiary industry is becoming increasingly prominent, and science and technology funding and human investment play a stable and sustained role in improving it.
Second, TFP is studied for different regions (or provinces), industries, or sectors in China. For example, Zhang et al. [3] used regression analysis to measure TFP and Solow’s residual in China and the Yangtze River Delta region from 1978 to 2003 and compared the results. The average annual TFP and Solow surplus (1.056%) in the Yangtze River Delta were higher than the national average (0.015%), and this region’s technological progress has been mainly driven by the institutional change of marketization and internationalization orientation, which is typical in China. Zhang et al. [4] used the data envelopment analysis (DEA)-Malmquist productivity index method to measure the TFP growth rate and its decomposition index for six central provinces of China from 2000 to 2020 and conducted heterogeneity analysis. The results showed that the TFP of the six central provinces had an overall growth trend, with an average annual growth rate of 2.62% during the sample period. There was large inter-provincial heterogeneity in TFP growth rates among provinces and there may be σ convergence between technical progress and technical efficiency indices. Xiang et al. [5] measured the quality development efficiency and TFP of China’s regional economies during 2001–2018, and established that the eastern region had the highest quality development efficiency and the lowest TFP. There were significant regional differences in quality development efficiency in the east-west direction, government, urbanization rate and marketization level that positively influence the TFP. Yu et al. [6] used the DEA-Malmquist index method and ESDA method to empirically study the spatial and temporal evolution of TFP in the logistics industry from the Yangtze River Economic Zone of China. They found that the logistics industry has been developing well, with an inverted “N” trend. Further, technological progress was the main reason for TFP growth, the regional spatial distribution was high in the east and low in the west, and the TFP level was generally on an upward trend. Shen [7] used the nonparametric Malmquist index method to study the characteristics of the time series growth and spatial distribution of TFP and its components in China’s manufacturing industry from 1985 to 2003. The study concluded that the gap between manufacturing TFP and the growth rate of technological progress in the east, central and western regions showed a diverging trend. Moreover, the regional TFP gap continued to widen, being closely related to the difference in the degree of regional technological progress. Gao et al. [8] used the DEA-Malmquist model and ESDA method, to analyze the time-evolving characteristics and spatial heterogeneity of agricultural TFP in 30 Chinese provinces from 2007 to 2017. They found that Chinese agricultural TFP varies significantly and has a strong spatial correlation in the time dimension and spatial region and the agricultural technological progress was the primary factor of agricultural TFP growth in China. However, technical efficiency maintained a stable trend and made a limited contribution to agricultural TFP growth. Tian et al. [9] used the DEA-Malmquist index and SFA method to measure the TFP of tertiary industry in China from 2001 to 2015 and examined the regional differences among eight economic regions. The study concluded that there were obvious regional differences in the TFP of the tertiary industry, with the developed eastern regions being significantly higher than the less developed regions. They include the northwestern regions, and the regional differences did not show convergence characteristics. The differences in technological progress lead to regional differences in the TFP of the tertiary industry; the proportion of employees in the tertiary industry, R&D investment intensity, and anti-corruption efforts were the main influencing factors of the TFP of the tertiary industry.
Third, some scholars conducted studies on the TFP of a particular industry, province, or regional city in China. For example, based on the panel data of 13 cities in Hubei province during 2009–2017, the DEA-Malmquist parameter method was applied to measure the TFP of each city. The results showed that the TFP of each city in Hubei province tends to decline during the study period (by around 14.4% annually). Additionally, there was a hierarchical negative growth of technical change among cities as the main reason for the decline in TFP, as it tended to diverge across cities, while technical efficiency tended to converge to absolute σ [10]. Using the DEA-Malmquist and KSM method, Jin et al. used a sample of 2543 urban counties in China from 2007 to 2010 and found that the TFP of each city and county declined at an average annual rate of 6.2% (DEA-Malmquist) and 8.2% (KSM). The eastern region shows growth and dispersion mainly in urban downtowns; while the western region grows mainly in non-urban population clusters. There was also a negative correlation between the change in TFP and the change in fixed capital stock at the urban-county level [11].
Therefore, in response to the more prominent contradiction between labor shortage and the rising wages in the Pan-PRD region in recent years, China’s demographic dividend is disappearing, coupled with the increase of hard constraints on resources and the environment, in addition to the slow recovery of the global economy. Additionally, China’s traditional economic growth momentum is gradually weakening. The Pan-PPRD region is located in the south of China, spanning three regions in the east, middle, and west of China, including the most economically developed and economically backward provinces in each region. The important national strategic position of the Pan-PRD region and the national concept of innovation-driven and high-quality development have raised the importance of the Pan-PRD region and TFP at the national level. Therefore, the research on the development trend and heterogeneity of the Pan-PRD region and TFP is of great theoretical significance and practical value at this stage. As such, this study uses the DEA-Malmquist index model to measure the dynamic trends of TFP and inter-provincial spatial differences, inter-industry differences among three industries, and inter-city differences in nine Pan-PRD provinces based on panel data over 18 years (2003–2020) since the establishment of Pan-PRD regional cooperation. It also explores how the Pan-PRD region can break the traditional reliance on capital and labor to drive economic growth and how it can take targeted measures to enhance the overall competitive strength of each province and region. Furthermore, it explores the shift in the traditional economic growth momentum to a total factor-driven track, the achievement of sustainable development, and the promotion of this region’s status as an important national regional strategy. In short, this study answers the following questions: (i) what is the level of TFP that has been achieved in the Pan-PRD region during the 18 years since the establishment of regional cooperation, and what long-term trends does it have? (ii) What are the problems of TFP level and total factor growth of industries in the Pan-PRD region? (iii) What are the differences in the level and spatial distribution of TFP in cities? In view of the important national strategic status of the nine Pan-PRD provinces, this study uses the DEA-Malmquist index model to measure the dynamic changes in TFP, inter-provincial spatial differences, and industrial differences in the 18 years of Pan-PRD cooperation, based on panel data from 2003 to 2020 and puts forward suggestions for improving countermeasures to provide a reference for the Pan-PRD region to further strengthen cooperation, enhance the overall competitive strength, achieve sustainable development, and become an important national regional strategy.

2. Materials and Methods

2.1. DEA-Malmquist Index Model

The DEA-Malmquist index was first introduced in 1953 by the Swedish economist and statistician Stem Malmquist, who used it to analyze consumer behavior. Since then, the method has been gradually applied to the measurement of productivity and technological progress, driven by the development of distance functions. In 1982, Caves D W, Christensen L R and Diewert W E combined the Malmquist index with a nonparametric DEA to construct a DEA-Malmquist index model that can use panel data to estimate the decision-making units (DMUs) production efficiency dynamics. In 1994, Rolf Fare, Grosskopf, Norris, and others further developed a nonparametric linear programming algorithm based on the Mohs productivity index to establish an index for measuring the rate of change of total factor productivity, and then applied the distance function to decompose the rate of change of total factor productivity into technological change and efficiency change, promoting the DEA-Malmquist. The DEA-Malmquist index is applied to measure TFP and decompose TFP in multiple fields. The current TFP level measurement methods are divided into traditional OLS estimation method, semi-parametric estimation method, and production frontier estimation method, etc. This study adopts the non-parametric DEA-Malmquist index model to measure the TFP of nine Pan-PRD provinces based on the following two advantages of the method. Firstly, the method uses linear programming to measure the boundary production function and distance function, which does not require setting the estimation parameters before the study. Additionally, there is no need to make any subjective assumptions on the construction of the production function and its distribution, meaning it can effectively avoid the bias of the measurement results caused by the misconfiguration of the production function. Second, the method can deal with multiple input and output indicators simultaneously, and the weights of each indicator are generated by the data and the model itself without a subjective setting, thus effectively avoiding the errors caused by the human subjective setting in the selection of data and the construction of the parametric model. Third, the method considers technical inefficiency, subdivides the TFP into technical progress rate and technical efficiency, and further decomposes technical efficiency into scale efficiency and pure technical efficiency. Thus it can effectively measure the TFP and its decomposed indexes in different time series, which helps to reasonably explain the variability of economic development levels, and can also more clearly judge the effective ways to improve the level of TFP, while the factors influencing TFP can be analyzed from multiple perspectives, such as management, technology, and resources. Xiao [12] demonstrated the applicability of the DEA-Malmquist method to TFP studies in different Chinese provinces by comparing the DEA-Malmquist model with the Solow residual method.
Based on the panel data of nine Pan-PRD provinces from 2003 to 2020, this paper assumes that in period t (t = 1, 2,…, T), the G-th decision unit DMU (g = 1, 2,…, G) uses r input factors X k m t (r =1, 2,…, R) to obtain the m-th output y k m t (m = 1, 2,…, M). From the input point of view, the optimal production frontier for each period is:
F t ( y t ) = ( X 1 t ,   X 2 t , ,   X R t )
We compare the output of the i-th decision unit DMU (e.g., for each province or city) with the optimal production frontier, and the distance function D i t ( x t , y t ) is applied to measure the change in technical efficiency from period t to period t + 1, under the technological conditions of period t. The Malmquist index for period t of this DMU is obtained as:
M i t = D i t ( X t , y t ) D i t ( X t + 1 , y t + 1 )
Subsequently, the index of TFP change in periods t and t + 1 is the geometric mean of the Malmquist index of TFP change. Its calculation formula is.
M ( x t + 1 , y t + 1 , x t , y t ) = [ D t ( x t , y t ) D t ( x t + 1 , y t + 1 ) × D t + 1 ( x t , y t ) D t + 1 ( x t + 1 , y t + 1 ) ] 1 / 2
In Equation (3), x t , y t are the quantities of inputs and outputs in period t. D t ( x t , y t ) represents the output-based distance function in period t . D t ( x t + 1 , y t + 1 ) represents the ratio of the actual level of output to the expected maximum level of output for period t + 1 inputs for period t production technology, being the level of technical efficiency achieved. TFP = M ( x t + 1 , y t + 1 , x t , y t ) > 1 indicates a positive growth from period t to t + 1, TFP < 1 indicates a decline, and TFP = 1 means there is no change between periods.
Breaking down the Malmquist index further, we obtain:
M ( x t + 1 , y t + 1 , x t , y t ) = D t ( x t , y t ) D t + 1 ( x t + 1 , y t + 1 ) × [ D t + 1 ( x t , y t ) D t ( x t + 1 , y t + 1 ) × D t + 1 ( x t + 1 , y t + 1 ) D t ( x t , y t ) ] 1 / 2 = TEC × TC   = TFP
In Equation (4), D t ( x t , y t ) D t + 1 ( x t + 1 , y t + 1 ) represents the index of technical efficiency change (TEC), which is greater than 1, representing the continuous improvement of technical efficiency; the opposite indicates the continuous decrease of technical efficiency. [ D t + 1 ( x t , y t ) D t ( x t + 1 , y t + 1 ) × D t + 1 ( x t + 1 , y t + 1 ) D t ( x t , y t ) ] 1/2 represents the index of technical change (TC), which is greater than 1, indicating that the technical level has progressed; otherwise, the technical level has regressed. The technological level has regressed from the previous level. Technological progress indicates an increase in output due to factors such as innovation in production technology or the introduction of new technology when inputs are constant. Technical efficiency indicates the ability to produce the most output with constant inputs, or the least input with constant output.
When the payoff of scale is variable, TEC is equal to the product of pure technical efficiency change (PEC) and scale efficiency change (SEC): TEC = PEC × SEC. PEC represents the efficiency value that leads to innovation under the influence of technology, management, and other factors; SEC represents the change in production efficiency influenced by scale factors such as cost, resources, and revenue of the firm.

2.2. Data Sources and Data Processing

In this paper, the DEA-Malmquist index method is used to measure the TFP at the inter-provincial level, industry level and city level in the nine provinces in the Pan-PRD region. Since the concept of “Pan-PRD region” was formally introduced in July 2003, the basic data of the nine provinces in the Pan-PRD region from 2003 to 2020 are collected with 2003 as the base year. The data are obtained from the 2004–2021 China Statistical Yearbook, the China Labor Statistics Yearbook, and the statistical yearbooks of each province. Since the above-mentioned relevant data at the city level in 2020 were not published, the relevant data for the study at the city level were from 2003 to 2019. The sample data used for the study totaled 100 in the nine Pan-PRD provinces. However, due to a small number of cities with incomplete statistics or short establishment time of the cities, the study excluded seven cities, including nine in Fujian Province, 11 in Jiangxi Province, 21 in Guangdong Province, 14 in Guangxi Province, 13 in Hunan Province, four in Guizhou Province, 18 in Sichuan Province, eight in Yunnan Province, and two in Hainan Province.

2.2.1. Output Indicators and Data Description

In this paper, the gross national product data of each province, industry, and city are used as output indicators, drawing on relevant studies by scholars. The GDP of each province, industry and city in calendar years (at current year prices) is converted using the GDP price index to obtain the real GDP of each province, industry and city in calendar years (expressed in constant 2003 prices, unit: billion RMB) (Table 1).

2.2.2. Input Indicators and Data Description

The input indicators in this paper include: labor input indicators and capital input indicators of each province and its industries.
(1) Labor input indicators. This paper draws on relevant studies [13,14,15] based on the method of years of education for the nine provinces, industries, and cities published in the China Labor Statistics Yearbook and the provincial statistical yearbooks inter-provincial and industrial year-end employment numbers. Furthermore, it delves into the percentage of employment numbers at each education level from illiterate to graduate, and use the product of the year-end employment numbers (average of the number of persons employed at the end of the year in periods t and t − 1) in each province in period t and the average number of years of education in the same period to calculate the human capital stock in each province in period t. When calculating the average number of years of schooling, this study refers to the calculation standards of the National Bureau of Statistics of China and the Ministry of Social Security by assuming that the numbers of years of education from illiteracy, elementary school, junior high school, senior high school (middle school), college (senior high school), bachelor’s degree to graduate level are 0, 6, 9, 12, 15, 19 and 22 years, respectively. Because the share of employment at different levels of education at the industry and city level in each province is not published in publicly available statistics such as national, provincial and municipal statistics, the human capital stock at the industry level and city level are calculated using the average number of employed persons at the end of two adjacent years with reference to the practice of most domestic scholars (see Table 1).
(2) Capital investment index. This paper follows the perpetual inventory method commonly used by domestic scholars to measure the capital stock of nine provinces, provinces, industries and cities from 2003 to 2020. The formula is:
K it = ( 1 δ i )   K it 1 + A I i t F I i t
where Kit is the capital stock in period t, A I i t is the nominal fixed asset investment in province i in period t (in current year prices), F I i t is the fixed asset investment price index in province i in period t (in constant 2003 prices), and δ is the capital stock depreciation rate. In this paper, the Hall and Jones method is applied to estimate and calculate the fixed capital stock K t for the 2003-based period for the nine provinces, industries and cities, where f is the growth rate of investment in the adjacent period, and is publicized as:
K t = A I t F I t f + δ = 1 f + δ   ×   A I t F I t
Most domestic scholars [16,17,18,19] have chosen the total social fixed capital formation of the province under study in the current year as the investment amount in that province. Yang [20], and Zhang et al. [21] have verified the accuracy of this method. Therefore, in this study, the total social fixed capital investment (in RMB billion) of the nine provinces or industries is used as the corresponding investment amount for the year. However, the city-level one uses the fixed asset investment amount of the city. The corresponding fixed asset investment price index of each province is used to reduce the total social fixed asset investment of the nine provinces and industries as well as the amount of urban fixed asset investment to the constant price of the base period of 2003 (Table 1). China’s dividesindustries as follows: the primary industry includes agriculture (including forestry, animal husbandry, fisheries, etc.); the secondary industry includes industry (including extractive industries, manufacturing, water, electricity, steam, hot water, gas) and construction; and the tertiary industry includes industries other than the above-mentioned primary and secondary industries. The tertiary industry is divided into two major parts: the distribution sector and the service sector.
In estimating the depreciation rate of each province, the differences in provincial economic development levels and the effects of time changes should be fully considered. Therefore, this study does not adopt the practice of using the same fixed capital depreciation rate (9.6% or 10%) in most domestic scholars’ studies but utilizes the capital depreciation rate for each province from 1993 to 2010 measured in the studies of Zhang et al. [22] and Jia et al. [23], which is consistent with Zhang (2007), Wu (2008) and others who use the same value of capital. The results of the depreciation rate measurement of TFP are compared with the results of the same value of capital depreciation rate commonly used in China such as in Zhang (2007) and Wu (2008), as well as with the capital stock calculated from the depreciation amount of fixed assets published by the National Bureau of Statistics, and the consistency is high. In this study, we apply the algorithm of Zhang et al. [22] to measure the capital depreciation rate of provinces in stages, based on the capital depreciation rate of each province measured from 1993 to 2010 and calculated in constant 2003 prices to obtain the capital depreciation rate among the nine analyzed provinces from 2011 to 2017, which is shown in Table 1. Since 2018, the National Bureau of Statistics, the provinces do not require the provinces to calculate their GDP by the income method, so there is no data to obtain the depreciation of capital assets in each province for 2018–2020. Therefore, the capital depreciation rate for this time period is the same depreciation rate of the same provinces as that obtained from the calculation for 2011–2017, and the capital stock of each province is measured using the depreciation rate of the two stages. The input and output indicators for the TFP measures in this study are shown in Summary Table 2.

2.3. Convergence Test Model

The σ convergence and β convergence methods were first proposed by Barron and Sala-I-Martin, in 1991 to test the trend of regional income level or output gap changes [24]. In this paper, we use σ and β convergence to test the trends of TFP indicators in the nine provinces to determine whether the differences that exist disappear with steady-state levels in the long-run trend.

2.3.1. Intra-Regional σ Convergence Test

To test the dynamic trend of the TFP dispersion in the nine provinces during the period under examination, the coefficient of variation is applied for quantitative analysis, and the test formula [25] is:
σ t = [ i n ( T F P i t T F P ¯ ) ] 2 / n T F P ¯
where σt denotes the coefficient of variation of TFP of the region examined in period t, TFPit denotes the TFP index of the i -th region in period t, T F P ¯ represents the mean, and n is the number of observations. If the coefficient of variation σt gradually decreases in the examined period, it means that the intra-regional variation of TFP in the region gradually decreases and there is a convergence trend.

2.3.2. Intra-Regional β-Convergence Test

The intra-regional β absolute convergence test evolves from a regression of income growth rates on initial income levels. Absolute β convergence describes whether provinces or cities with different levels of TFP at the beginning of the period eventually narrow their differences and reach a common steady-state level. This study is based on Barron and Sala-I-Martin [24]. The regression model of absolute convergence is adjusted as:
g t = a + β ln ( T F P t 1 ) + l n ε t
where g t is the regional TFP growth rate from period t − 1 to period t , TFPt−1 is the value of regional TFP in period t − 1, and ε t is the random error. If regression coefficient β is significantly negative, there is absolute convergence and significant convergence in income levels between provinces or cities; conversely, there exist dispersion and significant variation.

3. Analysis of Results

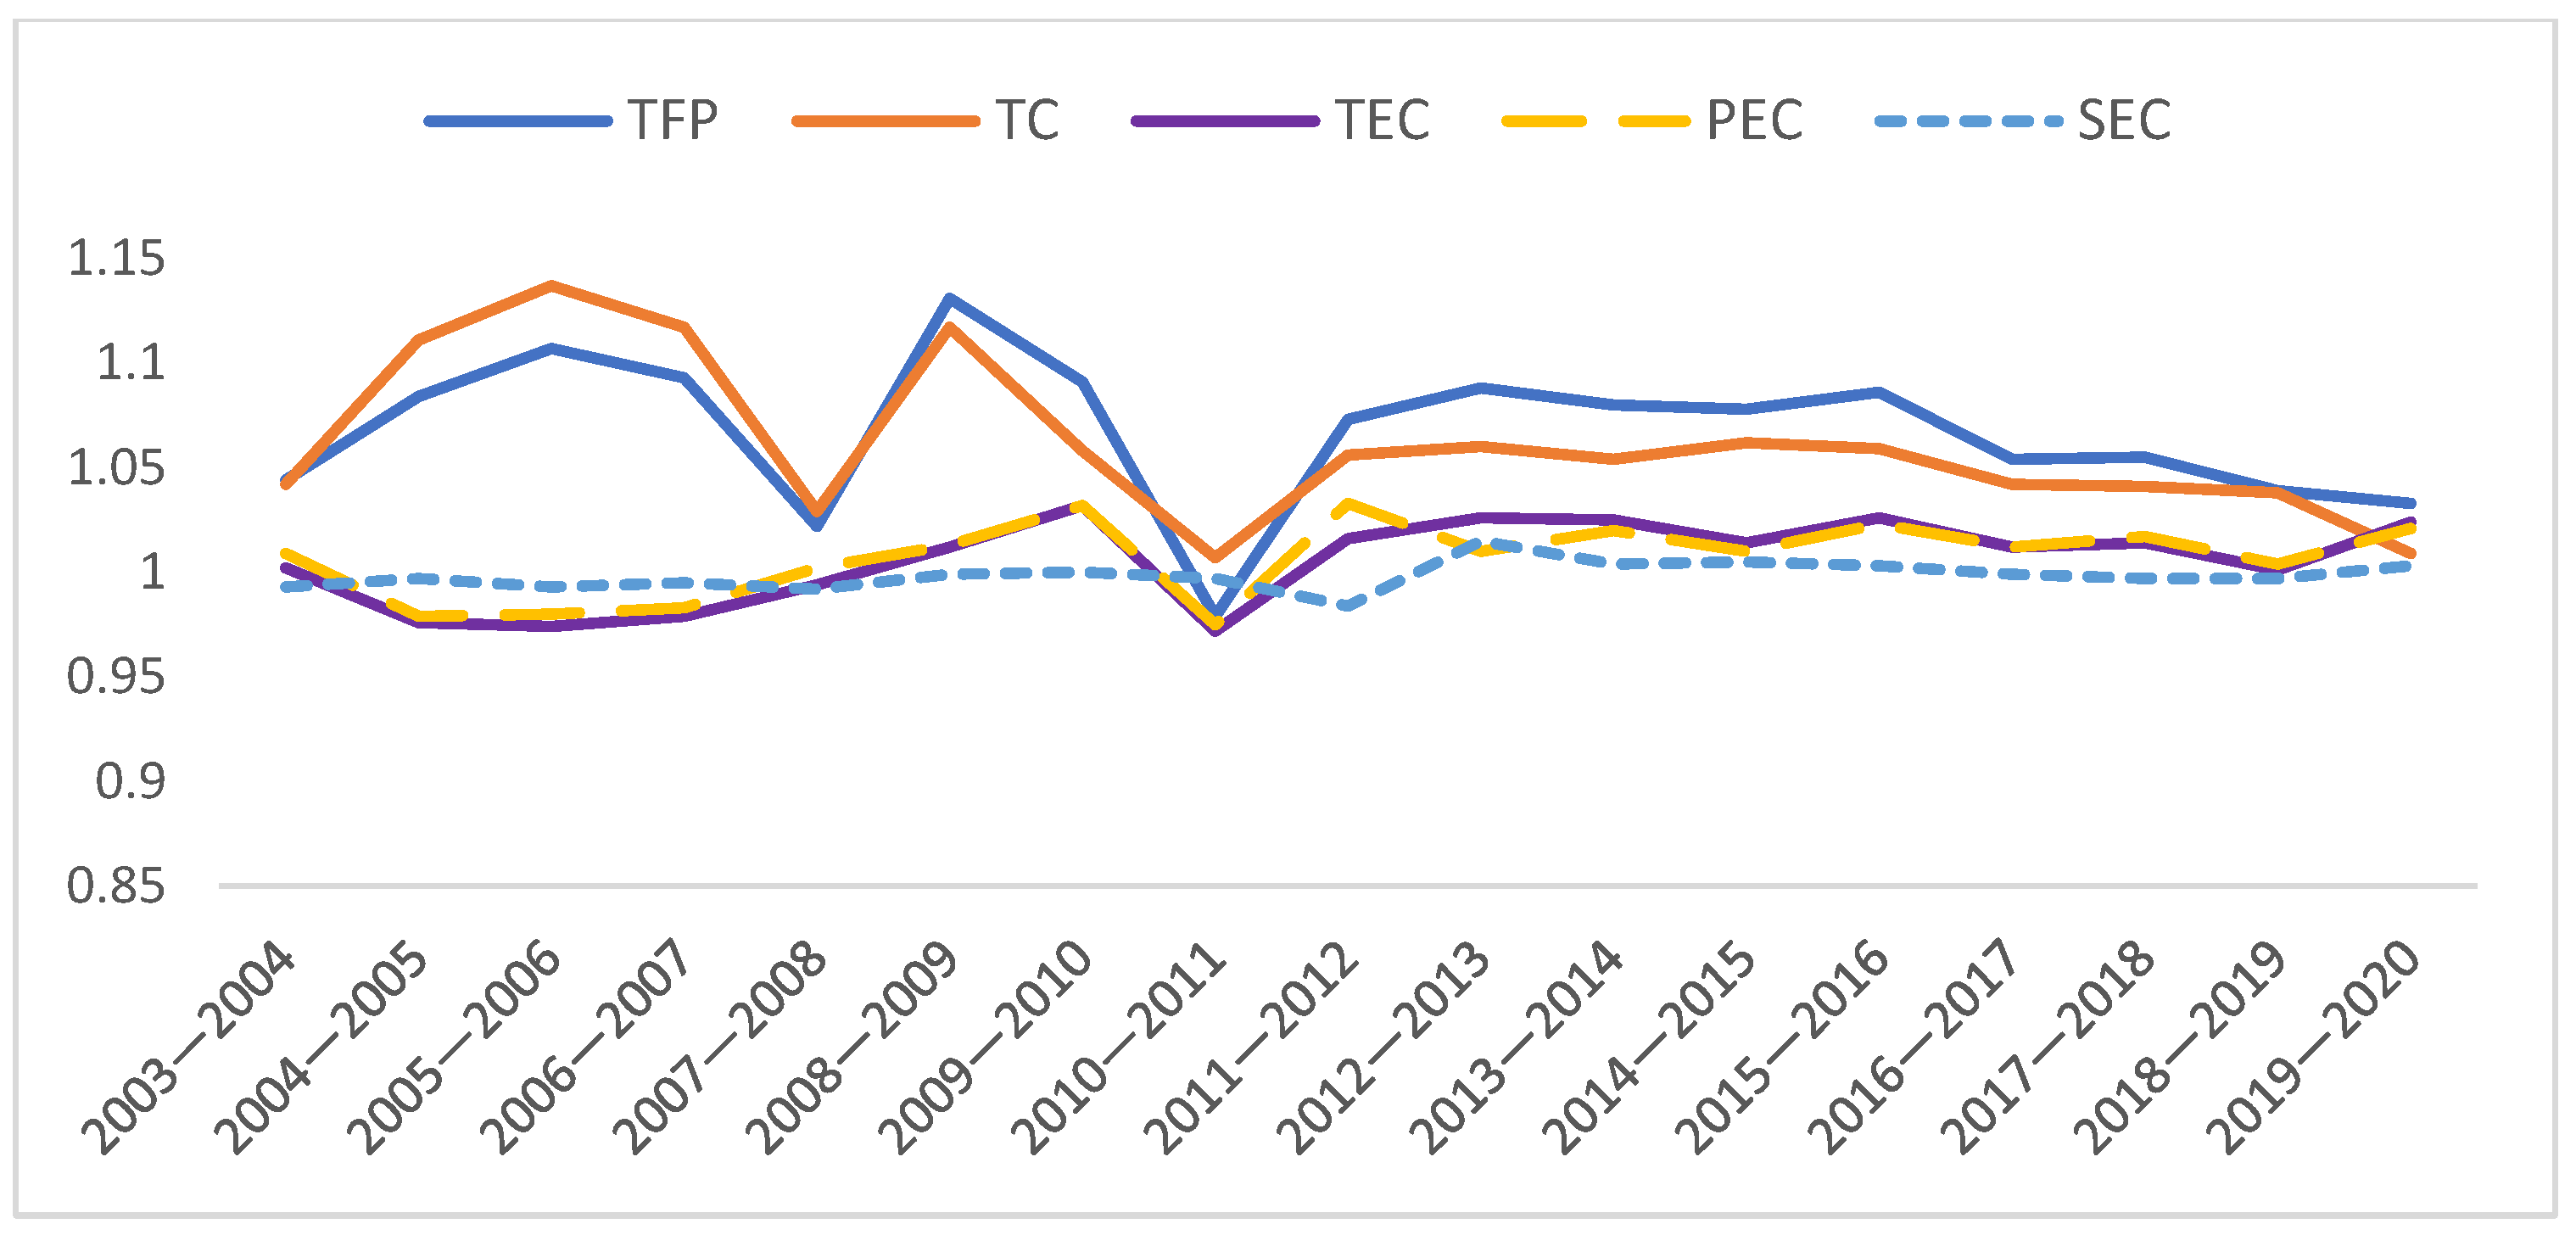
3.1. Analysis of TFP Growth Trend in Nine Pan-PRD Provinces: Time Dimension

This study used DEAP2.1 software to calculate the TFP and its decomposition of the provincial panel data of input-output indicators of nine Pan-PRD provinces from 2003 to 2020, and the results are shown in Table 1. The overall dynamic changes of TFP in the nine Pan-PRD provinces have the following characteristics.
First, the average annual growth rate of TFP in the nine Pan-PRD provinces is 6.6%, and the contribution of TFP to the output growth of the nine Pan-PRD provinces is high (64.2%). TC is the main determinant of the improvement of TFP in the nine Pan-PRD provinces. In 2004–2006 and 2008–2009, the average annual growth rate of TFP in the nine provinces rose from 4.4% to 10.7%; TFP continued to grow from 2.2% effectively driving strong TFP growth to 13.1% in 2008–2009. In 2006–2008 and 2009–2020, there were two phases of retreat. In 2008–2009, the U.S. subprime mortgage crisis and the global financial crisis broke out, and the prices of resource-based products rose significantly, which had a large impact on the manufacturing industry and export trade in the nine provinces, and technological progress showed a slowdown trend, leading to a corresponding turbulent decline in TFP. With the superimposed impact of the global outbreak of the new crown in 2020, the rate of TC in the nine provinces is 0.9%, and TFP falls to 3.3%. Guo et al. [26] concluded that TFP in most Chinese provinces showed a decreasing trend during this period.
Second, the growth rate of TC is 6.0%. However, the average annual growth rate of TEC (0.6%) is slow and the contribution of TC to the growth of TPF is greater than that of technical efficiency in the nine provinces. Additionally, the gap between them is significantly reduced in the later period due to the continuous decline of technological progress (Figure 1). The average annual growth rate of PEC is only 0.7%, while SEC is negative growth, thus dragging down the contribution of TC to TFP. This is in line with the findings of Guo et al. [26] who found widespread technical inefficiencies in Chinese provincial economies.
Finally, the average contribution of TFP to the overall economic growth of the nine provinces is 64.2%, indicating that the role of TFP in the output growth of the nine Pan-PRD provinces cannot be underestimated. From the time trend, the trend of the average contribution rate of TFP to the overall economic growth of the nine provinces coincides with the trend of the TFP. In 2003, at the beginning of the cooperation among the nine provinces, the contribution rate of TFP to output was only 34.81%, and increased yearly since then, reaching 78.19% in 2007. The contribution rate of TFP to economic growth fell to 19.21% in 2008 due to the impact of the U.S. subprime mortgage crisis and the global financial crisis and continued to fall to 0 in 2011. Zhang. et al. [27] studied the spatio-temporal evolution of global TFP and found that the feature is also corroborated by the significant decline in global productivity after the global financial crisis in 2007, which fell by 8.515% between 2007 and 2017. However, it has risen rapidly since then, reaching a peak of 100.3% in 2014. Although there was a slight decline, later on, it maintained a high level of 102.6% in 2020. This shows the significant role of TFP plays in the sustainable economic development of the nine Pan-PRD provinces.

3.2. Heterogeneity Analysis of TFP Growth in Nine Pan-PRD Provinces: Spatial Dimension

The geographical environment and resource endowments of different regions vary greatly due to their geographical locations. Thus, this study provides an in-depth analysis of the inter-provincial, east-central-west block variability at the provincial and the block level (east, central and west). The data in Table 3 shows the TFP index and its decomposition for the inter-provincial and affiliated blocks of the nine Pan-PRD provinces.

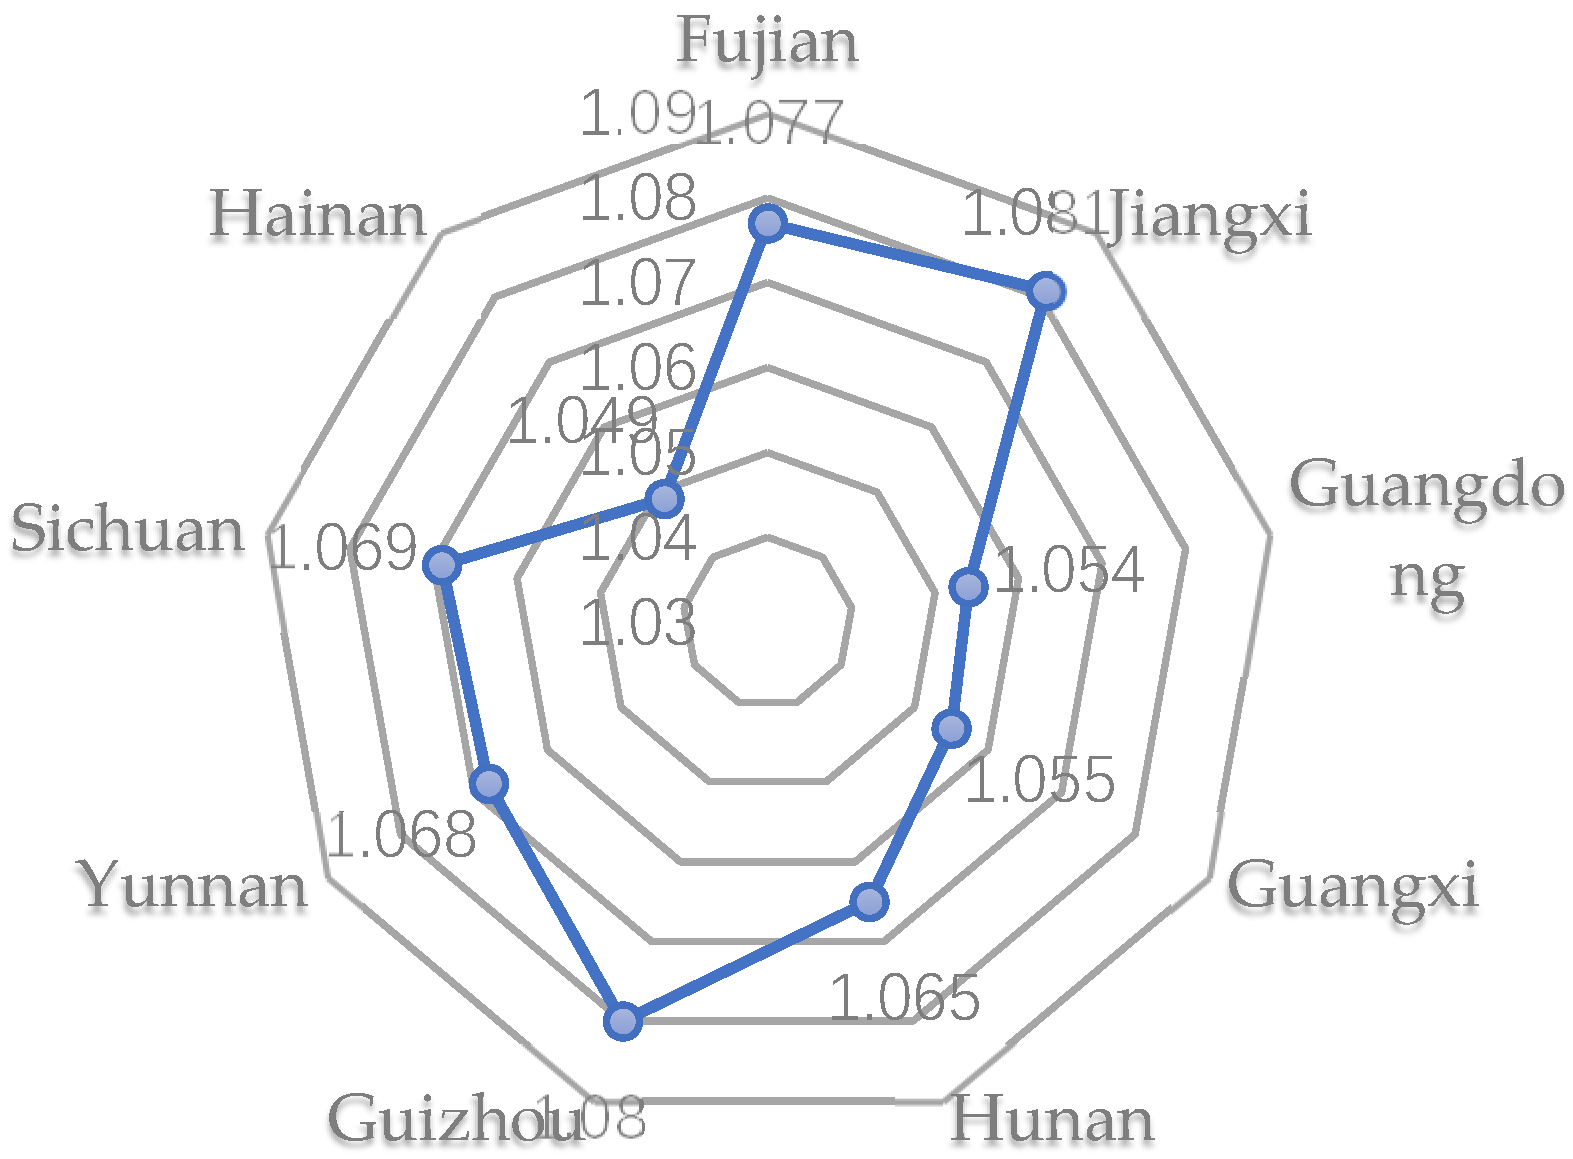
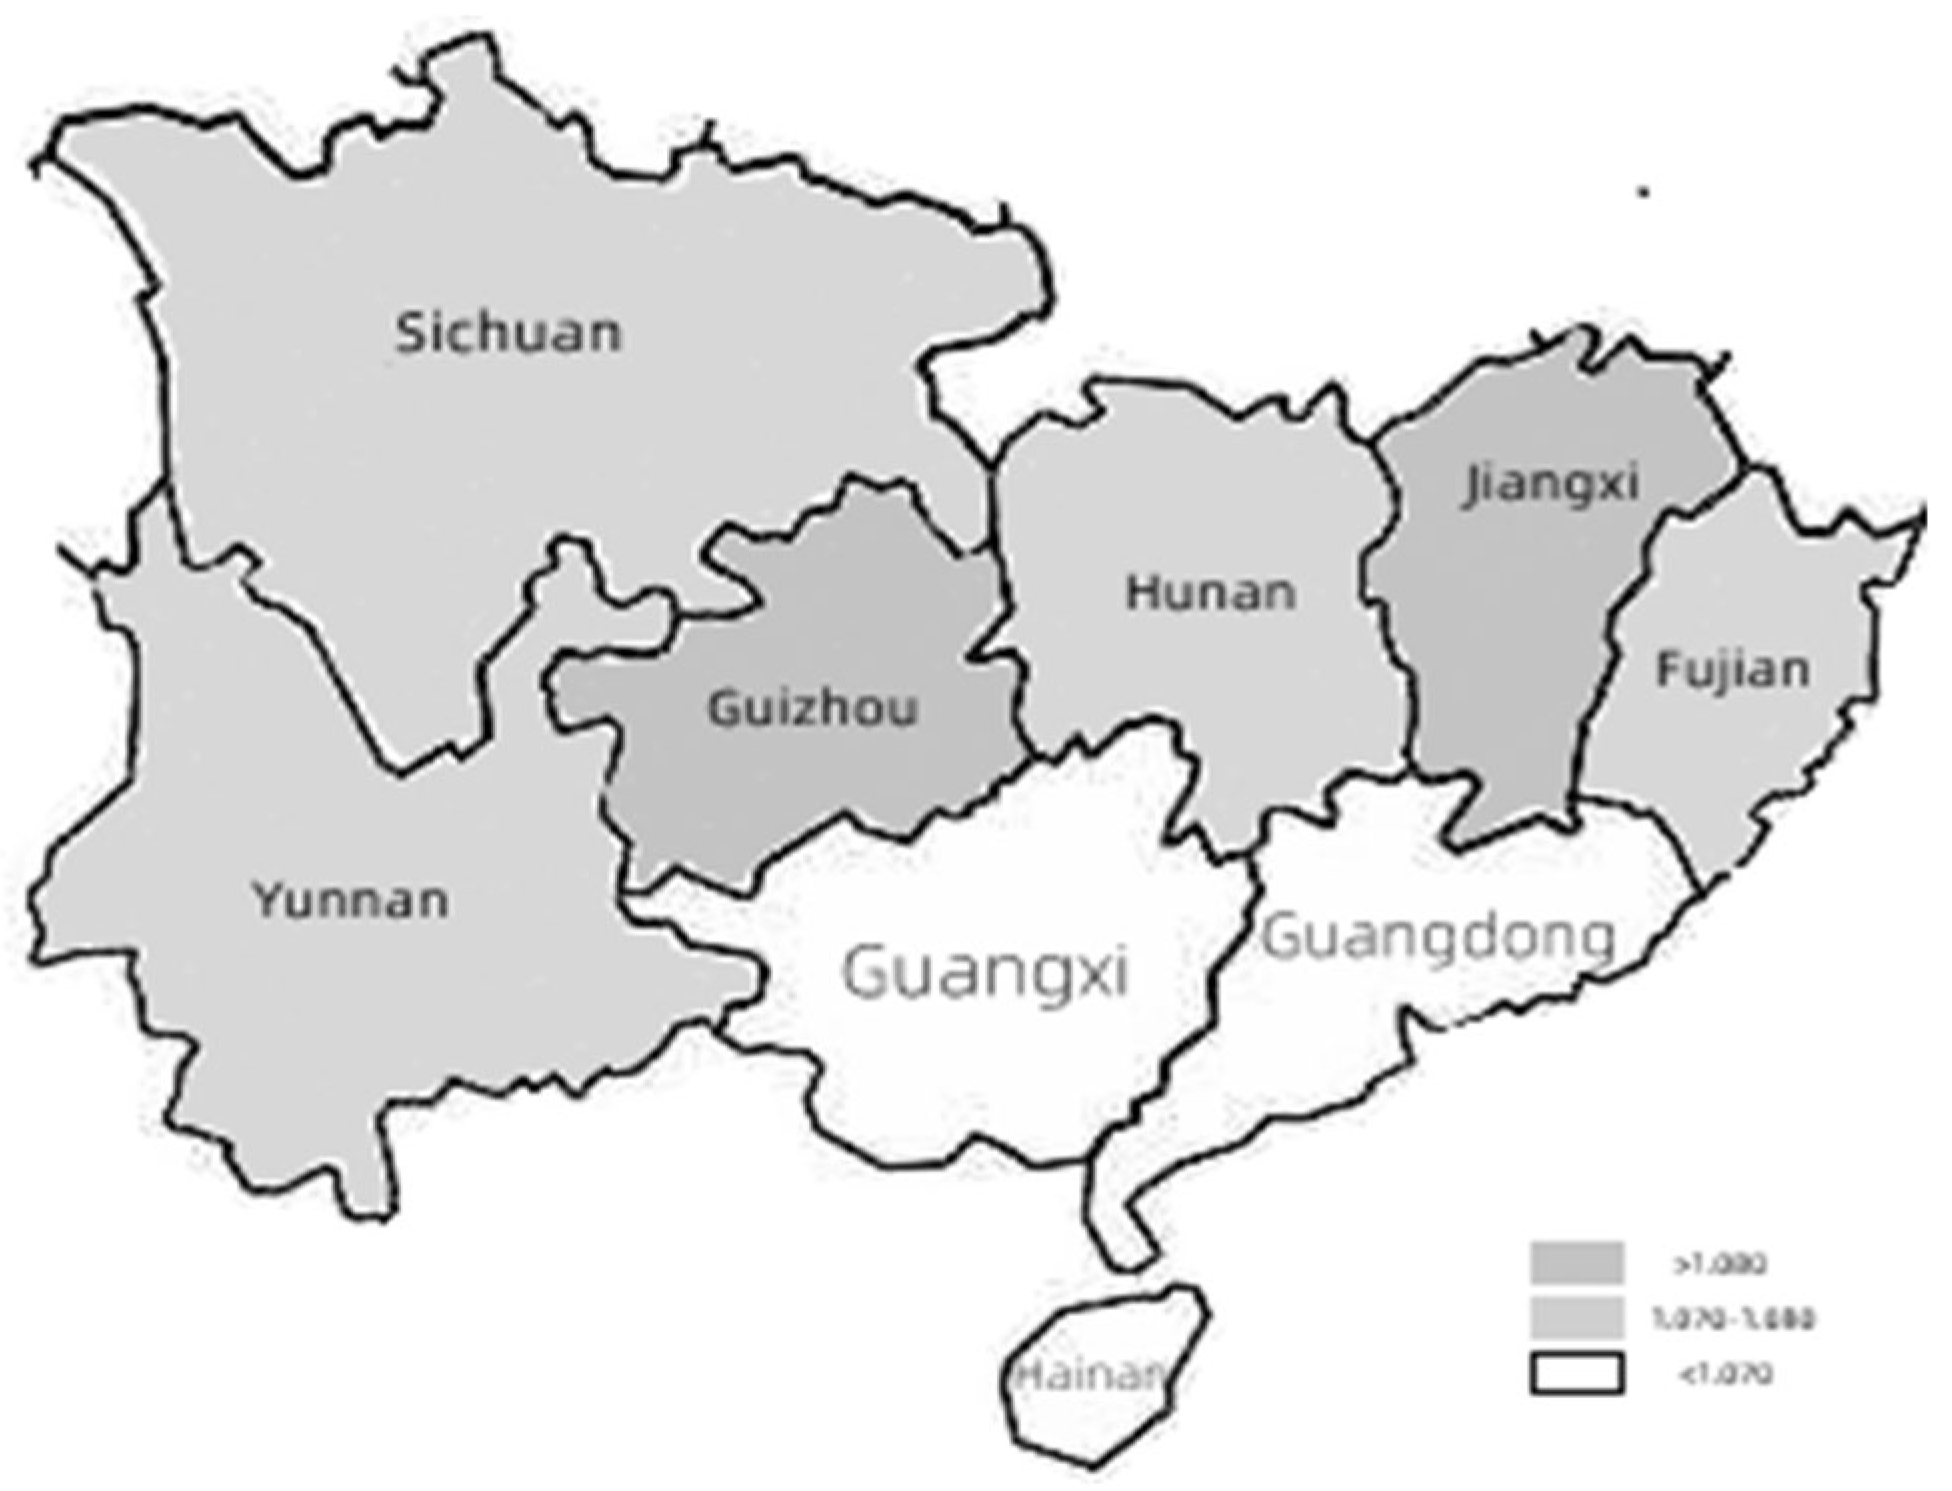
3.2.1. Inter-Provincial Spatial Heterogeneity

According to Table 2, the spatial heterogeneity of inter-provincial TFP growth in the nine Pan-PRD provinces is characterized as follows.
Firstly, there are evident differences in the TFP growth rates among the nine Pan-PRD provinces. The average annual TFP growth rate of the nine Pan-PRD provinces as a whole from 2003 to 2020 is 6.6%, which indicates that the Pan-PRD cooperation region has had an overall good economic development since its establishment. The TFP index of each province fluctuates in the range of 1.049–1.083 (Figure 2), reflecting inter-provincial disparities, with high level indexes (TFP index ≥ 1.080) in Guizhou and Jiangxi provinces; medium level indexes (1.070–1.080) in Fujian, Sichuan, and Hunan provinces; the provinces with low level indexes (1.050 < TFP index < 1.070) are the three southernmost neighboring provinces in the Pan-PRD region: Guangxi, Yunnan, Sichuan and Guangdong Province (Figure 3), due to the constraint of low technical efficiency. The TFP index growth of the nine provinces in the Pan-PRD region from 2003 to 2020 was enhanced by the simultaneous TC (6.2%) and TEC rates (0.6%). Jiangxi province has the highest TFP growth rate (8.1%) among the nine provinces, indicating that the growth rate of TC (6.5%) and the growth rate of TEC (1.2%) in Jiangxi province grew faster than in other provinces over 2003–2020, which led the province’s TFP to grow rapidly. Jiangxi Province is strategically located next to economically developed provinces in East China such as Jiangsu and Zhejiang. These are two-way spillover provinces in terms of technology and resources, driving the rapid growth of TFP in Jiangxi province in collaboration with each other. In second place is Guizhou Province, with an average annual TFP growth rate of 8.0%, which is closer to the average annual TFP growth rate of Jiangxi. The second-lowest is Guangdong Province (5.4%), whose TFP growth is mainly driven by the “single wheel” of TC, which does not contribute to its TEC during the sample period, and the growth rate of TC tended to decline at a later stage and became negative in 2020, thus constraining TPF growth in Guangdong Province to a large extent.
Second, there are obvious spatial differences in the TEC, PEC, and SEC of the nine Pan-PRD provinces. Furthermore, the decomposition of TFP into TC and TEC shows that the growth rates of TC of the nine Pan-PRD provinces as a whole for each province far exceed the corresponding growth rate of TEC. The annual growth rate of TC in the nine Pan-PRD provinces is 6.0%, and the annual growth rate of TEC is 0.6% (only Hainan and Guangxi provinces have a negative annual growth rate of TEC), indicating that TC is the main driver of TFP growth in the nine provinces. This is similar to the findings of Yu et al. [28] Guo [29], and Li et al. [30]. Among them, the growth rate of TC in Hainan and, Guangxi provinces far exceeds the growth rate of TEC especially significantly, indicating that the TEC of the two provinces, especially the scale efficiency, needs to be improved urgently. Although the annual growth rate of TC in all provinces reached 6.0%, the SEC in all provinces was generally not high, and the annual SEC growth rates in Guangxi, Guizhou, Hunan, Sichuan, and Hainan were still negative. SEC has become the main obstacle that restricts the driving effect of TC on TFP and the economic growth of each province. Therefore, the nine provinces in the Pan-PRD region must tap the potential reform to optimize resource allocation, increase resource investment to expand the scale, improve the level of scale efficiency, increase industrial concentration, and enhance SEC to achieve sustainable development of the region.
Third, there are also evident differences in the spatial distribution of the contribution of TFP to output growth in the nine Pan-PRD provinces. Only three provinces, Yunnan (148.80%), Jiangxi (75.49%), and Guizhou (71.11%), exceed the overall average contribution rate of the nine provinces, with Yunnan topping the list among the nine provinces. The contribution rates of the remaining six provinces are also considerable: in non-increasing order, Guangxi, Sichuan, Fujian, Guangdong, and the lowest Hainan Province also reach 51.47%, indicating that TFP plays a decisive role in the economic prosperity of the nine Pan-PRD provinces and has a significant impact on Pan-PRD regional sustainable development.
Finally, during 2003–2020, the TFP index of all nine provinces in the Pan-PRD achieved growth and improvement. The conclusion is similar to the findings of Deng et al. [31]. The largest increase in the TFP index of the nine provinces was in Jiangxi Province (3.8%). The TC of nine provinces achieved positive growth, with the largest TC growth rate in the Hunan Province (6.6%), and TC is the main source of TFP growth in nine provinces. In terms of TEC, the percentage of provinces that have achieved improvement is 77.78%. Except for Hainan Province (−0.12%) and Guangxi Province (−0.05%), TEC has improved in all other provinces (Table 4). Only 44.44% of provinces have improved their SEC from the beginning of the period, and Guangxi, Hunan, Guizhou, and Hainan provinces have not yet achieved scale efficiency (SEC < 1).

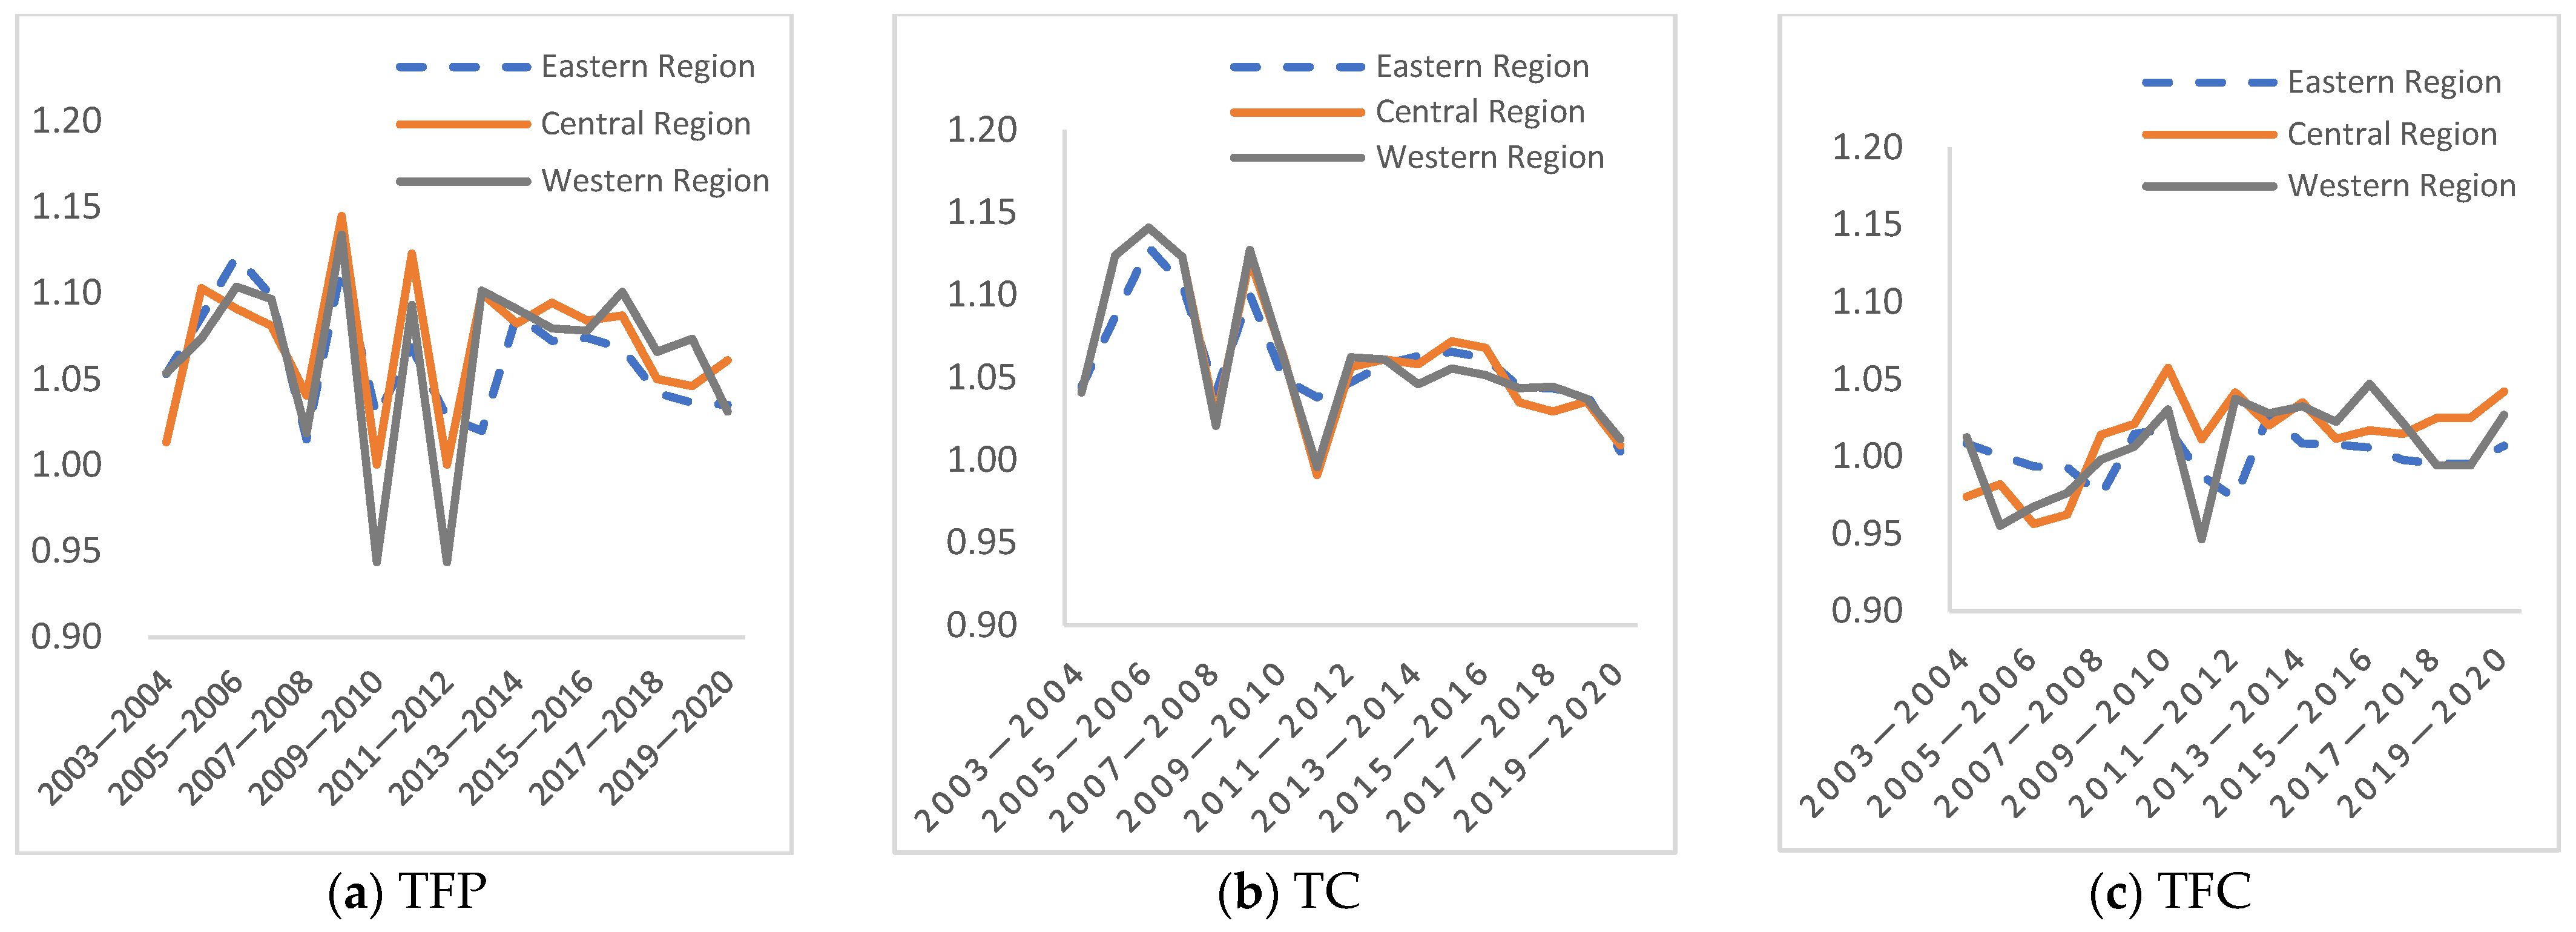
3.2.2. Spatial Heterogeneity of Internal Blocks

Based on the geographical location and economic development level of each province, China currently divides all provinces (regions) directly under the central government into three parts: eastern, central, and western. The nine Pan-PRD provinces belong to three regions, with three provinces in the eastern region (Fujian, Guangdong, and Hainan), two in the central region (Hunan and Jiangxi), and four in the western region (Guangxi, Guizhou, Yunnan and Sichuan). The TFP indices and their decomposition of the three regions to which the nine Pan-PRD provinces belong are detailed in Table 4. The spatial variability of TFP growth in the three regions of the nine Pan-PRD provinces during this observation period is characterized as follows (Figure 4).
(1) The average growth rate of TFP and its decomposition indexes of the three regions are all positive, and all of them achieve positive growth during the observation period. The three regions are close to each other in terms of fluctuation trend, but the trend is lower in the later period. The average TFP growth rates of the three regions are different from each other. However, the l difference is not very large, with the highest being in the central region (7.3%) and the lowest in the eastern region (6.2%). The central provinces have focused on strengthening investment in new energy, new materials, electronic information, manufacturing, and other industries in recent years, and the overall growth rate is slightly higher than that in the eastern region.
(2) The main driver of TFP growth in the three regions is TC, but the post-development period is insufficient. It is noteworthy that although TC is the main driver for the nine provinces’ TFP growth, under the impact of the global economic crisis in 2008, the TC has declined, going down yearly, and the growth momentum is insufficient.
(3) TEC in the three regions has shown an oscillating upward trend and has overtaken the growth rate of TC, which will become a new power source for TFP development. Although there are differences in TEC growth rates in the three regions, they show a slow fluctuating climbing trend, reflecting that the provinces in the east, central, and west of the Pan-PRD region have been effective in promoting industrial transfer and technological cooperation. In comparison, from 2013–2014, the TEC growth rates of central and western provinces began to surpass those of eastern provinces. As well, the growth index of TEC surpassed TC in 2019–2020, which has become the main driving source of TFP growth. However, the overall TEC in the three regions of East and West is not high, with index values ranging from 0.995–1.017, and the average value is only 1.006, indicating that the overall level of the three regions has more room for improvement.

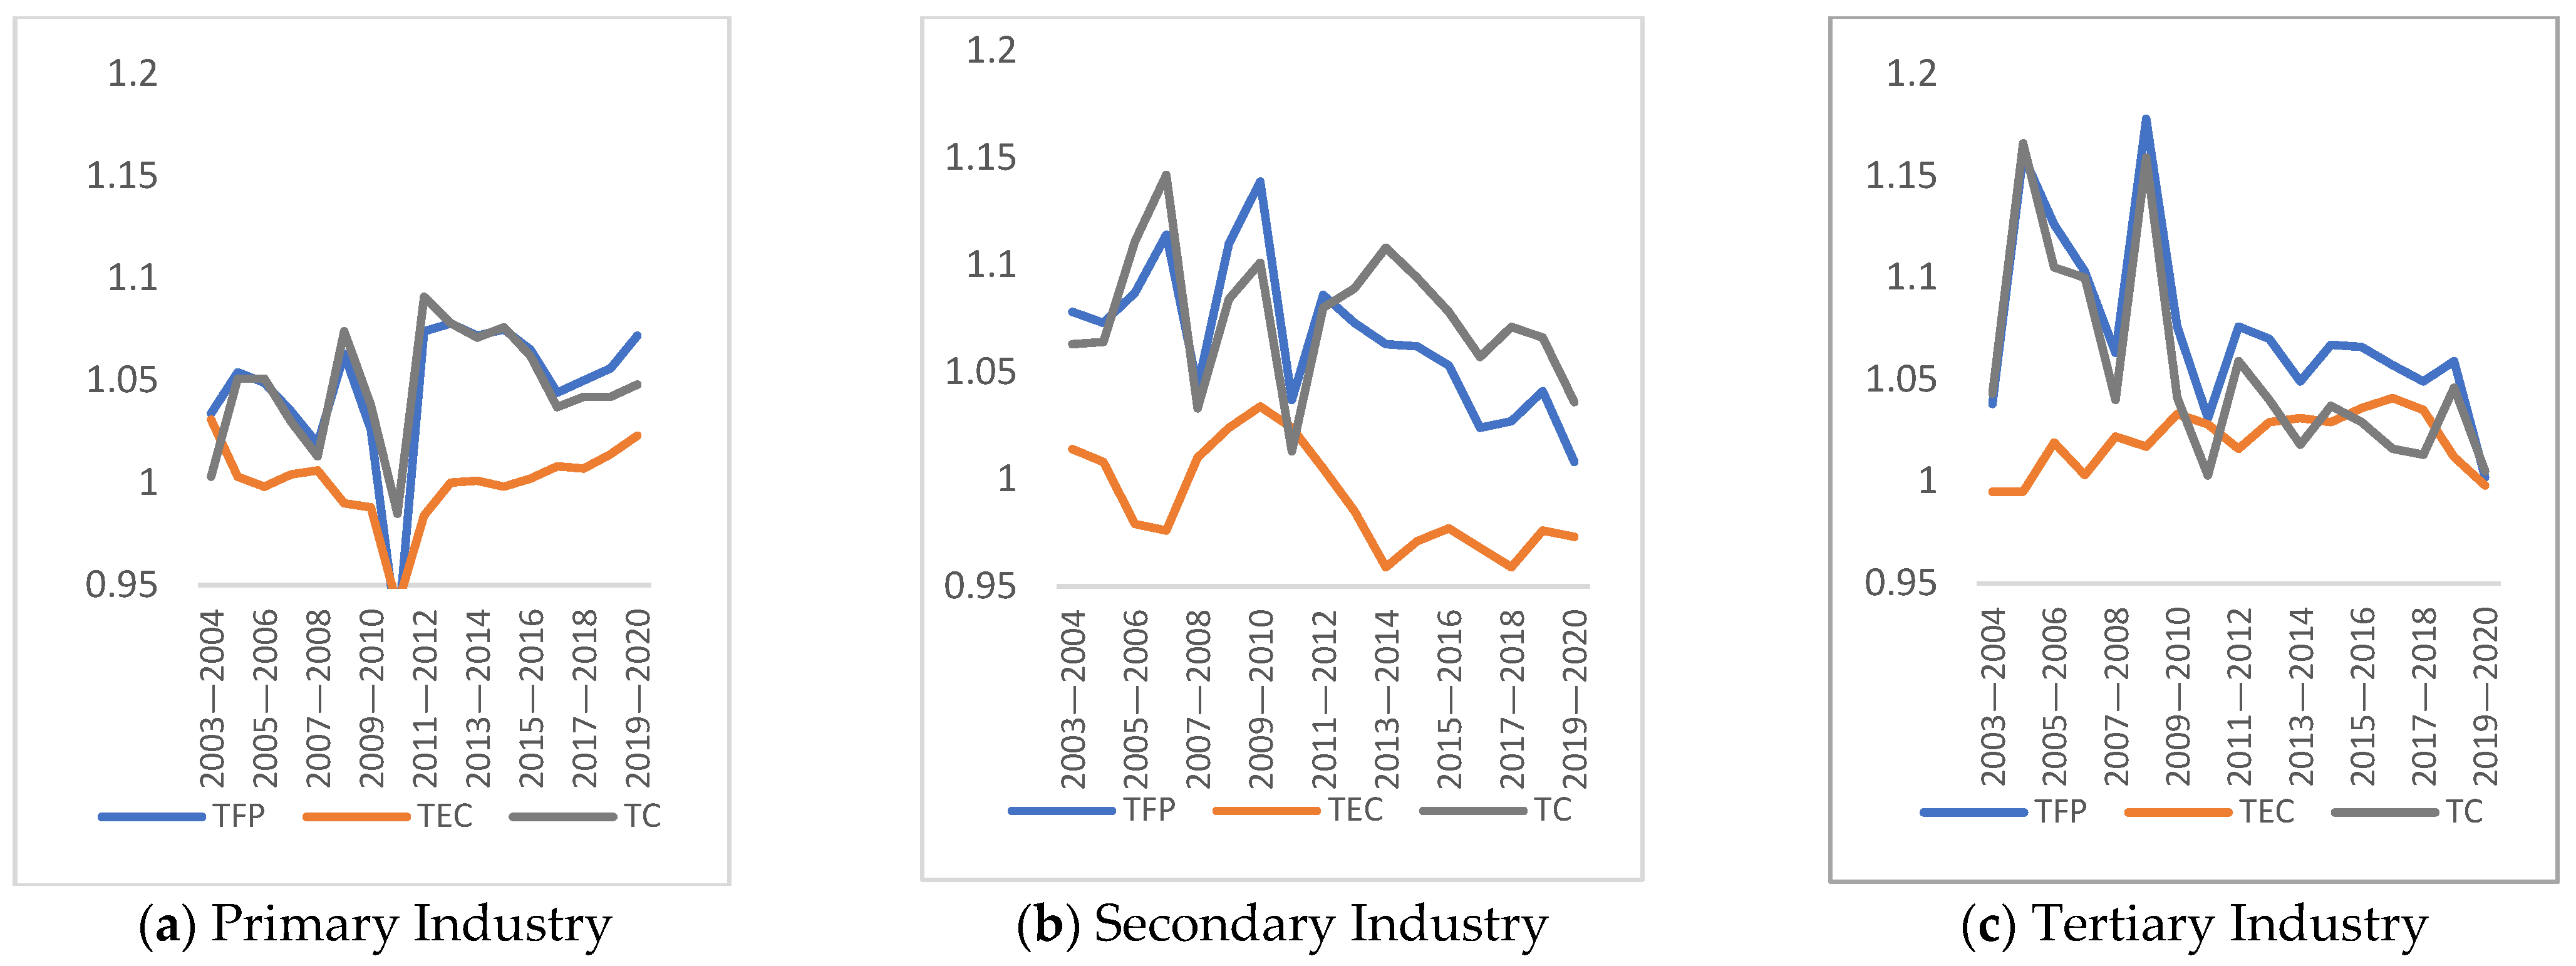
3.3. Heterogeneity Analysis of TFP Growth in Nine Pan-PRD Provinces: Industrial Dimension

The data in Table 5 show the TFP indices and their decomposition for the three industries in the nine Pan-PRD provinces. During the observation period, there is obvious industrial heterogeneity in the TFP growth of the primary, secondary, and tertiary industries in the nine Pan-PRD provinces, and from the overall perspective of the nine Pan-PRD provinces, the average value of the TFP growth rate of the three industries is 7.4%, and technological progress (5.3%) is still the main driving force of TFP growth.
(1) The TFP of the three industries all achieved different degrees of positive growth. From the perspective of the three industries, the highest TFP growth rate is in the tertiary industry (7.9%), while the secondary industry (6.5%), and the primary industry (4.6%). The tertiary sector had the highest TFP growth rate, indicating that the industrial structure of the nine provinces and regions entered into continuous optimization. The industrial structure of the nine Pan-PRD provinces is similar, being dominated by secondary and tertiary industries. For the national statistics in 2020, Guangdong, as one of the eight provinces with a tertiary industry ratio exceeding the national level, has moved into the economically developed region of the country. Among the nine provinces, Hainan and Guangxi still have an industrial structure of “tertiary-primary-secondary” and are underdeveloped industrial regions. Additionally, it is necessary to further strengthen the optimization, transformation, and upgrading of the industrial structure.
(2) TC is the main driver of TFP growth in all three industries. From the source of TFP growth, TC is the main source of TFP growth in the primary, secondary and tertiary industries. The technical progress rates of the three industries in descending order are: primary industry (8.4%), secondary industry (7.5%), and tertiary industry (5.7%). One can conclude that among the nine Pan-PRD provinces’ existing hierarchies of industries, the introduction of technology, tapping reform, and independent innovation are all superior to technical efficiency improvement. It is especially noteworthy that the growth rate of technical progress significantly exceeds technical efficiency.
(3) The technical efficiency level of the three industries has increased and decreased, and the overall level is not high. Moreover, all are derived from pure technical efficiency support. From the viewpoint of technical efficiency, the overall technical efficiency level of the three industries in the nine Pan-PRD provinces is not high, and the average value of growth rate is only 0.4%, all of them being supported by pure technical efficiency. From the viewpoint of the technical efficiency subdivision, only the technical efficiency of the tertiary industry among the three industries has achieved growth (2.1%). Additionally, the pure technical efficiency of the primary industry is 1, and all production factor inputs have been fully utilized. While the technical efficiency of the primary industry and the secondary industry have started to show negative growth after 2012, both pure technical efficiency and scale efficiency are ineffective (Figure 5). As the nine Pan-PRD provinces expect to achieve sustainable development in the future, they need to continue to pay attention to the introduction and application of new technologies in the three industries and accelerate the improvement of technical efficiency. However, more attention should be paid to expanding the scale of the three industries, especially the secondary industry, realizing large-scale operation, strengthening internal management, and improving scale efficiency through industrial agglomeration to achieve sustainable development in the region.
(4) There is heterogeneity in the high and low TFP contribution of the three industries. According to Table 4 from the contribution rate of TFP in each industry, the overall contribution rate of three industries to TFP in nine Pan-PRD provinces is as high as 83.11%, among which the contribution rate of primary industry TFP (121.94%) is the highest. The contribution rates of secondary and tertiary industry TFP also reach 56.57% and 70.81% respectively. In terms of the contribution of TFP to output growth in the nine Pan-PRD provinces, the contribution of TFP to output growth in the secondary and tertiary industries has exceeded the average value, while the contribution of TFP to output growth in the primary industry (4.35%) is the lowest, indicating that the nine Pan-PRD provinces urgently need to improve the scientific and technological input and scale operation of the primary industry to promote the contribution of TFP to the contribution of regional economic prosperity and development.

3.4. Heterogeneity Analysis of TFP Growth in Nine Pan-PRD Provinces: The City Dimension

The results of the trend of TFP changes and its decomposition of 100 sample cities over the years are detailed in Table 6. The mean values of TFP, as well as TC, TEC, and PEC of the sample cities are positive during the observation period. The TFP index (mean value 1.069) achieves positive growth, but shows an oscillating downward long-term trend, and the overall TFP changes show the characteristics of normal distribution. It increased from 1.09 yearly and reached a peak value of 1.135 during 2008–2009. However, due to the impact of the U.S. subprime mortgage crisis and the global economic crisis, it began to show a downward trend thereafter and fell to 1.049 in 2019; the whole trend of change coincided with the fluctuation of TFP values of the nine Pan-PRD provinces as a whole. TFP growth is mainly supported by the growth of TC. The results of this study are consistent with the findings of Zhang [32]. The mean value of SEC < 1 and the growth rate of −0.2%, although not a significant decrease, reflect the lack of scale efficiency at the city level in the nine Pan-PRD provinces, which constrains the benign development of the urban economy.
According to the TFP index and its decomposition of the 100 sample cities, taking into account the previous criteria for dividing the TFP hierarchy at the inter-provincial level, combined with the mean value of city TFP of 1.069, this paper divides the values of city TFP over the observation period into four intervals (see Table 7 for details), divides the time series into the early, middle and late periods; uses; 2003–2004, 2011–2012, and 2018–2019 as three time observation points; and the TFP of 100 cities are organized according to this grouping. the main heterogeneity characteristics of the TFP index of 100 cities are as follows.
(1) The values of city TFP show a spatially uneven distribution, the number of cities with TFP < 1.0 is increasing. Overall,96 cities had TFP ≥ 1 during 2003–2004, 61 of them had TFP > 1.076, and 24 cities had TFP in the [1.0–1.057) range. Only four cities had TFP < 1.0. However, during 2018–2019, the number of cities with TFP ≥ 1 dropped to 84, 12 fewer than at the beginning of the period. Among them, the number of cities with TFP > 1.069 was 34, and the cities with high relative growth rates are mainly concentrated in: Jiangxi Province (5/11) and Guangxi Province (4/14). Furthermore, the number of cities with TFP < 1.0 rose to 16 cities, a fourfold increase.
(2) Each province has some cities with lower TFP at the end of the period compared to the beginning of the period, and the cities with decreasing TFP are unevenly distributed. the cities with decreasing TFP are mainly concentrated in the following provinces: Guangdong Province (17/21, 17 out of 21 cities decreased), Hunan Province (9/13), Sichuan Province (12/18), and Fujian Province (6/9). See Table 7 for details.
(3) The growth of urban TFP is mainly supported by TC (1.058). One hundred cities’ TEC mainly lies between 0.91 and 1.167, with an overall low and uneven development rate. Pan-PRD cities need to optimize investment structure and industrial structure, accelerate the realization of scale operation, accelerate the efficiency of the economy of scale, and promote the steady growth of TFP.

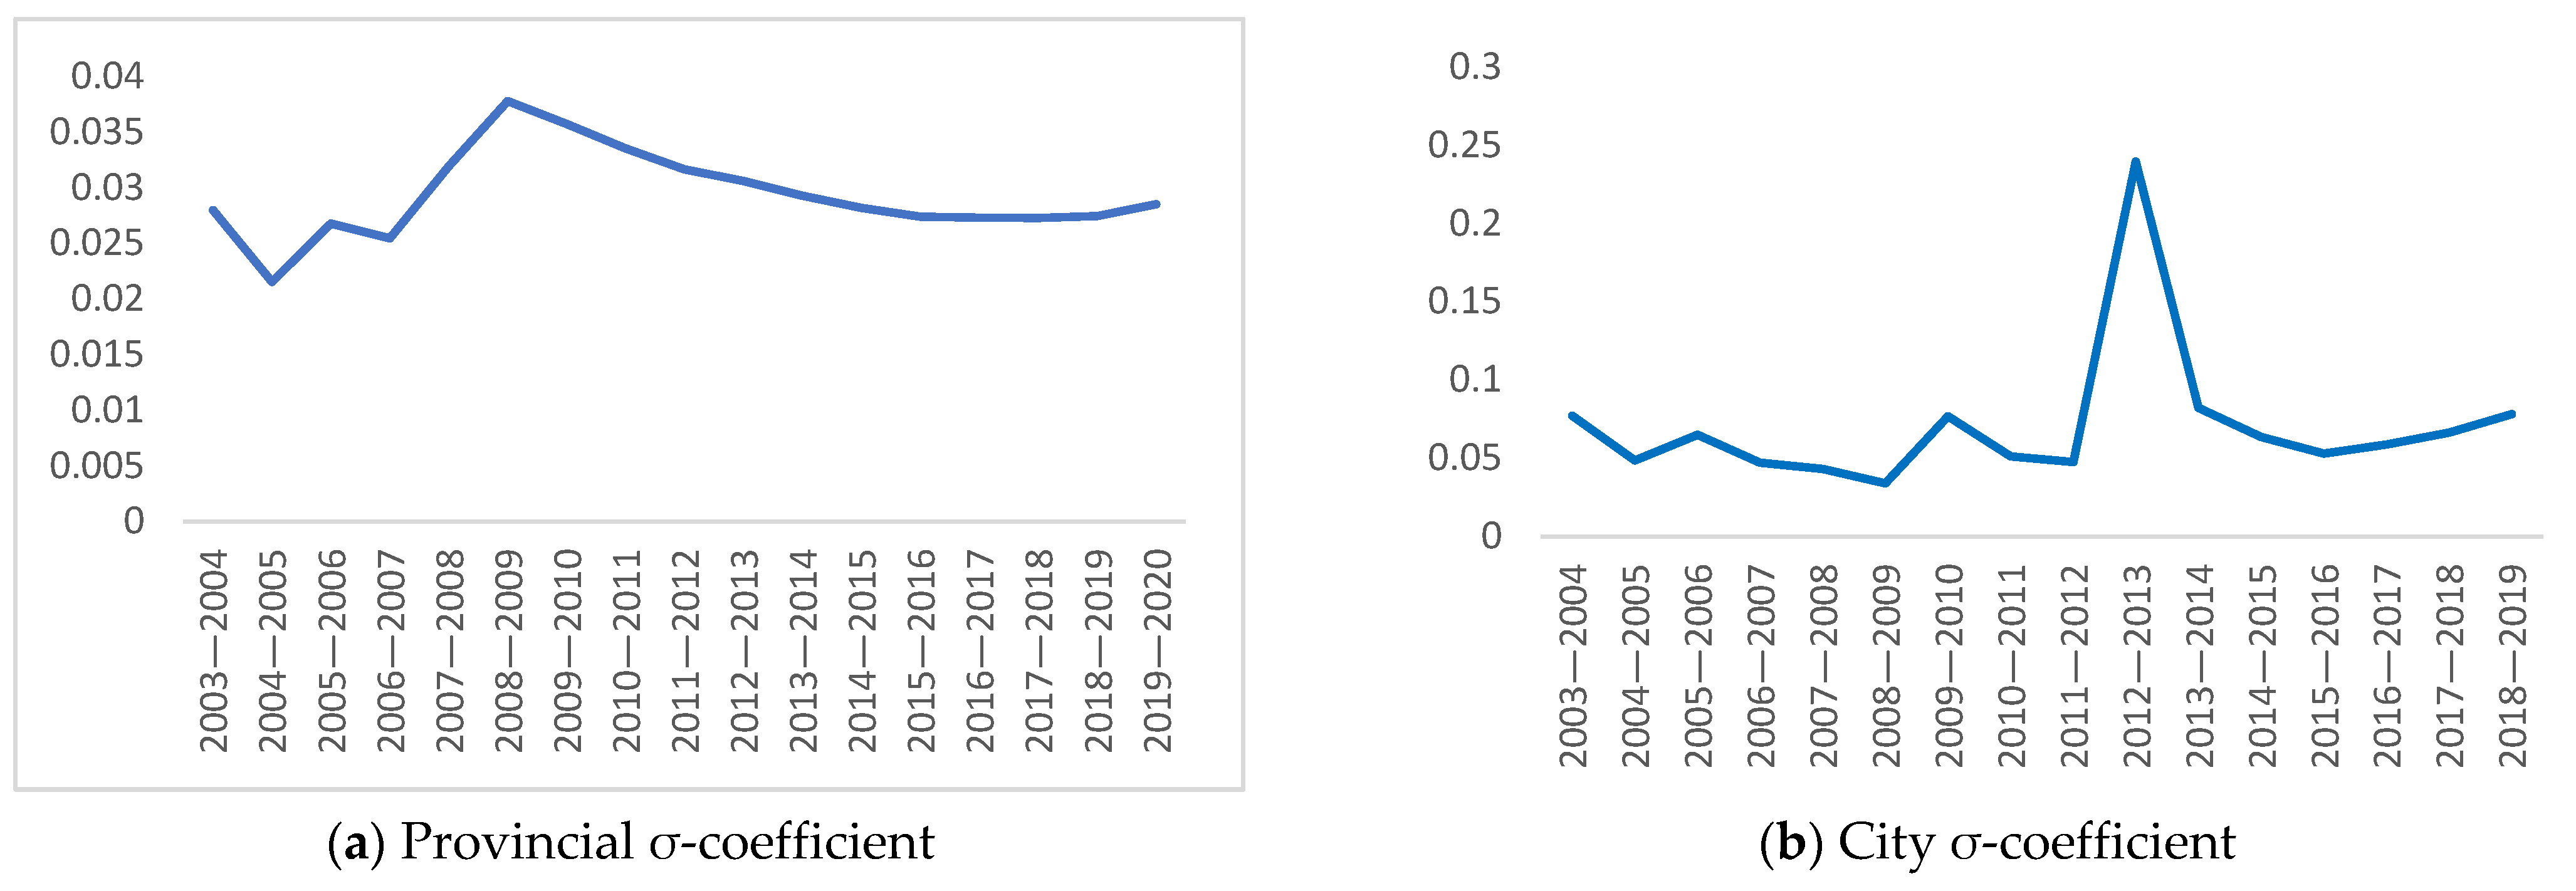
3.5. Convergence Test Based on Time Series

According to the previous analysis, there is obvious spatial heterogeneity in the TFP of the nine Pan-Pearl River Delta provinces. However, indicator heterogeneity was not significant.

3.5.1. Intra-Regional σ Convergence Test

For the nine provinces as a whole, the coefficient of the variation of TFP is obtained by substituting the values of TFP of the nine Pan-PRD provinces from 2003 to 2020 into Formula (7), and the trend of this value is shown in Figure 6. The coefficient of variation was 0.0280 in 2004 and 0.0285 in 2020. Therefore, it does not show a significant gradual decrease over the whole observation period and is scattered, and the TFP differs significantly from each other. By stages, the coefficient of variation from 2005 to 2009 shows an increasing trend, indicating that at the early stage of regional cooperation, the mechanisms have not yet been established or perfected, and the TFP gap among the nine provinces is large and emanating. Since the peak in 2009, the period 2009–2019 shows a significant decline, with a stage convergence feature. The reasons for this are as follows: First, there was the impact of the external U.S. subprime crisis and the global financial crisis, which led to the deterioration of the external economic environment of the nine provinces and regions, the decline of TFP, the pressure of industrial transformation and upgrading of Guangdong and Fujian provinces in the Pan-PRD region, and the rest of the provinces facing the return of labor force and the shrinking of raw material markets. Further, it promotes the nine provinces in the region to join ranks to explore the domestic demand market, strengthen economic and trade cooperation internally, and tied together over the crisis and ensure stable economic growth. Secondly, after 5–6 years of exploration and integration of the nine provinces in the region, the system within the region is becoming increasingly better, the collaboration mechanism is becoming more mature, and the leading province of economic development—Guangdong Province, through industrial transfer and industrial spillover, drives the economic backward provinces in the region to take over the industries and optimize the traditional industries, promotes the economic development of the Pan-PRD region, and narrows the mutual gaps between provinces. Simultaneously, there is a stage of convergence.
From the city dimension, the coefficient of variation of TFP of 100 cities in the nine provinces is obtained by substituting the values of TFP of 100 cities from 2003 to 2019 into the convergence measurement formula and conducting σ convergence test from the time series perspective; the trend of the change of this value is shown in Figure 6b. The coefficient of variation of TFP in the city dimension is 0.0771 in 2004 and 0.0692 in 2020, and the overall time series change trend does not have an obvious convergence long-term trend, which indicates that the gap of urban economic development is large during 2003–2019, the level and gap of mutual economic development are obvious, and there is no trend of convergence between cities.

3.5.2. Intra-Regional Absolute β Convergence Test

The absolute β convergence reflects that provinces with different initial levels of TFP eventually achieve a common steady-state level. Because the nine Pan-PRD provinces are vast, the natural resource endowments and their economic development levels differ significantly. Although the convergence hypothesis is not satisfied, because the nine provinces are geographically part of the Pan-PRD economic circle, given the internal policies and mechanisms to promote collaboration and a win-win situation, whether the nine provinces in the Pan-PRD region will promote convergence is not established. Therefore, in this study, we use Stata to test the absolute β convergence test of Equation (8) performed with data, and the calculation results are shown in Table 8. Pan-PRD provinces have β < 0, which is significantly negative at the 5% level and, indicates the existence of convergence within the Pan-PRD region (i.e., convergence effect), which coincides with the result of the σ convergence test. The TFP of the nine Pan-PRD provinces eventually from divergence to convergence. Using Equation (8) for the convergence analysis of city TFP, the results of the regression analysis are shown in Table 8. One hundred cities in the Pan-PRD region are significantly negative at the 10% level, indicating that there exists a convergence effect between cities with relatively low levels at the beginning of the period through relatively high TFP growth rates, thus gradually narrowing the gap with cities with relatively high TFP growth rates at the beginning of the period, and there exists a convergence effect between cities within the region.

3.6. Robustness Analysis

When domestic scholars calculate the capital stock in each province, most of the capital depreciation rates use the overall Chinese depreciation rate: 9.6% or 6% measured by two scholars, Zhang et al. [33] and Sun et al. [34]. However, in this paper, considering that there are long-term differences in the economic development level of each province, there are obvious inter-provincial differences in the depreciation rate of fixed capital in each province. Thus, the faster a country or region develops economically or upgrades its technology, the more frequently it replaces its fixed assets. The capital depreciation rates of each of the nine provinces are used for the calculation of capital stock in each province. In this paper, with reference to the methods of Zhang et al. [4] and Xu et al. [35], robustness tests were conducted on the indicators of TFP and its decomposition obtained from three different depreciation rates for the nine provinces as a whole. The test results (Table 9) show that there are minor differences between the TFP indices and their decomposition indicators obtained from three different capital depreciation rates, which are consistent with the research conclusion obtained from the previous analysis of this study. Moreover, technological progress is the main determinant driving TFP improvement in the nine Pan-PRD provinces, without any essential change, indicating that the research conclusions of this study are robust.
Meanwhile, this study refers to Peng’s study [36] of TFP in China by using the widely cited return to education in China provided by Psacharopoulos’ (1994, 2004) long-term tracking study, setting the return to education coefficient for years of education in China at 0.18 for period 0–6, 0.134 for period 6–12, and 0.151 for more than 12 years to calculate the human capital stock. This study also applies this method to calculate the labor capital stock in nine provinces, and the results are similar to the ones of the extant study.

4. Conclusions and Policy Recommendations

This study uses the DEA-Malmquist index model to measure the TFP growth rate of nine provinces and its decomposition index based on the panel data of those nine Pan-PRD provinces from 2003 to 2020, and obtains the following conclusions:
(1) The average annual growth rate of TFP for the nine provinces as a whole is 7.2% during the sample period, and the contribution to the output growth of the nine Pan-PRD provinces is high. Technological progress is the main determinant in promoting the TFP. The average contribution rate of TFP to the overall economic growth of the nine provinces is 67.62%, indicating that the role of TFP in the output growth of the nine Pan-PRD provinces cannot be underestimated.
(2) The spatial variability of inter-provincial TFP in the nine Pan-PRD provinces shows the following characteristics: there are differences but that are significant differences in the TFP growth rates of the nine Pan-PRD provinces, and there are obvious spatial differences in technical efficiency, pure technical efficiency and scale efficiency. The TC growth rate of Hainan, Guangxi provinces far exceeds the technical efficiency growth rates, but the SEC is generally low, and the annual SEC growth rate of Guangxi, Hunan, Guizhou, Sichuan and Hainan provinces are still negative. SEC has become the main obstacle that restricts technical progress to promote economic growth. Therefore, it the nine Pan-PRD provinces must increase resource investment, optimize resource allocation, improve scale efficiency, increase industrial concentration, and enhance scale efficiency to achieve sustainable development in the region.
(3) From the spatial heterogeneity of the east, central and west blocks, the average annual growth rate of TFP and its decomposition indicators of the three regions all achieve positive growth, except the SEC. However, there is a declining trend in the later stage; the average annual growth rate of TFP among the three regions differs from each other, but heterogeneity is not significant. It is the highest in the central region (7.3%), and the lowest in the east region (6.2%), and the fluctuation trend of the three regions is close to each other. Moreover, the main source of TFP growth is TC, but the development momentum is insufficient. The main source of power for TFP growth is TC, but the development momentum is insufficient. The follow-up also needs to pay attention to and strengthen the introduction of technology and technological innovation. For 2013–2014, the growth rate of TEC in the central and western regions began to surpass that of the eastern provinces. During 2019–2020, the growth index of TEC surpassed that of TC and has become the main power source of TFP growth. However, the overall TEC in the three regions of East and West is not high, with index values ranging from 0.995 to 1.017, and there is still much room for improvement in the overall level.
(4) From the spatial heterogeneity of TFP in the industry dimension, there are differences in the TFP growth rates and the overall contribution rates to TFP among the three industries in the nine provinces. The TFP growth rate of the tertiary industry (7.9%), represented by the service industry, is the highest, while the primary industry (6.5%), and technological progress is the main driving force of TFP growth in the three industries. The growth rate of technical progress (0.2%) and the technical efficiencies of the three industries in the nine provinces are not high, as technical progress comes only from pure technical efficiency support and insufficient scale efficiency. The growth rate of technical progress in the secondary industry is much higher than that of technical efficiency. The overall contribution rate of the three industries to TFP in the nine provinces is as high as 83.11%, among which the contribution rate of TFP in the primary industry (121.94%) is the highest. The contribution rate of TFP growth in the secondary and tertiary industries to economic growth exceeds the average value. The industrial structure of the nine Pan-PRD provinces has convergent characteristics, which, if not adjusted, will lead to regional fragmentation and local protectionism, and reduced efficiency, while intensifying vicious competition between industries in the region and the continued expansion of unbalanced economic development and regional differences.
(5) At the city dimension, TFP shows a spatially uneven distribution, and the number of cities with TFP < 1.0 rises to 16 cities, mainly in Guangdong Province, Hunan Province, Sichuan Province, Fujian Province, and other provinces. The growth of urban TFP is mainly supported by the continuous growth of TC. The overall development rate of TEC in cities is not high and uneven. Pan-PRD cities need to combine their characteristics, accelerate the realization of scale operation by optimizing investment structure and industrial structure, and speed up the efficiency of scale economy, thus promoting the steady growth of TFP.
Therefore, based on the results of the above analysis, this study r puts forward the following suggestions:
(1) The provinces in the Pan-PRD region should join ranks to break the institutional and institutional barriers that restrict the rational allocation of resources in the region and innovate the Pan-PRD regional development cooperation platform. As one of the three national regional development strategies and an important region in China’s “Belt and Road” construction, the effective improvement of TFP in the Pan-PRD region has become an important influencing factor for sustainable and high-quality regional development. To ensure the sustainable development of the nine Pan-PRD provinces, the provincial governments need to closely integrate with the national Belt and Road strategy. Consequently, through a supply-side structural reform, there is a need to break the constraints on inter-provincial to further expand the effective supply of factors in the region and improve TFP, give full play to system change, along with structural optimization and factor upgrading to improve the quality and efficiency of economic growth in the nine Pan-PRD provinces; break industry monopoly; remove regional blockades, industry barriers, local protection, etc.; and improve the efficiency and competitiveness of resource factor allocation. The governments of the Pan-PRD region should accelerate the expansion of open cooperation and the interconnection between the provinces, and the Special Administrative Region of Hong Kong and Macao, and promote the orderly and reasonable flow of factors among the provinces. This would help to achieve complementary resource advantages, regional synergy, and collaborative and complementary staggered development. Giving full play to the leading and radiating role of Guangdong Province, Fujian Province, and other eastern regional provinces, can be geographically advantageous to the region’s proximity to the Greater Bay Area and ASEAN countries, As such, there is a need to strengthen the deep docking with the Greater Bay Area, ASEAN countries, and upstream and downstream of the industrial chain., and jointly build regional cooperation platforms, such as Pan-PRD regional city clusters and high-speed rail economic belt. At the same time, the five provinces of Jiangxi, Hunan, Sichuan, Yunnan, and Guizhou in the Pan-PRD region also belong to the Yangtze River Economic Belt. Deepening cross-regional cooperation; promoting the integrated construction of major infrastructures such as transportation, energy, water conservancy, and networks; strengthening the convergence and coordination with the development of the Yangtze River Economic Belt; and promoting the construction of horizontal and vertical economic development axes would ensure the common construction and sharing of platforms in the region, promote the steady growth of TFP in each province, and lead to value co-creation.
(2) Accelerate the implementation of innovation-driven strategy, optimize technological progress and strengthen scientific and technological innovation. Based on the existing production advantages, it is vital to implement an innovation-driven development strategy that highlights the leading role of science and technology innovation in overall innovation. This can be achieved by accelerating the construction of science and technology innovation system, promoting the transformation of scientific and technological achievements, further enhancing the TFP growth rate of the provinces in the Pan-PRD region, reversing the low growth rate of technological progress, strengthening intra-regional collaborative innovation, opening up technical assistance and technology conduction between provinces and cities in the region, strengthening investment in science and technology resources, introducing advanced technologies, deepening multilateral cooperation among the nine provinces in the region, comprehensively and deeply promoting science and technology innovation, integrating development and utilization of innovation resources in the Pan-PRD region, cultivating and attracting outstanding science and technology and innovative high-end talents, enhancing R&D and innovation capabilities, supporting and building high-level innovation teams, and achieving effective growth of technological progress.
(3) Improve industrial scale efficiency, achieve continuous dynamic upgrading and iteration of industrial structure, and focus on the improvement of technical efficiency. In response to the uneven development of the Pan-PRD region, while increasing regional production factor inputs, we can transform traditional production methods and continuously optimize the industrial structure through policy regulation and government policy guidance. It is important to promote the twinning of eastern provinces with central and western provinces, strengthen the joint efforts within the nine provinces of the Pan-PRD region, select the right docking points for industries in the region; systematically guide the central and western provinces in the region to take the initiative to undertake the industrial transfer from Guangdong, Fujian, Hong Kong, and Macao; promote the implementation of the low-cost expansion of advantageous enterprises in the eastern region of the region to Guangxi, Hainan, Yunnan, Sichuan, and Guizhou; and make efforts to build a misaligned development with the Greater Bay Area. Furthermore, the focus on investing in high value-added fields, optimizing industrial structure, upgrading traditional industries, gradually eliminating high pollution and high energy consumption industries, and gradually transferring labor-intensive industries from the eastern provinces of the Pan-PRD to the central and western provinces in a “geese formation” is required to enhance TFP. Using their advantages to accelerate industrial upgrading, the formation of regional pillar industries with sustainable development, and cultivating advantageous industrial clusters is highly beneficial. There is also the need to strengthen intensive production, shift from decentralized operation to moderate scale operation, optimize the allocation of factor resources, promote the complementary mutual assistance of industries among the nine provinces, create high-quality industrial ecosystems and regional industrial clusters with strong competitiveness, strengthen the synergistic development of industrial chains, improve industrial-scale efficiency, achieve continuous dynamic upgrading and iteration of industrial structures, and realize the sustainable development of the Pan-PRD region. Increasing the technological investment and scale operation of the tertiary industry in the nine provinces and their cities, finding a breakthrough in economic growth, improving the technical efficiency of the three industries in each province and city, improving technical efficiency (especially the scale efficiency of the secondary and primary industries), reversing the negative growth of technical efficiency of the secondary industry for many years in a row, achieving industrial structure upgrading, and promoting the transformation of the industrial structure of more provinces in the nine provinces to “tertiary-secondary-primary” enables the achievement of continuous and sustainable growth.
(4) Create city clusters to promote urban development and synergistically enhance city TFP. The report of the 19th Party Congress pointed out that city clusters should be used as the main body to build a city pattern with coordinated development of large, medium, and small cities and towns. The fifth meeting of the Central Finance and Economics Commission also pointed out that central cities and city clusters are becoming the main spatial forms to carry development factors. Currently, the TFP of cities in the Pan-PRD region shows uneven development distribution, and the TFP growth power of small and medium-sized cities is weak, especially in the central and western provinces which are relatively backward economically. However, they can rely on the existing natural, humanistic and social environment, as well as the location advantage and strength of urban economic development, of the existing national city clusters such as the Pearl River Delta City Cluster, West Coast Cluster of the Taiwan Strait, Chengdu-Chongqing City Cluster and Beibu Gulf City Cluster, there can also be different city clusters planned to be established in the eastern, central and western provinces. Guangzhou, Shenzhen, Fuzhou, and Xiamen in the eastern part of the Pan-PRD region are the core of the city cluster; Changsha, Nanchang, Nanning, and Haikou in the central region are the core of the city cluster; Chengdu, Guiyang, and Kunming in the west constitute the core of the western city cluster in the Pan-PRD region. Combining the characteristic resources of each region with the industrial advantages of the region, a city industry chain including industrial value and space is created with its own characteristics. To drive the development of more economically backward cities in the region, especially the cities in the western region, it is necessary to strengthen the integration of cities within the Pan-PRD region and cross-provincial cooperation, allocate resources across provinces, and realize the complementary advantages and resource sharing between cities of different types and scales and between cities and rural areas. Combining the construction of city clusters and industrial layout optimization in the Pan-PRD region, cities will be integrated to form a wide range of collaborative relationships and collaborate to enhance the TFP of Pan-PRD cities.

Author Contributions

Y.Y.: Conceptualization, methodology, data curation, analysis and visualization, writing; S.Y.: Conceptualization; S.Z.: Partial data curation and analysis. All authors have read and agreed to the published version of the manuscript.

Funding

This research was funded by Key Research Base of Humanities and Social Sciences in Guangxi Universities and the Project of Guangxi Development Strategy Institute in China (No.2022GDSIQM17).

Institutional Review Board Statement

Not applicable.

Informed Consent Statement

Not applicable.

Data Availability Statement

The data involved in this study are all from public data.

Conflicts of Interest

The authors declare no conflict of interest.

References

  1. Zhang, X.-S.; Gui, B.-W. Total Factor Productivity Analysis in China: A Review and Application of Malmquist Index Method. Quant. Econ. Tech. Econ. Res. 2008, 6, 111–122. [Google Scholar] [CrossRef]
  2. Guo, X.-M.; Chen, B.-Y.; Kun, W.; Li, J.-L. Measurement of total factor productivity and international comparison. Stat. Decis. Mak. 2022, 4, 146–149. [Google Scholar] [CrossRef]
  3. Zhang, S.-T.; Li, X.-Z. Estimation and analysis of total factor productivity in China’s Yangtze River Delta region. Manag. World 2005, 11, 59–66. [Google Scholar] [CrossRef]
  4. Zhang, Z.-S.; Jin, M.-W. An Examination of Total Factor Productivity Measurement and Heterogeneity in Six Central Provinces. Stat. Decis. Mak. 2022, 4, 128–132. Available online: https://kns.cnki.net/kcms/detail/42.1009.c.20220426.1748.002.html (accessed on 29 April 2022).
  5. Xiang, Y.-H.; Lv, H.-P.; Jin, X.-R. Study on the efficiency and total factor productivity of China’s regional economy for high-quality development. Sustainability 2018, 10, 111. [Google Scholar] [CrossRef] [Green Version]
  6. Yu, M.; Yong, L.-L.; De, Y.-X.; Wu, Y.-Q.; Cheng, J.-H. Spatial-Temporal Evolution of Total Factor Productivity in Logistics Industry of the Yangtze River Economic Belt, China. Sustainability 2022, 14, 2740. [Google Scholar] [CrossRef]
  7. Shen, N. An empirical study of regional spatial differences in total factor productivity in China’s manufacturing industry. China Soft Sci. 2006, 6, 101–110. [Google Scholar] [CrossRef]
  8. Gao, M.-F.; Zheng, J. Total Factor Productivity Measurement in Chinese Agriculture and its Spatial and Temporal Differences-A Re-Examination Based on Carbon Sink Perspective. Ecol. Econ. 2021, 12, 98–104. [Google Scholar]
  9. Tian, P.; Wang, Z.-B. A study on regional differences in total factor productivity and influencing factors in China’s tertiary industry. J. Quant. Econ. 2019, 3, 100–120. [Google Scholar]
  10. Bao, Y.-W.; Ding, J.T. Measurement, decomposition and convergence analysis of total factor productivity in Hubei cities. Stat. Decis. Mak. 2021, 20, 124–127. [Google Scholar] [CrossRef]
  11. Jin, F.; Zhang, Q. A discussion on the change of TFP at urban and county level in China: 2007–2010. Res. Quant. Econ. Technol. Econ. 2013, 9, 55–71. [Google Scholar]
  12. Xiao, L.-X. Estimation and Decomposition of the Total Factor Productivity of China-Feasibility Discussion and Application of DEA-Malmquist Method. J. Guizhou Univ. Financ. Econ. 2013, 1, 32–39. [Google Scholar]
  13. Wang, J.-Y. Estimation of education level of workers in three industries in China since 1978. Popul. Stud. 2002, 5, 70–76. [Google Scholar]
  14. Hu, F. Human capital and economic growth: An empirical analysis. Econ. Sci. 2003, 1, 54–60. [Google Scholar] [CrossRef]
  15. Wang, X.-H.; Pan, Z.-G. Construction and application of a model for measuring the efficiency of technical progress. Oper. Res. Manag. 2012, 4, 219–226. [Google Scholar]
  16. Zhu, Y.; Xiong, S.-M. An empirical study on the effect of technological progress and industrial structure change on employment in China. Quant. Econ. Tech. Econ. Res. 2009, 5, 107–119. [Google Scholar] [CrossRef]
  17. Zhang, J.; Shi, S.-H. Total factor productivity changes in China: 1952–1998. World Econ. J. 2003, 3, 17–24. [Google Scholar]
  18. Xu, X.-X.; Zhou, J.-M.; Shu, Y. Estimation of capital stock in three industries in China’s provinces and regions. Stat. Res. 2007, 5, 6–13. [Google Scholar] [CrossRef]
  19. Song, Z.-L.; Liao, Z.-D. Re-estimation of inter-provincial three industries stock in China: 1978–2011. J. Guizhou Univ. Financ. Econ. 2014, 3, 8–16. [Google Scholar]
  20. Young, A. Gold into Base Metals: Productivity Growth in The People’s Republic of China during the Reform Period. J. Political Econ. 2003, 111, 1226–1261. [Google Scholar] [CrossRef] [Green Version]
  21. Zhang, J.; Wu, G.-Y.; Zhang, J.-P. Estimation of China’s Provincial Capital Stock Series, Paper Presented at Productivity and Efficiency Workshop. Tsinghua Univ. 2007, 1, 13–14. [Google Scholar]
  22. Zhang, J.-H.; Wang, P. Total factor productivity in China: A re-estimation based on capital depreciation rates by province. Manag. World 2012, 10, 18–30. [Google Scholar] [CrossRef]
  23. Jia, R.-S.; Zhang, S.-C. Interprovincial capital stock and returns in China. Stat. Res. 2014, 11, 35–42. [Google Scholar]
  24. Barro, R.J.; Sala-I-Martin, X. Convergence across U.S. States and Regions. Brook. Pap. Econ. Act. 1991, 22, 107–158. [Google Scholar] [CrossRef] [Green Version]
  25. Shen, D.-H.; Liu, J.-Y.; Cui, Z.-X. Total factor productivity measurement and regional convergence test in China’s manufacturing industry. Stat. Decis. Mak. 2021, 1, 47–52. [Google Scholar] [CrossRef]
  26. Guo, Q.-W.; Zhao, Z.-Y.; Jia, J.-X. The Analysis of Provincal Total Productivity in China. World Econ. 2005, 5, 46–53. [Google Scholar]
  27. Zhang, J.; Sheng, K.-R.; Wang, C.-Y. Spatial-Temporal Dynamics and Underlying Factors of TFP Caross the World. Glob. City Study 2021, 4, 34–47. [Google Scholar]
  28. Yu, H.; Liu, Y.; Zhao, J.; Li, G. Urban Total Factor Productivity: Does Urban Spatial Structure Matter in China? Sustainability 2020, 12, 214. [Google Scholar] [CrossRef] [Green Version]
  29. Guo, Q.-W.; Jia, J.-X. Estimating Total Factor Productivity in China. Econ. Res. 2005, 6, 51–60. [Google Scholar]
  30. Li, P.; Zhong, X.-Y.; Wang, H.-W.; Zheng, S.-L. Productivity change and source of economic growth in China: 1978–2010. Res. Quant. Econ. Technol. Econ. 2013, 1, 3–21. [Google Scholar]
  31. Deng, Y.-Y.; Chen, S. Regional Total Factor Productivity in China Growth Rate Decomposition and Resource Allocation Efficiency Study. Stat. Decis. Mak. 2022, 13, 117–122. [Google Scholar] [CrossRef]
  32. Zhang, H.-R.; Yi, B.-Z. Technological Progress, Structural Adjustment and Employment Growth–An Empirical Study Based on Spatial Panel Model. Econ. Surv. 2011, 5, 14–17. [Google Scholar] [CrossRef]
  33. Zhang, J.; Wu, G.-Y.; Zhang, J.-P. Estimation of inter-provincial physical capital stock in China: 1952–2000. Econ. Res. 2004, 10, 35–44. [Google Scholar]
  34. Sun, H.; Zhi, D.-L. Estimation of capital stock and typical facts for Chinese provinces: 1978–2008. J. Financ. Econ. 2010, 3, 103–116. [Google Scholar]
  35. Xu, H.; Wang, Y. A study of total factor productivity growth trends and heterogeneity in Hubei Province. Stat. Decis. Mak. 2021, 9, 119–122. [Google Scholar] [CrossRef]
  36. Peng, G.-H. The Disparity of Income, TFP and the Convergence Hypothesis in Chinese Provinces. Econ. Res. 2005, 9, 19–29. [Google Scholar]
Figure 1. Trends in the degree of variation of TFP and decomposition indicators in nine Pan-PRD provinces.
Sustainability 14 14154 g001
Figure 2. Radar chart of the TFP index for each province in the nine Pan-PRD provinces.
Sustainability 14 14154 g002
Figure 3. Distribution of the degree of variation in TFP in nine Pan-PRD provinces.
Sustainability 14 14154 g003
Figure 4. Growth of TFP, TC, and TEC in the East, Central, and West of the nine Pan-PRD provinces.
Sustainability 14 14154 g004
Figure 5. TFP growth trends and their decomposition for the three industries in the nine Pan-PRD provinces from 2003 to 2020.
Sustainability 14 14154 g005
Figure 6. σ convergence trend of TFP index in Pan-PRD provinces.
Sustainability 14 14154 g006
Table 1. The capital depreciation rate of nine provinces from 2003 to 2020 (Unit: %).
Province2003–2010 Year2011–2020 YearProvince2003–2010 Year2011–2020 Year
Fujian5.74.0Guizhou5.72.9
Jiangxi6.03.3Yunnan6.04.2
Hunan5.95.0Sichuan5.84.2
Guangdong10.89.2Hainan8.25.5
Guangxi6.03.6
Table 2. Input and output indicators for total factor productivity measurement.
Indicator ClassificationIndicator NameEvaluation IndicatorUnit
Input IndicatorsLabor input x11. Provincial: The average number of years of education of employed persons.million people year
2. Industry: The average value of the number of employed persons in the three industries of the province at the end of the year in the two adjacent years.
3. City: The average value of the number of employed persons in a city at the end of the year for the two adjacent years.
million people
Capital stock x2The perpetual inventory method was used to measure the physical capital stock of the nine provinces, industries and cities.RMB billion
Output IndicatorsGross domestic product yReal GDP of each province, industry, and city for each calendar year (expressed in constant 2003 prices)RMB billion
Table 3. Malmquist productivity index and its decomposition for the nine Pan-PRD provinces and regions.
ProvinceTFPTCTECPECSECGDP Growth
Rate (%)
TFP Contribution
Rate (%)
Fujian1.0771.0611.0121.0081.00411.4867.07
Jiangxi1.0811.0651.0151.0151.00010.7375.49
Guangdong1.0541.0541.0001.0001.0009.6056.25
Guangxi1.0551.0600.9950.9960.9989.2559.46
Hunan1.0651.0571.0071.0080.99910.6660.98
Guizhou1.0801.0621.0171.0180.99811.2571.11
Yunnan1.0681.0581.0101.0091.0004.57148.80
Sichuan1.0691.0621.0071.0080.99810.7464.25
Hainan1.0491.0620.9981.0000.9889.5251.47
Average value1.0661.0601.0061.0070.9989.7667.62
Eastern Provinces1.060591.0061.0030.99710.2058.26
Provinces in the Central Region1.0731.0611.0791.0120.99910.7065.31
Provinces in Western Region1.0681.0611.0111.0150.9998.9594.72
Table 4. Basic characteristics of inter-provincial TFP growth rate and its decomposition in nine Pan-PRD provinces.
IndicatorTFPTCTECPECSEC
Maximum value1.0811.0651.0171.0181.004
Minimum value1.0491.0540.9880.9960.988
Average value1.0661.0601.0061.0070.998
Number of provinces with improved efficiency99784
Percentage of provinces with improved efficiency100%100%77.78%88.89%44.44%
Table 5. Malmquist productivity index and its decomposition for the three industries in the nine Pan-PRD provinces.
IndustryTFPTCTECPECSECGDP Growth Rate (%)TFP Contribution Rate (%)
Primary Industry1.0461.0461.0001.0030.9964.35105.84
Secondary Industry1.0651.0750.9900.9930.99711.4956.57
Tertiary Industry1.0791.0571.0211.0171.00410.4570.81
Average1.0631.0591.0201.0040.9998.7677.74
Table 6. The average value of Malmquist production index in nine Pan-Pearl River Delta cities, 2003–2019.
ProvinceCityTFPProvinceCityTFPProvinceCityTFP
FujianFuzhou1.058GuangdongGuangzhou1.059GuangxiNanning1.055
Xiamen1.058Shaoguan1.059Liuzhou1.063
Ptoan1.066Shenzhen1.037Guilin1.057
Sanming1.068Zhuhai1.068Wuzhou1.083
Quanzhou1.085Shantou1.058Beihai1.117
Zhangzhou1.065Foshan1.046Fangchenggang1.104
Nanping1.042Jiangmen1.068Qinzhou1.085
Ningde1.062Zhanjiang1.068 Guigang1.07
Longyan1.071Maoming1.062Yulin1.068
ChengduChengdu1.042Zhaoqing1.063Baise1.078
Zigong1.082Huizhou1.068Hezhou1.067
Panzhihua1.05Meizhou1.075Hechi1.032
Luzhou1.086Shanwei1.076Laibin1.055
Deyang1.077Heyuan1.119Chongzuo1.066
Mianyang1.087Yangjiang1.05Nanchang1.062
Guangyuan1.075Qingyuan1.066Jingdezhen1.082
Suining1.06Dongguan0.99Pingxiang1.087
Neijiang1.078Zhongshan1.024JiangxiJiujiang1.085
Leshan1.108Chaozhou1.127Xinyu1.105
Nanchong1.064Jieyang1.094Yingtan1.035
Meishan1.061Yunfu1.059Ganzhou1.047
Yibin1.053HunanChangsha1.077Jian1.08
Guangan1.048Zhuzhou1.082Yichun1.073
Dazhou1.03Xiangtan1.082Fuzhou1.056
Yaan1.075Hengyang1.113Shangrao1.038
Bazhong1.045Shaoyang1.071YunnanKunming1.072
Ziyang1.080Yueyang1.093Qujing1.055
GuizhouGuiyang1.081Changde1.064Yuxi1.041
Liupanshui1.119Zhangjiajie1.072Baoshan1.078
Zunyi1.08Yiyang1.087Zhaotong1.074
Anshun1.05Chenzhou1.068Lijiang1.079
HainanHaikou1.044Yongzhou1.081Puer1.098
Sanya1.061Huaihua1.066Lincang1.061
Loudi1.082
mean1.069
Table 7. Distribution of opening, mid-term, and closing TFP for 100 cities in nine Pan-PRD provinces.
TFP Interval2003–2004 Year2011–2010 Year2018–2019 YearNumber of Cities with Lower TFP As a Percentage
<1.04 cities, of which: Guangdong 3; Yunnan 16 cities, of which: Yunnan 2; Jiangxi 1: Guangxi 2; Hainan 216 cities, of which: Guangdong 2; Jiangxi 1; Guangxi 1; Hunan 4; Sichuan 7; Fujian 1Fujian: 6/9 Jiangxi: 5/11
Guangdong: 17/21
Guangxi: 8/14
Hunan: 9/13
Guizhou: 2/4
Yunnan: 4/8
Sichuan: 12/18
Hainan: 1/2
[1.0–1.057)24 cities, of which: Jiangxi 5; Guangdong 4; Guangxi 3; Hunan 3; Guizhou: 1; Yunnan 1; Sichuan 6; Hainan 127 cities, of which: Fujian 2; Jiangxi 3; Guangdong 10; Guangxi 5; Hunan 5; Sichuan 237 cities, of which: Fujian 5; Jiangxi 1; Guangdong 17; Guangxi 4; Hunan 5; Guizhou: 1; Yunnan 1; Sichuan 1; Hainan 1
[1.057–1.076)11 cities, of which: Fujian 5; Jiangxi 1; Guangdong 1; Hunan 2; Sichuan 214 cities, of which: Fujian 2; Jiangxi 1; Guangdong 4; Guangxi 2; Hunan 3; Sichuan 213 cities, of which:
Jiangxi 3; Guangdong 1; Guangxi 2; Hunan 2; Sichuan 3: Guizhou: 1; Hainan 1
>1.07661 cities, of which: Fujian 4; Jiangxi 5; Guangdong 13; Guangxi 11; Hunan 8; Guizhou: 3; Yunnan 6; Sichuan 10; Hainan 153 cities, of which: Fujian 5; Jiangxi 6; Guangdong 7; Guangxi 6; Hunan 5; Guizhou: 4; Yunnan 6; Sichuan 1434 cities, of which:
Fujian 3; Jiangxi 5; Guangdong 1; Guangxi 7; Hunan 4; Guizhou: 2; Yunnan 6; Sichuan 6
TFP Mean1.0901.0751.049
Table 8. Results of the absolute β convergence test for TFP in provincial and city areas of nine Pan-PRD provinces.
βaR2F
Provinces−0.499 **
(−3.31)
1.075 ***
(196.64)
0.438510.93
Cities−0.7834 ***0.8449 ***0.3911962.33
Note:, **, *** each represent significant at 5%, 10% level.
Table 9. Robustness check results of the TFP index and its decomposition indexes in the nine Pan-PRD provinces from 2003 to 2020.
Depreciation RateTFPTCTECPECSEC
Depreciation rate of this article1.0661.061.0070.9981.066
6.00%1.0691.0011.0040.9971.070
9.60%1.0701.0011.0030.9981.070
Publisher’s Note: MDPI stays neutral with regard to jurisdictional claims in published maps and institutional affiliations.

