Article

Accumulative Strain of Sand-Containing Soft Soil Reinforced by Cement and Sodium Silicate under Traffic Loading

1
Key Laboratory of Underground Engineering, Fujian Province University (Fujian University of Technology), Fuzhou 350118, China
2
School of Civil and Architecture Engineering, East China University of Technology, Nanchang 330013, China
*
Author to whom correspondence should be addressed.
Sustainability 2022, 14(21), 14127; https://doi.org/10.3390/su142114127
Submission received: 7 October 2022 / Revised: 24 October 2022 / Accepted: 25 October 2022 / Published: 29 October 2022

Abstract

:
The accumulative strain of sand-containing soft soil is crucial to the stability of the construction of embankment engineering such as expressways and high-speed railways. However, little attention has been devoted to the accumulative strain of sand-containing soft soil. In the current study, a series of cyclic triaxial tests were performed to investigate the accumulative strain of sand-containing soft soil reinforced by cement and sodium silicate under traffic loading. In addition, the accumulative strain model was proposed to describe the characteristic of accumulative strain. The results show that for the specimens with a high sand content (25%, 30%, and 35%), the accumulative strain increases obviously with the increase of the sand content. For the specimen with a cement content of 3%, the accumulative strain increases distinctly with the increasing loading time. The accumulative strain is strongly influenced by confining pressure. When the repeated cyclic stress amplitude is greater than 0.17 kN, the increase rate of accumulative strain is greater. The shorter the curing time is, the greater the accumulative strain is. The calculated results of the accumulative strain model show a good agreement with test data. Hence, the accumulative strain model can better describe the characteristic of accumulative strain.

1. Introduction

It is common knowledge that the global climate is getting warmer rapidly and the land resources are becoming scarce quickly [1]. As a result, a large number of infrastructures such as expressways and high-speed railways have no choice but to build in soft soil regions [2]. In addition, it is universally known that soft soil is widely distributed around the world [3,4]. However, soft soil is generally not suitable for use in engineering constructions due to its high moisture content, low strength, and high sensitivity [5,6]. Hence, under the background of global warming, the reinforcement of soft soil embankments is an important scientific subject and has attracted a great amount of attention from researchers [7,8]. In order to solve the problem of soft soil reinforcement, a series of methods including chemical stabilization reinforcement and physical stabilization reinforcement have been conducted in geotechnical engineering [9,10,11]. For physical stabilization reinforcement, the most commonly used materials are: (1) cotton and hemp products such as cotton fiber [12], coir fibers [13], straw fibers [14], sisal fibers [15]; (2) geotextiles such as geogrid [16]; and (3) various kinds of fiber such as polypropylene fiber [17], glass fiber [18], basalt fiber [19], and steel fiber [20]. For chemical stabilization reinforcement, the most commonly used materials are cement [21,22,23], lime [24], and fly ash [25].
There is already growing evidence, in the basic levels of ongoing research, that cement-based stabilization is one of the most effective methods for improving the engineering performance of soft soil [26,27]. Silveira et al. [28] conducted a series of unconfined compression strength tests and direct shear tests to evaluate the mechanical properties of soil reinforced by cement. The results indicated that the addition of cement can harden the soil and significantly increase its shear strength. Ho et al. [29] investigated the influence of cement content on the strength and stiffness of cement-stabilized soil. According to the experimental results, it was found that the cement ratio was the prime parameter that can affect the engineering behavior of cement-stabilized soil. Wu et al. [30] analyzed the effect of cement on mechanical properties of cement-based stabilized soil and pointed out that, although cement and other cementitious additives such as silica fume can significantly affect the strength and stiffness of cement-based stabilized soil, cement is the primary influencing factor. Eskişar et al. [31] performed a great number of unconfined compression tests and ultrasonic pulse velocity tests to study the strength of cement-treated soil. It can be seen that the strength and stiffness increased with the increase of cement. Moreover, even for the specimen with low cement content, the increase of strength and stiffness was evident. Tang et al. [32] analyzed the mechanical properties of uncemented and cemented soft soil and observed that the peak stress of cemented soft soil increased considerably with the increasing cement content. The failure strain of uncemented soil is much greater than that of cemented soil. Cristelo et al. [33] carried out a series of unconfined compressive strength tests in order to investigate the influence of Portland cement on soft soil stabilization. It can be seen that the strength increased strongly with the increase of the water/cement ratio. The strength exhibited a significantly decreasing trend when the water/cement ratio increased from 0.75 to 1.0.
It is worth noting that, similarly with soft soil, sand-containing soft soil which also has the characteristics of a high moisture content, poor bearing capacity, and high compressibility is widely distributed all over the world [34,35,36,37]. In addition, the sand in sand-containing soft soil can alter the internal structure of the soil and, as a result, soil exhibits anisotropic characteristics and different mechanical properties. Hence, a better understanding with respect to the accumulative strain of sand-containing soft soil, which is sometimes named “problematic” soil, is crucial to the stability of expressways and high-speed railways. However, few investigations have been done on the accumulative strain of sand-containing soft soil.
In this paper, a series of cyclic triaxial tests were conducted in order to get a better understanding of the accumulative strain of sand-containing soft soil reinforced by cement and sodium silicate under traffic loading. The influence of the sand content on the accumulative strain was analyzed. The impacts of other influence factors such as cement content, confining pressure, repeated cyclic stress amplitude, and curing time on accumulative strain were also investigated. In addition, the accumulative strain model was proposed to describe the experimental data.

2. Laboratory Test Program

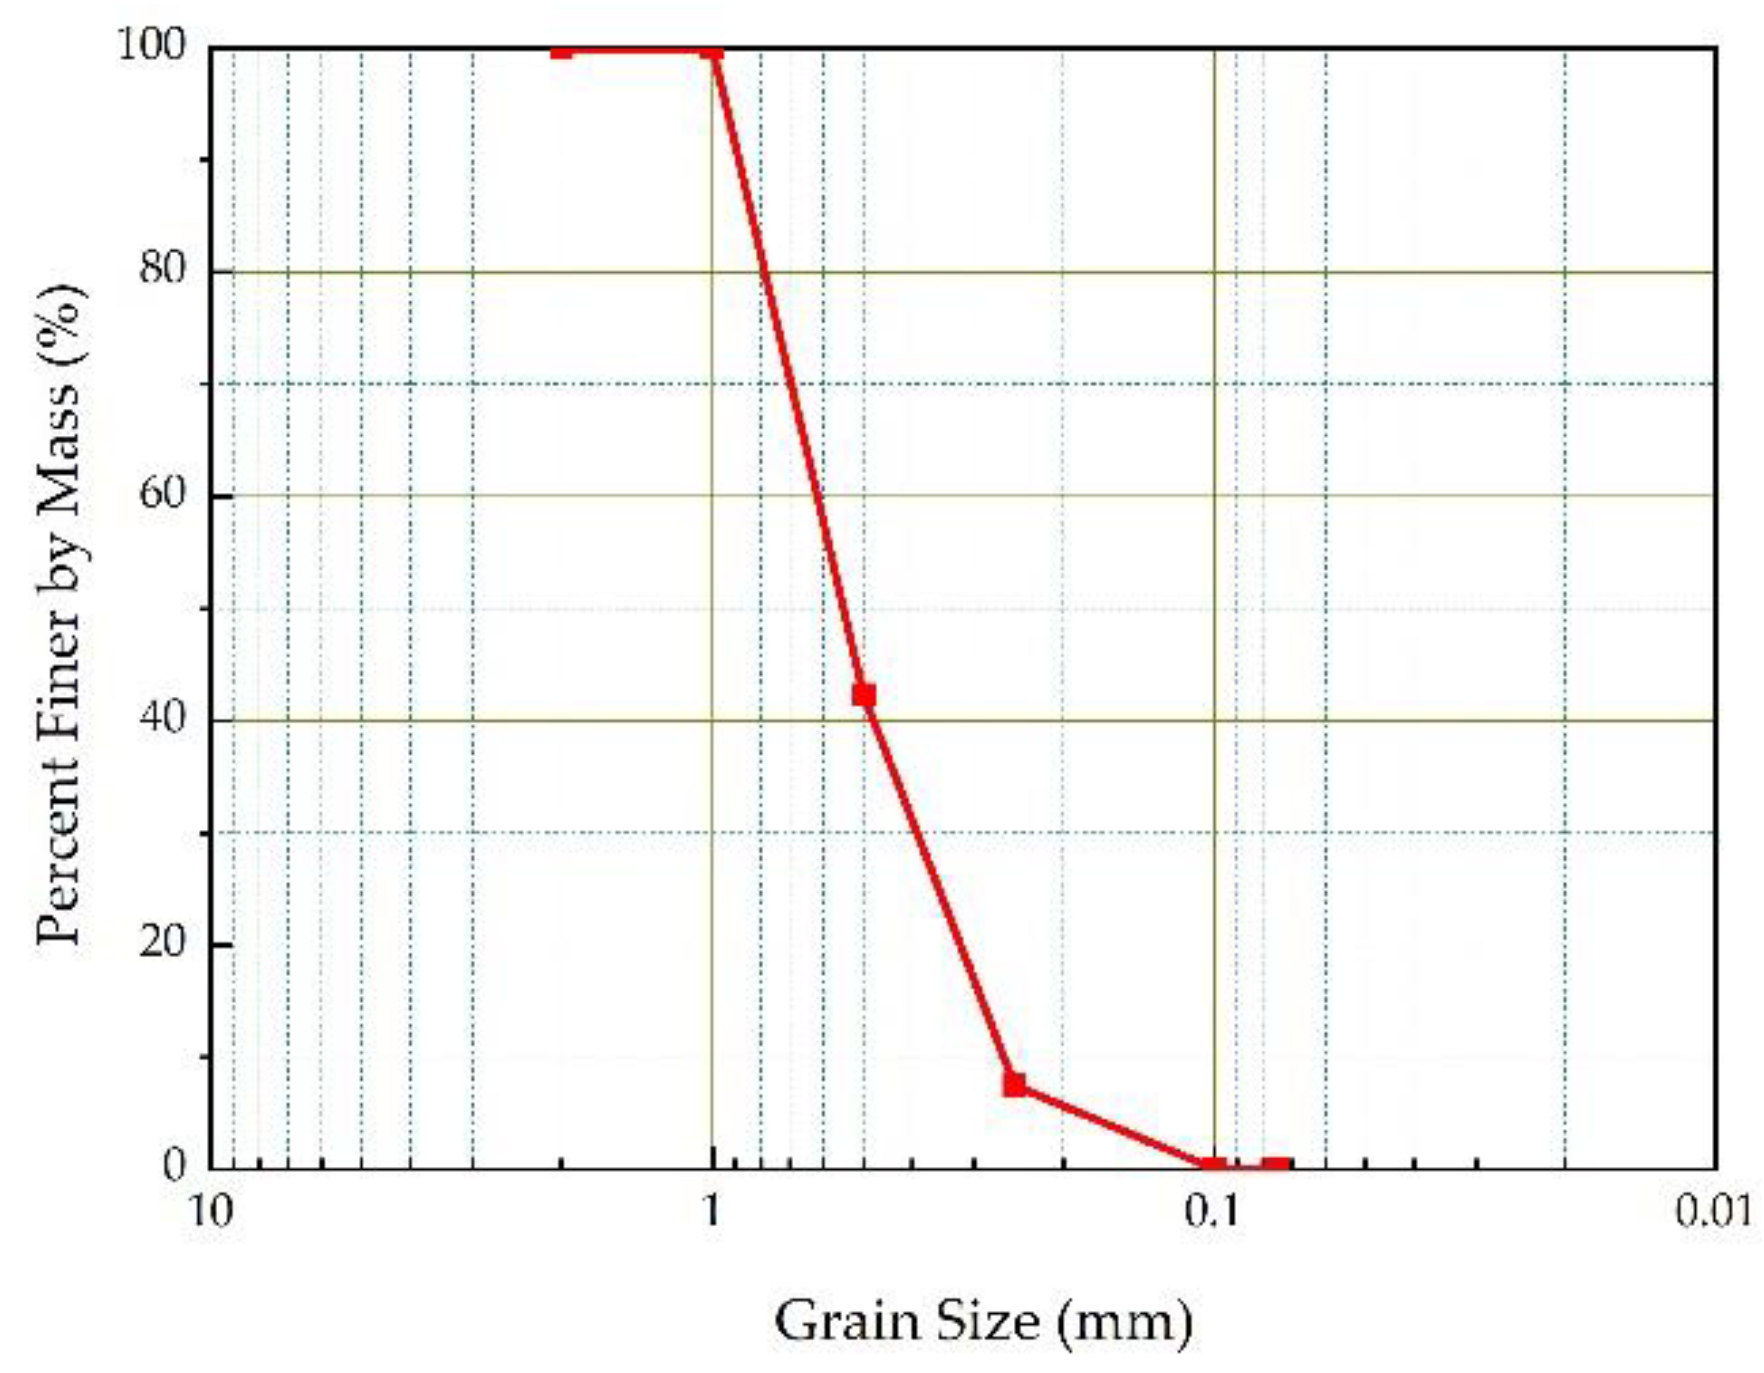
2.1. Materials and Test Device

The soft soil used in the current study was obtained from the embankment along the Fuzhou-Xiamen Expressway, China. The sand content is 10%. Other physical indices of the soft soil such as moisture content, dry density, liquid limit, and plastic limit are listed in Table 1.
The accumulative strain is considerably influenced by the sand content of soft soil. In the present study, the sand that was obtained from the sand stratum of the embankment along the Fuzhou-Xiamen Expressway was used in order to investigate the effect of sand content on accumulative strain in more detail, as shown in Figure 1. The grain size distribution curve of sand is presented in Figure 2.
The cement used in this test was produced by Zhejiang Wan Ning Technology Co., Ltd. (Zhejiang, China). The main components are 3CaO·SiO2, 2CaO·SiO2, 3CaO·Al2O3, and 4CaO·Al2O3·Fe2O3. The basic indexes of cement are shown in Table 2.
In this paper, the activator was the anhydrous sodium silicate (Na2SiO3) produced by the Tianjin Fuchen Chemical Reagent Factory (Tianjin, China). It can be soluble in water at room temperature easily and its modulus is 1.2. The anhydrous sodium silicate can react with cement as follows:
NaO·nSiO2 + Ca(OH)2 + mH2O → CaO·nSiO2·mH2O + 2NaOH
The cyclic triaxial tests were conducted in the Key Laboratory of Underground Engineering, Fujian Province University (Fujian University of Technology). The instrument in this experiment is the computer-controlled GDS Triaxial Testing System (GDS Instruments Ltd., London, UK), as shown in Figure 3. The GDS triaxial testing system is equipped with a pressure chamber, an axial loading driver, a confining pressure controller, a back pressure controller, a measuring apparatus, and data acquisition units. The confining pressure ranges from 0 to 2 MPa, the maximum frequency is 5 Hz, and the maximum axial load is 10 kN.

2.2. Specimen Preparation and Experimental Scheme

The procedures of preparing specimens were performed according to the Specification of Soil Test (SL237) and were designed as following: (1) The soft soil and sand used in the current study were dried in an oven at 100 °C for 24 h. (2) According to the experimental scheme, soft soil, sand, anhydrous sodium silicate, cement, and distilled water were fully mixed. (3) A film of aircraft hydraulic oil was coated on the internal surface of the three-segment copper molds with a diameter of 50 mm and height of 100 mm so as to separate the specimen from the three-segment copper molds conveniently. (4) The mixture was put into the three-segment copper molds in the same five layers and each layer was compacted. (5) The specimen was separated from the three-segment copper molds and put into the vacuum saturator. (6) The specimen was cured in a curing box with a constant temperature of 20 °C and humidity of 97% for standard curing. (7) The specimens were made in batches to ensure their comparability, as shown in Figure 4.
Similarly with the workflow of previous experiments performed by Yu et al. [38] and Kong et al. [39], the workflow of this study can also be divided into two stages: isotropic consolidation stage and cyclic loading stage, as shown in Figure 5a. (1) In the isotropic consolidation stage, the specimens were allowed to be vacuum-pumped and back-pressure-saturated. The saturation was terminated when the Skempton’s B-value was equal to or greater than 0.95. After saturation, the specimens were subjected to isotropic consolidation under a certain confining pressure. (2) In the cyclic loading stage, a series of long-term, low-level cyclic triaxial tests were conducted. The cyclic loading with the sine-wave form was applied on the specimens only in the axial direction and the lateral stress was constant, as shown in Figure 5b.
According to our previous study [40], the field measured data show that the dominant frequency is only 1 Hz when the depth is 3.12 m. In addition, Dai et al. [41] and Guo et al. [42] pointed out that 1 Hz can represent the actual frequency of traffic loading. Hence, the loading frequency used in this paper was 1 Hz. The field measured data [40] also show that the dynamic stresses range from 14.6 kPa to 46.4 kPa when the truck speed is 70 km/h. Furthermore, in order to study the impact of repeated cyclic stress amplitude on the accumulative strain in more detail, the repeated cyclic stress amplitudes used in this paper were 0.124 kN, 0.15 kN, 0.17 kN, 0.19 kN, 0.22 kN, and 0.25 kN. Based on previous studies [38,41,43], a general conclusion that the confining pressures of 50 kPa, 100 kPa, and 150 kPa can represent the actual confining pressures of traffic loading has been accepted. Furthermore, in order to study the impact of confining pressure on the accumulative strain in more detail, the confining pressures used in this paper were 50 kPa, 100 kPa, 150 kPa, 200 kPa, 250 kPa, and 300 kPa. The details of the experiment scheme are summarized in Table 3 in detail. Note that the content of anhydrous sodium silicate was 2%.

3. Results and Discussion

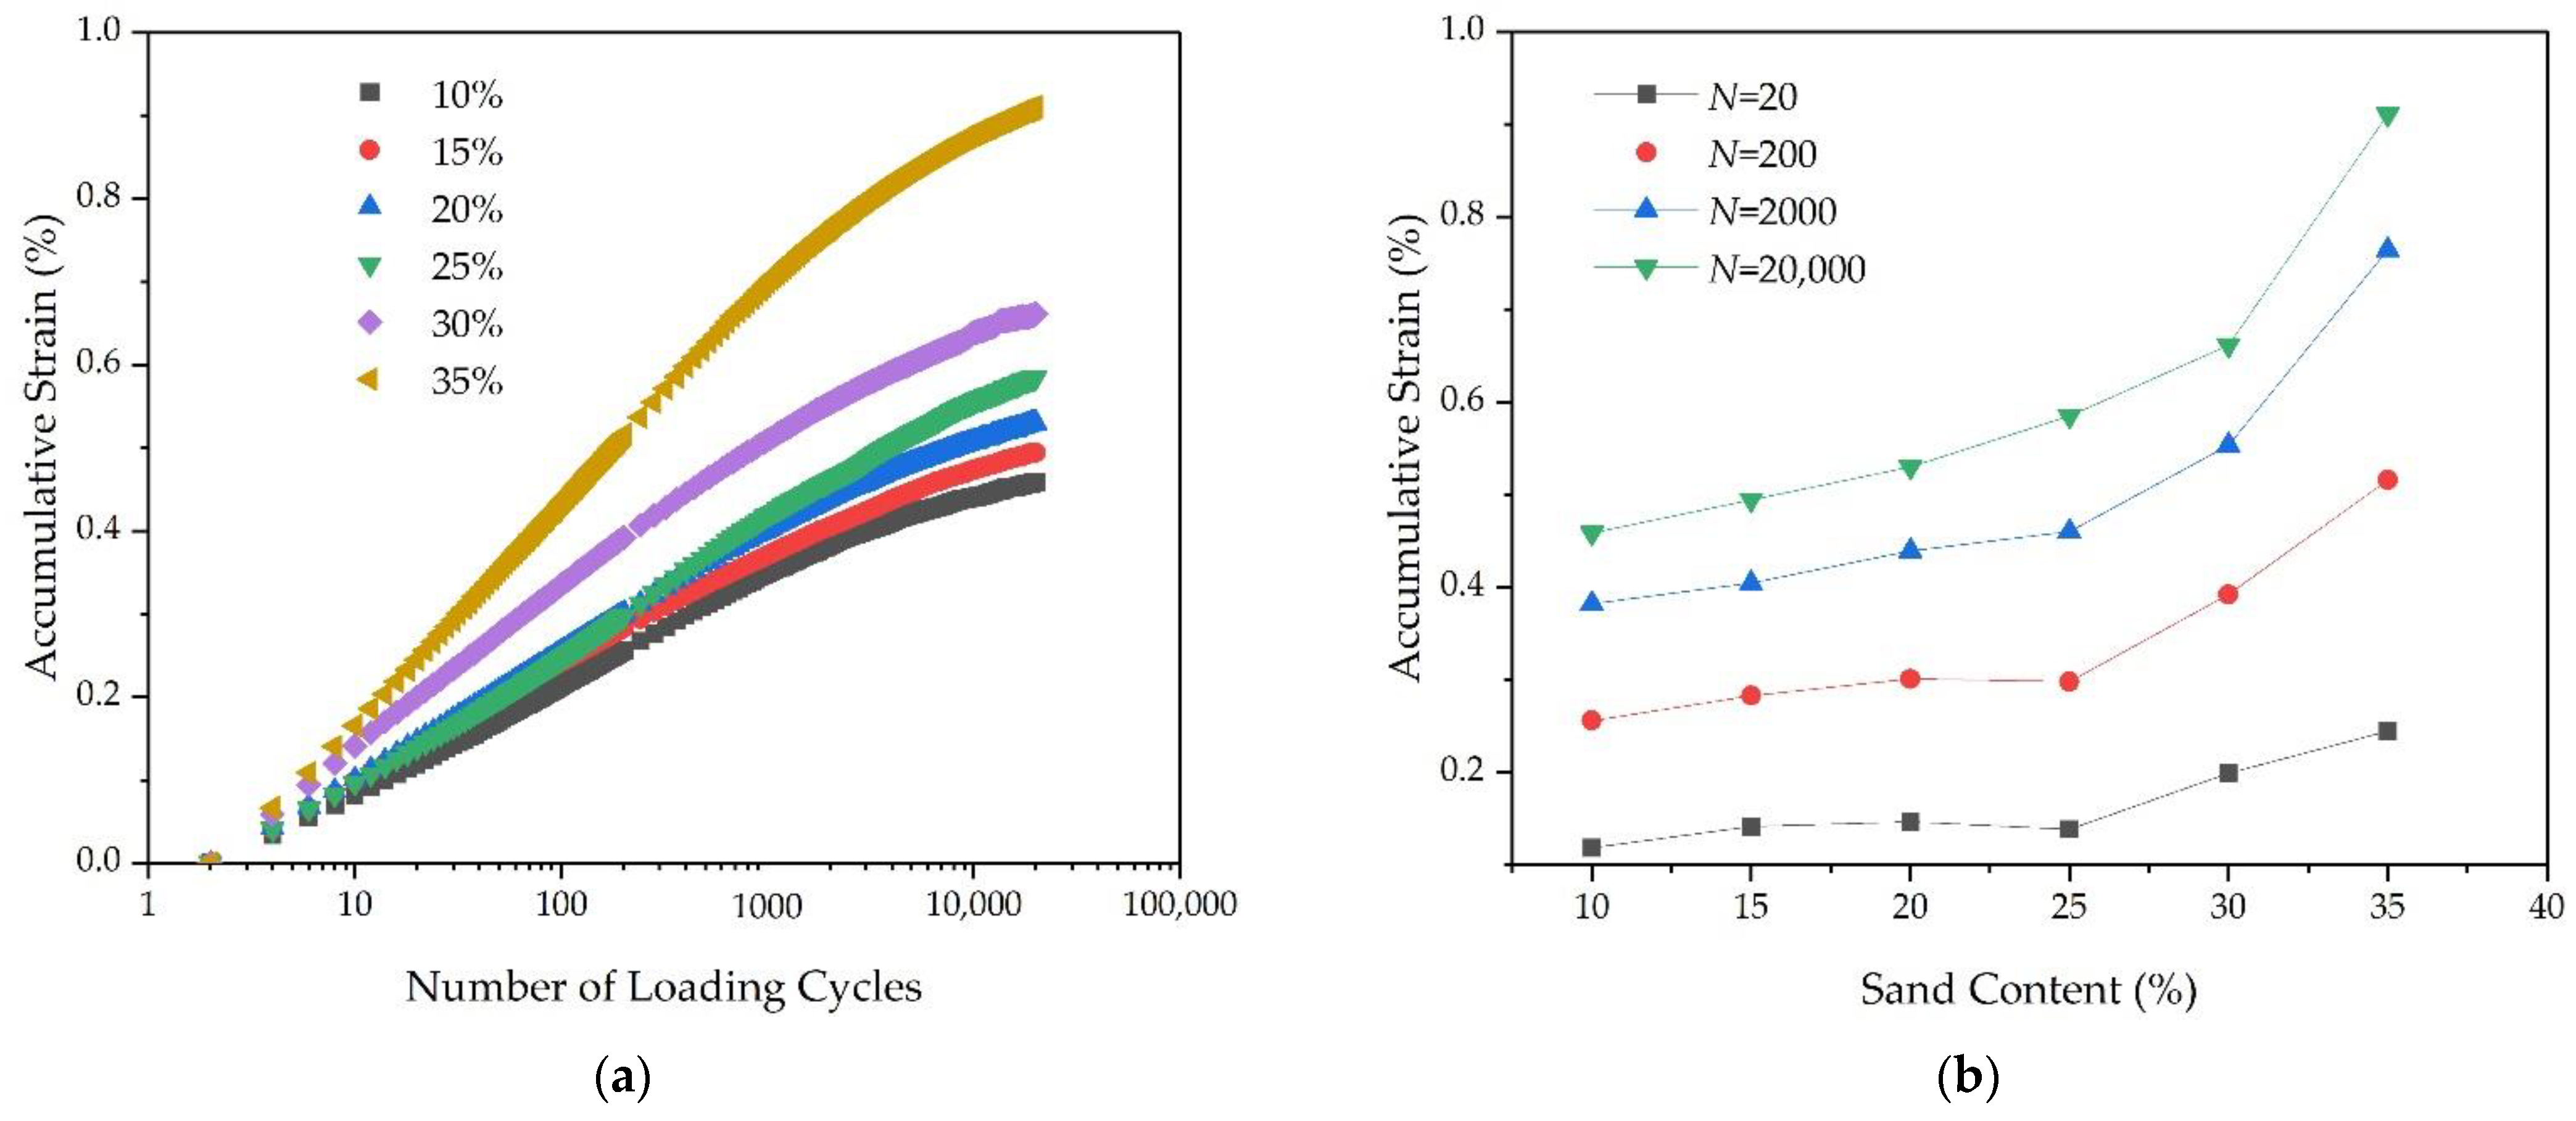
3.1. Influence of Sand Content on Accumulative Strain

In order to study the impact of sand content on the accumulative strain, six tests with different sand contents (10%, 15%, 20%, 25%, 30%, and 35%) were carried out. The effect of sand content on the relationship between the accumulative strain and number of loading cycles can be indicated by Figure 6. As presented in Figure 6a, for the specimens with a low sand content (10%, 15%, and 20%), a small increase in the accumulative strain is found with the increasing sand content. In contrast, for the specimens with a high sand content (25%, 30%, and 35%), the accumulative strain increases obviously with the increase of sand content. As shown in Figure 6b, for a given number of loading cycles, the accumulative strain of the specimens with a low sand content (10%) is about half of that of the specimens with a high sand content (35%). One reason that can explain this phenomenon is that the higher the sand content is, the looser the soil becomes. As a result, the soil can be compressed easily and the accumulative strain is greater. It should be noted that Yang et al. [44] and Sun et al. [45] analyzed the accumulative strain of soft soil without sand; compared with the existing studies using similar materials such as soft soil, it is quite clear that the increase rate of accumulative strain is strongly influenced by sand content: the higher the sand content is, the greater the increase rate of accumulative strain is.

3.2. Influence of Cement Content on Accumulative Strain

The influence law of cement content on the accumulative strain was studied by six tests with different cement contents (3%, 6%, 9%, 12%, 15%, and 18%). The effect of cement content on the relationship between the accumulative strain and the number of loading cycles is presented in Figure 7. The results in Figure 7a reveal that cement content has the greatest impact on accumulative strain. For the specimen with cement content of 3%, the accumulative strain increases distinctly with the increasing loading time. Figure 7a also makes it clear that when cement content is greater than 12%, the accumulative strain changes slightly with the increasing cement content. Figure 7b indicates that when the number of the loading cycle is 200, the accumulative strain decreases from 1.95% to 0.05% as the cement content increases from 3% to 18%. The results may be caused by the fact that the inter-particle bonding strength increases with the increase of cement content. Furthermore, the water in the soil which can reduce the inter-particle friction decreases with the increasing cement content.

3.3. Influence of Confining Pressure on Accumulative Strain

In order to study the impact of confining pressure on accumulative strain, six tests with different confining pressures (50 kPa, 100 kPa, 150 kPa, 200 kPa, 250 kPa, and 300 kPa) were carried out. The effect of confining pressure on the relationship between the accumulative strain and the number of loading cycles can be indicated by Figure 8. As presented in Figure 8a, the conclusion that the accumulative strain is strongly influenced by confining pressure is achieved. It is obvious that for a given number of loading cycles, the accumulative strain of the specimen with larger confining pressures is smaller. When the number of loading cycles is equal to 20,000, a 50 percent drop of accumulative strain can be found as the confining pressure increases from 50 kPa to 300 kPa, as shown in Figure 8b. The reason that we can interpret this phenomenon is that the higher confining pressure can increase the interlocking frictional force between soil particles and give rise to the increase of the capability of resisting deformation.

3.4. Influence of Repeated Cyclic Stress Amplitude on Accumulative Strain

The dependence of repeated cyclic stress amplitudes on accumulative strain was investigated by six tests with different repeated loads (0.124 kN, 0.15 kN, 0.17 kN, 0.19 kN, 0.22 kN, and 0.25 kN). Figure 9 shows the effect of repeated cyclic stress amplitudes on the relationship between the accumulative strain and number of loading cycles. Referring to Figure 9a, it becomes clear that the accumulative strain is heavily influenced by the repeated cyclic stress amplitude. In addition, when the repeated cyclic stress amplitude is greater than 0.17 kN, the increase rate of the accumulative strain is greater. Figure 9b demonstrates that when the number of loading cycles is equal to 2000, the accumulative strain increases from 0.25% to 1.01%, which means a 300 percent growth, as the repeated cyclic stress amplitude increases from 0.124 kN to 0.25 kN. One reason that can explain this phenomenon is that when the higher repeated cyclic stress amplitude, which can destroy the internal structure of the soil, is applied on the specimen, the accumulative strain increases obviously.

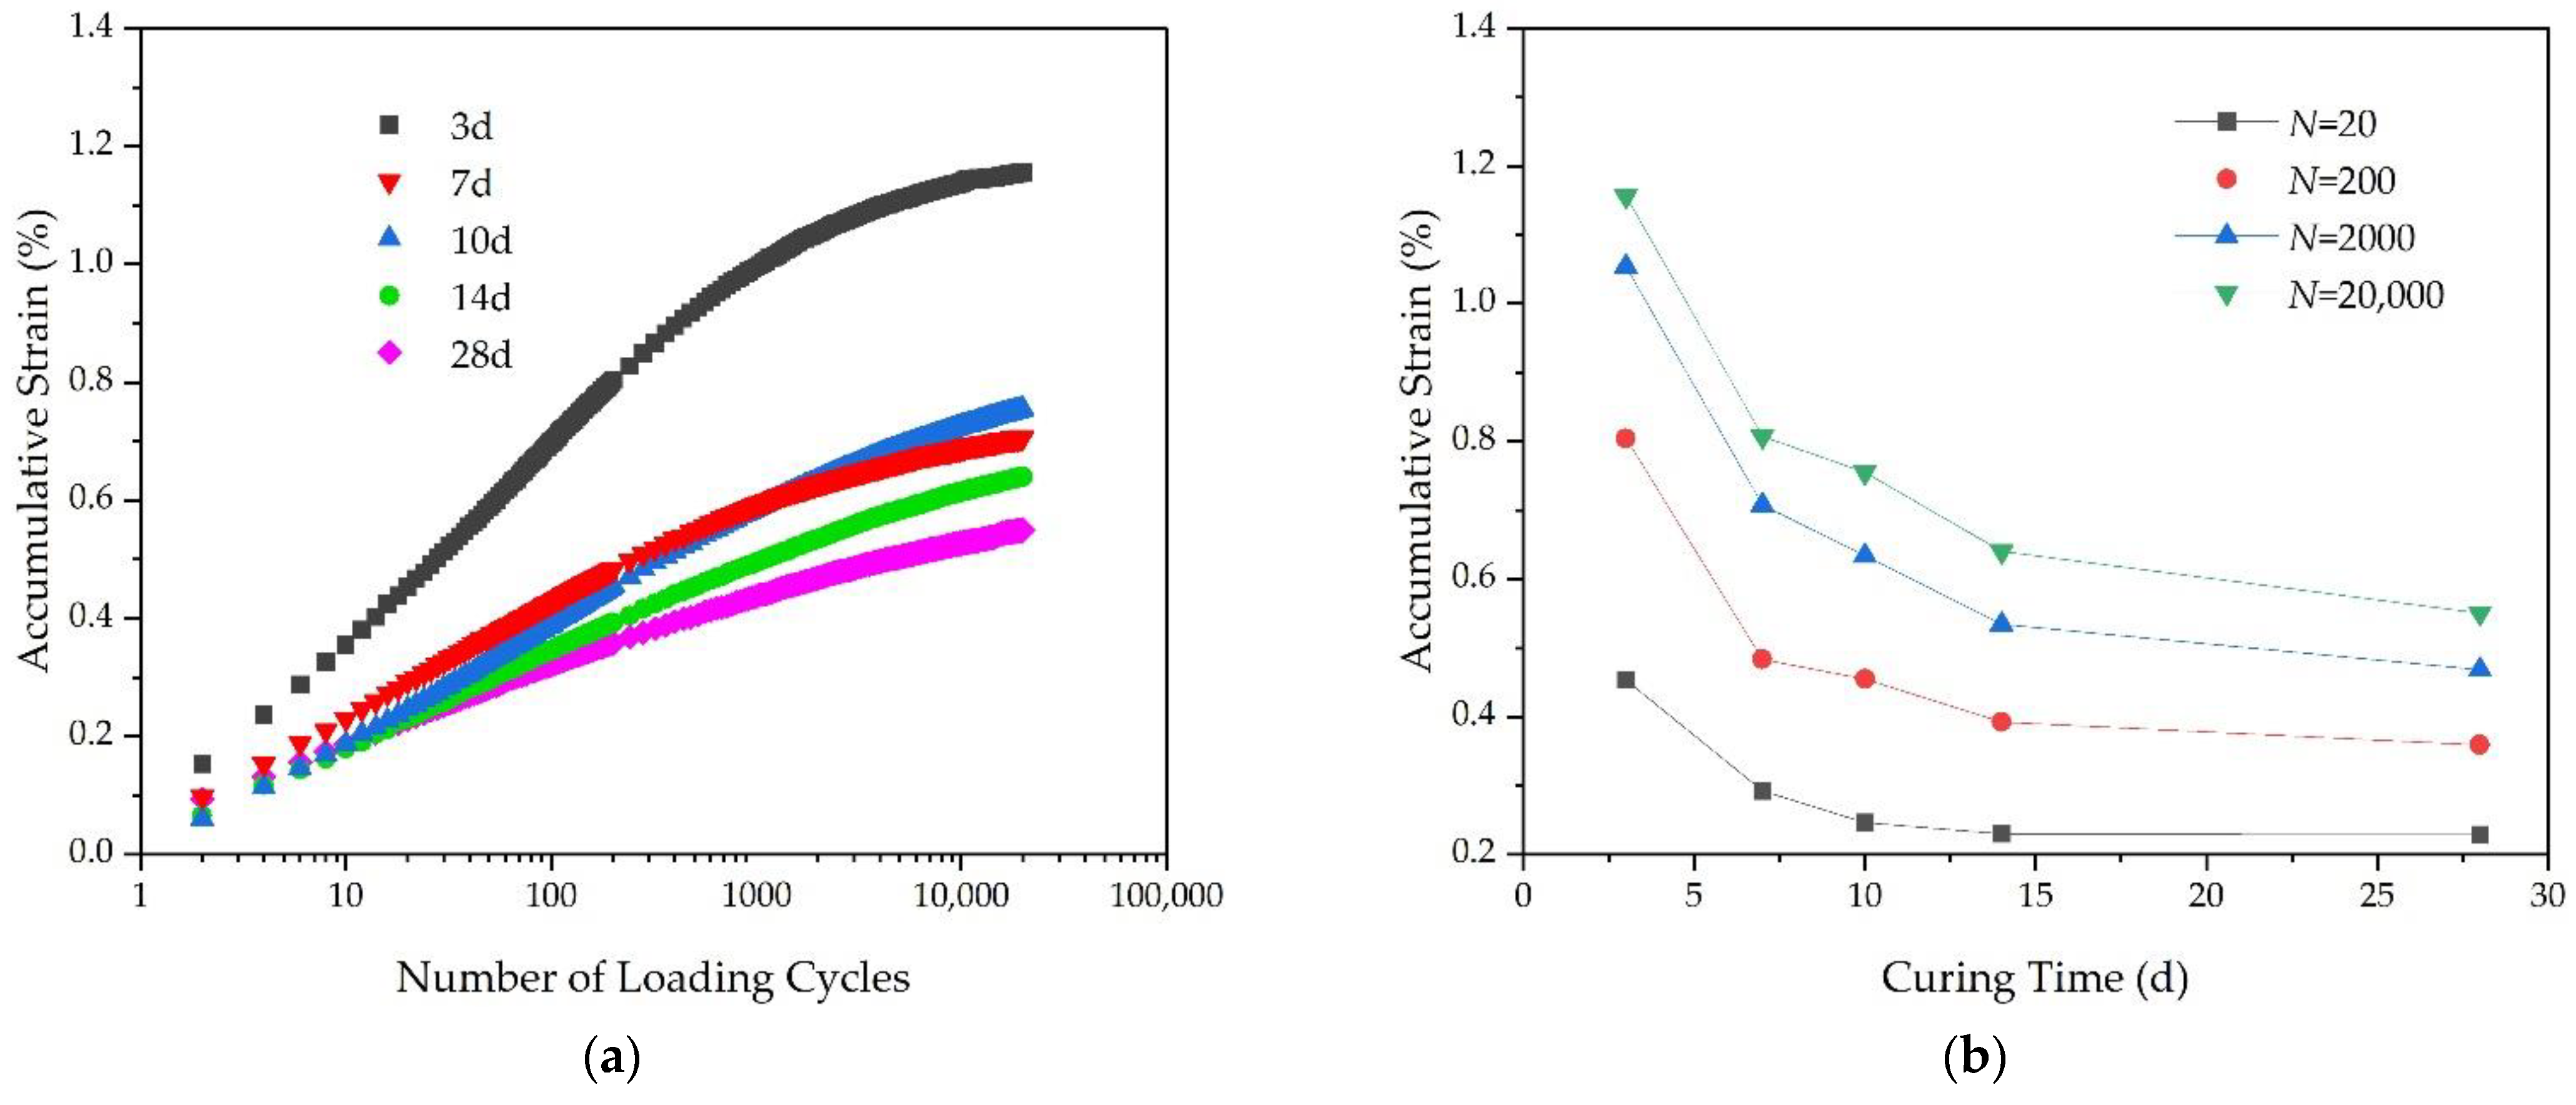
3.5. Influence of Curing Time on Accumulative Strain

In order to investigate the influence of curing time on the accumulative strain, five tests with different curing times (3 d, 7 d, 10 d, 14 d, and 28 d) were performed. The effect of curing time on the relationship between the accumulative strain and number of loading cycles is indicated by Figure 10. As presented in Figure 10a, a general conclusion that curing time has a significant effect on accumulative strain has been accepted. It is quite clear that for a given number of loading cycles, the shorter the curing time is, the greater the accumulative strain is. As shown in Figure 10b, it is obvious that when the curing time is greater than 7 d, the accumulative strain exhibits an almost decreasing trend linearly with increasing curing time. When the number of loading cycles is 20, the accumulative strain decreases from 0.45% to 0.22% as the curing time increases from 3 d to 28 d. The results may be due to the fact that a longer curing time is a benefit to a full reaction of cement, anhydrous sodium silicate, and water in soil, and the cementation between soil particles becomes extraordinarily strong.

4. Accumulative Strain Model

4.1. Improved Barksdale Model

The Barksdale model [46,47,48], which can be described by Equation (2), is frequently used to describe the accumulative strain of soil.
ε = A + B log N
Unfortunately, it should be noted that the Barksdale model is not suitable for the description of experimental data in this study, as presented in Figure 11.
In order to describe the accumulative strain accurately, the Barksdale model needs to be improved. It is assumed that the accumulative strain model can be expressed by second order polynomials. In this study, based on the Barksdale model, the improved model can be written as Equation (3):
ε = A + B log N + C ( log N ) 2

4.2. Model Calibration

For the calibration of the improved model which is proposed in the current study, the comparison of test data and the calculated results of the improved model is shown in Figure 12 and the improved model parameters are listed in Table 4. As presented in Figure 12, the calculated results of the improved model are in good agreement with laboratory data. Hence, the improved model that is proposed in this paper can better describe the characteristic of accumulative strain.

5. Conclusions

In order to investigate the accumulative strain of sand-containing soft soil reinforced by cement and sodium silicate under traffic loading accurately, a series of cyclic triaxial tests in the laboratory were performed. Furthermore, the accumulative strain model was proposed in this study. Based on the test data, the following conclusions can be drawn:
(1)
For a given number of loading cycles, the accumulative strain of the specimen with a low sand content (10%) is about half of that of the specimen with a high sand content (35%). When cement content is greater than 12%, the accumulative strain changes slightly with the increasing cement content. It becomes clear that for a given number of loading cycles, the accumulative strain of the specimen with larger confining pressures is smaller.
(2)
When the number of loading cycles is equal to 2000, the accumulative strain increases from 0.25% to 1.01%, which means a 300 percent growth as the repeated cyclic stress amplitude increases from 0.124 kN to 0.25 kN. It is obvious that when the curing time is greater than 7 d, the accumulative strain exhibits an almost decreasing trend linearly with increasing curing time.
(3)
The accumulative strain model is proposed based on experiment data. The calculated results of the accumulative strain model agree reasonably well with experimental data. Hence, the accumulative strain model can better describe the characteristic of accumulative strain.

Author Contributions

Conceptualization, L.A.; data curation, P.L.; formal analysis, L.A.; investigation, G.C.; methodology, J.C.; resources, J.C.; software, L.G.; validation, D.L.; writing—original draft, L.A. All authors have read and agreed to the published version of the manuscript.

Funding

This research was funded by (1) the Key Laboratory of Underground Engineering, Fujian Province University (Fujian University of Technology), grant number KF-T19012; (2) Jiangxi Provincial Natural Science Foundation (No. 20202BABL204052 and No. 20202BABL214047); (3) Doctoral Natural Science Foundation of East China University of Technology (No. DHBK2019229 and No. DHBK2019243).

Institutional Review Board Statement

Not applicable.

Informed Consent Statement

Not applicable.

Data Availability Statement

Not applicable.

Acknowledgments

The authors gratefully thank the anonymous reviewers for their constructive comments on improving the presentation. All authors have agreed to the listing of authors.

Conflicts of Interest

The authors declare no conflict of interest.

References

  1. Liu, H.; Zhao, J.; Wang, Y.; Yi, N.; Cui, C. Strength Performance and Microstructure of Calcium Sulfoaluminate Cement-Stabilized Soft Soil. Sustainability 2021, 13, 2295. [Google Scholar] [CrossRef]
  2. Wang, X.; Wang, X.; Yang, G.; Pu, C.; Jin, J. Field Test on Deformation Characteristics of Pile-Supported Reinforced Embankment in Soft Soil Foundation. Sustainability 2022, 14, 7805. [Google Scholar] [CrossRef]
  3. Dai, C.X.; Zhang, Q.F.; He, S.H.; Zhang, A.; Shan, H.F.; Xia, T.D. Variation in Micro-Pores during Dynamic Consolidation and Compression of Soft Marine Soil. J. Mar. Sci. Eng. 2021, 9, 750. [Google Scholar] [CrossRef]
  4. Azijul, I.M.; Sahadat, H.M.; Fahim, B.F.; Prabesh, B. Numerical Study of Recycled-Plastic-Pin- and Geosynthetic-Platform-Supported Embankment over Soft Soil. Transport. Res. Rec. 2022, 2676, 159–171. [Google Scholar]
  5. Oliveira, P.J.V.; Santos, S.L.; Correia, A.A.S.; Lemos, L.J.L. Numerical Prediction of the Creep Behaviour of an Embankment Built on Soft Soils Subjected to Preloading. Comput. Geotech. 2019, 114, 103140. [Google Scholar] [CrossRef]
  6. Ghosh, B.; Fatahi, B.; Khabbaz, H.; Khabbaz, H.; Yin, J.H. Analytical Study for Double-Layer Geosynthetic Reinforced Load Transfer Platform on Column Improved Soft Soil. Geotext. Geomembr. 2017, 45, 508–536. [Google Scholar] [CrossRef] [Green Version]
  7. Cristelo, N.; Cunha, V.; Gomes, A.T.; Araújo, N.; Miranda, T.; Lopes, M.L. Influence of Fiber Reinforcement on the Post-Cracking Behaviour of a Cement-Stabilised Sandy-Clay Subjected to Indirect Tensile Stress. Constr. Build. Mater. 2017, 138, 163–173. [Google Scholar] [CrossRef] [Green Version]
  8. Chen, X.; Zhang, J.; Li, Z. Shear Behaviour of a Geogrid-Reinforced Coarse-Grained Soil Based on Large-Scale Triaxial Tests. Geotext. Geomembr. 2014, 42, 312–328. [Google Scholar] [CrossRef]
  9. Liang, S.; Chen, J.; Guo, M.; Feng, D.; Liu, L.; Qi, T. Utilization of Pretreated Municipal Solid Waste Incineration Fly Ash for Cement-Stabilized Soil. Waste Manag. 2020, 105, 425–432. [Google Scholar] [CrossRef]
  10. Chowdary, V.B.; Ramanamurty, V.; Pillai, R.J. Experimental Evaluation of Strength and Durability Characteristics of Geopolymer Stabilised Soft Soil for Deep Mixing Applications. Innov. Infrastruct. Solut. 2021, 6, 40. [Google Scholar] [CrossRef]
  11. Chen, R.; Zhu, Y.; Lai, H.P.; Bao, W.X. Stabilization of Soft Soil Using Low-Carbon Alkali-Activated Binder. Environ. Earth Sci. 2020, 79, 510. [Google Scholar] [CrossRef]
  12. Liu, J.; Hou, T.; Luo, Y.; Cui, Y. Experimental Study on Unconsolidated Undrained Shear Strength Characteristics of Synthetic Cotton Fiber Reinforced Soil. Geotech. Geol. Eng. 2020, 38, 1773–1783. [Google Scholar] [CrossRef]
  13. Anggraini, V.; Asadi, A.; Huat, B.B.K.; Nahazanan, H. Effects of Coir Fibers on Tensile and Compressive Strength of Lime Treated Soft Soil. Measurement 2015, 59, 372–381. [Google Scholar] [CrossRef]
  14. Liu, C.; Lv, Y.; Yu, X.; Wu, X. Effects of Freeze-Thaw Cycles on the Unconfined Compressive Strength of Straw Fiber-Reinforced Soil. Geotext. Geomembr. 2020, 48, 581–590. [Google Scholar] [CrossRef]
  15. Wu, Y.; Li, Y.; Niu, B. Assessment of the Mechanical Properties of Sisal Fiber-Reinforced Silty Clay Using Triaxial Shear Tests. Sci. World J. 2014, 2014, 436231. [Google Scholar] [CrossRef] [Green Version]
  16. Abdi, M.R.; Arjomand, M.A. Pullout Tests Conducted on Clay Reinforced with Geogrid Encapsulated in Thin Layers of Sand. Geotext. Geomembr. 2011, 29, 588–595. [Google Scholar] [CrossRef]
  17. Tang, C.; Shi, B.; Cui, Y.; Liu, C.; Gu, K. Desiccation Cracking Behavior of Polypropylene Fiber-Reinforced Clayey Soil. Can. Geotech. J. 2012, 49, 1088–1101. [Google Scholar] [CrossRef]
  18. Ekinci, A.; Abki, A.; Mirzababaei, M. Parameters Controlling Strength, Stiffness and Durability of a Fiber-Reinforced Clay. Int. J. Geosynth. Ground Eng. 2022, 8, 6. [Google Scholar] [CrossRef]
  19. Gao, L.; Hu, G.; Xu, N.; Fu, J.; Xiang, C.; Yang, C. Experimental Study on Unconfined Compressive Strength of Basalt Fiber Reinforced Clay Soil. Adv. Mater. Sci. Eng. 2015, 2015, 561293. [Google Scholar] [CrossRef] [Green Version]
  20. Sukontasukkul, P.; Jamsawang, P. Use of Steel and Polypropylene Fibers to Improve Flexural Performance of Deep Soil-Cement Column. Constr. Build. Mater. 2012, 29, 201–205. [Google Scholar] [CrossRef]
  21. Zhou, N.; Ouyang, S.; Cheng, Q.; Ju, F. Experimental Study on Mechanical Behavior of a New Backfilling Material: Cement-Treated Marine Clay. Adv. Mater. Sci. Eng. 2019, 2019, 1261694. [Google Scholar] [CrossRef]
  22. Fatahi, B.; Khabbaz, H.; Fatahi, B. Mechanical Characteristics of Soft Clay Treated with Fiber and Cement. Geosynth. Int. 2012, 19, 252–262. [Google Scholar] [CrossRef] [Green Version]
  23. Horpibulsuk, S.; Rachan, R.; Suddeepong, A. Assessment of Strength Development in Blended Cement Admixed Bangkok Clay. Constr. Build. Mater. 2011, 25, 1521–1531. [Google Scholar] [CrossRef]
  24. Furlan, A.P.; Razakamanantsoa, A.; Ranaivomanana, H.; Amiri, O.; Levacher, D.; Deneele, D. Effect of Fly Ash on Microstructural and Resistance Characteristics of Dredged Sediment Stabilized with Lime and Cement. Constr. Build. Mater. 2021, 272, 121637. [Google Scholar] [CrossRef]
  25. Jayalin, D.; Vellingiri, N.; Raman, S.J. Experimental Research on Durability Properties of High Volume Fly Ash Concrete with Polypropylene Fibre. IJITEE 2019, 8, 1039–1042. [Google Scholar]
  26. Jamsawang, P.; Voottipruex, P.; Horpibulsuk, S. Flexural Strength Characteristics of Compacted Cement-Polypropylene Fiber Sand. J. Mater. Civ. Eng. 2015, 27, 04014243. [Google Scholar] [CrossRef]
  27. Yang, Q.; Ren, Y.; Niu, J.; Cheng, K.; Hu, Y.; Wang, Y. Characteristics of Soft Marine Clay under Cyclic Loading: A Review. Bull. Eng. Geol. Environ. 2018, 77, 1027–1046. [Google Scholar] [CrossRef]
  28. Silveira, M.R.; Lodi, P.C.; Correia, N.S.; Rodrigues, R.A.; Giacheti, H.L. Effect of Recycled Polyethylene Terephthalate Strips on the Mechanical Properties of Cement-Treated Lateritic Sandy Soil. Sustainability 2020, 12, 9801. [Google Scholar] [CrossRef]
  29. Ho, T.O.; Chen, W.B.; Yin, J.H.; Amiri, O.; Wu, P.C.; Tsang, D.C.W. Stress-Strain Behaviour of Cement-Stabilized Hong Kong marine deposits. Constr. Build. Mater. 2021, 274, 122103. [Google Scholar] [CrossRef]
  30. Wu, J.; Liu, L.; Deng, Y.; Zhang, G.; Zhou, A.; Wang, Q. Distinguishing the Effects of Cementation versus Density on the Mechanical Behavior of Cement-Based Stabilized Clays. Constr. Build. Mater. 2021, 271, 121571. [Google Scholar] [CrossRef]
  31. Eskisar, T.; Altun, S.; Kalipcilar, I. Assessment of Strength Development and Freeze-Thaw Performance of Cement Treated Clays at Different Water Contents. Cold. Reg. Sci. Technol. 2015, 111, 50–59. [Google Scholar] [CrossRef]
  32. Tang, C.; Shi, B.; Gao, W.; Chen, F.; Cai, Y. Strength and Mechanical Behavior of Short Polypropylene Fiber Reinforced and Cement Stabilized Clayey Soil. Geotext. Geomembr. 2007, 25, 194–202. [Google Scholar] [CrossRef]
  33. Cristelo, N.; Glendinning, S.; Fernandes, L.; Pinto, A.T. Effects of Alkaline-Activated Fly Ash and Portland Cement on Soft Soil Stabilisation. Acta. Geotech. 2013, 8, 395–405. [Google Scholar] [CrossRef]
  34. Wang, Q.; Tang, A.M.; Cui, Y.J.; Delage, P.; Barnichon, J.D.; Ye, W.M. The Effects of Technological Voids on the Hydro-Mechanical Behavior of Compacted Bentonite-Sand Mixture. Soils Found. 2013, 53, 232–245. [Google Scholar] [CrossRef]
  35. Li, T.; Tang, X. Influences of Low Fines Content and Fines Mixing Ratio on the Undrained Static Shear Strength of Sand-Silt-Clay Mixtures. Earthq. Eng. Eng. Vib. 2019, 18, 487–496. [Google Scholar] [CrossRef]
  36. Watabe, Y.; Yamada, K.; Saitoh, K. Hydraulic Conductivity and Compressibility of Mixtures of Nagoya Clay with Sand or Bentonite. Geotechnique 2011, 61, 211–219. [Google Scholar] [CrossRef]
  37. Karakan, E.; Shimobe, S.; Sezer, A. Effect of Clay Fraction and Mineralogy on Fall Cone Results of Clay-Sand Mixtures. Eng. Geol. 2020, 279, 105887. [Google Scholar] [CrossRef]
  38. Yu, J.; Sun, M.; He, S.; Huang, X.; Wu, X.; Liu, L. Accumulative Deformation Characteristics and Microstructure of Saturated Soft Clay under Cross-River Subway Loading. Materials 2021, 14, 537. [Google Scholar] [CrossRef]
  39. Kong, B.; Dai, C.X.; Hu, H.; Xia, J.; He, S.H. The Fractal Characteristics of Soft Soil under Cyclic Loading Based on SEM. Fractal Fract. 2022, 6, 423. [Google Scholar] [CrossRef]
  40. An, L.; Zhang, F.; Geng, Y.; Lin, B. Field Measurement of Dynamic Compressive Stress Response of Pavement-Subgrade Induced by Moving Heavy-Duty Trucks. Shock Vib. 2018, 2018, 1956906. [Google Scholar] [CrossRef] [Green Version]
  41. Dai, D.; Peng, J.; Bai, L.; Li, G.; Lin, H. The Effect of Superabsorbent Polymer on the Resilient and Plastic Strain Behavior of Cemented Soil under Traffic Load. Polymers 2022, 14, 929. [Google Scholar] [CrossRef] [PubMed]
  42. Guo, L.; Wang, J.; Cai, Y.; Liu, H.; Gao, Y.; Sun, H. Undrained Deformation Behavior of Saturated Soft Clay under Long-Term Cyclic Loading. Soil Dyn. Earthq. Eng. 2013, 50, 28–37. [Google Scholar] [CrossRef]
  43. Jaffar, S.T.A.; Muneeb Abid, M.; Khan, S.Z.; Jafri, T.; Rehman, Z.U.; Tariq, M.A.U.R.; Ng, A.W.M. Evaluation of Conventional and Sustainable Modifiers to Improve the Stiffness Behavior of Weak Sub-Grade Soil. Sustainability 2022, 14, 2493. [Google Scholar] [CrossRef]
  44. Yang, J.; Cui, Z. Influences of Train Speed on Permanent Deformation of Saturated Soft Soil under Partial Drainage Conditions. Soil Dyn. Earthq. Eng. 2020, 133, 106120. [Google Scholar] [CrossRef]
  45. Sun, L. Strain Accumulation in Soft Marine Clay due to One-Way Cyclic Load with Variable Confining Pressure. Adv. Civ. Eng. 2021, 2021, 6624270. [Google Scholar] [CrossRef]
  46. Barksdale, R.D. Laboratory evaluation of rutting in base course materials. In Proceedings of the 3rd International Conference on the Structural Design of Asphalt Pavement, London, UK, 11–15 September 1972. [Google Scholar]
  47. Ling, X.Z.; Li, P.; Zhang, F.; Zhao, Y.Y.; Li, Y.; An, L. Permanent Deformation Characteristics of Coarse Grained Subgrade Soils under Train-Induced Repeated Load. Adv. Mater. Sci. Eng. 2018, 2017, 6241479. [Google Scholar] [CrossRef] [Green Version]
  48. Li, N.; Wang, X.; Qiao, R.; Ma, B.; Shao, Z.; Sun, W.; Wang, H. A Prediction Model of Permanent Strain of Unbound Gravel Materials Based on Performance of Single-Size Gravels Under Repeated Loads. Constr. Build. Mater. 2020, 246, 118492. [Google Scholar] [CrossRef]
Figure 1. The sand used in the present study.
Sustainability 14 14127 g001
Figure 2. The grain size distribution curve of sand.
Sustainability 14 14127 g002
Figure 3. The GDS triaxial testing system.
Sustainability 14 14127 g003
Figure 4. The specimen preparation procedure: (a) the oven; (b) the specimen; (c) the curing box.
Sustainability 14 14127 g004
Figure 5. Test procedures: (a) workflow of experiment; (b) load-on pattern of cyclic loading.
Sustainability 14 14127 g005
Figure 6. The effect of sand content on the relationship between accumulative strain and the number of loading cycles: (a) the effect of sand content on the accumulative strain; (b) the accumulative strain for a given number of loading cycles.
Sustainability 14 14127 g006
Figure 7. The effect of the cement content on the relationship between the accumulative strain and number of loading cycles: (a) the effect of cement content on the accumulative strain; (b) the accumulative strain for a given number of loading cycles.
Sustainability 14 14127 g007
Figure 8. The effect of confining pressure on the relationship between the accumulative strain and number of loading cycles: (a) the effect of confining pressure on the accumulative strain; (b) the accumulative strain for a given number of loading cycles.
Sustainability 14 14127 g008
Figure 9. The effect of repeated cyclic stress amplitude on the relationship between the accumulative strain and number of loading cycles: (a) the effect of repeated cyclic stress amplitude on the accumulative strain; (b) the accumulative strain for a given number of loading cycles.
Sustainability 14 14127 g009
Figure 10. The effect of curing time on the relationship between the accumulative strain and number of loading cycles: (a) the effect of curing time on the accumulative strain; (b) the accumulative strain for a given number of loading cycles.
Sustainability 14 14127 g010
Figure 11. The comparison of test data and calculated results of Barksdale model.
Sustainability 14 14127 g011
Figure 12. The calibration of the improved model: (a) B1-B6; (b) B7-B12; (c) B13-B17; (d) B18-B23; (e) B24-B29.
Sustainability 14 14127 g012
Table 1. Other physical indices of soft soil.
Moisture Content
(%)
Dry Density
(g/cm3)
Liquid Limit
(%)
Plastic Limit
(%)
43.511.2641.326.8
Table 2. The basic indexes of cement.
Setting Time (min)Flexural Strength (MPa)Compressive Strength (MPa)
Initial SetFinal Set3 d7 d3 d28 d
180240471838
Table 3. Details of experimental scheme.
Sample
Number
Confining Pressure
(kPa)
Repeated
Load
(kN)
Curing
Time
(d)
Cement
Content
(%)
Sand
Content
(%)
B1500.12414910
B2100
B3150
B4200
B5250
B6300
B71000.12414910
B80.15
B90.17
B100.19
B110.22
B120.25
B131000.1243910
B147
B1510
B1614
B1728
B181000.12414310
B196
B209
B2112
B2215
B2318
B241000.12414910
B2515
B2620
B2725
B2830
B2935
Table 4. The improved model parameters.
Sample NumberABCR2 (COD)
B10.046850.15902−0.011410.9991
B20.011760.14408−0.011950.99974
B30.017870.07905−0.001440.99811
B4−0.002710.09322−0.006090.99952
B5−0.042510.10389−0.006470.99784
B6−0.019730.07951−0.002550.99947
B7−0.00270.11319−0.009920.99997
B80.011760.14408−0.011950.99974
B9−0.057540.18857−0.01460.99695
B100.047110.27178−0.026550.99897
B11−0.032310.36811−0.035760.99982
B12−0.067070.51091−0.051740.99951
B130.075310.16576−0.011740.99969
B140.035740.20807−0.014040.99943
B15−0.006150.2724−0.020260.99853
B160.047110.27178−0.026550.99897
B17−0.002670.51746−0.056560.99634
B18−0.247641.39872−0.168620.99838
B19−0.032370.30903−0.033910.99927
B20−0.00270.11319−0.009920.99997
B21−0.00120.05935−0.003050.99961
B220.002340.05959−0.004030.99938
B23−0.011690.07607−0.007940.99951
B24−0.057540.18857−0.01460.99695
B25−0.02690.18047−0.012320.99939
B26−0.045360.20584−0.015270.99858
B27−0.052660.19497−0.008440.99809
B28−0.036360.25439−0.019680.99931
B29−0.107880.37788−0.030250.99735
Publisher’s Note: MDPI stays neutral with regard to jurisdictional claims in published maps and institutional affiliations.

