Article

A New Hybrid Model for Mapping Spatial Accessibility to Healthcare Services Using Machine Learning Methods

by
Ali Khosravi Kazazi
1,
Fariba Amiri
2,
Yaser Rahmani
3,
Raheleh Samouei
4 and
Hamidreza Rabiei-Dastjerdi
4,5,*
1
Department of Surveying Engineering, Shahid Rajaee Teacher Training University, Tehran 16788-15811, Iran
2
Department of Computer Engineering, Shariati Technical and Vocational College, Tehran 16851-18918, Iran
3
Department of Electrical and Computer Engineering, University of Utah, Salt Lake City, UT 84112, USA
4
Social Determinants of Health Research Center, Isfahan University of Medical Sciences, Isfahan 81746-73461, Iran
5
School of Architecture, Planning and Environmental Policy & CeADAR (Ireland’s National Centre for Applied Data Analytics & AI), University College Dublin (UCD), Belfield, D14 E099 Dublin, Ireland
*
Author to whom correspondence should be addressed.
Sustainability 2022, 14(21), 14106; https://doi.org/10.3390/su142114106
Submission received: 27 September 2022 / Revised: 25 October 2022 / Accepted: 26 October 2022 / Published: 28 October 2022

Abstract

:
The unequal distribution of healthcare services is the main obstacle to achieving health equity and sustainable development goals. Spatial accessibility to healthcare services is an area of interest for health planners and policymakers. In this study, we focus on the spatial accessibility to four different types of healthcare services, including hospitals, pharmacies, clinics, and medical laboratories at Isfahan’s census blocks level, in a multivariate study. Regarding the nature of spatial accessibility, machine learning unsupervised clustering methods are utilized to analyze the spatial accessibility in the city. Initially, the study area was grouped into five clusters using three unsupervised clustering methods: K-Means, agglomerative, and bisecting K-Means. Then, the intersection of the results of the methods is considered to be conclusive evidence. Finally, using the conclusive evidence, a supervised clustering method, KNN, was applied to generate the map of the spatial accessibility situation in the study area. The findings of this study show that 47%, 22%, and 31% of city blocks in the study area have rich, medium, and poor spatial accessibility, respectively. Additionally, according to the study results, the healthcare services development is structured in a linear pattern along a historical avenue, Chaharbagh. Although the scope of this study was limited in terms of the supply and demand rates, this work gives more information and spatial insights for researchers, planners, and policymakers aiming to improve accessibility to healthcare and sustainable urban development. As a recommendation for further research work, it is suggested that other influencing factors, such as the demand and supply rates, should be integrated into the method.

1. Introduction

Health equity is an essential cornerstone of social justice [1,2]. The fact is that healthcare services are often scanty, heterogeneously distributed, and costly [3]. The issues that prevent health equity have a social, economic, ethical, cultural, or environmental nature [4]. Accessibility to healthcare services is a multifaceted barrier to achieving health equity. An accessible healthcare facility offers the opportunity for health maintenance and disease treatment [5]. Therefore, in recent years, understanding the healthcare accessibility situation has gained attraction, especially among health and urban policymakers.
Accessibility, the ease of reaching destinations, is a function of non-spatial and spatial factors [6]. Non-spatial factors are affordability (i.e., health spending), acceptability (i.e., health service compliance and satisfaction), and accommodation (i.e., suitability of healthcare services) [7]. Spatial factors are availability (i.e., the number of local services from which a client can choose) and spatial accessibility (i.e., travel impedance (distance or time) between a patient location and services) [8,9].
In Isfahan, one of the major cities in Iran, the development of healthcare services has not paralleled the spatial and demographic population growth [10]. To our knowledge, few studies investigated the spatial accessibility situation in Isfahan [11]. However, these studies did not provide enough information on the spatial accessibility of each residential settlement to healthcare services. Today, Machine Learning (ML) algorithms are widely used for clustering untagged data. Thus, this study will evaluate the spatial accessibility to healthcare in Isfahan, Iran, at the city block level using ML methods. This study will provide fresh insights into spatial accessibility to healthcare services since it considers all four healthcare services. Additionally, this work suggests a new framework for the classification of the study area using both unsupervised and supervised ML. Indeed, this study focuses on answering three following main research questions in Isfahan as a case study:
  • What are the drawbacks of current spatial accessibility measures and methods?
  • Are ML methods suitable for mapping spatial accessibility?
  • How is the spatial accessibility to healthcare facilities and services in Isfahan from an ML perspective?
The following section presents a literature review on spatial accessibility measures and methods. Section 3 presents the methods for spatial accessibility measurement in Isfahan. The results and findings of the study can be seen in Section 4. Section 5 provides a discussion of the results. Finally, Section 6 presents the study conclusion.

2. Literature Review and Background
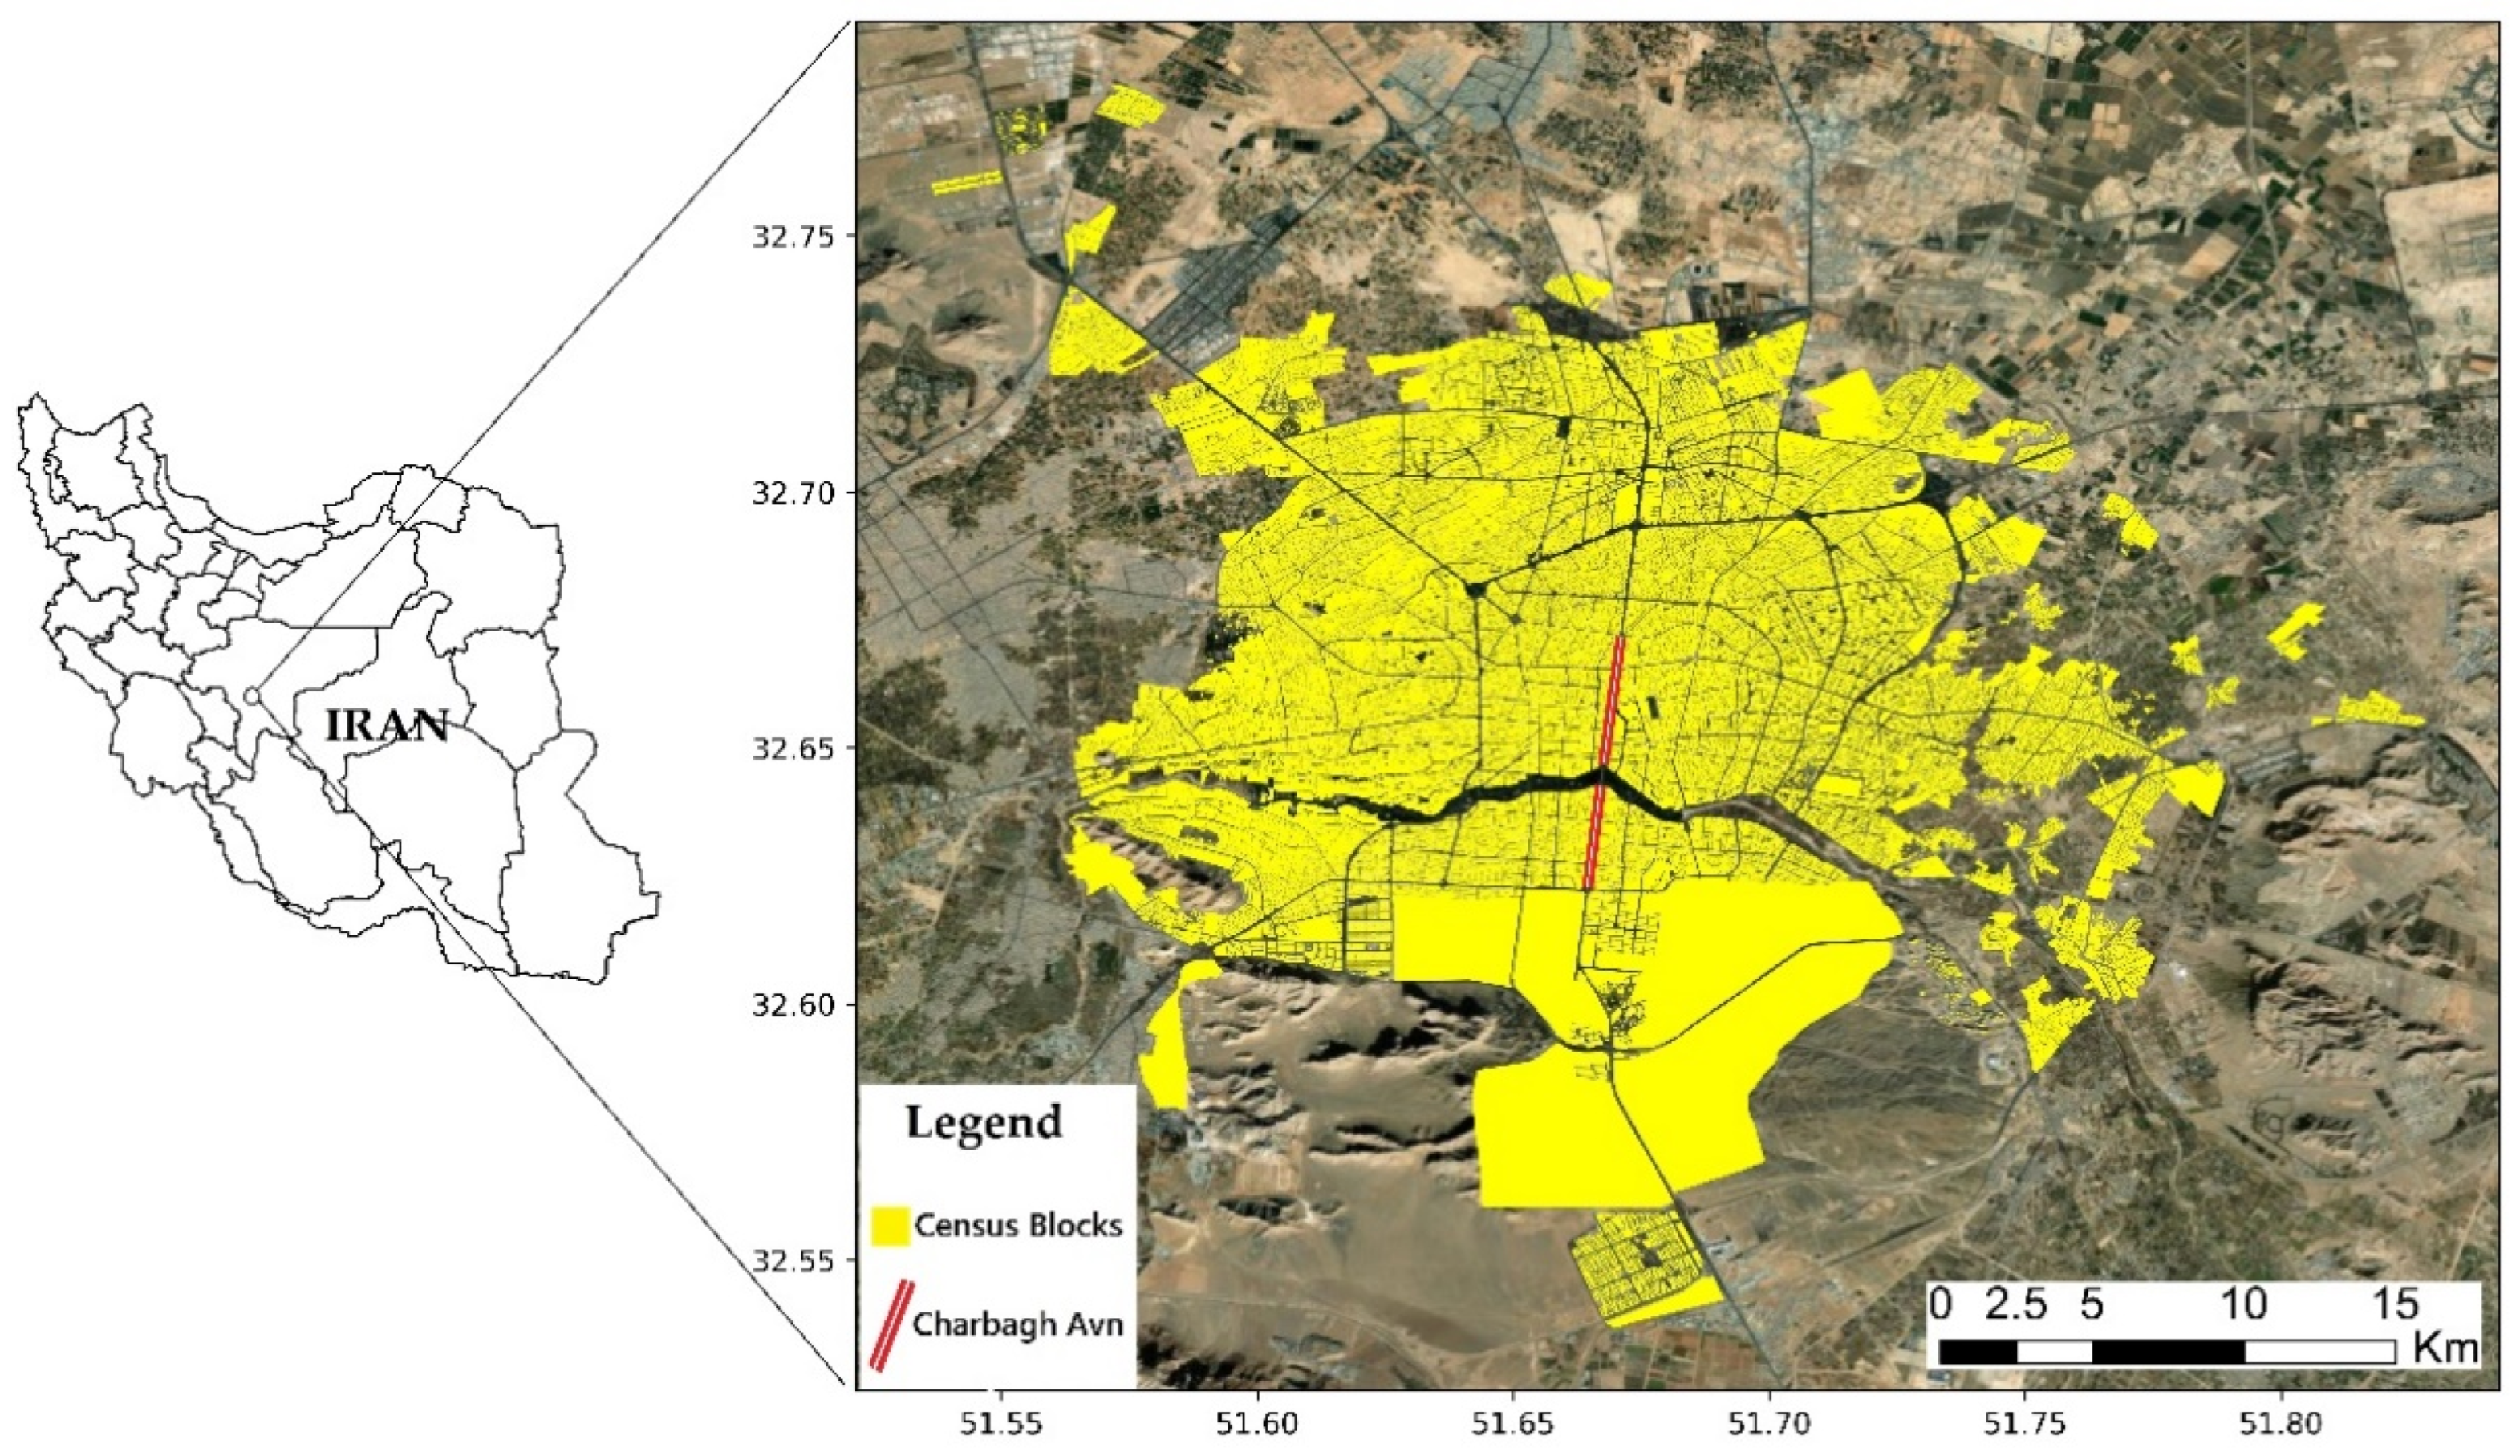
Spatial accessibility refers to the relative ease of reaching the location of facilities and the type, quality, and quantity of activities offered. Glancing through the literature shows that spatial accessibility measurement has absorbed the attention of researchers and policy designation in different fields, such as urban planning and health policy and planning, since it is an essential measure for evaluating equity in opportunities or resources [12]. The multifaceted nature of accessibility has resulted in different spatial accessibility measures. The most intuitive spatial accessibility measure is the provider-to-population ratio [13]. The measure does not explicitly incorporate any measures of impedance between patients and practitioners [14]. Additionally, the Floating Catchment Areas (FCA) method is a traditional measure that calculates spatial accessibility regarding supply, demand, and impedance [15]. In this method, the ratio of providers to clients within a given impedance shows the spatial accessibility for each provider. Another popular and intuitive measure is the travel impedance to the nearest supplier [16]. The measure is considered to be a poor measure since it is only sensitive to the nearest supplier and regardless of other available providers. In addition, access score, a spatial accessibility measure, is a weighted measure; the method is based only on the relative importance of provider type [17]. As previously mentioned, the access score is based only on supply and impedance. Average travel impedance to the provider is an alternative measure [18]. Although it is a composite measure of accessibility and availability, it has a major problem. The providers near the study area boundary inflate the average distance. For example, a provider in the southern part of the city is not significant for northern residents. Gravity models, also named cumulative opportunity measures, are other types of spatial accessibility measurement that consider both accessibility and availability [19]. In addition to being counter-intuitive, it is a limited measure since it only models the supply. Joseph and Bantock suggested an adjustment demand factor to add the demand side into gravity models [20]. The proposed improved model requires an empirical investigation based on the type of urban facility and service and demanders. Besides the classic methods and measures mentioned so far, some relatively new methods exist to address the spatial accessibility problem. Two-step floating catchment area (2SFCA) and its improvements are the most common. 2SFCA, hence the name, is calculated in two steps for a given impedance to the provider [21]. The two most popular 2SFCA improvements are Enhanced 2SFCA [22,23] and Three-Step FCA [24], which deal with some 2SFCA shortcomings. The problem with the methods is that they calculate the spatial accessibility in a specific impedance. At the time of writing, the latest spatial accessibility measure is a rational agent model by Saxon and Snow [25]. Like other recent methods, the problem is that the model shows spatial accessibility in a given impedance.
As mentioned so far, current measures have two significant issues. First, a part of the spatial accessibility measures ignores a spatial accessibility factor. For example, the provider-to-population ratio neglects the spatial impedance, such as travel time between the patient and practitioner [14]. Second, the other measures based on all spatial accessibility factors reveal the spatial accessibility based on a given impedance. In other words, the measures assume that the population is willing to travel within a specific distance or time from their locations [26,27]. The problem becomes significant when a facility is near an impedance boundary but out of the impedance boundary. To illustrate, imagine there are two demand points with the same population. The specific impedance is 5 km. The two demanders have no access to a facility within 5 km, but there is a facility 6 km far from one of the demanders. The demander who can reach a service by taking 6 km has better spatial accessibility than the other. According to existing measures, the two demanders get the same spatial accessibility. The problem comes from the measures assessing the spatial accessibility of a given impedance.
A fixed impedance also makes the comparison between two states or counties a problematic task. Since the impedance between the demanders and facilities is a function of the population willing to travel, the impedance varies from county to county or state to state. Therefore, the results will be something like that: for example, the mean spatial accessibility for state A with a given impedance of 30 min is 0.5 and for state B with a given impedance of 25 min is 0.6. The question here is which state has better spatial accessibility and how a central government can compare the two states regarding spatial accessibility equity. In addition to the problems, the measures usually return different results for a study area. The lack of reliable information to confirm the methods’ results is one of the most significant drawbacks of such studies [28].
Today, ML, an application of artificial intelligence, is well-known in healthcare and accessibility studies [29,30]. ML allows data clustering without being explicitly programmed [31,32]. There are four primary forms of learning for a machine: supervised, unsupervised, semi-supervised, and reinforcement learning [33]. In supervised or semi-supervised learning, a machine learns from a training dataset (tagged data). Reinforcement learning simply works and learns based on reward functions. In detail, the methods require reliable information or a function to approve the results [34]. Unlike the methods, an unsupervised learning method learns patterns from untagged data. Unsupervised learning is training a machine using neither classified nor labeled information and allowing the algorithm to act on that information without guidance [35].
Given that there is no authoritative information on spatial accessibility, the problem is a type of unsupervised learning for a machine. Here, the task of the machine is to group information according to similarities, patterns, and differences without prior training in data. Grouping unlabeled examples are called clustering. This study aims to cluster census blocks in Isfahan based on their spatial distribution (the impedance between blocks and nearest healthcare services).

3. Case Study

The case study is Isfahan, Iran, with an estimated population of around 2.2 million people [36]. Isfahan is one of the largest and most important cities in Iran and is located at the crossroads of the country’s main north–south and east–west routes. Isfahan’s area is about 550 km2, and its height above sea level is 1590 m. The metropolitan area has a 2% increase in population yearly. This area has 31 hospitals, 105 clinics, 86 medical laboratories, and 346 pharmacies. Figure 1 shows the study area location.

4. Data and Methods

4.1. Data

The population information is obtained from the 2016 census blocks, the latest available census survey in Iran [37]. The blocks centroids are considered to be the population centers. Additionally, the healthcare services locations were obtained from different sources, including the ministry of health and medical education data, OpenStreetMap (OSM), and Isfahan municipality. Finally, the OSM street network was utilized to measure the impedance between the blocks and healthcare services. Due to data limitations, this paper cannot provide a view of spatial accessibility in Isfahan, in which the demand and supply rates are considered.

4.2. Methodology

Several methods currently exist for the measurement of spatial accessibility. The data for spatial accessibility measurement is unlabeled. In other words, there is no authoritative information to confirm that a place has good spatial accessibility. Although it is possible to propose standards for evaluating spatial accessibility, the standard must consider several social, economic, and demographic parameters [38].
In this study, ML algorithms that optimized to cluster unlabeled data were utilized [39]. The two most well-known ML methods for unsupervised clustering are distance-based [40] and hierarchical methods [41]. In a distance-based method, clusters are obtained by first defining an appropriate distance measure and then applying an algorithm that assigns observations close to each other to the same cluster. K-Means algorithm is the most common distance-based algorithm [42]. The K-Means clustering algorithm is an iterative process that tries to minimize the distance of the data point from the average data point in the cluster [43]. Hierarchical clustering methods seek to create a hierarchy of clustered data points. The endpoint is a set of clusters where each cluster is distinct from the other cluster, and the objects within each cluster are broadly similar. Agglomerative clustering is the most common type of hierarchical clustering [44]. In addition to the algorithms, there is another hybrid approach between distance-based and hierarchical clustering [45]. The algorithm is a modification of the K-Means algorithm and produces hierarchical clustering named bisecting clustering. Instead of clustering the data into k clusters in each iteration, the algorithm splits one cluster into two sub clusters at each bisecting step (using K-Means) until k clusters are obtained.
In this study, spatial accessibility of the Isfahan blocks to healthcare services was evaluated using a distance-based (K-Means), a hierarchical (agglomerative), and a hybrid method between them (bisecting K-Means) as follows:

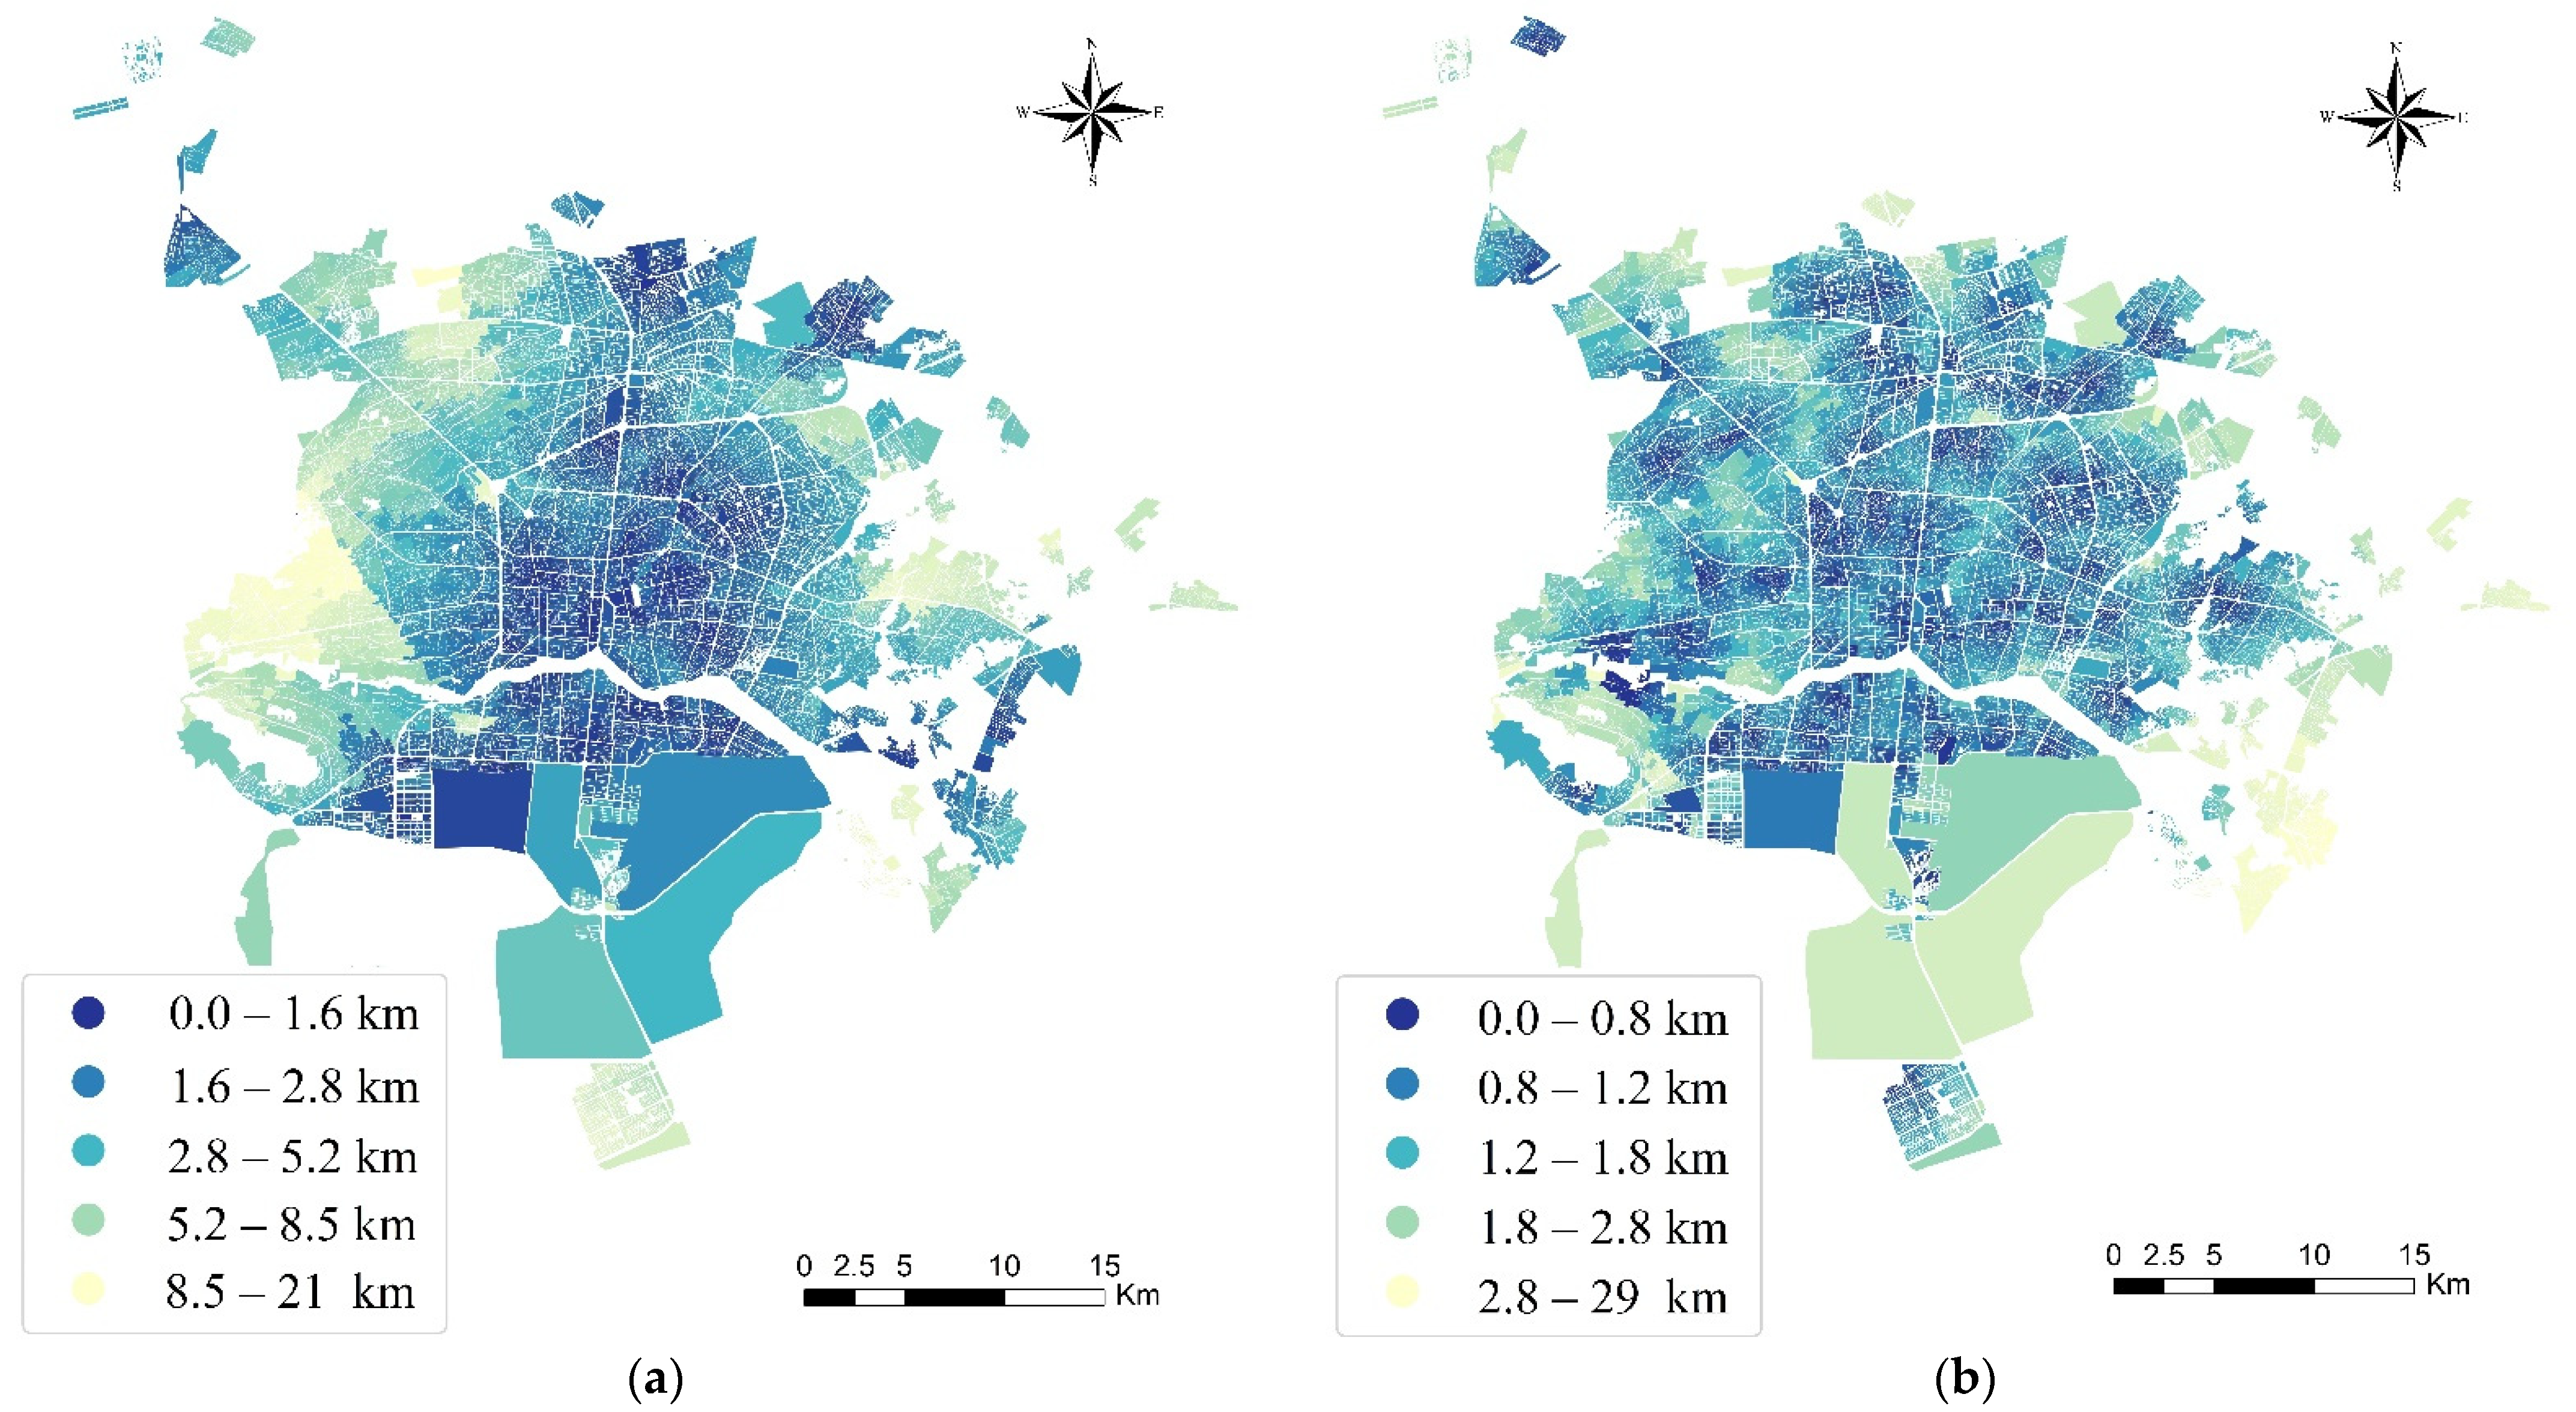
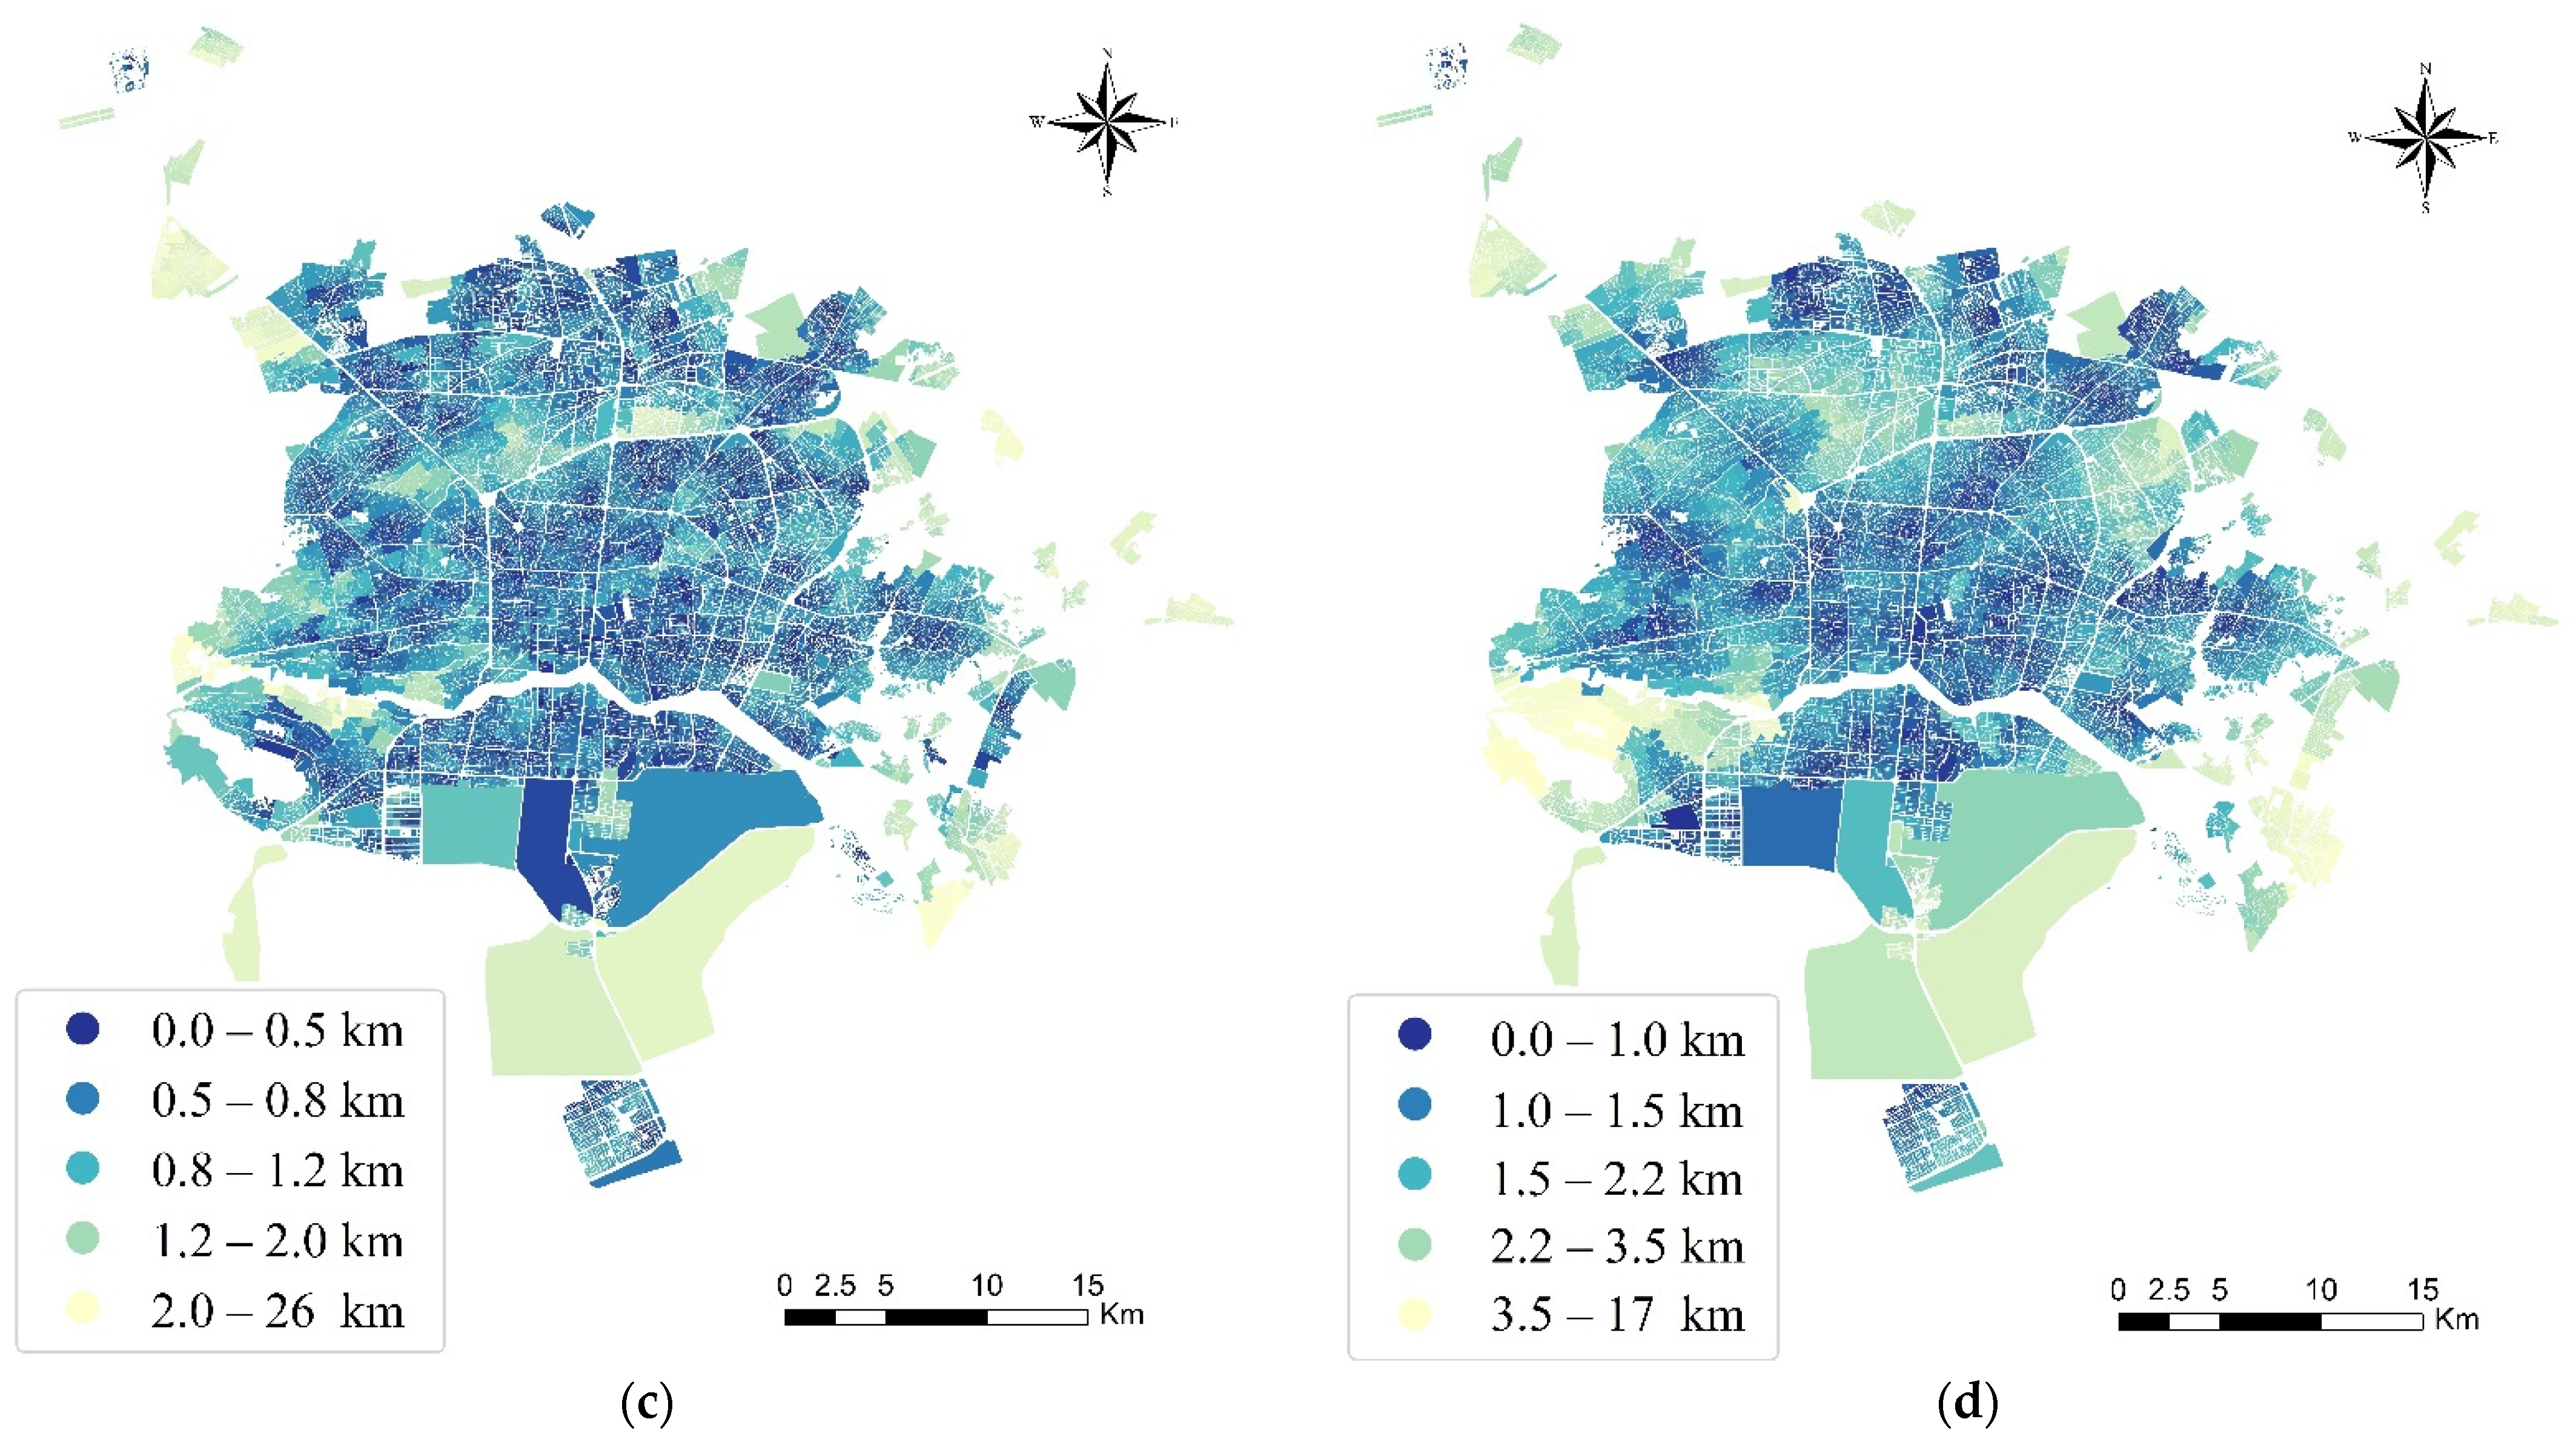
4.2.1. Distance Measurement

The study variables are block center distances to the nearest services. The street network of OSM in Isfahan was utilized to calculate the distances. For each block and healthcare service centroid, the closest node on the street network was obtained, and then the shortest distance between the nodes was calculated using Dijkstra’s algorithm. Dijkstra’s algorithm finds the shortest path between two nodes by building a shortest-path tree and stopping once the destination node has been reached [46]. The method was implemented using the NetworkX package in the Python programming environment [47].

4.2.2. Weighting Variables

Clearly, in a multivariate study, variables have different levels of importance. By calculating the entropy value, the entropy weight method can judge an event’s randomness and dispersion degree. The method measures value dispersion in decision-making. The more dispersion, the more information can be derived. Meanwhile, a higher weight should be given to the factor and vice versa [48].
The entropy by Shannon determines the disorder’s degree and its utility in system information. The greater the entropy value is, the more significant the disorder degree of the system is. The entropy weight method is based on the amount of information to determine the variable’s weight, which is one of the objective fixed weight methods [49]. In this paper, the entropy weighting method is adopted to determine the weight of variables. The entropy weights are calculated in three steps, including normalization, entropy measurement, and weight calculation as follows:

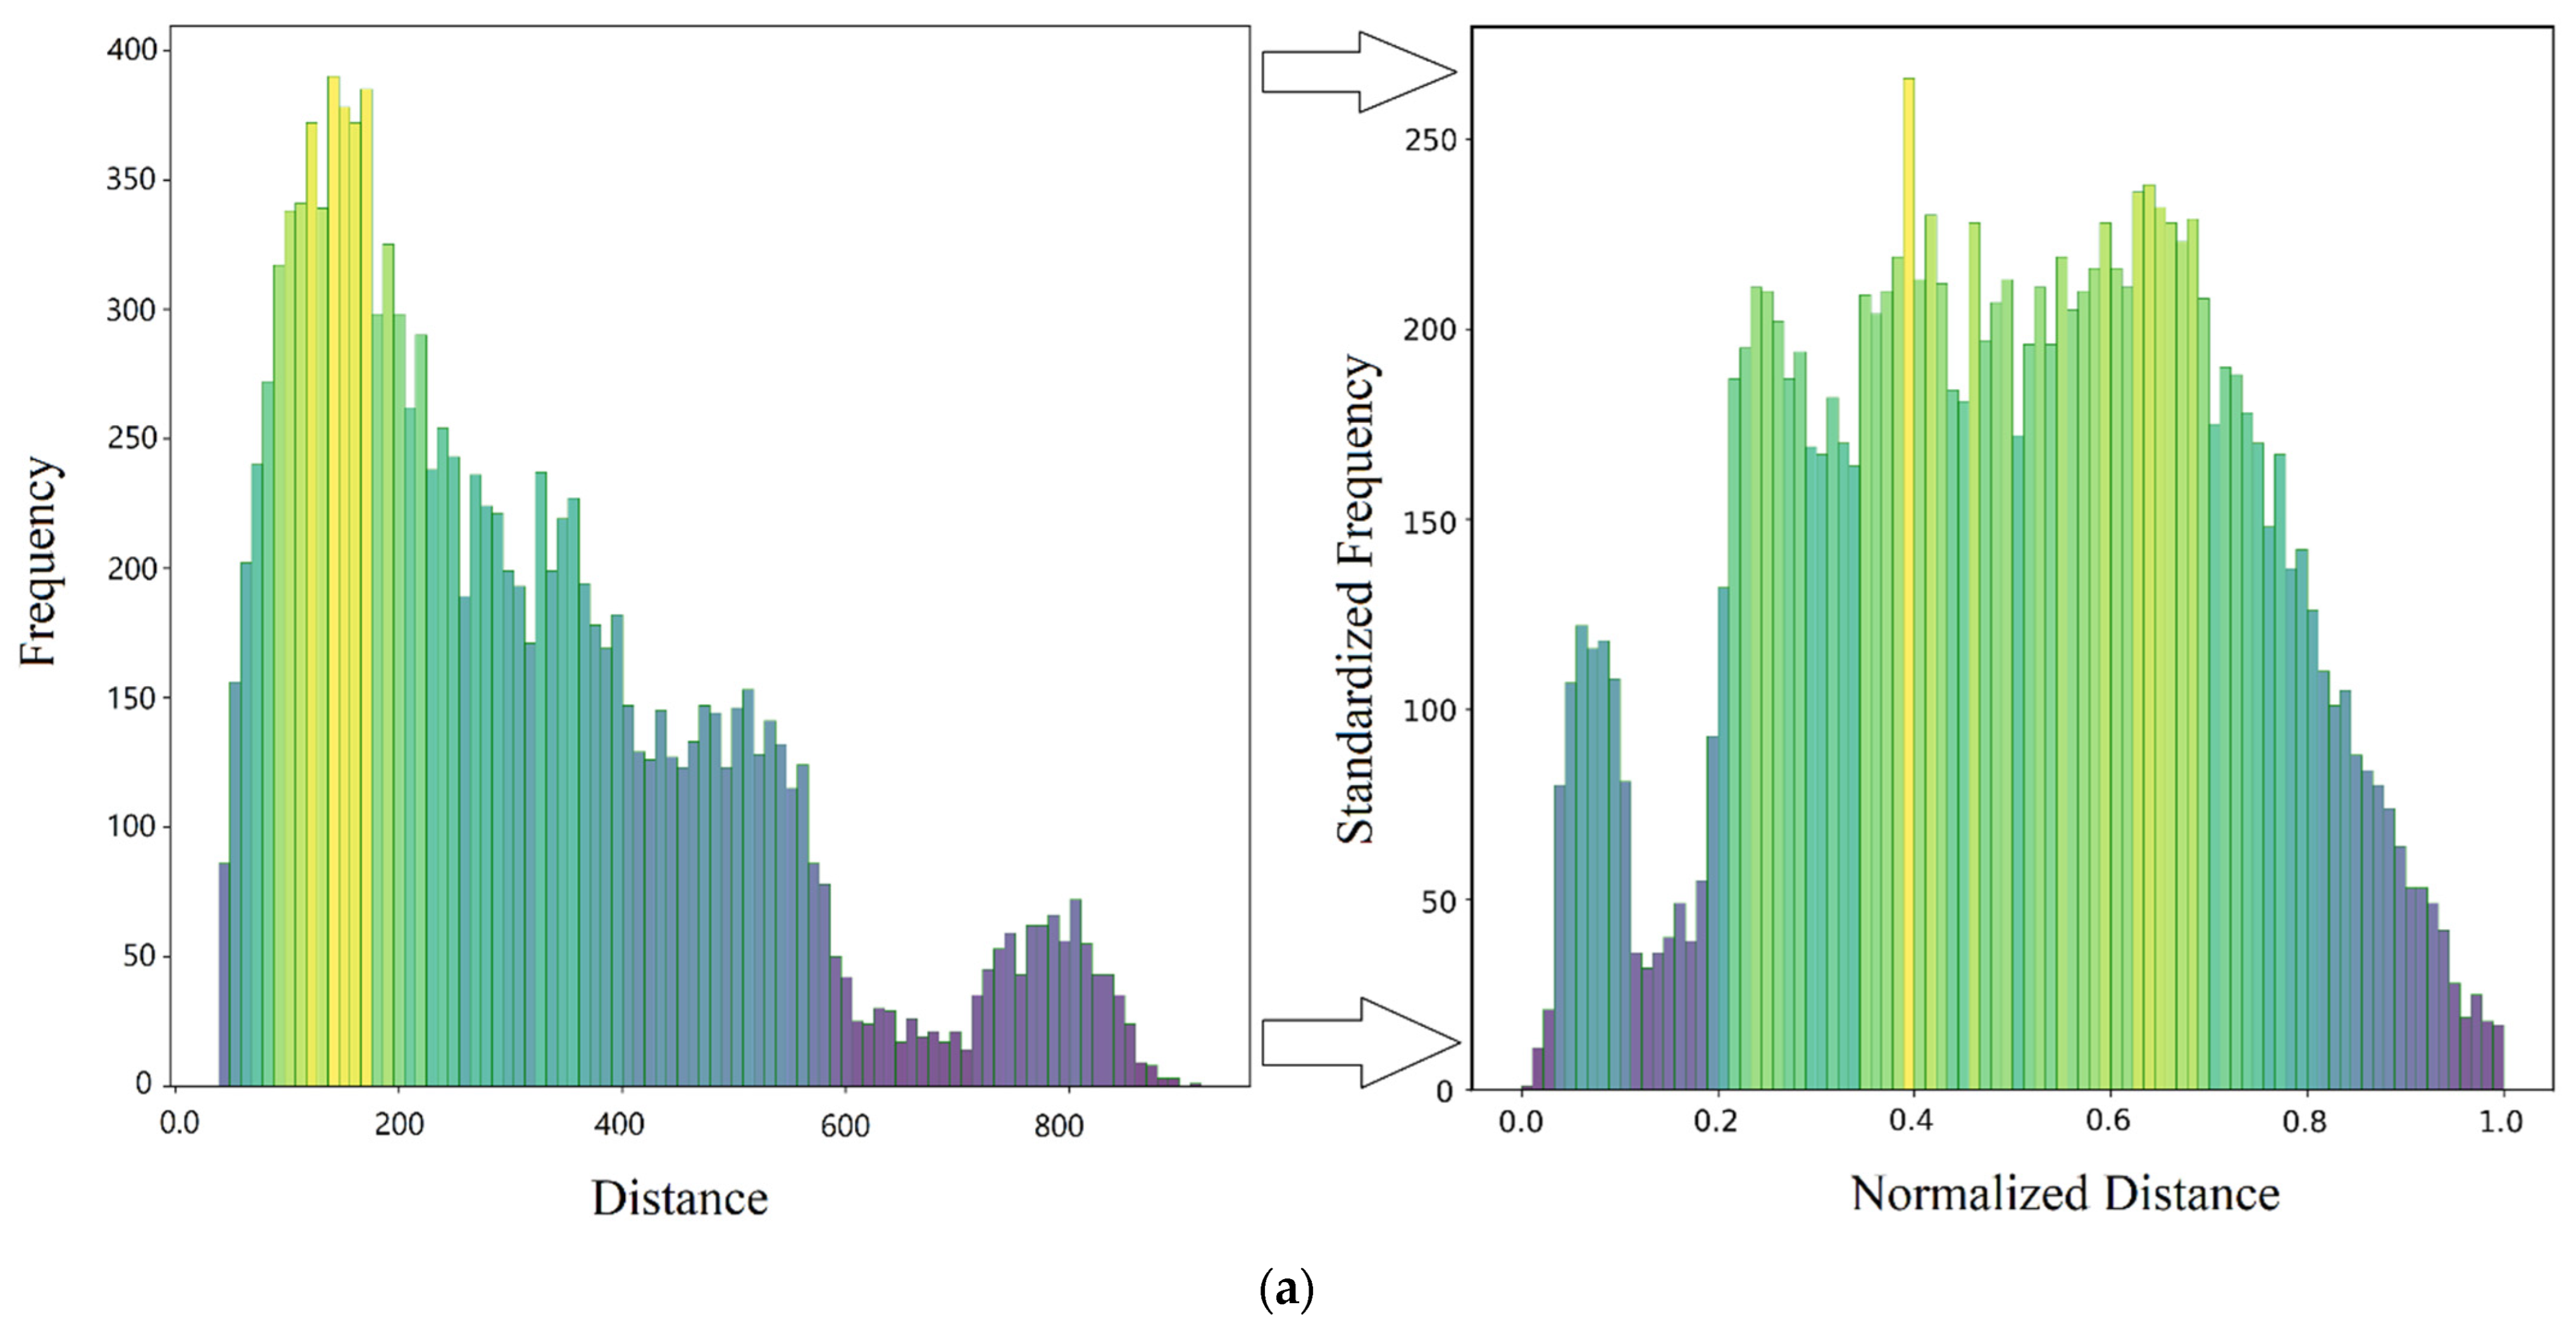
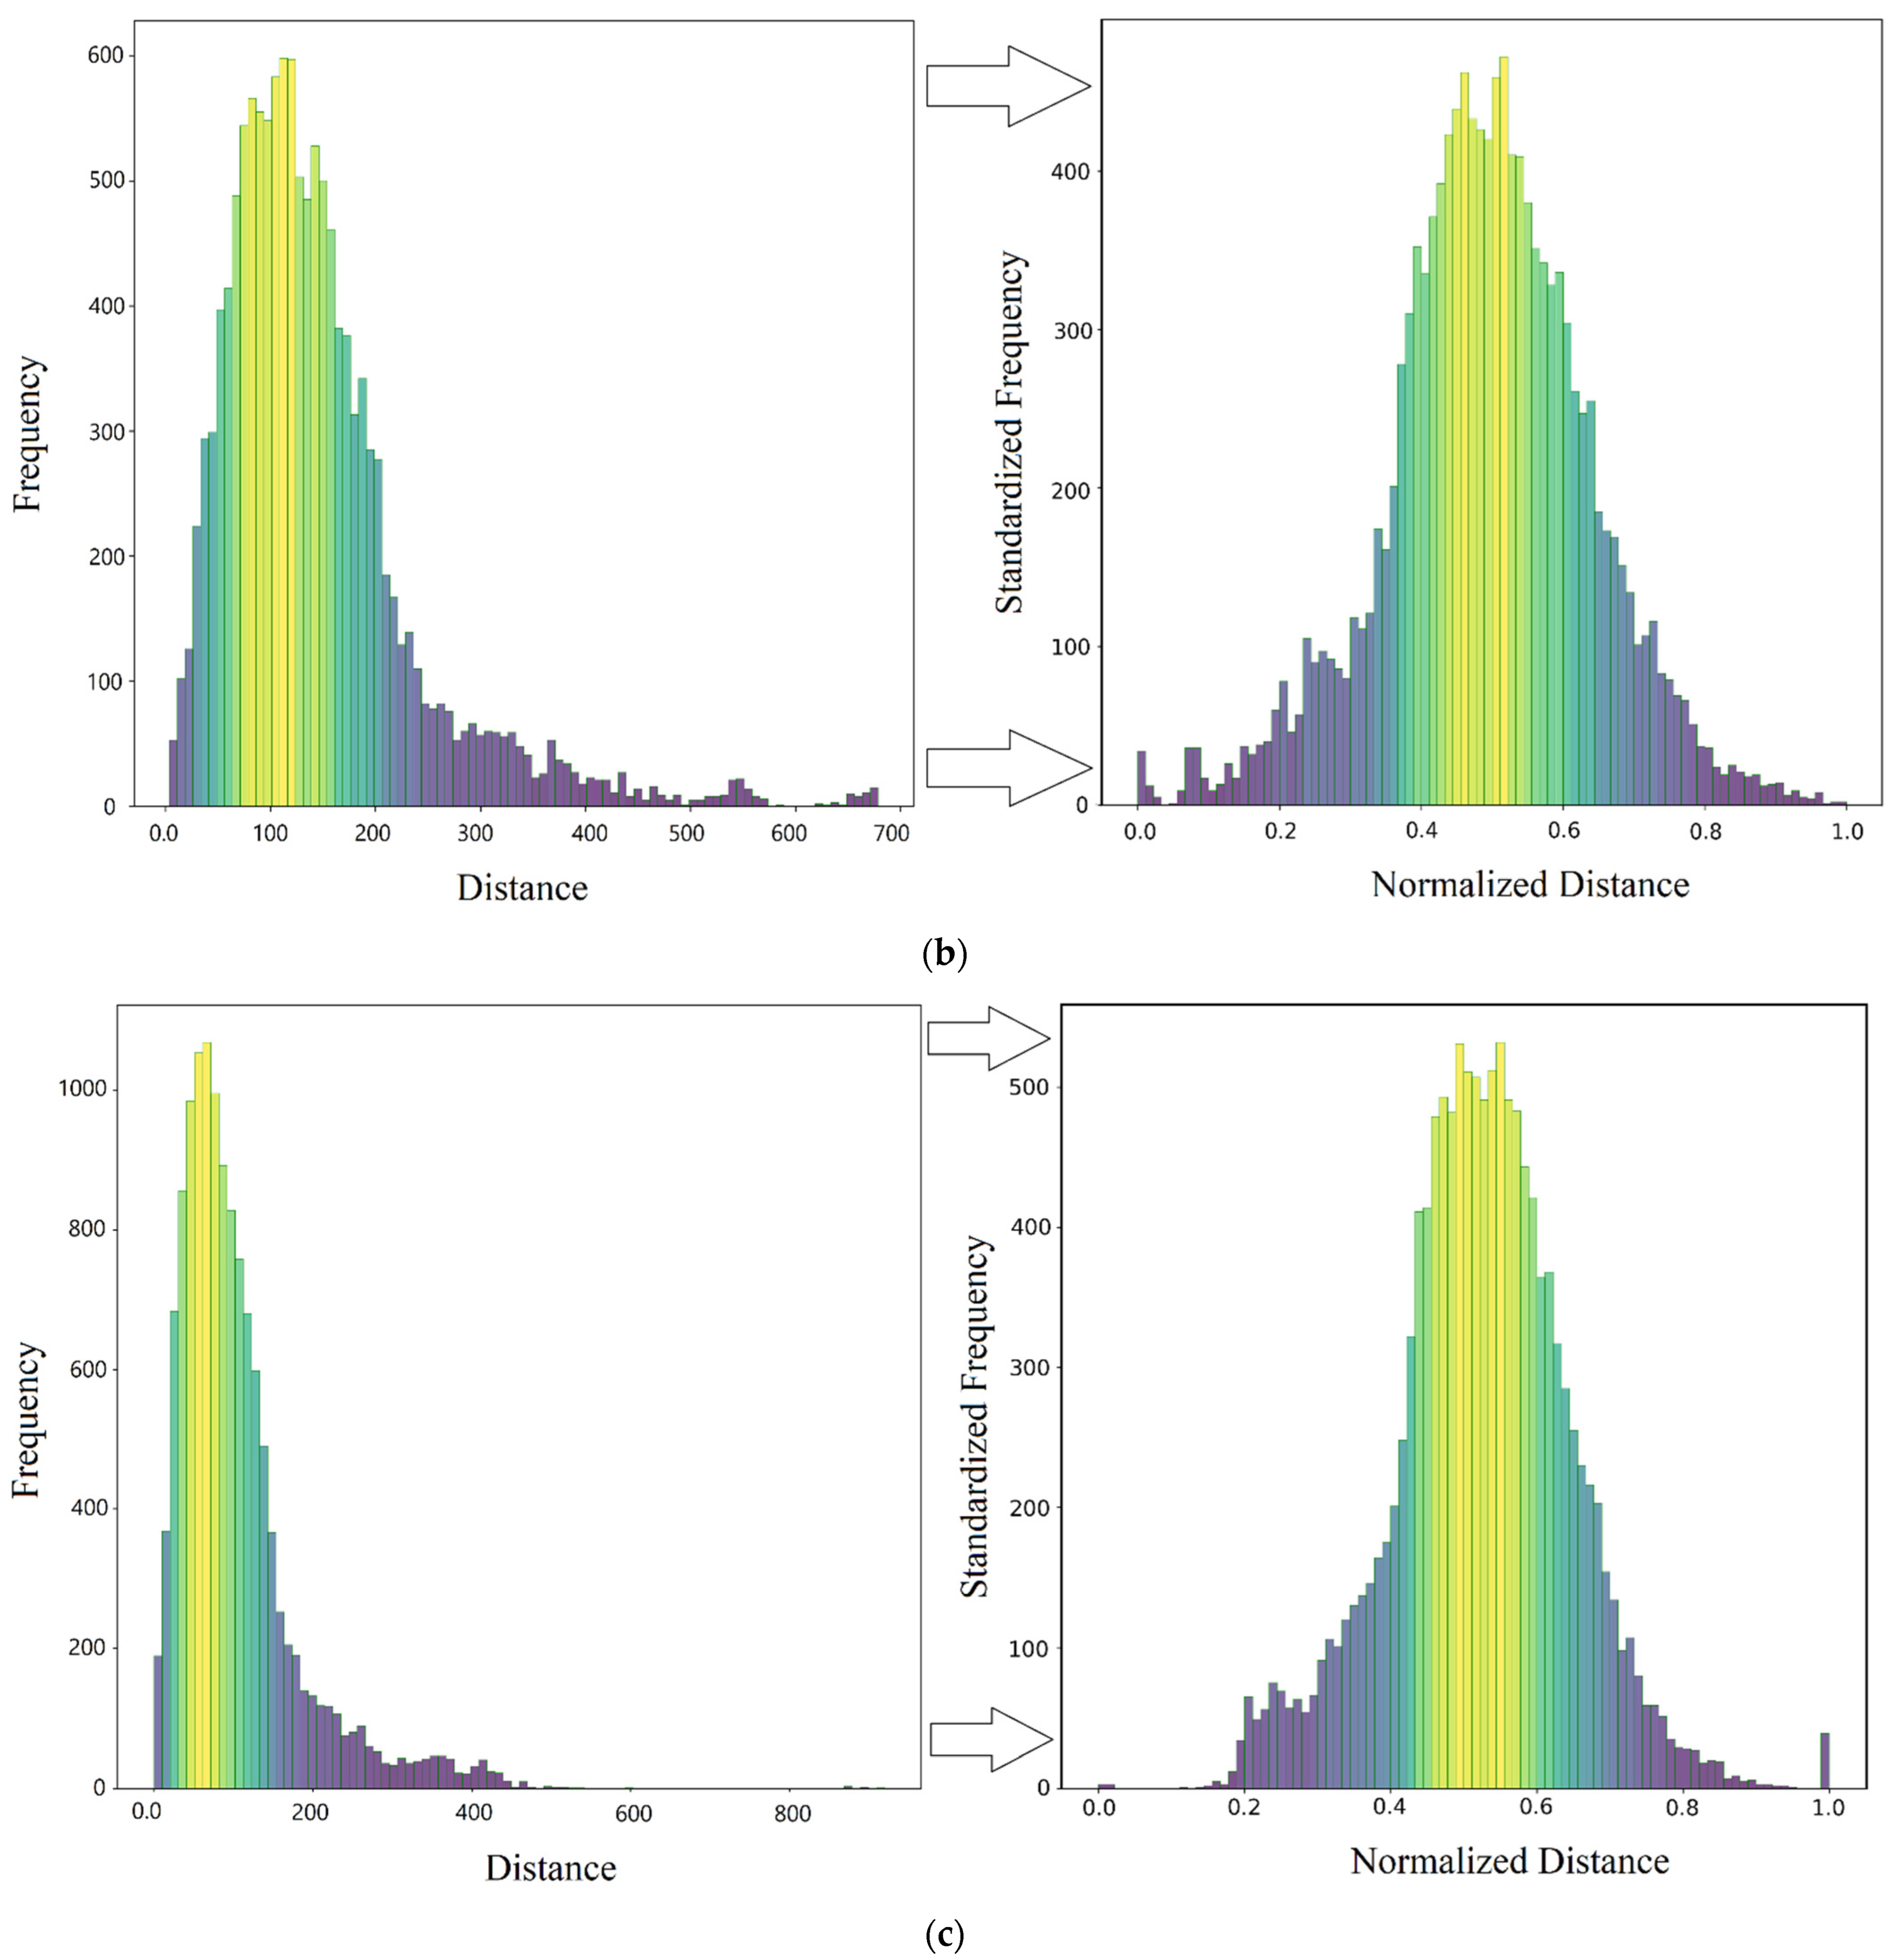
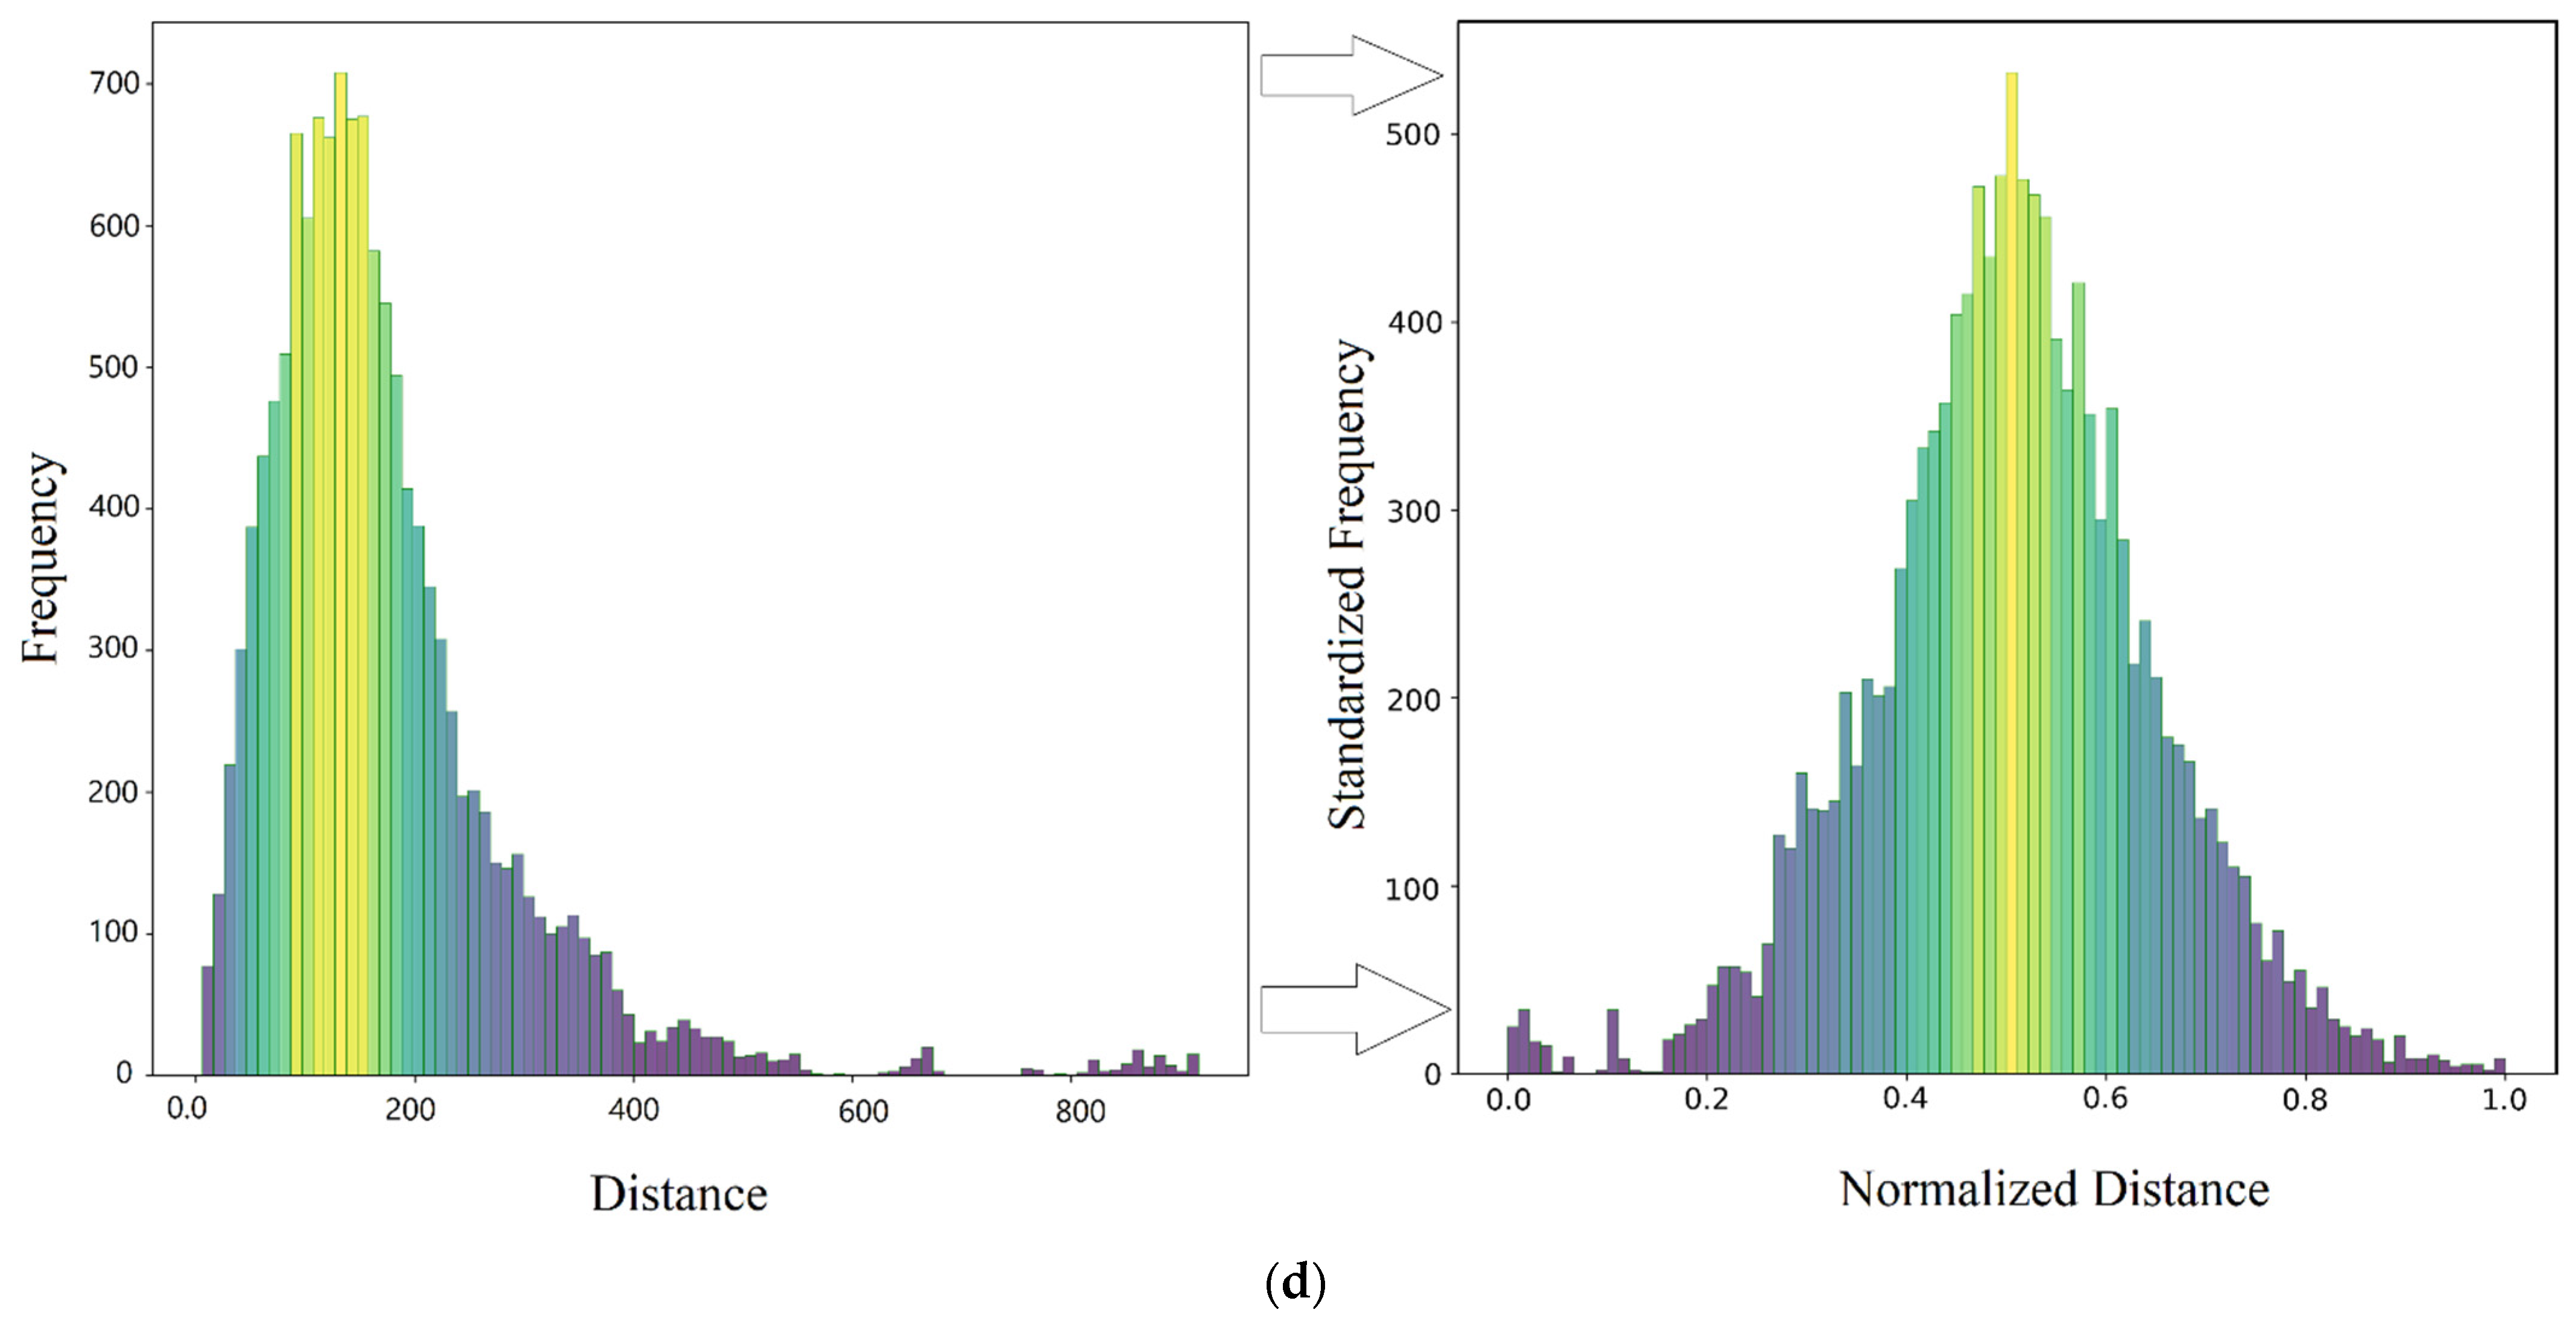
Normalization of Variables

The first step to measuring a variable’s entropy weights is to normalize the variable’s values. Additionally, the algorithms that compute the distance between the features, such as K-Means, are biased towards numerically larger values if the data is not scaled [50]. Therefore, scaling is one of ML’s most important data preprocessing steps. Normalization is a scaling technique in which values are shifted and rescaled to a range between 0 and 1. It is also known as Min-Max scaling. In this study, the variables are rescaled using Min-Max scaling. Equation (1) shows the Min-Max scaling formula for variable i and sample j.
P i j = X i j X m i n X m a x X m i n
where X m a x and X m i n are the variable’s maximum and minimum values, respectively.

Calculation of the Variable’s Entropy

According to the definition of entropy [51], the entropy of the ith variable is determined by Equation (2).
E i = j = 1 n P i j   . ln P i j   ln n

Calculation of the Variable’s Entropy Weight

The range of entropy value E i is [0, 1]. The larger the E i , the greater the differentiation degree of variable i, and more information can be derived. Hence, a higher weight should be given to the variable. Therefore, in the entropy weighting method, the weight calculation method is according to Equation (3).
w i = 1 E i i = 1 m ( 1 E i )

4.2.3. Standardization

ML algorithms are optimized to work on normally distributed data [52]. Power transforms are functions that transform numerical features into a more convenient form, to conform better to a normal distribution. Yeo–Johnson power transform, a family of parametric, monotonic transformations, was applied to make data more Gaussian-like (normal distribution) in this study [53]. The idea of a power transformer is to increase the symmetry of the distribution of the features [54,55]. An asymmetric feature would be more symmetric after applying a power transformation.

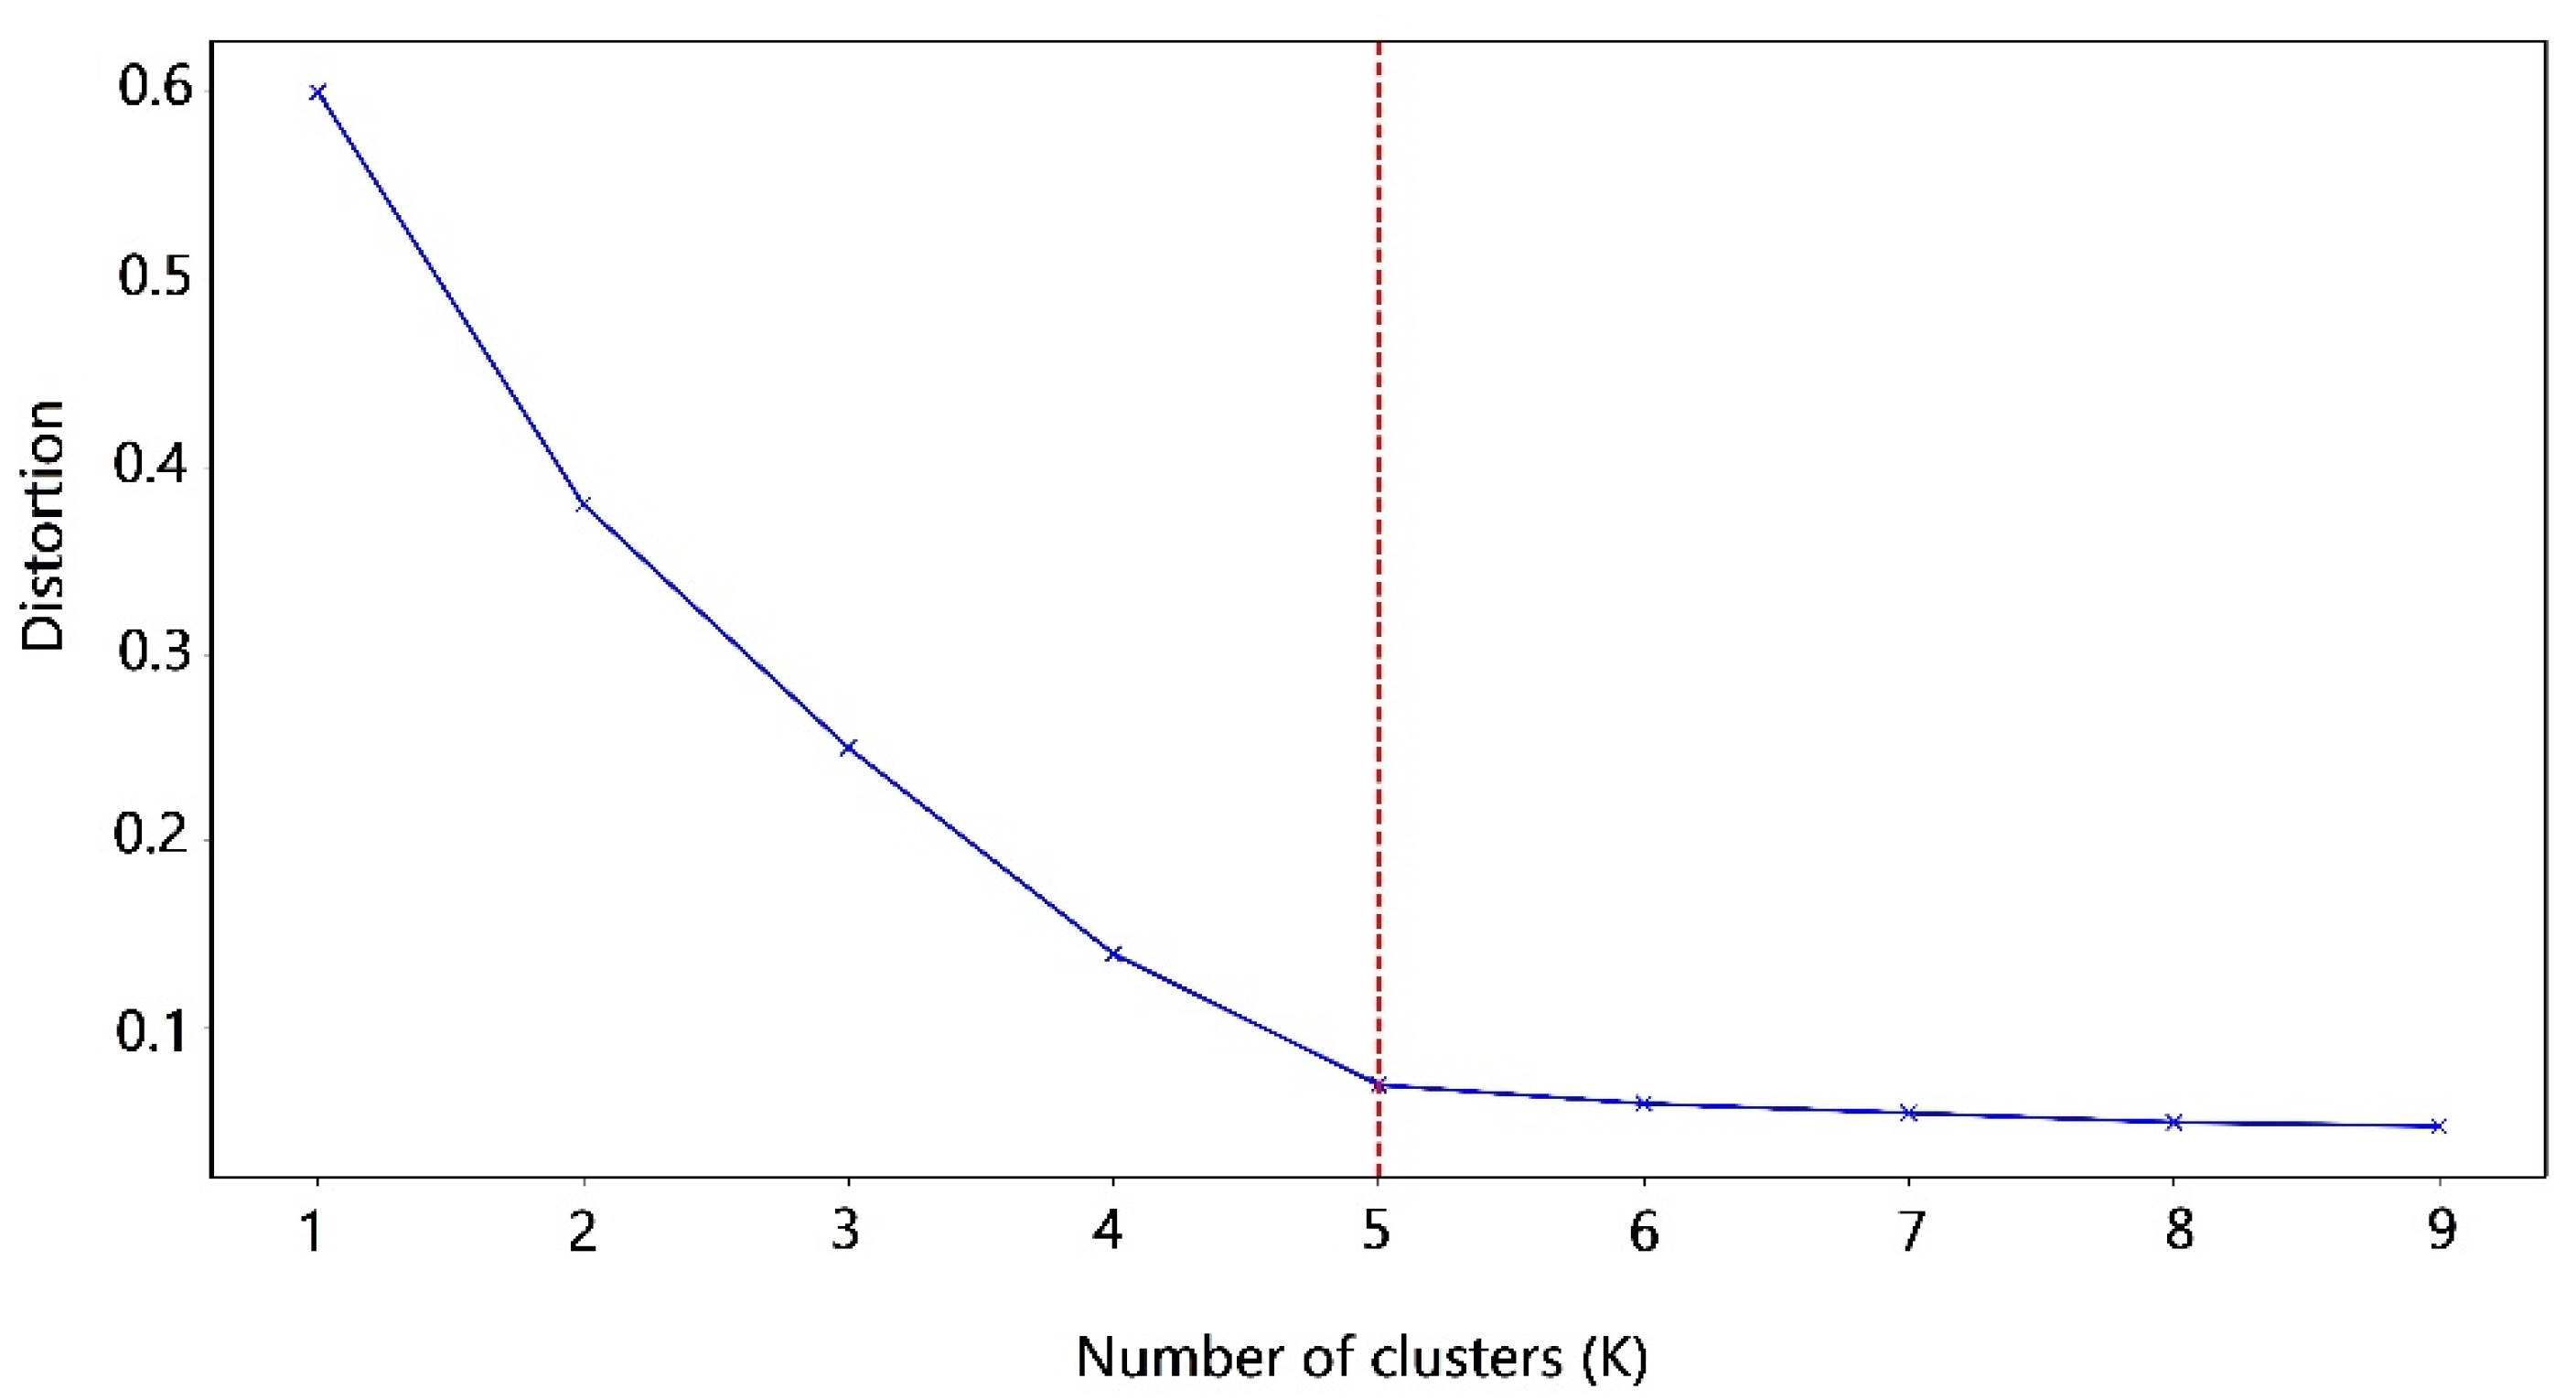
4.2.4. Choosing the Number of Clusters k

A fundamental step for any unsupervised algorithm is determining the optimal number of clusters into which the data may be clustered [56]. The Elbow method is one of the most popular methods to determine this optimal value of k [57]. To determine the optimal number of clusters, we have to select the value of k at the “elbow”, i.e., the point after which the distortion/inertia starts decreasing linearly.
The steps for calculating the optimal number of clusters are as follows:
  • Calculating distortion: It is calculated as the average of the squared distances from the cluster centers of the respective clusters to samples (census blocks’ centroid). Often, the Euclidean distance metric is used.
  • Calculating inertia: It is the sum of squared distances of samples to their closest cluster center.
  • Iterating steps 1 and 2 for values of k (1 to 9).

4.2.5. K-Means Clustering

A K-Means clustering algorithm aims to partition n observations into k clusters in which each observation belongs to the cluster with the nearest mean. To make the clusters, three steps are followed:
  • Selecting k random blocks from the data as centroids
  • Assign all the blocks to the closest cluster centroid
  • Computing the centroids of newly formed clusters
  • Repeat steps 3 and 4
The algorithm stops when blocks remain in the same cluster [58].

4.2.6. Agglomerative Clustering

Agglomerative clustering aims to group objects in clusters based on their similarity. The algorithm starts by treating each object as a singleton cluster. Next, pairs of clusters are successively merged until all clusters have been merged into one big cluster containing all objects [59].

4.2.7. Bisecting K-Means

A combination of K-Means and hierarchical clustering is called Bisecting K-Means. Instead of dividing the data into ‘k’ clusters in each iteration, Bisecting K-Means separates one cluster into two sub-clusters at each bisecting step (by using K-Means) until k clusters are obtained [60].

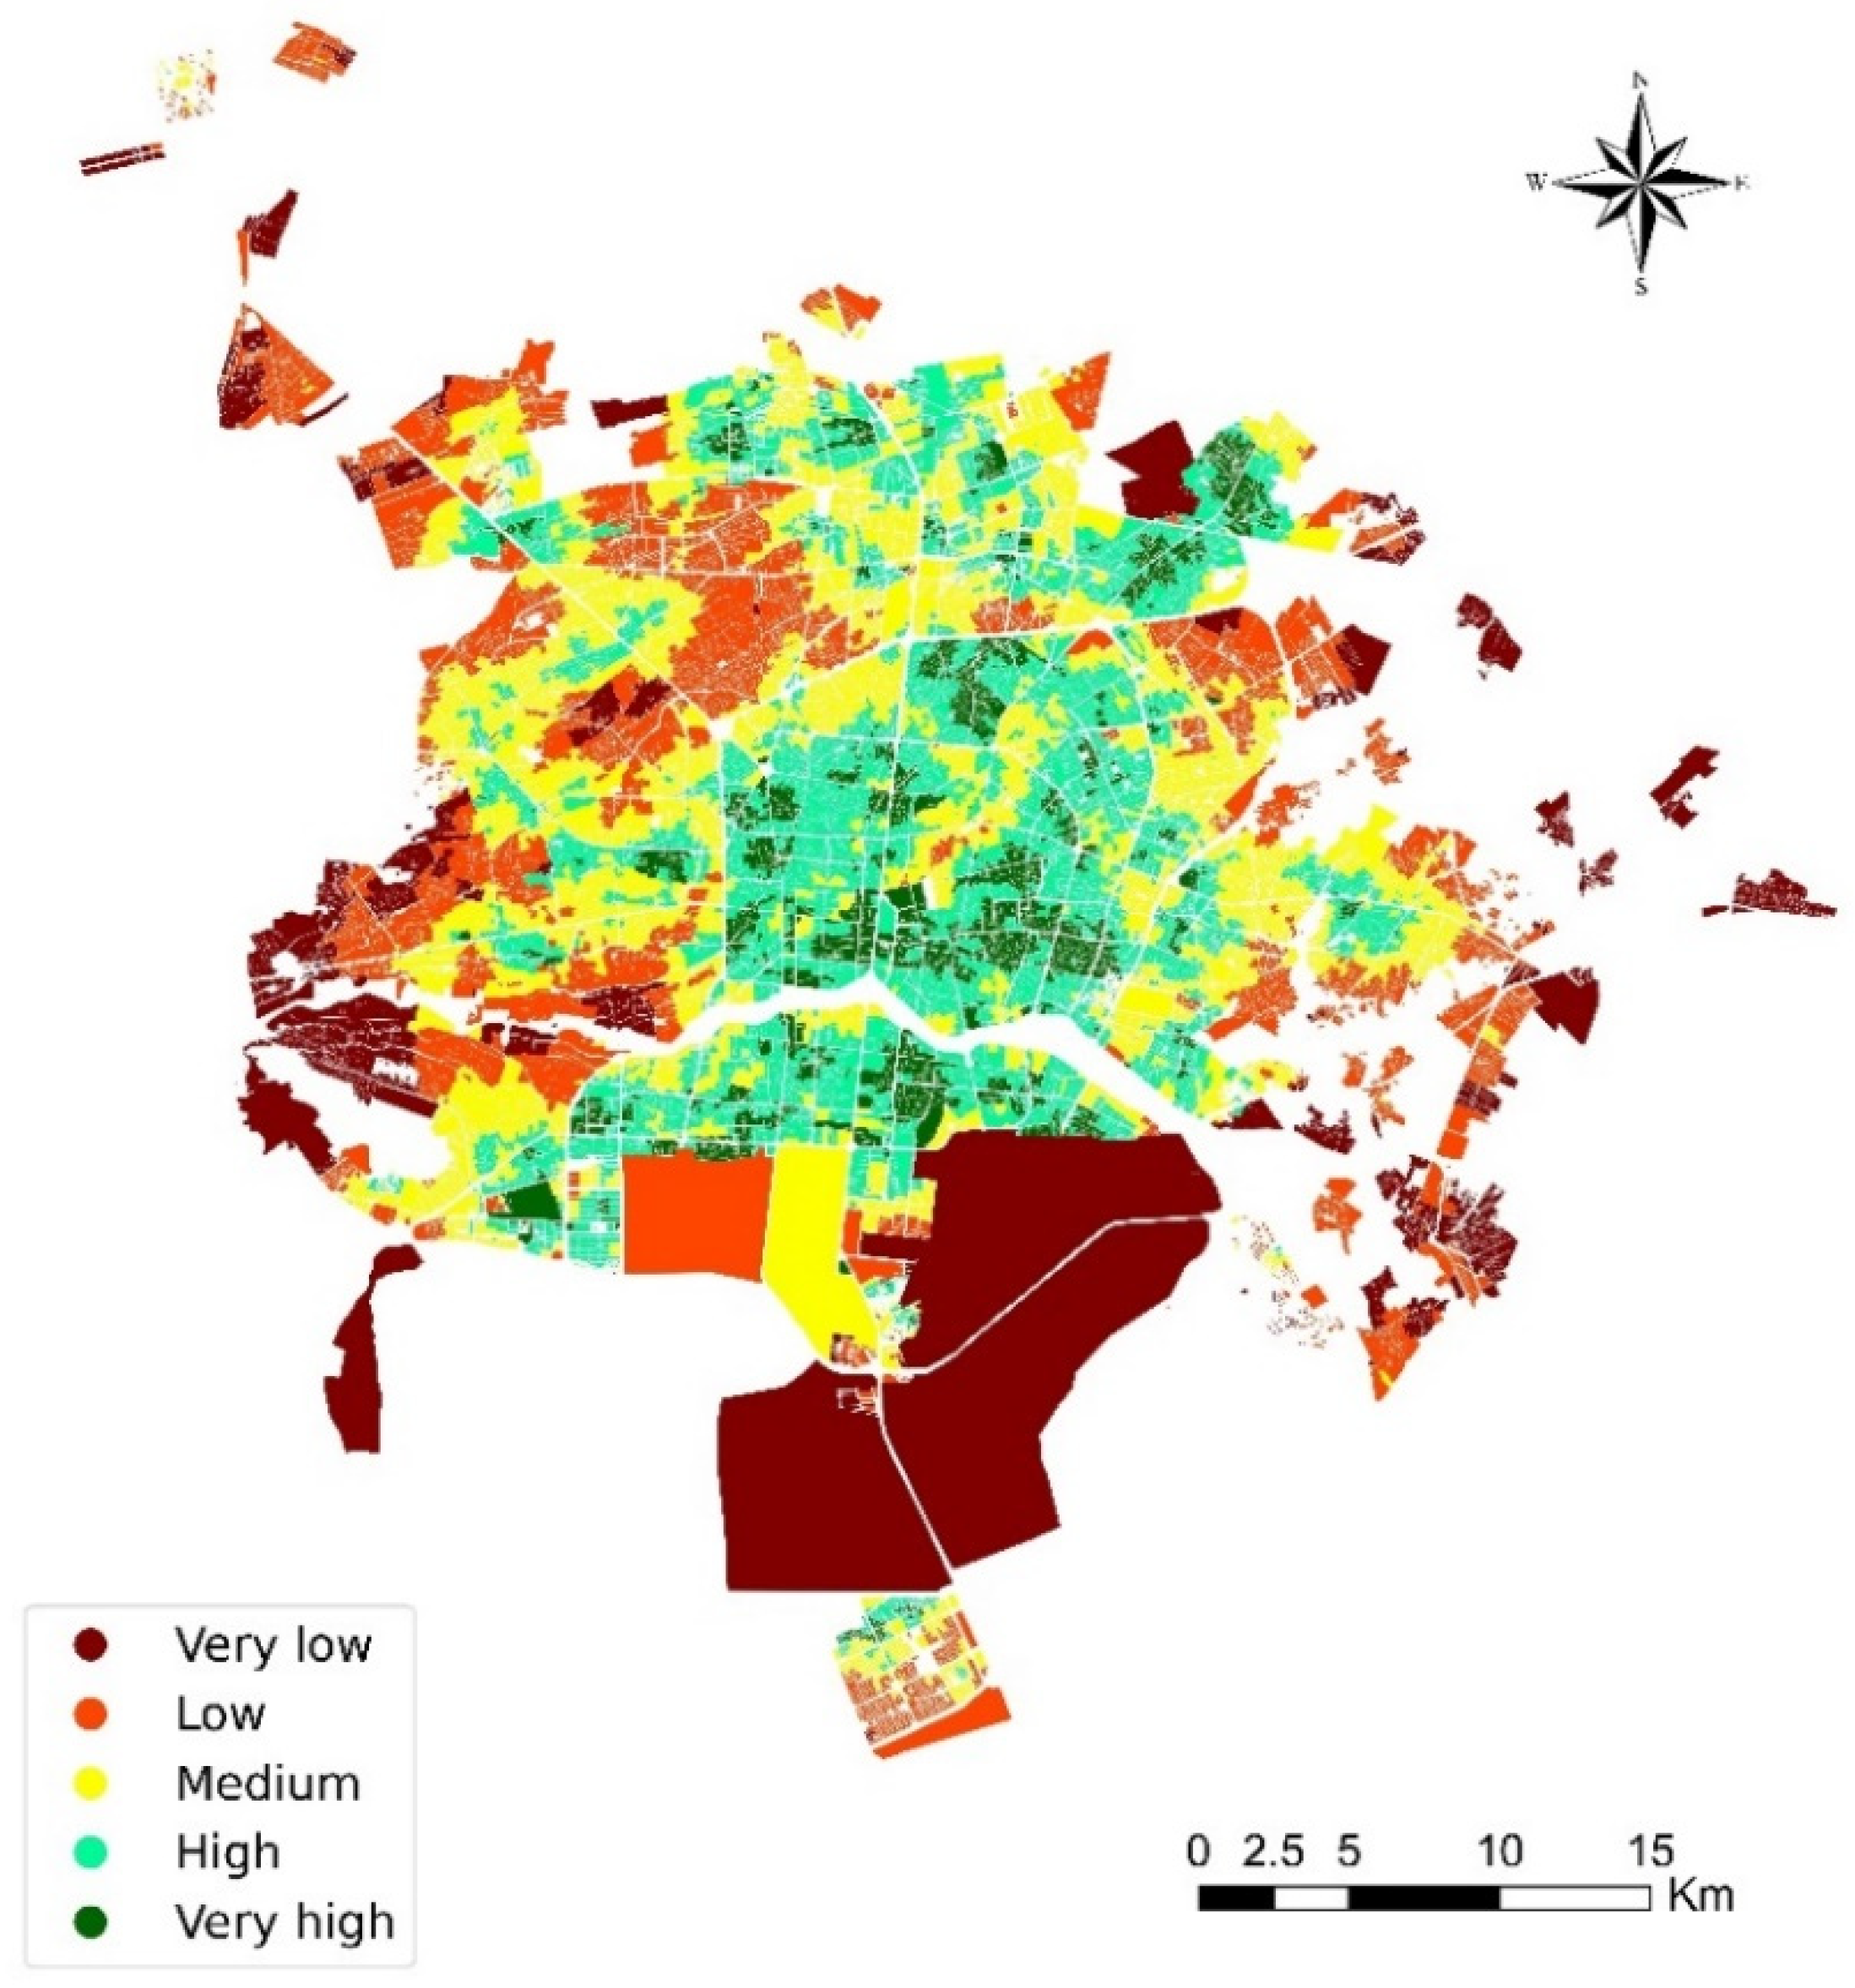
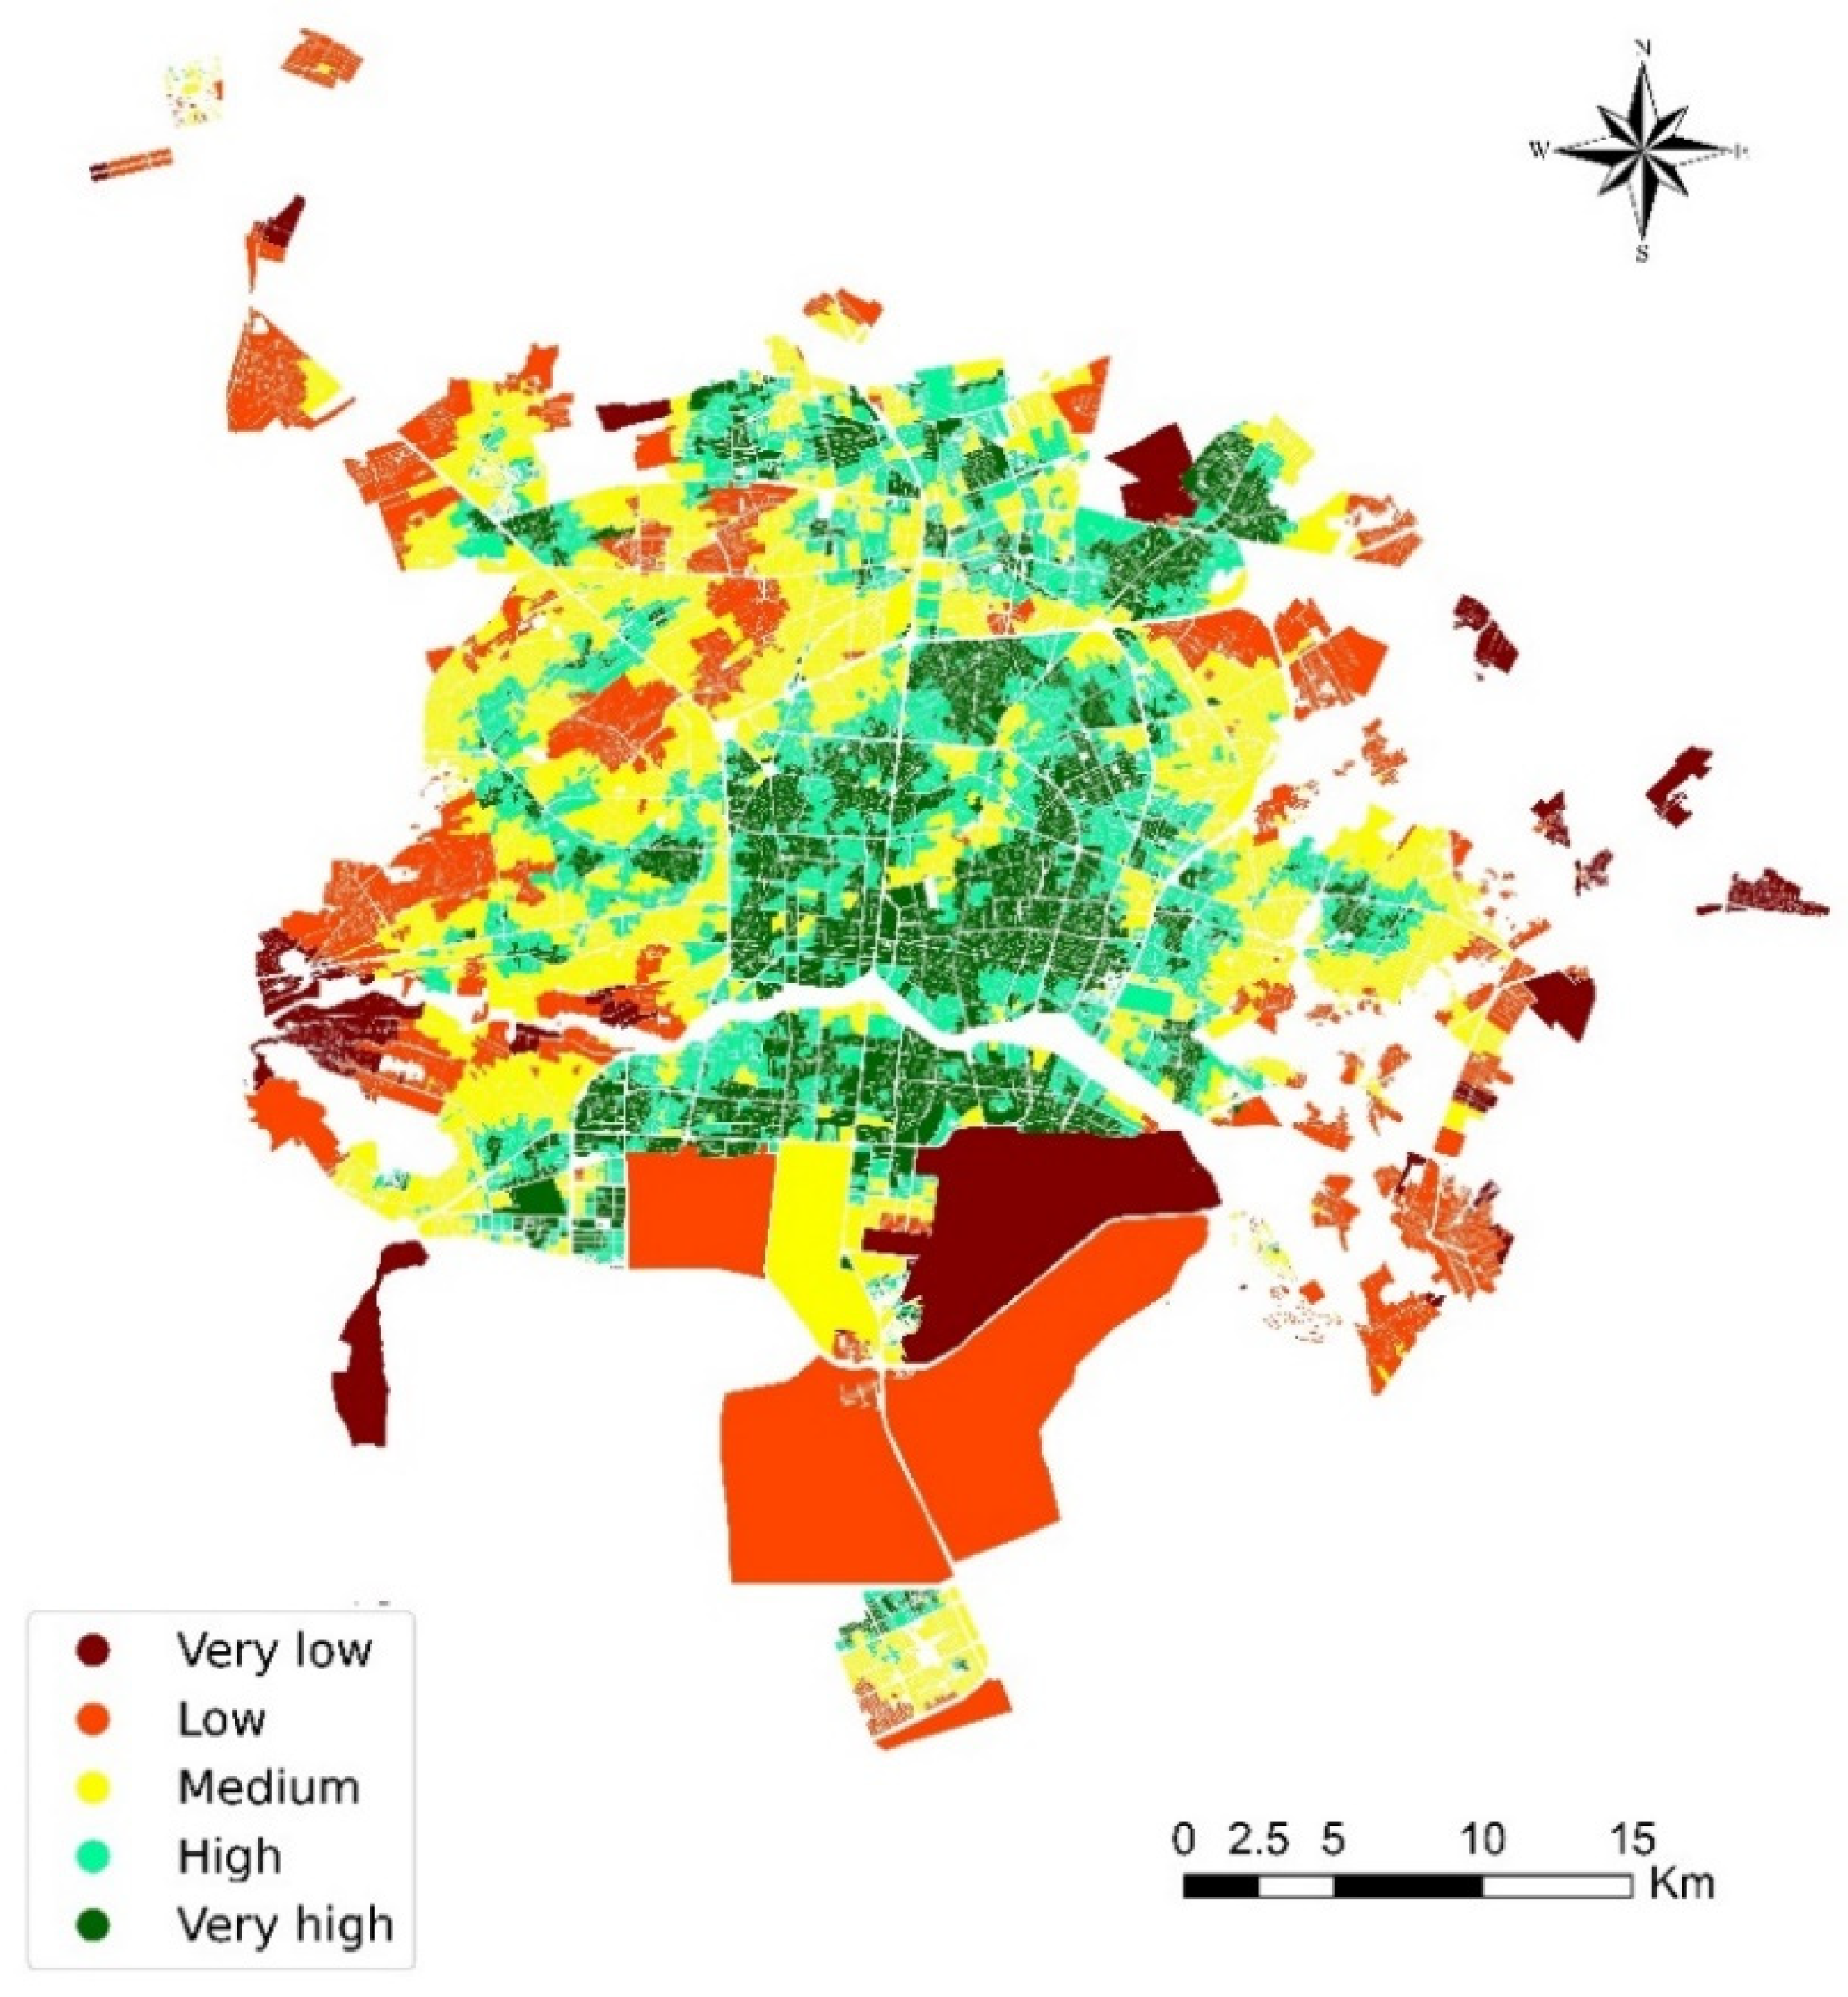
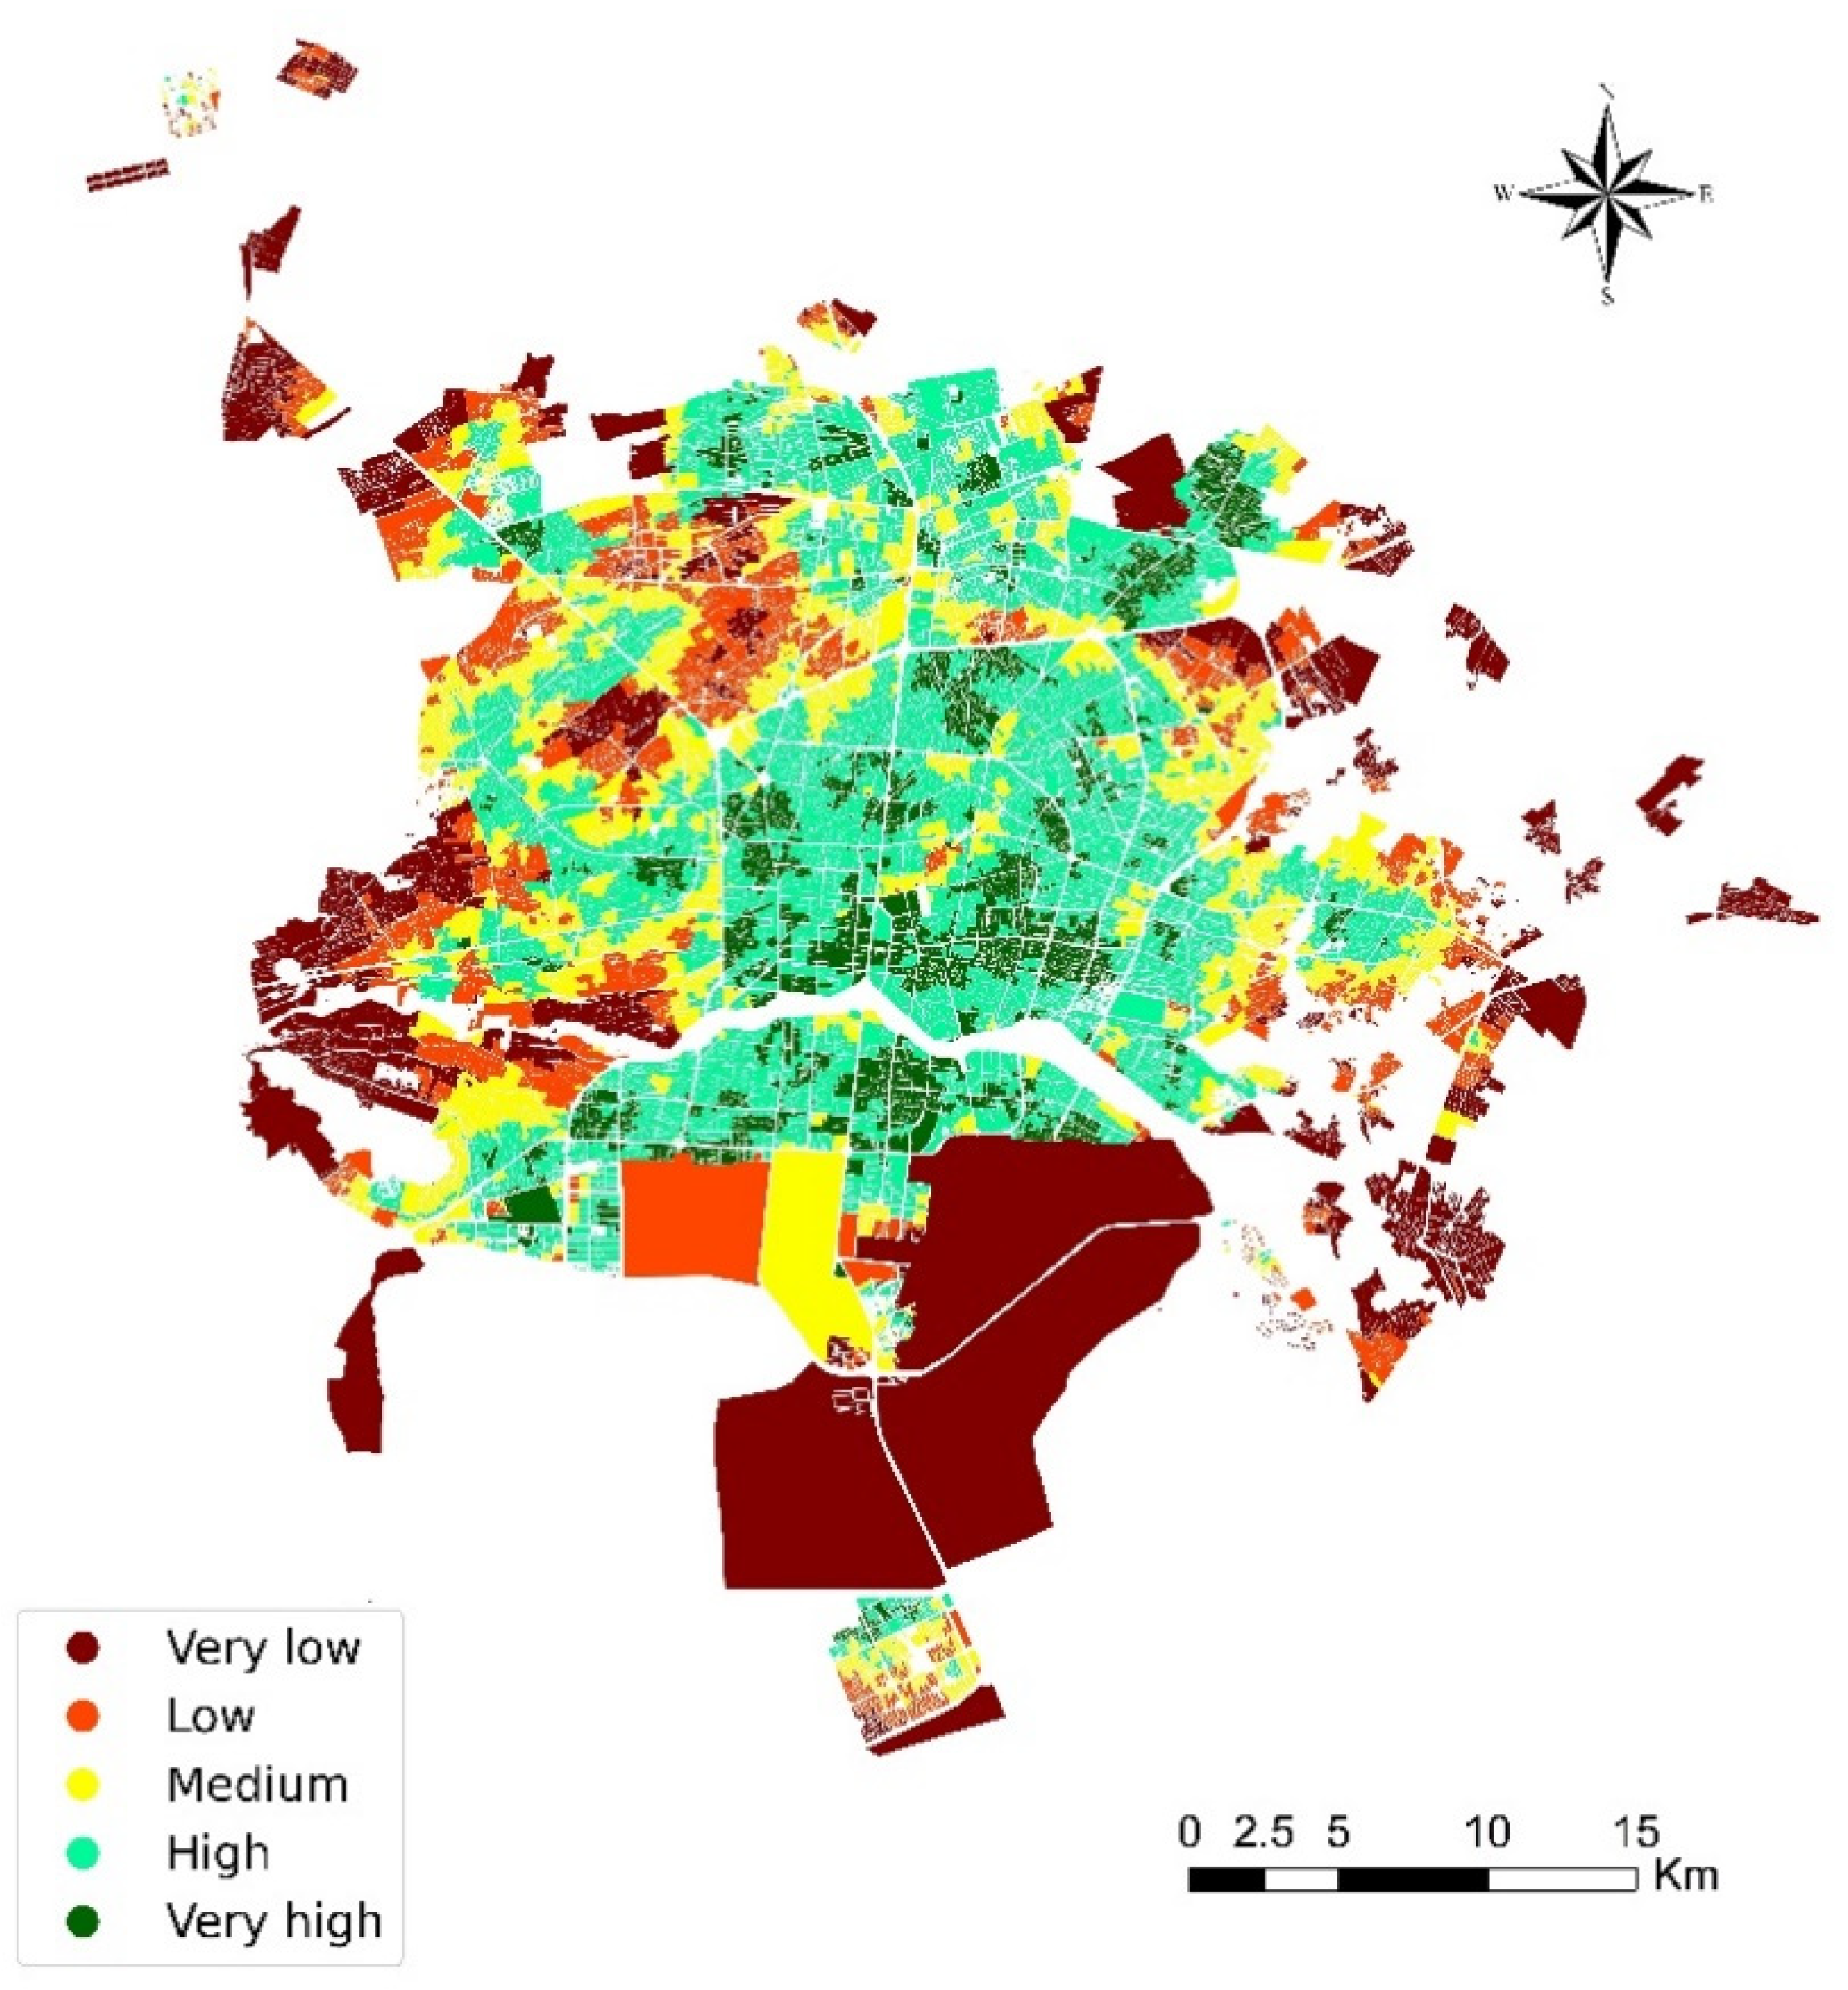
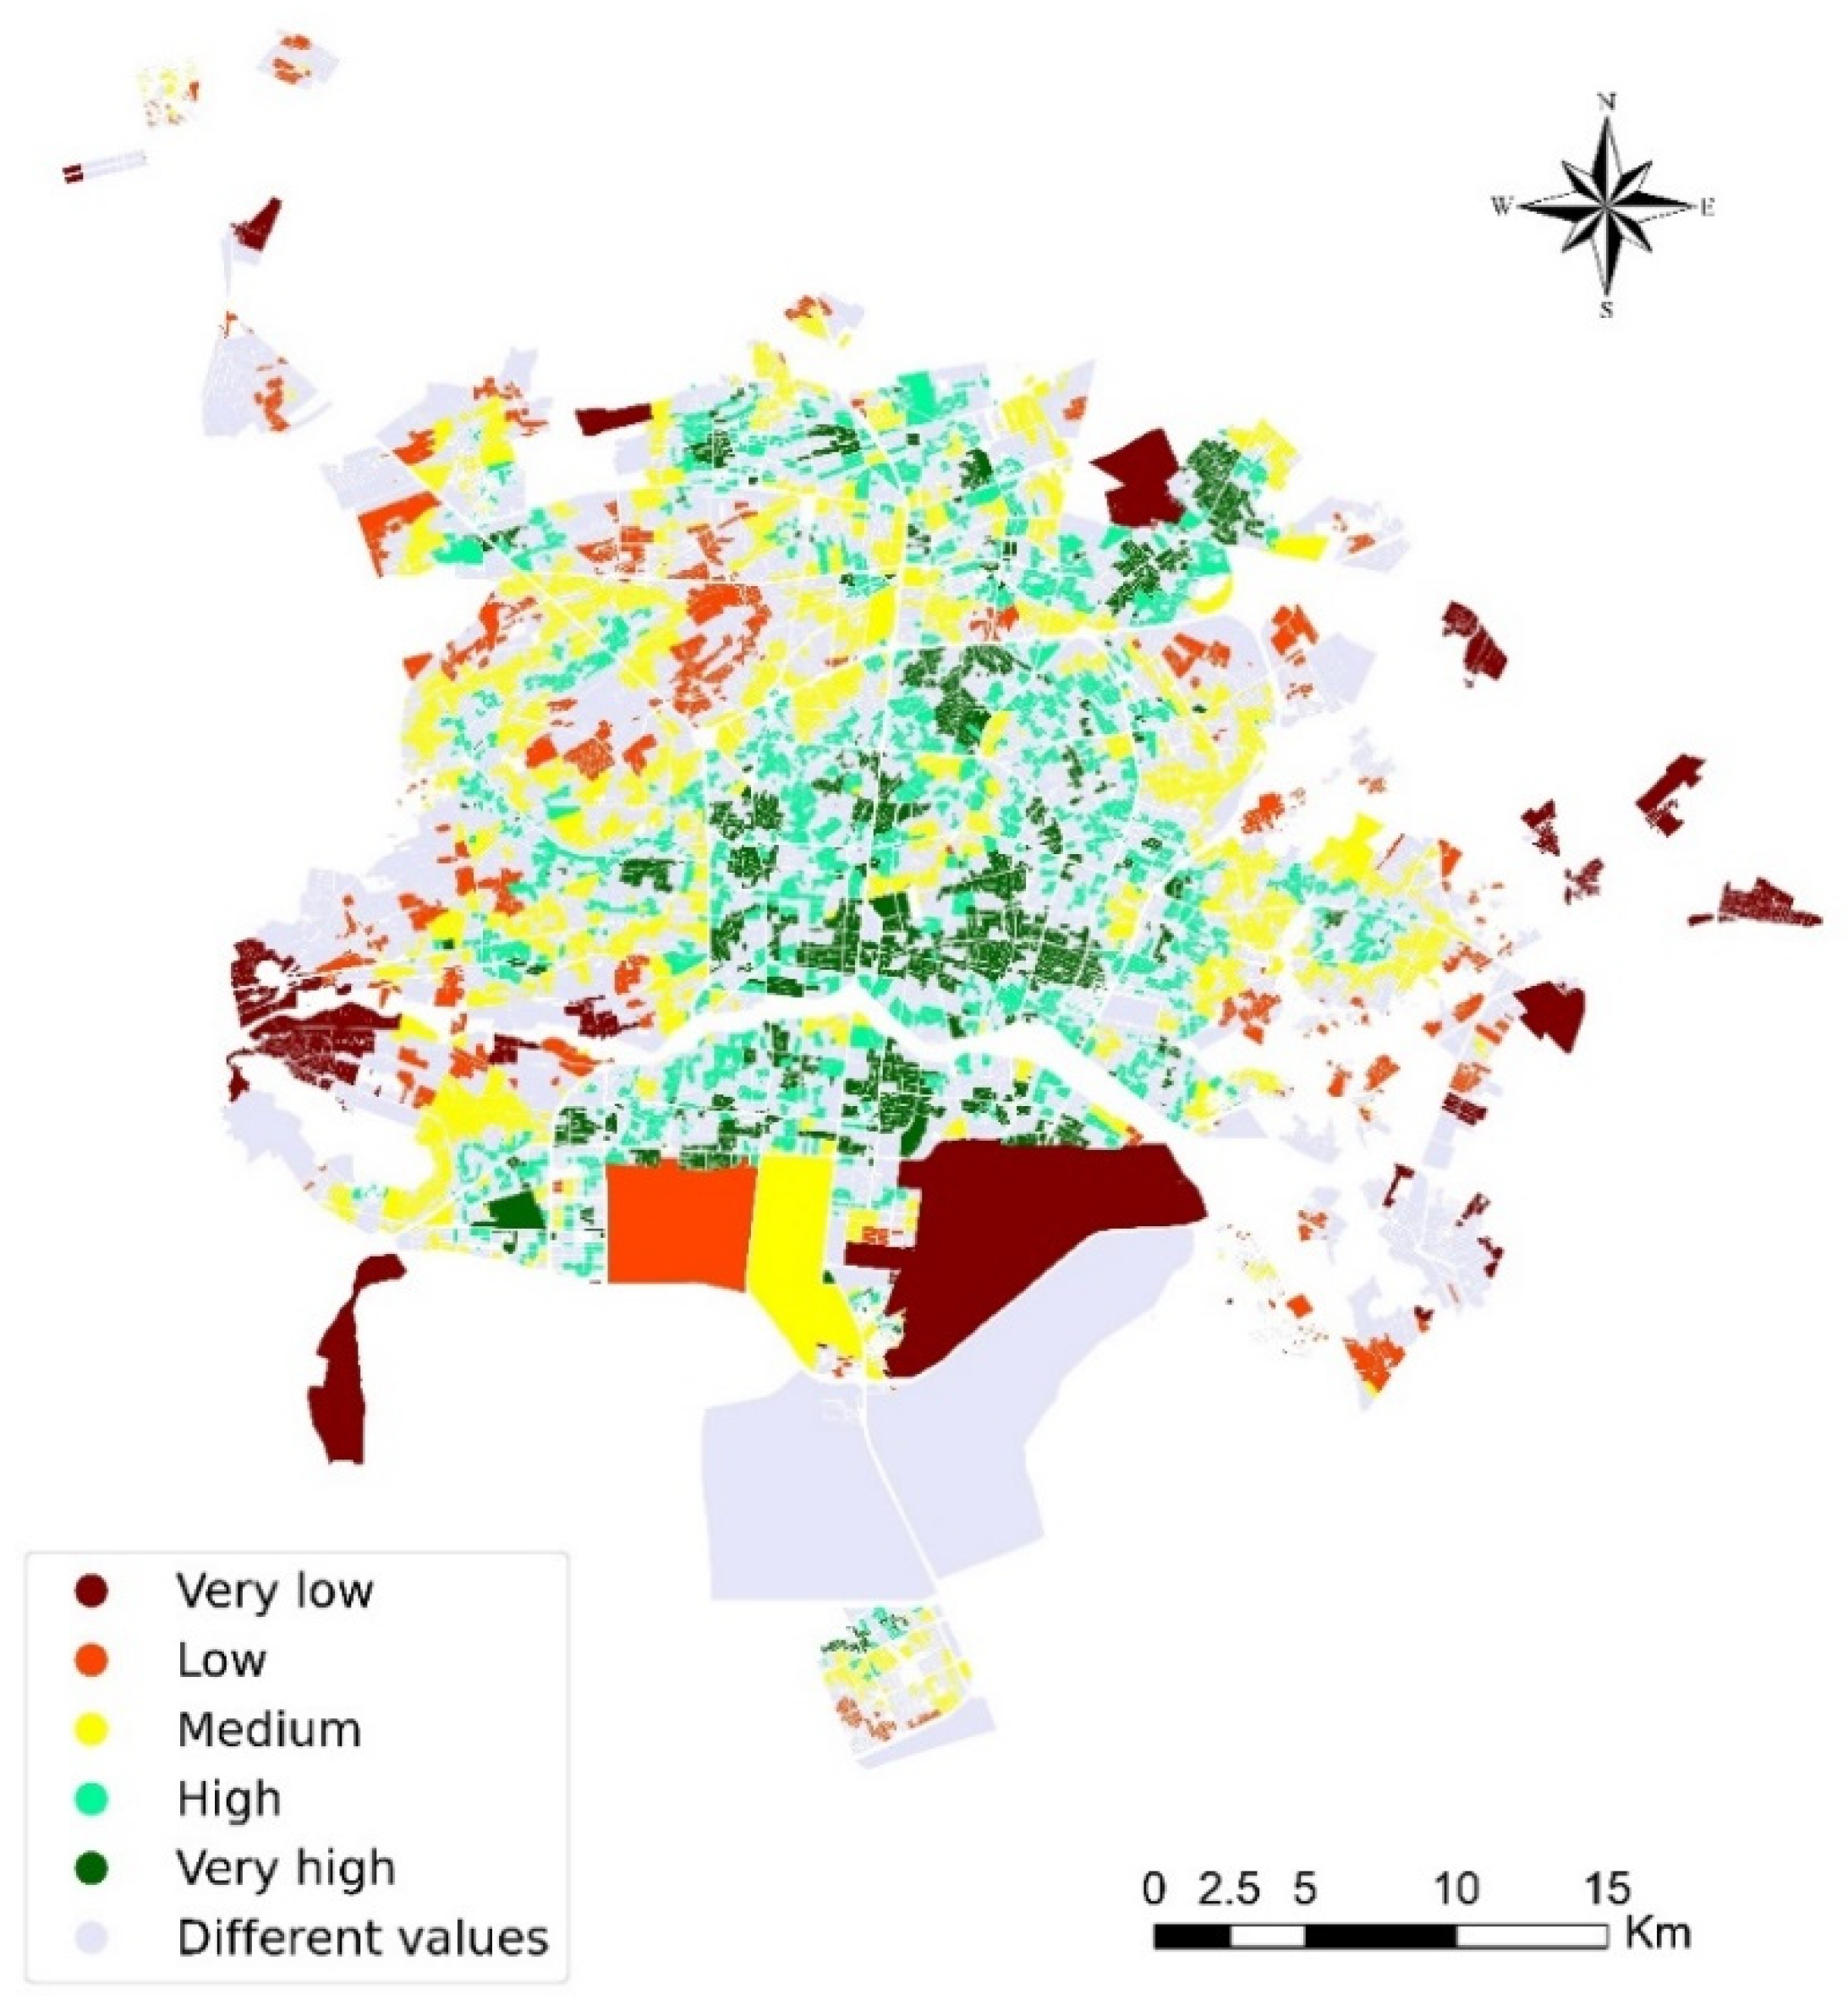
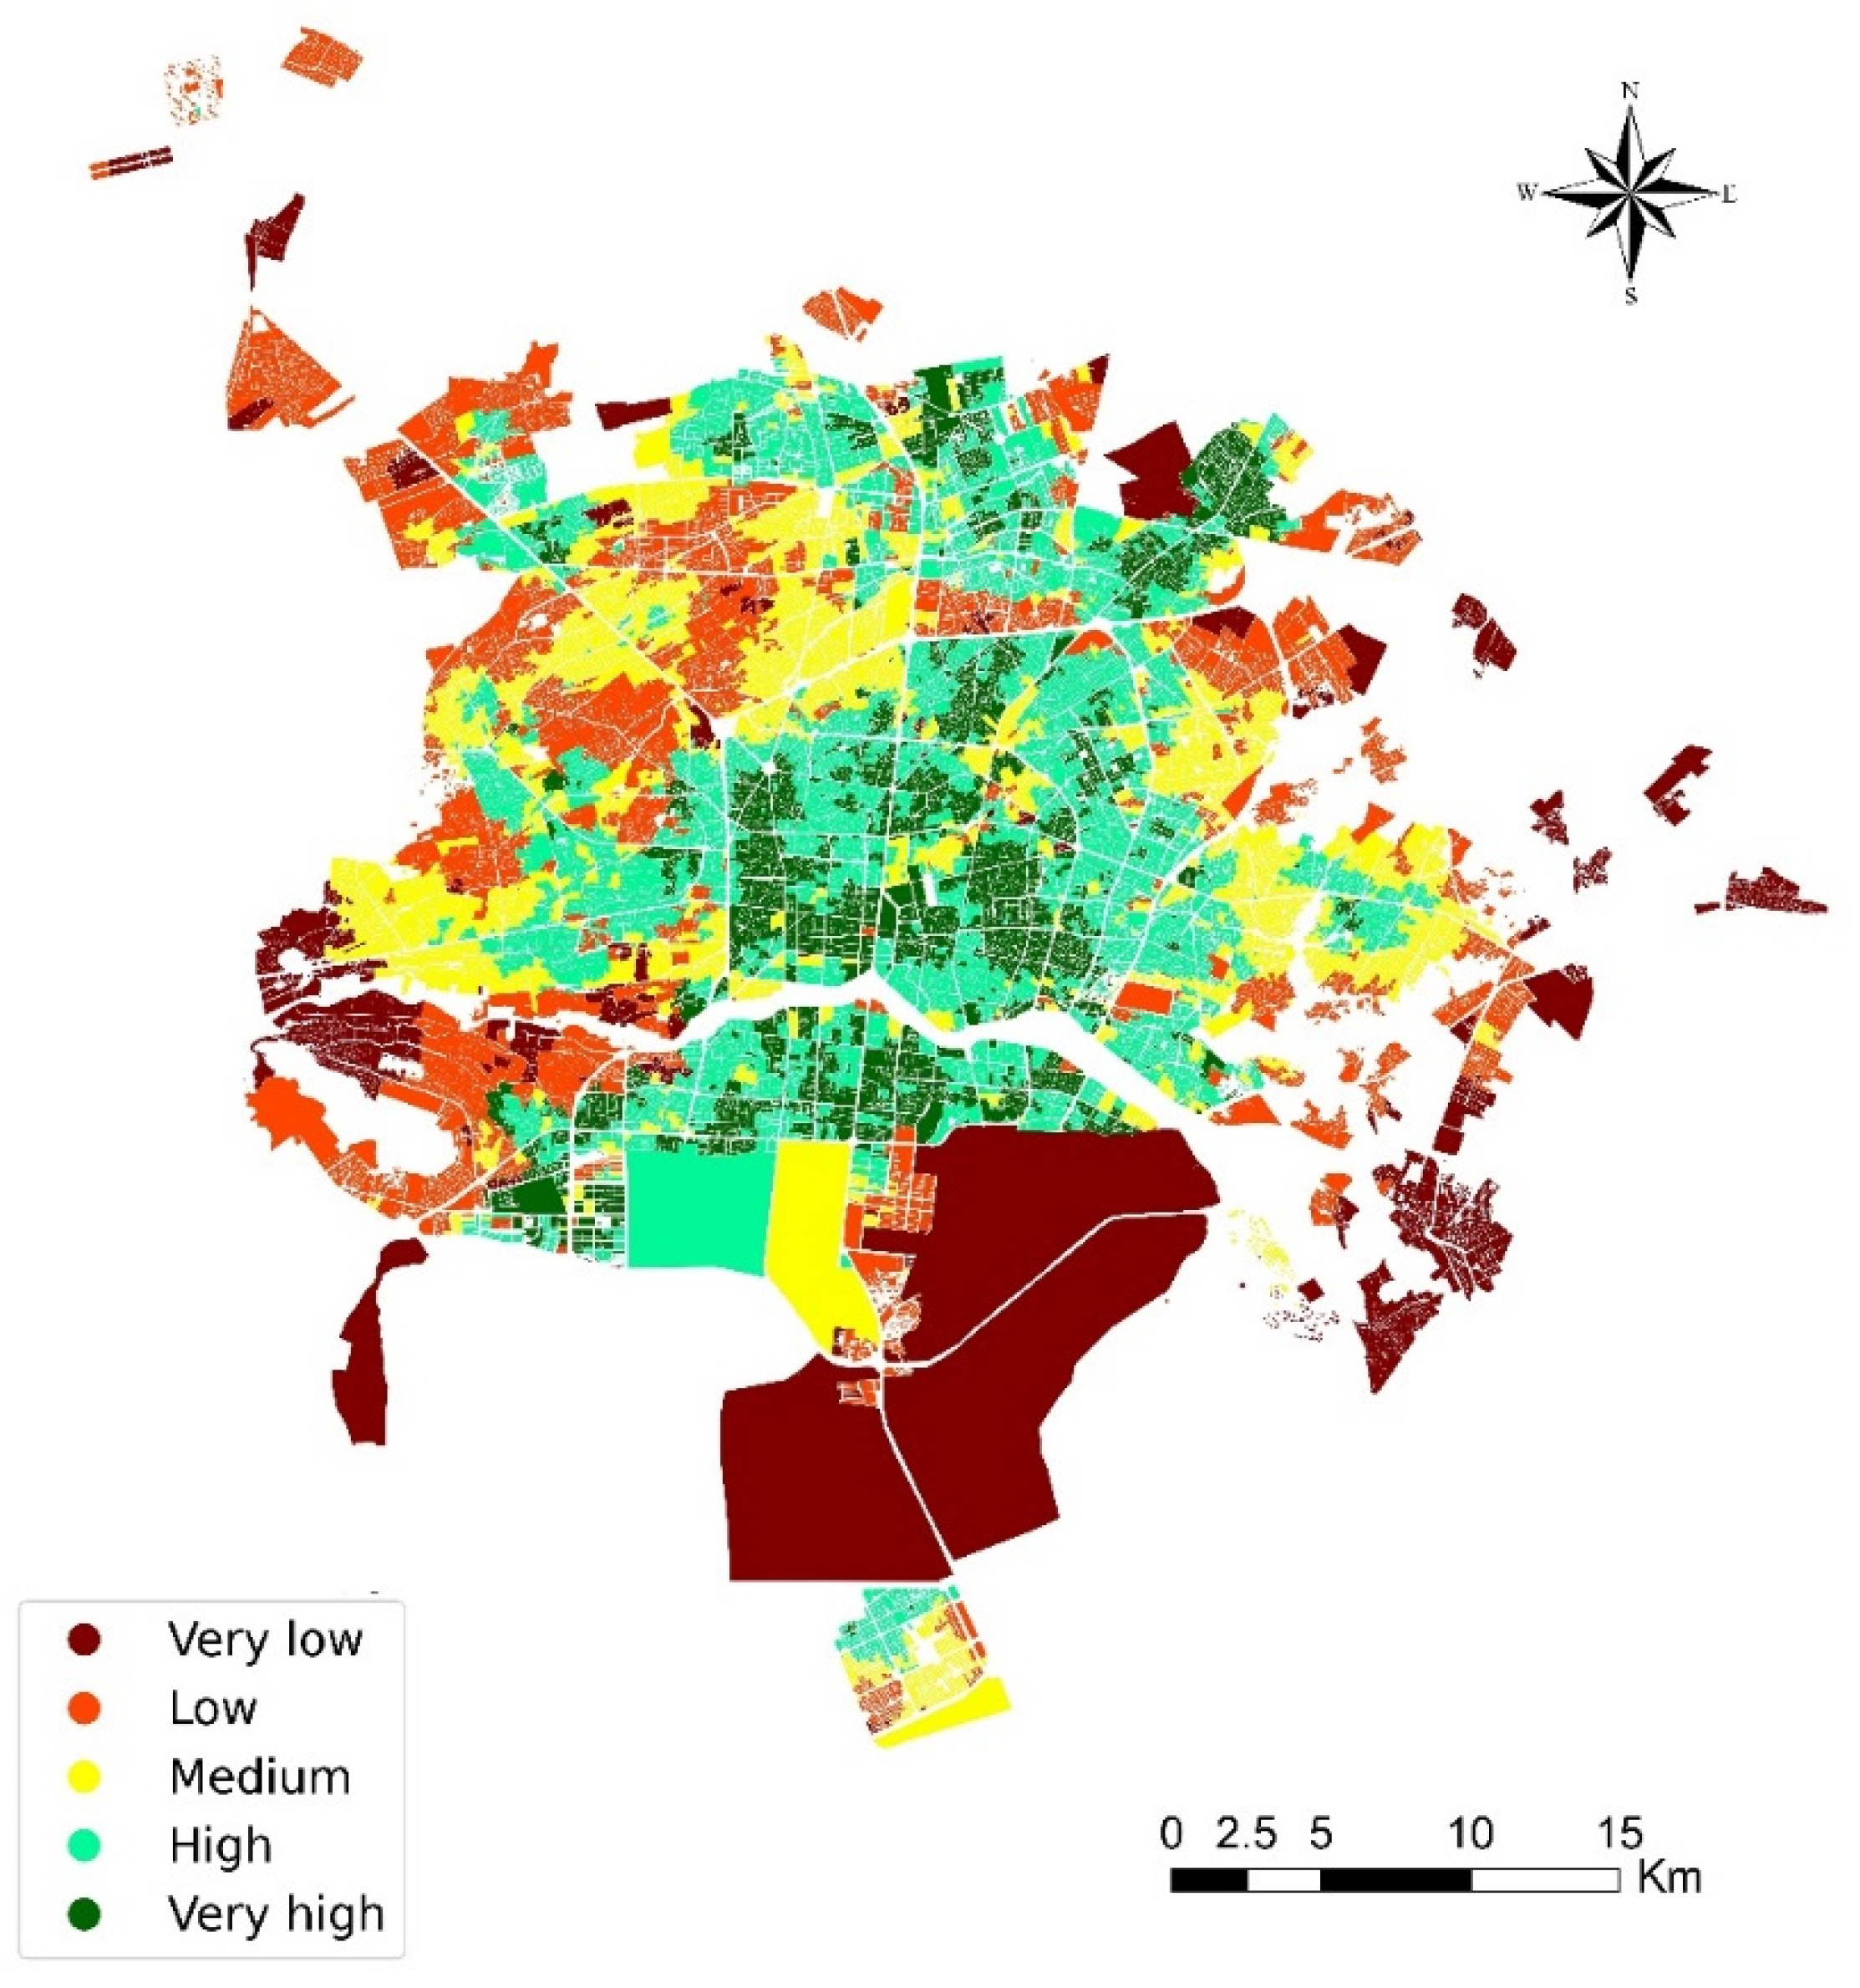
4.2.8. Spatial Accessibility Map
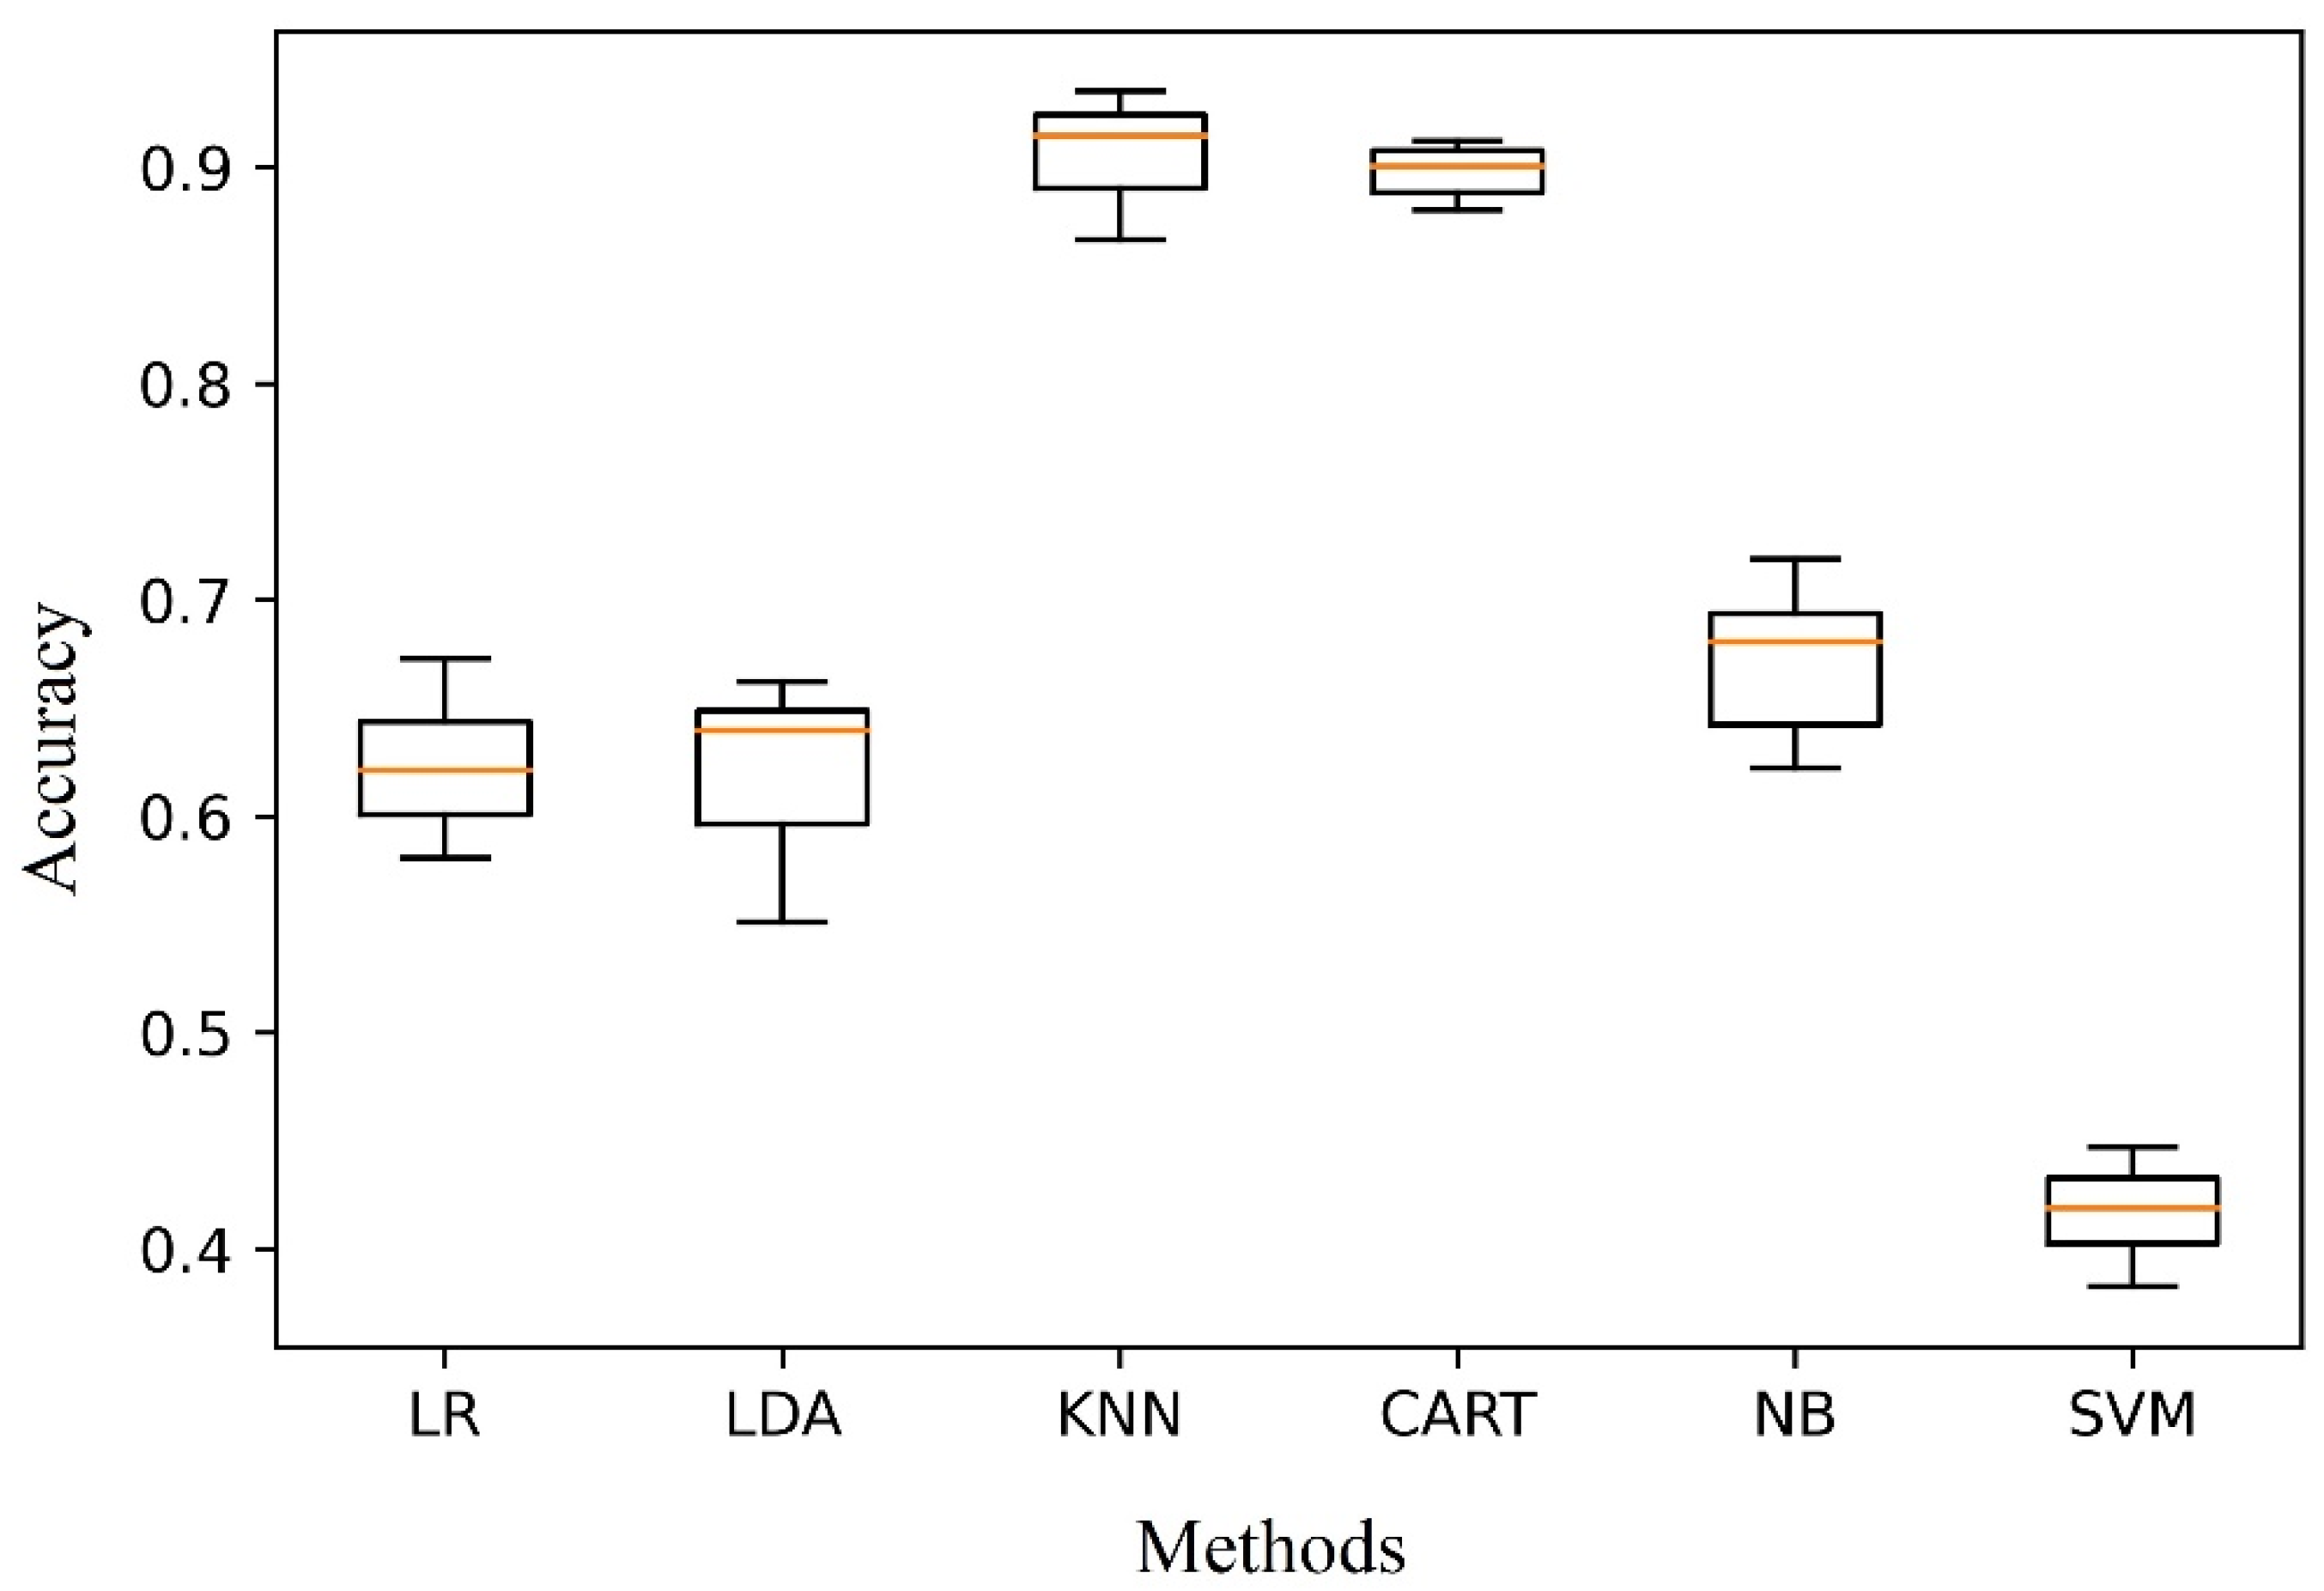
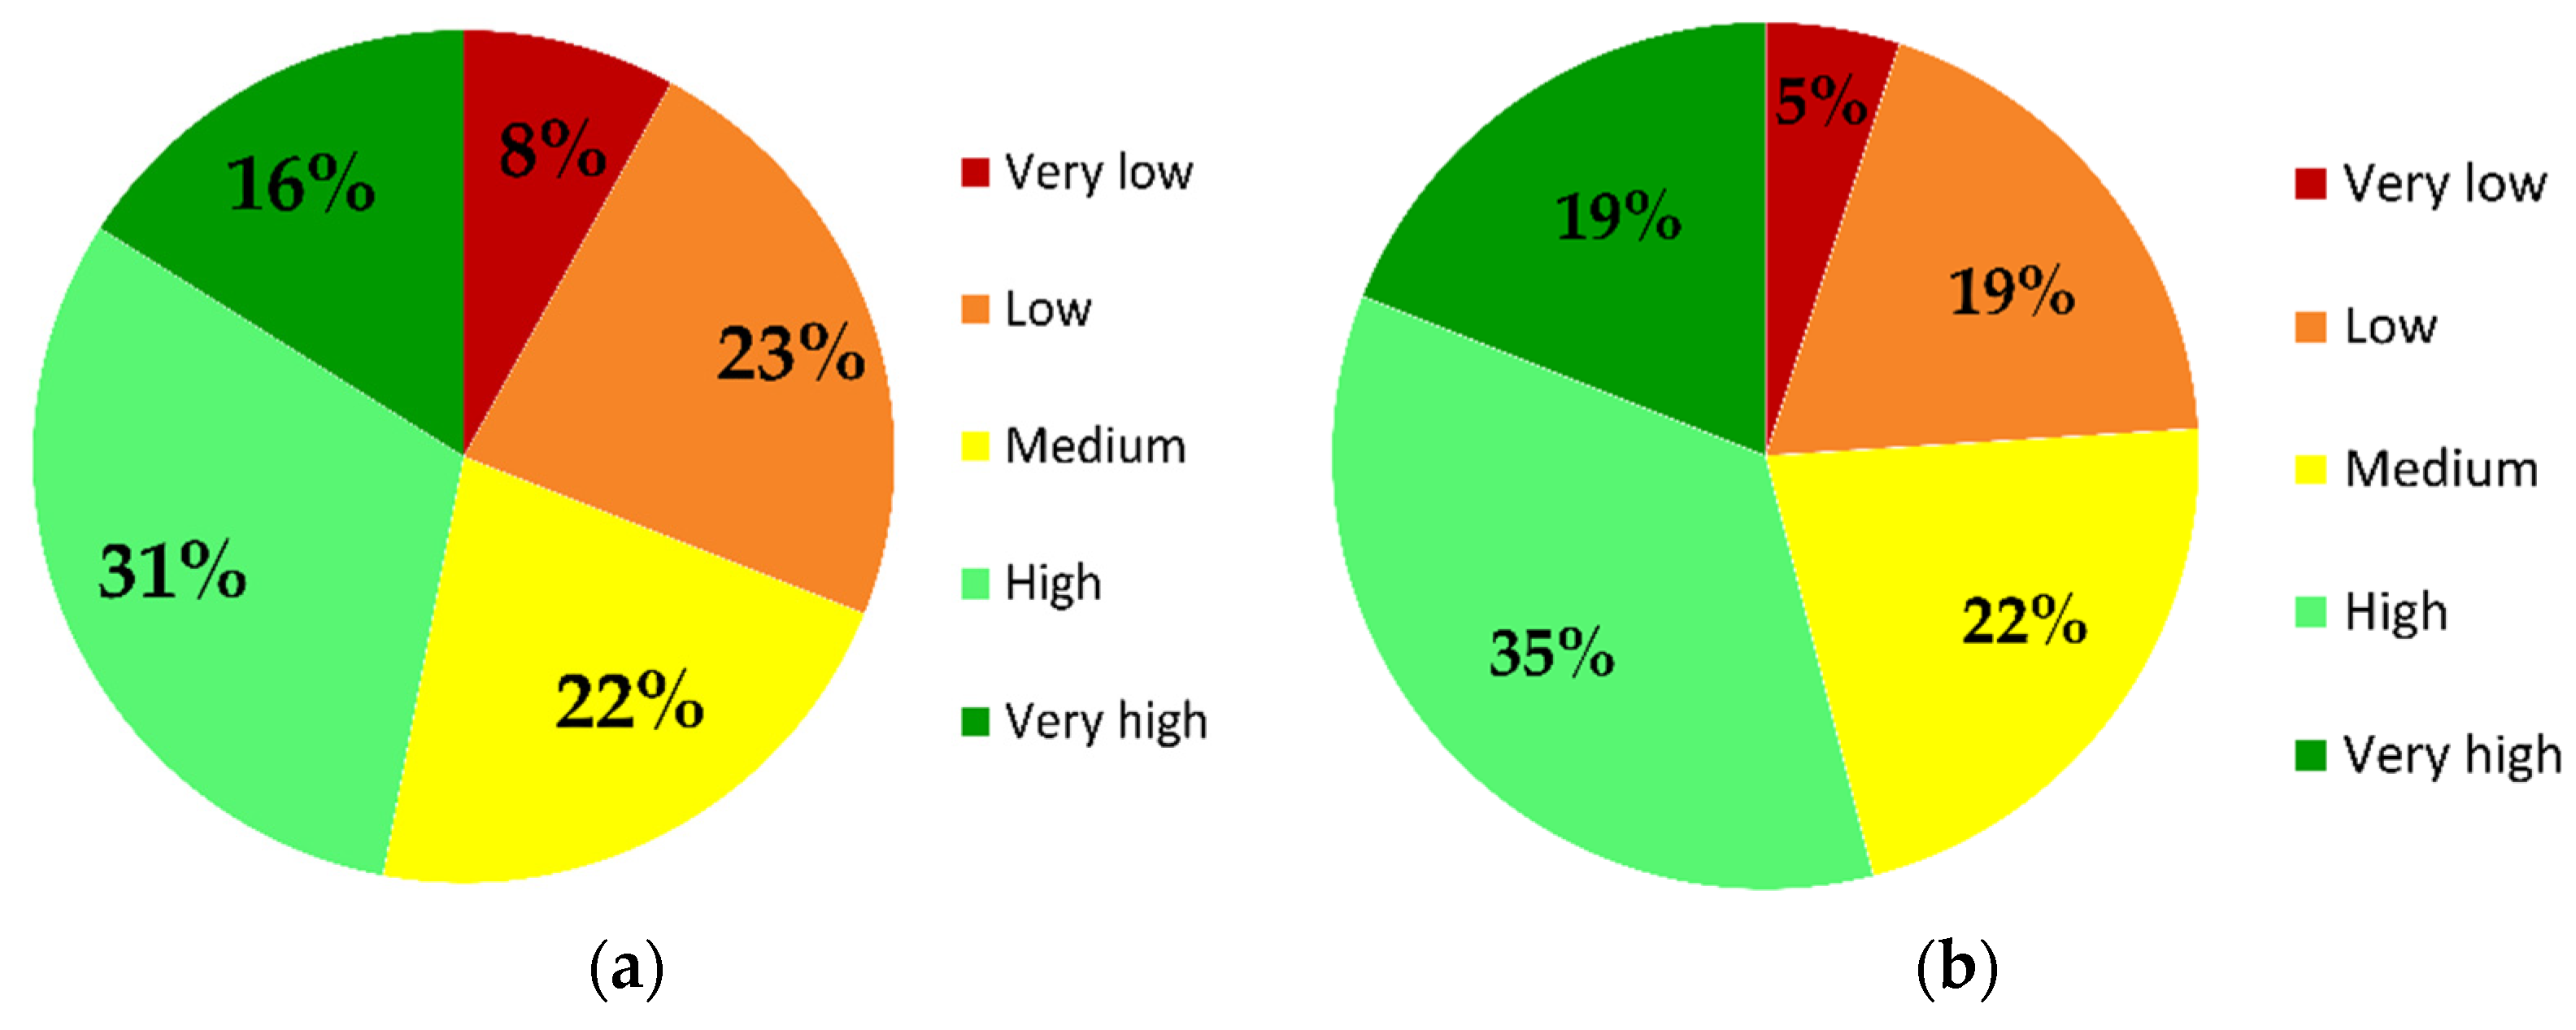
In this study, it is assumed that places that have the same spatial accessibility level by different methods are conclusive evidence. Therefore, the places can be training data for other places. In detail, supervised ML using conclusive evidence was applied to the study area for clustering.
The conclusive evidence was randomly split into a training set (80%) used for fitting the models and a test set (or validation set, 20%) on which accuracy was estimated. The six most common supervised learning algorithms include Logistic Regression (LR), Linear Discriminant Analysis (LDA), K-Nearest Neighbors (KNN), Classification and, Regression Trees (CART), Gaussian Naive Bayes (NB), and Support Vector Machines (SVM) [61] were compared to find the most accurate method. The KNN algorithm showed the best fit and accuracy on the dataset. Hence, the final map of spatial accessibility in the study area was obtained from KNN supervised ML.
Like all spatial models, the final spatial accessibility map contains uncertainty. There is a wide different and diverse sources of uncertainty in this study and similar research [62] such as ignorance of human knowledge and original data and measurement error. Regarding the many-sided source of uncertainty, this study did not tackle uncertainty problem.

5. Results

An unsupervised ML algorithm was used to segregate the study area, Isfahan, based on the spatial accessibility level of urban blocks to the nearest healthcare services. All parts of the proposed method were implemented in Python programming language. The most utilized Python’s packages in this study were scikit-learn for performing machine learning algorithms [63], and matplotlib package for visualizing results [64].
Figure 2 shows the computed distances from each block centroid to the closest immediate healthcare service.
As Figure 3 shows, the study variables are of different scales. A power transformation was used to transform the data to the same scale. The transformation converts variables to a Gaussian-like form that is essential for ML tasks. The results of the power transformation are shown in Figure 3.
The study variable was prioritized using a weighting method based on the Shannon entropy. Table 1 provides the results obtained from entropy weighting.
One of the great frustrations in performing a cluster analysis is determining the correct number of clusters. In this study, the elbow method that was utilized to find the optimal number of clusters reveals the number 5. Therefore, the clustering results were assigned to a 5-points Likert scale, including very low, low, medium, high, and very high spatial accessibility. Maroon color refers to the very low; orange shows the low; yellow is the medium; light green shows the high; and dark green means the very high spatial accessibility. Figure 4 is a graphical presentation of the elbow method result.
In this study, three different clustering methods were utilized. The results of the clustering methods, including K-Means, agglomerative, and bisecting K-Means, are presented in Figure 5, Figure 6 and Figure 7, respectively.
The intersection of the three methods, the places that have the same results by different methods, is shown in Figure 8.
The findings presented in Figure 7 were used as an input for supervised ML. A comparison between six algorithms in terms of accuracy was done to find the best supervised algorithms. As shown in Figure 9, the KNN and CART methods have higher accuracy than the other methods. Although KNN and CART methods do not differ significantly, KNN was selected for two reasons in this study. First, it is the most intuitive classifier, which is simple to understand and explain. Second, KNN is non-parametric. Therefore, it does not have any assumptions about the shape of the data distribution [65].
The final map of spatial accessibility in the study area was obtained from a KNN ML clustering and is presented in Figure 10.
The quantified results of the study are shown in Figure 11. These charts show the proportion of each cluster in the study.

6. Discussion

This paper demonstrates the potential applications of ML clustering methods to group city blocks based on the spatial accessibility to the nearest healthcare services in Isfahan. Regarding spatial accessibility, it is an unsupervised problem in terms of clustering. Hence, in this study, the spatial accessibility of the study area was evaluated using three unsupervised clustering methods. The intersection of the three methods is considered to be conclusive evidence. Using conclusive evidence, the best supervised clustering method for the study data in terms of accuracy, KNN, was applied to compose the spatial accessibility final map. The final results of the study are categorized into five clusters.
Almost 31% of blocks have a low or very low level of spatial accessibility, and 47% have a high or very high level. Therefore, it can be said that most of the study area has a good level of spatial accessibility, according to our study results. If we split the study area into three columns, most of the blocks with a very high or high spatial accessibility fall within the central column. The most notable feature in this part is a historical avenue, Chaharbagh. This path connects the northern sections of the city to the southern ones and is about 6 km long. Like many commercial properties, healthcare services have been established near the avenue. It is essential to highlight that the study considers the people within the city border. Therefore, this study ignores people living outside the city boundary and using the city healthcare facilities [66].
Furthermore, except for the north of the study area, the margin blocks have the lowest spatial accessibility level. The presence of healthcare services in the northern areas and a health complex led to a good level of spatial accessibility in the parts. The spatial accessibility level increases by moving from margin areas to the study area center. The most apparent reason for the finding is a clear imbalance between urban sprawl and healthcare services distribution [67].

7. Conclusions

Using ML, this study examined spatial accessibility to four healthcare services, including hospitals, pharmacies, clinics, and medical laboratories in Isfahan. Like many urban sustainability problems, spatial accessibility is a type of unsupervised learning for a machine. This study suggests a framework for mapping spatial accessibility using unsupervised and supervised ML methods. The framework can be used for other urban services and many urban environmental problems.
This study categorizes the area into five groups regarding spatial accessibility, providing helpful information for policymakers to allocate health resources. This study has found that almost 47%, 22%, and 31% of the study area have rich, medium, and poor spatial accessibility, respectively. The research has also shown that if we split the study area into three columns, the central part has the best spatial accessibility situation. Furthermore, the study suggests that margin areas have the lowest levels of spatial accessibility. The findings will be of interest to decide the place of new healthcare services or change of the existing services. Additionally, the study results would be useful in emergency conditions since the proposed method is independent of supply and demand values and the model variables are the shortest path to the nearest healthcare services.
The scope of this study was limited in terms of the supply and demand rates. Notwithstanding the limitation, the study offers insights into the impedance between census blocks and healthcare services. More information on the supply and demand rates would help us establish a higher accuracy on this matter. Hence, a natural progression of this work is to analyze spatial accessibility considering the amount of supply in services and the amount of demand in census blocks. As the final point, this study considers healthcare services and census blocks to be two-dimensional (latitude and longitude) points. In practice, a healthcare service may be on n-floor of a building. In addition, the census blocks have different heights. For example, people who live on n-floor of a skyscraper would have lower accessibility than people who live at ground level [68]. Therefore, new insights about the current situation of spatial accessibility are gained if three-dimensional variables are included in this study.

Author Contributions

Conceptualization: A.K.K. and H.R.-D.; methodology: A.K.K., F.A. and Y.R.; formal analysis, writing—original draft preparation: A.K.K.; software, visualization: F.A. and Y.R.; supervision, funding acquisition: H.R.-D.; investigation: A.K.K., F.A., H.R.-D. and Y.R.; data curation: A.K.K., F.A. and R.S.; writing—review and editing: H.R.-D., F.A. and Y.R.; project administration H.R.-D. and R.S. All authors have read and agreed to the published version of the manuscript.

Funding

This study is the result of a research proposal approved by the Isfahan University of Medical Sciences with approval code of 298151 and ethical code of IR.MUI.RESEARCH.REC.1398.632.

Institutional Review Board Statement

The study was conducted in accordance with the Declaration of Helsinki, and approved by the Ethics Committee of Isfahan University of Medical Sciences (IR.MUI.RESEARCH.REC.1398.632.).

Informed Consent Statement

Not applicable.

Data Availability Statement

We agree MDPI Research Data Policies.

Conflicts of Interest

The authors declare no conflict of interest.

References

  1. Liburd, L.C.; Giles, W.; Jack, L., Jr. Health Equity: The Cornerstone of a Healthy Community. Natl. Civ. Rev. 2013, 102, 52–54. [Google Scholar] [CrossRef]
  2. Banks, J. Storytelling to Access Social Context and Advance Health Equity Research. Prev. Med. 2012, 55, 394–397. [Google Scholar] [PubMed]
  3. Johnson, J.D. Symbolic Innovations: Lessons from Health Services and Higher Education Organizations; Universal-Publishers: Irvine, CA, USA, 2017. [Google Scholar]
  4. Wakefield, M.; Williams, D.R.; Le Menestrel, S.; Flaubert, J.L. The Future of Nursing 2020–2030: Charting a Path to Achieve Health Equity; National Academy of Sciences: Washington, DC, USA, 2021. [Google Scholar]
  5. WHO. Quality and Accreditation in Health Care Services: A Global Review; WHO: Geneva, Switzerland, 2003.
  6. Rabiei-Dastjerdi, H.; Matthews, S.A. Who Gets What, Where, and How Much? Composite Index of Spatial Inequality for Small Areas in Tehran. Reg. Sci. Policy Pract. 2021, 13, 191–205. [Google Scholar] [CrossRef]
  7. Levesque, J.-F.; Harris, M.F.; Russell, G. Patient-Centred Access to Health Care: Conceptualising Access at the Interface of Health Systems and Populations. Int. J. Equity Health 2013, 12, 18. [Google Scholar] [CrossRef] [Green Version]
  8. Rabiei-Dastjerdi, H.; Matthews, S.A.; Ardalan, A. Measuring Spatial Accessibility to Urban Facilities and Services in Tehran. Spat. Demogr. 2018, 6, 17–34. [Google Scholar] [CrossRef]
  9. Rabiei-Dastjerdi, H.; McArdle, G.; Matthews, S.A.; Keenan, P. Gap analysis in decision support systems for real-estate in the era of the digital earth. Int. J. Digit. Earth. 2021, 14, 121–138. [Google Scholar] [CrossRef]
  10. Rabiei-Dastjerdi, H.; Matthews, S. Isfahan City Hospitals, Iran, in the Context of Urban Growth: New Developments and Future Challenges. Health Inf. Manag. 2018, 15, 1–2. [Google Scholar]
  11. Sharifzadegan, M.H.; Mamdohi, M.R. A P-Median-Model-Based Analysis of Spatial Inequality in Accessibility to Public Health Care Intended for Urban Health Development in Isfahan City. Soc. Welf. Q. 2010, 10, 265–285. [Google Scholar]
  12. Geurs, K.T.; De Montis, A.; Reggiani, A. Recent Advances and Applications in Accessibility Modelling. Comput. Environ. Urban Syst. 2015, 49, 82–85. [Google Scholar]
  13. Ricketts, T.C.; Goldsmith, L.J.; Holmes, G.M.; Randy, M.R.P.; Lee, R.; Taylor, D.H.; Ostermann, J. Designating Places and Populations as Medically Underserved: A Proposal for a New Approach. J. Health Care Poor Underserved 2007, 18, 567–589. [Google Scholar] [CrossRef]
  14. Drake, C.; Nagy, D.; Nguyen, T.; Kraemer, K.L.; Mair, C.; Wallace, D.; Donohue, J. A Comparison of Methods for Measuring Spatial Access to Health Care. Health Serv. Res. 2021, 56, 777–787. [Google Scholar] [CrossRef]
  15. Radke, J.; Mu, L. Spatial Decompositions, Modeling and Mapping Service Regions to Predict Access to Social Programs. Geogr. Inf. Sci. 2000, 6, 105–112. [Google Scholar]
  16. Fyer, G.E., Jr.; Drisko, J.; Krugman, R.D.; Vojir, C.P.; Prochazka, A.; Miyoshi, T.J.; Miller, M.E. Multi-Method Assessment of Access to Primary Medical Care in Rural Colorado. J. Rural. Health 1999, 15, 113–121. [Google Scholar] [CrossRef] [PubMed]
  17. McGrail, M.R. Spatial Accessibility of Primary Health Care Utilising the Two Step Floating Catchment Area Method: An Assessment of Recent Improvements. Int. J. Health Geogr. 2012, 11, 50. [Google Scholar]
  18. Dutt, A.K.; Dutta, H.M.; Jaiswal, J.; Monroe, C. Assessment of Service Adequacy of Primary Health Care Physicians in a Two County Region of Ohio, USA. GeoJournal 1986, 12, 443–455. [Google Scholar] [CrossRef]
  19. Luo, W.; Wang, F. Measures of Spatial Accessibility to Health Care in a GIS Environment: Synthesis and a Case Study in the Chicago Region. Environ. Plan. B Plan. Des. 2003, 30, 865–884. [Google Scholar] [CrossRef] [Green Version]
  20. Joseph, A.E.; Bantock, P.R. Measuring Potential Physical Accessibility to General Practitioners in Rural Areas: A Method and Case Study. Soc. Sci. Med. 1982, 16, 85–90. [Google Scholar] [CrossRef]
  21. Wang, F.; Luo, W. Assessing Spatial and Nonspatial Factors for Healthcare Access: Towards an Integrated Approach to Defining Health Professional Shortage Areas. Health Place 2005, 11, 131–146. [Google Scholar] [CrossRef]
  22. Luo, W.; Qi, Y. An Enhanced Two-Step Floating Catchment Area (E2SFCA) Method for Measuring Spatial Accessibility to Primary Care Physicians. Health Place 2009, 15, 1100–1107. [Google Scholar] [CrossRef]
  23. Pei, X.; Guo, P.; Chen, Q.; Li, J.; Liu, Z.; Sun, Y.; Zhang, X. An Improved Multi-Mode Two-Step Floating Catchment Area Method for Measuring Accessibility of Urban Park in Tianjin, China. Sustainability 2022, 14, 11592. [Google Scholar] [CrossRef]
  24. Delamater, P.L. Spatial Accessibility in Suboptimally Configured Health Care Systems: A Modified Two-Step Floating Catchment Area (M2SFCA) Metric. Health Place 2013, 24, 30–43. [Google Scholar] [CrossRef]
  25. Saxon, J.; Snow, D. A Rational Agent Model for the Spatial Accessibility of Primary Health Care. Ann. Am. Assoc. Geogr. 2020, 110, 205–222. [Google Scholar] [CrossRef]
  26. Chen, X.; Jia, P. A Comparative Analysis of Accessibility Measures by the Two-Step Floating Catchment Area (2SFCA) Method. Int. J. Geogr. Inf. Sci. 2019, 33, 1739–1758. [Google Scholar] [CrossRef]
  27. Luo, S.; Jiang, H.; Yi, D.; Liu, R.; Qin, J.; Liu, Y.; Zhang, J. PM2SFCA: Spatial Access to Urban Parks, Based on Park Perceptions and Multi-Travel Modes. A Case Study in Beijing. ISPRS Int. J. Geo-Inf. 2022, 11, 488. [Google Scholar] [CrossRef]
  28. Xing, L.; Liu, Y.; Wang, B.; Wang, Y.; Liu, H. An Environmental Justice Study on Spatial Access to Parks for Youth by Using an Improved 2SFCA Method in Wuhan, China. Cities 2020, 96, 102405. [Google Scholar] [CrossRef]
  29. Alahmari, N.; Alswedani, S.; Alzahrani, A.; Katib, I.; Albeshri, A.; Mehmood, R. Musawah: A Data-Driven AI Approach and Tool to Co-Create Healthcare Services with a Case Study on Cancer Disease in Saudi Arabia. Sustainability 2022, 14, 3313. [Google Scholar] [CrossRef]
  30. Rajamoorthy, R.; Arunachalam, G.; Kasinathan, P.; Devendiran, R.; Ahmadi, P.; Pandiyan, S.; Muthusamy, S.; Panchal, H.; Kazem, H.A.; Sharma, P. A Novel Intelligent Transport System Charging Scheduling for Electric Vehicles Using Grey Wolf Optimizer and Sail Fish Optimization Algorithms. Energy Sources Part A Recovery Util. Environ. Eff. 2022, 44, 3555–3575. [Google Scholar] [CrossRef]
  31. Bosnić, Z.; Kononenko, I. An Overview of Advances in Reliability Estimation of Individual Predictions in Machine Learning. Intell. Data Anal. 2009, 13, 385–401. [Google Scholar] [CrossRef] [Green Version]
  32. Sharma, P.; Sahoo, B.B.; Said, Z.; Hadiyanto, H.; Nguyen, X.P.; Nižetić, S.; Huang, Z.; Hoang, A.T.; Li, C. Application of Machine Learning and Box-Behnken Design in Optimizing Engine Characteristics Operated with a Dual-Fuel Mode of Algal Biodiesel and Waste-Derived Biogas. Int. J. Hydrogen Energy 2022. [Google Scholar] [CrossRef]
  33. Kang, M.; Jameson, N.J. Machine Learning: Fundamentals. Progn. Health Manag. Electron. Fundam. Mach. Learn. Internet Things 2018, 85–109. [Google Scholar] [CrossRef]
  34. Saravanan, R.; Sujatha, P. A State of Art Techniques on Machine Learning Algorithms: A Perspective of Supervised Learning Approaches in Data Classification. In Proceedings of the 2018 Second International Conference on Intelligent Computing and Control Systems (ICICCS), Madurai, India, 14–15 June 2018; pp. 945–949. [Google Scholar]
  35. Celebi, M.E.; Aydin, K. Unsupervised Learning Algorithms; Springer: Berlin/Heidelberg, Germany, 2016. [Google Scholar]
  36. World Population Review Esfahan Population 2022 (Demographics, Maps, Graphs). Available online: https://worldpopulationreview.com/world-cities/esfahan-population (accessed on 17 September 2022).
  37. Statistical Center of Iran Statistical Center of Iran. Available online: https://irandataportal.syr.edu/census/census-2016 (accessed on 17 September 2022).
  38. Rabiei-Dastjerdi, H.; Matthews, S.A. The Potential Contributions of Geographic Information Science to the Study of Social Determinants of Health in Iran. J. Educ. Health Promot. 2018, 7, 17. [Google Scholar]
  39. Lange, T.; Law, M.H.C.; Jain, A.K.; Buhmann, J.M. Learning with Constrained and Unlabelled Data. In Proceedings of the 2005 IEEE Computer Society Conference on Computer Vision and Pattern Recognition (CVPR’05), San Diego, CA, USA, 20–25 June 2005; Volume 1, pp. 731–738. [Google Scholar]
  40. Kirsten, M.; Wrobel, S. Relational Distance-Based Clustering. In Proceedings of the International Conference on Inductive Logic Programming, Madison, WI, USA, 22–24 July 1998; pp. 261–270. [Google Scholar]
  41. Murtagh, F.; Contreras, P. Algorithms for Hierarchical Clustering: An Overview. Wiley Interdiscip. Rev. Data Min. Knowl. Discov. 2012, 2, 86–97. [Google Scholar]
  42. Ahmed, M.; Seraj, R.; Islam, S.M.S. The K-Means Algorithm: A Comprehensive Survey and Performance Evaluation. Electronics 2020, 9, 1295. [Google Scholar] [CrossRef]
  43. Likas, A.; Vlassis, N.; Verbeek, J.J. The Global K-Means Clustering Algorithm. Pattern Recognit. 2003, 36, 451–461. [Google Scholar] [CrossRef] [Green Version]
  44. Bouguettaya, A.; Yu, Q.; Liu, X.; Zhou, X.; Song, A. Efficient Agglomerative Hierarchical Clustering. Expert Syst. Appl. 2015, 42, 2785–2797. [Google Scholar] [CrossRef]
  45. Savaresi, S.M.; Boley, D.L. A Comparative Analysis on the Bisecting K-Means and the PDDP Clustering Algorithms. Intell. Data Anal. 2004, 8, 345–362. [Google Scholar] [CrossRef] [Green Version]
  46. Johnson, D.B. A Note on Dijkstra’s Shortest Path Algorithm. J. ACM 1973, 20, 385–388. [Google Scholar] [CrossRef]
  47. Hagberg, A.A.; Schult, D.A.; Swart, P.J. Exploring Network Structure, Dynamics, and Function Using NetworkX. In Proceedings of the 7th Python in Science Conference, Pasadena, CA, USA, 19–24 August 2008; pp. 11–15. [Google Scholar]
  48. Jing, L.; Ng, M.K.; Huang, J.Z. An Entropy Weighting K-Means Algorithm for Subspace Clustering of High-Dimensional Sparse Data. IEEE Trans. Knowl. Data Eng. 2007, 19, 1026–1041. [Google Scholar]
  49. Bromiley, P.A.; Thacker, N.A.; Bouhova-Thacker, E. Shannon Entropy, Renyi Entropy, and Information. Stat. Inf. Ser. 2004, 9, 10–42. [Google Scholar]
  50. Mohamad, I.B.; Usman, D. Standardization and Its Effects on K-Means Clustering Algorithm. Res. J. Appl. Sci. Eng. Technol. 2013, 6, 3299–3303. [Google Scholar] [CrossRef]
  51. Maes, C.; Redig, F.; Moffaert, A. Van On the Definition of Entropy Production, via Examples. J. Math. Phys. 2000, 41, 1528–1554. [Google Scholar] [CrossRef] [Green Version]
  52. Wu, J.; Chen, X.-Y.; Zhang, H.; Xiong, L.-D.; Lei, H.; Deng, S.-H. Hyperparameter Optimization for Machine Learning Models Based on Bayesian Optimization. J. Electron. Sci. Technol. 2019, 17, 26–40. [Google Scholar]
  53. Yeo, I.; Johnson, R.A. A New Family of Power Transformations to Improve Normality or Symmetry. Biometrika 2000, 87, 954–959. [Google Scholar] [CrossRef]
  54. Beaulieu, N.C.; Hemachandra, K.T. Novel Simple Representations for Gaussian Class Multivariate Distributions with Generalized Correlation. IEEE Trans. Inf. Theory 2011, 57, 8072–8083. [Google Scholar]
  55. Rahmani, Y.; Alizadeh, M.M.; Schuh, H.; Wickert, J.; Tsai, L.-C. Probing Vertical Coupling Effects of Thunderstorms on Lower Ionosphere Using GNSS Data. Adv. Space Res. 2020, 66, 1967–1976. [Google Scholar] [CrossRef]
  56. Patil, C.; Baidari, I. Estimating the Optimal Number of Clusters k in a Dataset Using Data Depth. Data Sci. Eng. 2019, 4, 132–140. [Google Scholar]
  57. Bholowalia, P.; Kumar, A. EBK-Means: A Clustering Technique Based on Elbow Method and k-Means in WSN. Int. J. Comput. Appl. 2014, 105, 17–24. [Google Scholar]
  58. Teknomo, K. K-Means Clustering Tutorial. Medicine 2006, 100, 3. [Google Scholar]
  59. Müllner, D. Modern Hierarchical, Agglomerative Clustering Algorithms. arXiv 2011, arXiv:1109.2378. [Google Scholar]
  60. Steinbach, M.; Karypis, G.; Kumar, V. A Comparison of Document Clustering Techniques. 2000. Available online: https://conservancy.umn.edu/handle/11299/215421 (accessed on 17 September 2022).
  61. Ahsan, M.M.; Mahmud, M.A.P.; Saha, P.K.; Gupta, K.D.; Siddique, Z. Effect of Data Scaling Methods on Machine Learning Algorithms and Model Performance. Technologies 2021, 9, 52. [Google Scholar] [CrossRef]
  62. Alimohammadi, A.; Rabiei, H.R.; Firouzabadi, P.Z. A New Approach for Modeling Uncertainty in Remote Sensing Change Detection Process. In Proceedings of the 12th International Conference on Geoinformatics-Geospatial Information Research: Bridging the Pacific and Atlantic, Gävle, Sweden, 7–9 June 2004; pp. 7–9. [Google Scholar]
  63. Pedregosa, F.; Varoquaux, G.; Gramfort, A.; Michel, V.; Thirion, B.; Grisel, O.; Blondel, M.; Prettenhofer, P.; Weiss, R.; Dubourg, V.; et al. Scikit-Learn: Machine Learning in {P}ython. J. Mach. Learn. Res. 2011, 12, 2825–2830. [Google Scholar]
  64. Hunter, J.D. Matplotlib: A 2D Graphics Environment. Comput. Sci. Eng. 2007, 9, 90–95. [Google Scholar] [CrossRef]
  65. Goldberger, J.; Hinton, G.E.; Roweis, S.; Salakhutdinov, R.R. Neighbourhood Components Analysis. In Proceedings of the Advances in Neural Information Processing Systems; Saul, L., Weiss, Y., Bottou, L., Eds.; MIT Press: Cambridge, MA, USA, 2004; Volume 17. [Google Scholar]
  66. Rabiei-Dastjerdi, H.; Amini, S.; McArdle, G.; Homayouni, S. City-Region or City? That Is the Question: Modelling Sprawl in Isfahan Using Geospatial Data and Technology. GeoJournal 2022, 1–21. [Google Scholar] [CrossRef]
  67. Zeaiean, P.; Rabiei, H.R.; Alimohamadi, A. Detection of Land Use/Cover Changes of Isfahan by Agricultural Lands Around Urban Area Using Remote Sensing and GIS Technologies. J. Spat. Plan. 2005, 9, 41–54. [Google Scholar]
  68. Kazazi, A.K.; Rabiei-Dastjerdi, H.; McArdle, G. Emerging Paradigm Shift in Urban Indicators: Integration of the Vertical Dimension. J. Environ. Manag. 2022, 316, 115234. [Google Scholar] [CrossRef]
Figure 1. Study area.
Sustainability 14 14106 g001
Figure 2. The distance of blocks to the nearest healthcare services. (a) Distance to the nearest hospital; (b) Distance to the nearest clinic; (c) Distance to the nearest pharmacy; (d) Distance to the nearest laboratory.
Sustainability 14 14106 g002aSustainability 14 14106 g002b
Figure 3. Histogram of variables before and after normalization and standardization. (a) Original and transformed distances to the nearest hospital; (b) Original and transformed distances to the nearest clinic; (c) Original and transformed distances to the nearest pharmacy; (d) Original and transformed distances to the nearest laboratory.
Sustainability 14 14106 g003aSustainability 14 14106 g003bSustainability 14 14106 g003c
Figure 4. The result of the elbow method.
Sustainability 14 14106 g004
Figure 5. The result of K-Means clustering.
Sustainability 14 14106 g005
Figure 6. The result of agglomerative clustering.
Sustainability 14 14106 g006
Figure 7. The result of bisecting K-Means clustering.
Sustainability 14 14106 g007
Figure 8. The blocks with the same results by different methods.
Sustainability 14 14106 g008
Figure 9. The comparison of supervised clustering methods in terms of accuracy. The accuracy of each method is displayed as a boxplot including minimum, first quartile, median, third quartile, and maximum accuracy values.
Sustainability 14 14106 g009
Figure 10. The final spatial accessibility map of Isfahan, Iran.
Sustainability 14 14106 g010
Figure 11. The proportion of each cluster in the study area (a) The percentage of blocks in each cluster; (b) The percentage of population in each cluster.
Sustainability 14 14106 g011
Table 1. Entropy weighting results.
VariableEntropy Weight
Distance to the nearest hospital0.174
Distance to the nearest clinic0.266
Distance to the nearest pharmacy0.310
Distance to the nearest medical laboratory0.250
Publisher’s Note: MDPI stays neutral with regard to jurisdictional claims in published maps and institutional affiliations.

