Article

A Study on Identifying Priority Management Areas and Implementing Best Management Practice for Effective Management of Nonpoint Source Pollution in a Rural Watershed, Korea

1
National Institute of Environmental Research, Incheon 22689, Korea
2
Yeongsan River Environment Research Center, National Institute of Environmental Research, Gwangju 61011, Korea
*
Author to whom correspondence should be addressed.
Sustainability 2022, 14(21), 13999; https://doi.org/10.3390/su142113999
Submission received: 24 August 2022 / Revised: 21 September 2022 / Accepted: 30 September 2022 / Published: 27 October 2022
(This article belongs to the Special Issue Integrated Watershed Management for Adaptation to Climate Change)

Abstract

:
It is difficult to accurately identify and manage the paths of nonpoint source (NPS) pollution in rural watersheds because their discharge patterns vary depending on season, region, and agricultural characteristics. In this study, flow and water quality during rainfall events were monitored in Songya watershed, an impaired, rural area in South Korea. A method of identifying priority management areas was proposed through scientific objectification and quantification of key factors controlling NPS, such as land use, agricultural type, and load. For the load calculation, a watershed model was developed using Hydrological Simulation Program Fortran (HSPF). Three priority management areas—Mulhan Stream, Osan Stream, and the upstream area of Songya Stream—were selected. Using the developed model, constructed wetlands with the capacity of 1000 m3 were applied at the lower reach of each priority management subbasin and the impacts on NPS pollution reduction were tested. The simulated results showed that BOD and TP concentrations at the outlet of Songya watershed were lowered by 9.2% and 6.0%, respectively. It is expected that the method proposed in this study for identifying priority management areas and implementing best management practice in agricultural watersheds can be applied to similar areas which struggled with NPS pollution.

1. Introduction

The farmland area in South Korea has decreased by approximately 281,000 ha for 17 years from 1,846,000 ha in 2003 to 1,565,000 ha in 2020 due to urban expansion, including roads and construction. Among the nonpoint source (NPS) pollutants generated in the four major rivers in 2020, however, the land sector represented the second highest proportion of agriculture-related pollutants with 39.3% of biochemical oxygen demand (BOD) and 48.6% of total phosphorus (TP), after the livestock sector. In particular, the discharge load of TP from fields and paddies in the land sector (16.2 tons/day (22.2%)) is higher than that from the impervious surface of land (4.4 tons/day (6.0%)), indicating that it is still highly necessary to manage NPSs in rural areas [1]. In Korea, the rural NPS problem still stands as one of the major NPS issues, despite various efforts including the NPS reduction project which started in 2007 and 113.6 billion South Korea won (KRW) of funding invested through the best management practices (BMPs) into rural areas in 2019 at the Ministry of Environment of Korea [1]. Rural NPSs refer to NPS pollutants that occur when the pollutants accumulated on the agricultural land surface, such as farmland, livestock housing, and mountain areas, are introduced into rivers during rainfall. Major NPSs for fields and paddies are agricultural drainage containing nutrients due to the use of pesticides and fertilizers and soil erosion during rainfall and the discharge of agricultural residues. This is because it is difficult to find clear discharge paths through existing farming methods, and practical management of livestock manure is difficult as most of it is converted into resources, such as compost and liquid manure, to apply in farmlands. For fields in particular, the largest problem is the discharge of soil particles that contain high-concentration nutrients due to the use of compost, including livestock manure. In the livestock sector, a large amount of NPSs is discharged during rainfall because most unregulated livestock farms are not properly managed except large-scale livestock facilities [2]. The discharge of NPSs during farming and production periods needs to be managed, but it is very difficult to identify the amount and properties of NPSs because rural NPSs are widely discharged through unspecific areas and ways different depending on the season, farming method, and region. Therefore, in this study, a representative agricultural watershed was selected, and an objective method to find NPS paths occurring during rainfall was prepared in consideration of pollution source status (land use), type of agriculture, the load generated, and the load discharged. This study selected priority management areas based on the method, as well as applicable facilities for NPS reduction, to improve the water quality of rivers.

2. Materials and Methods
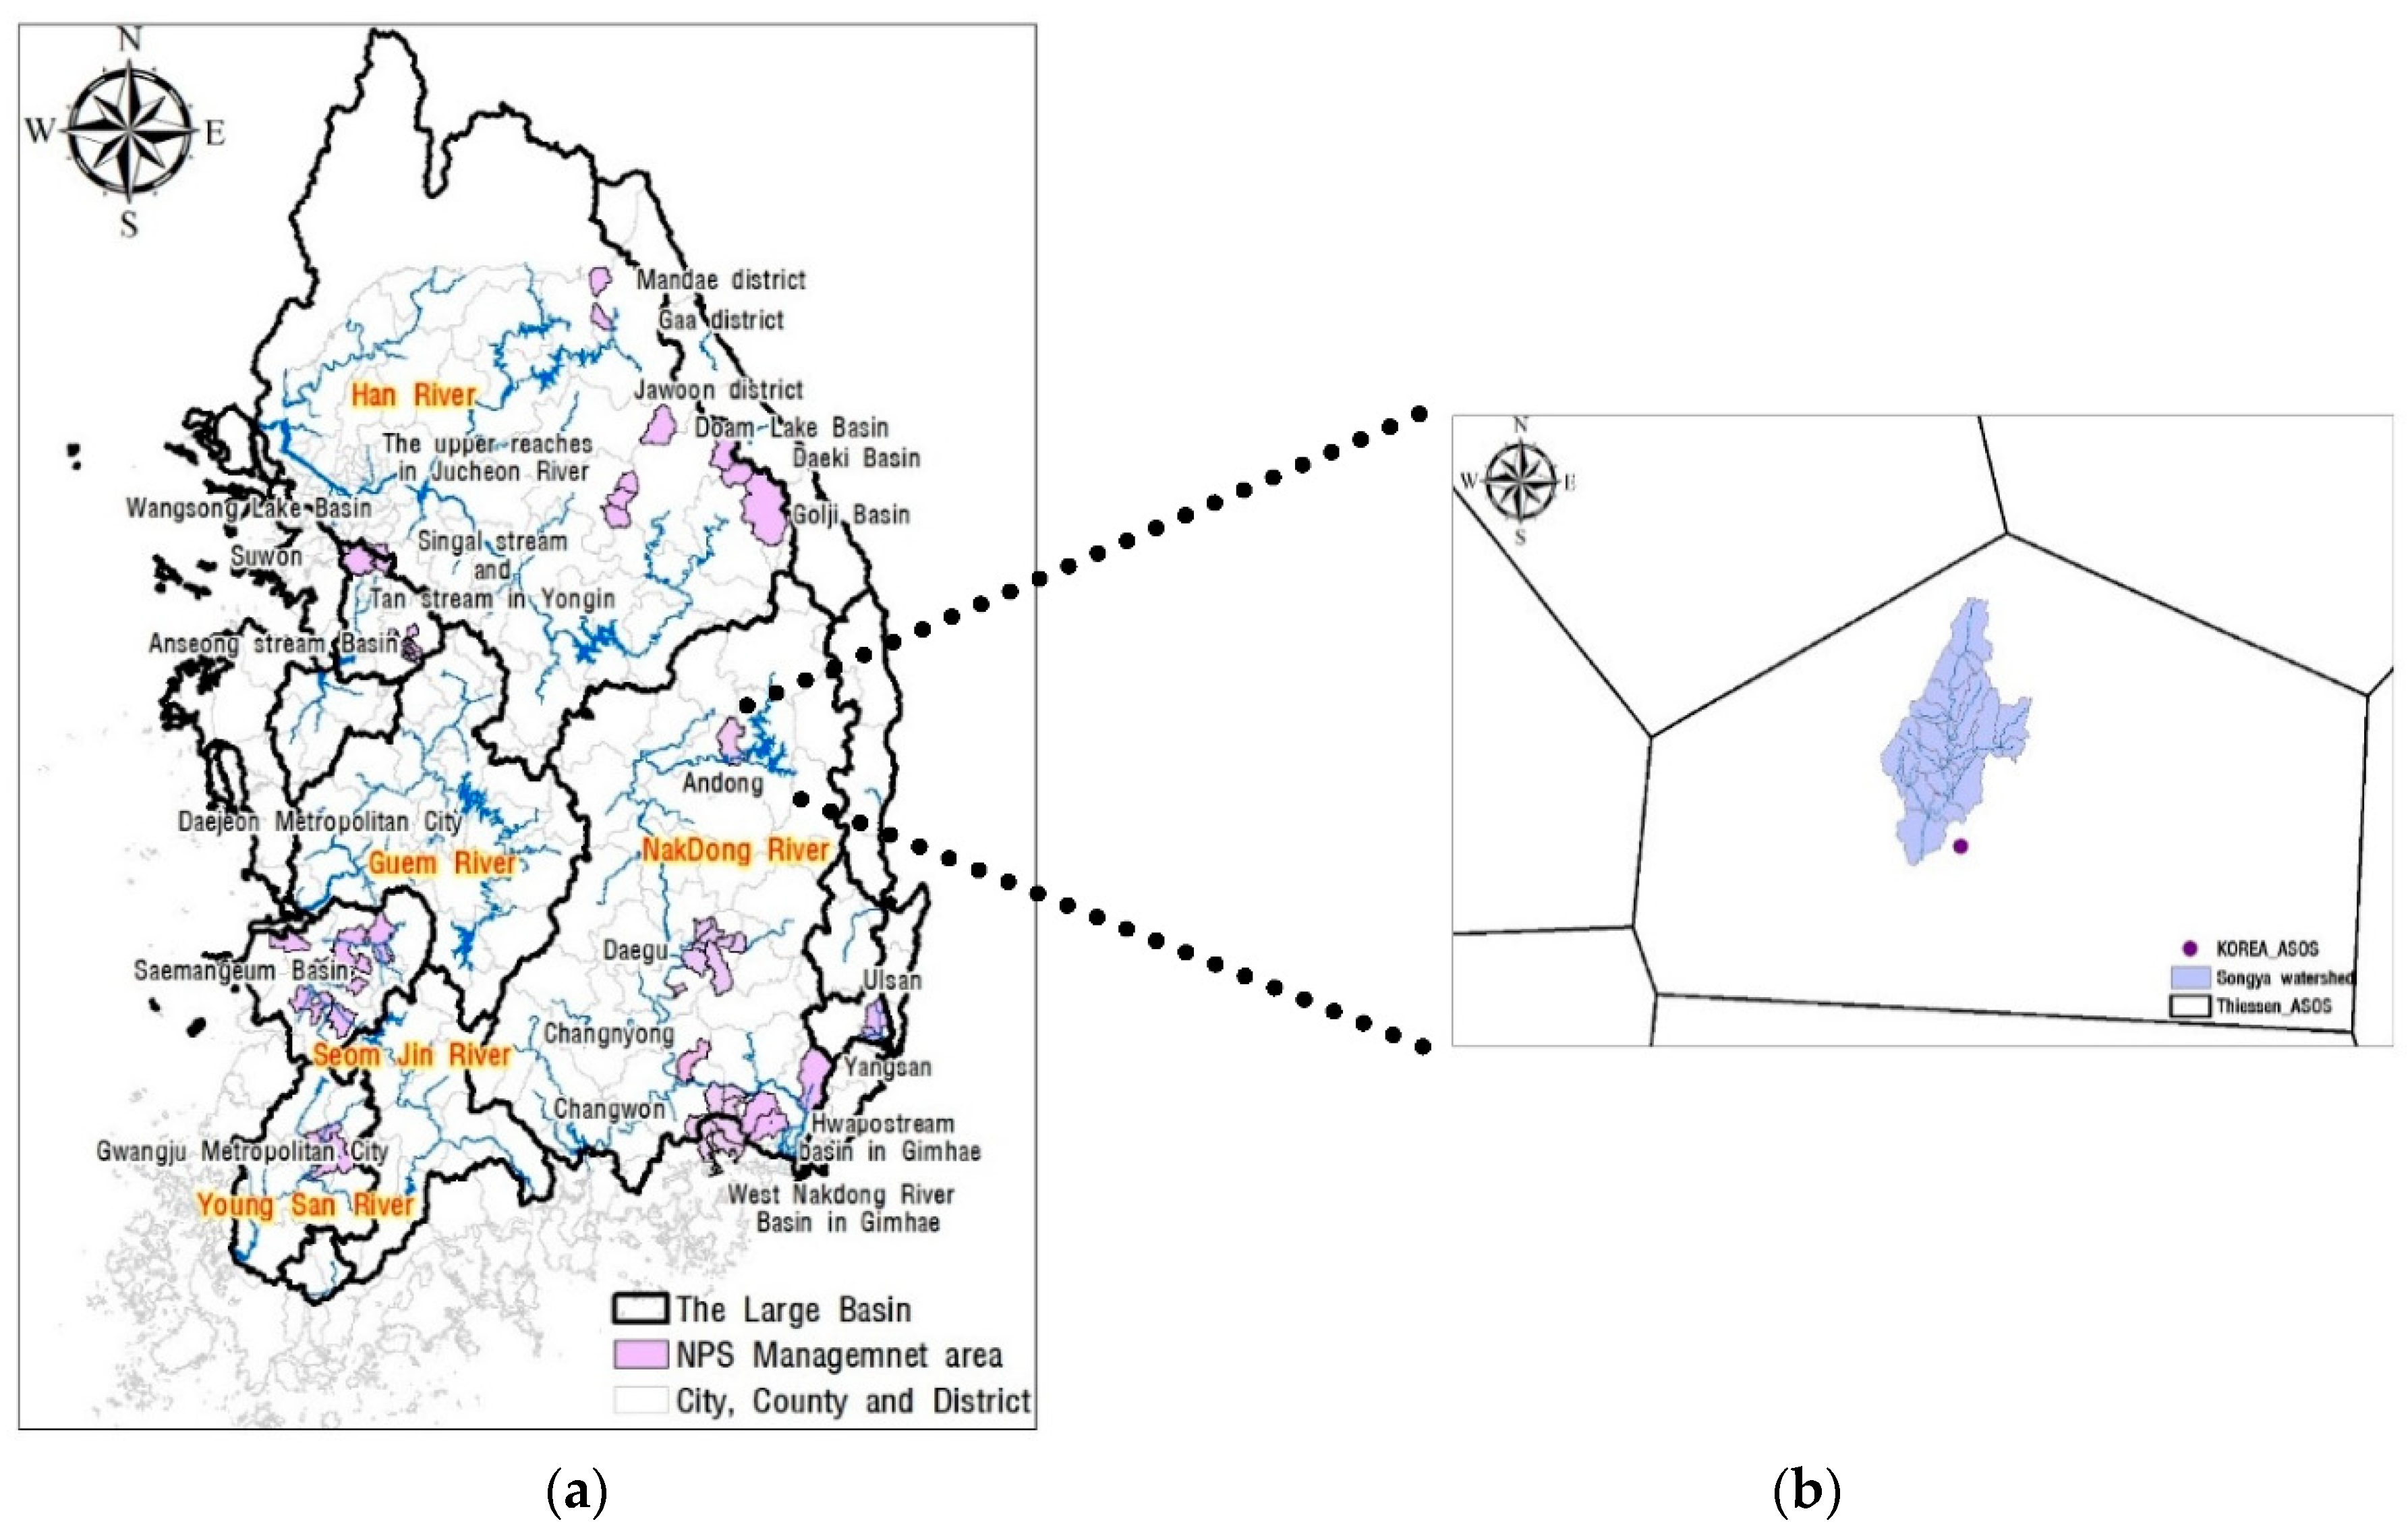
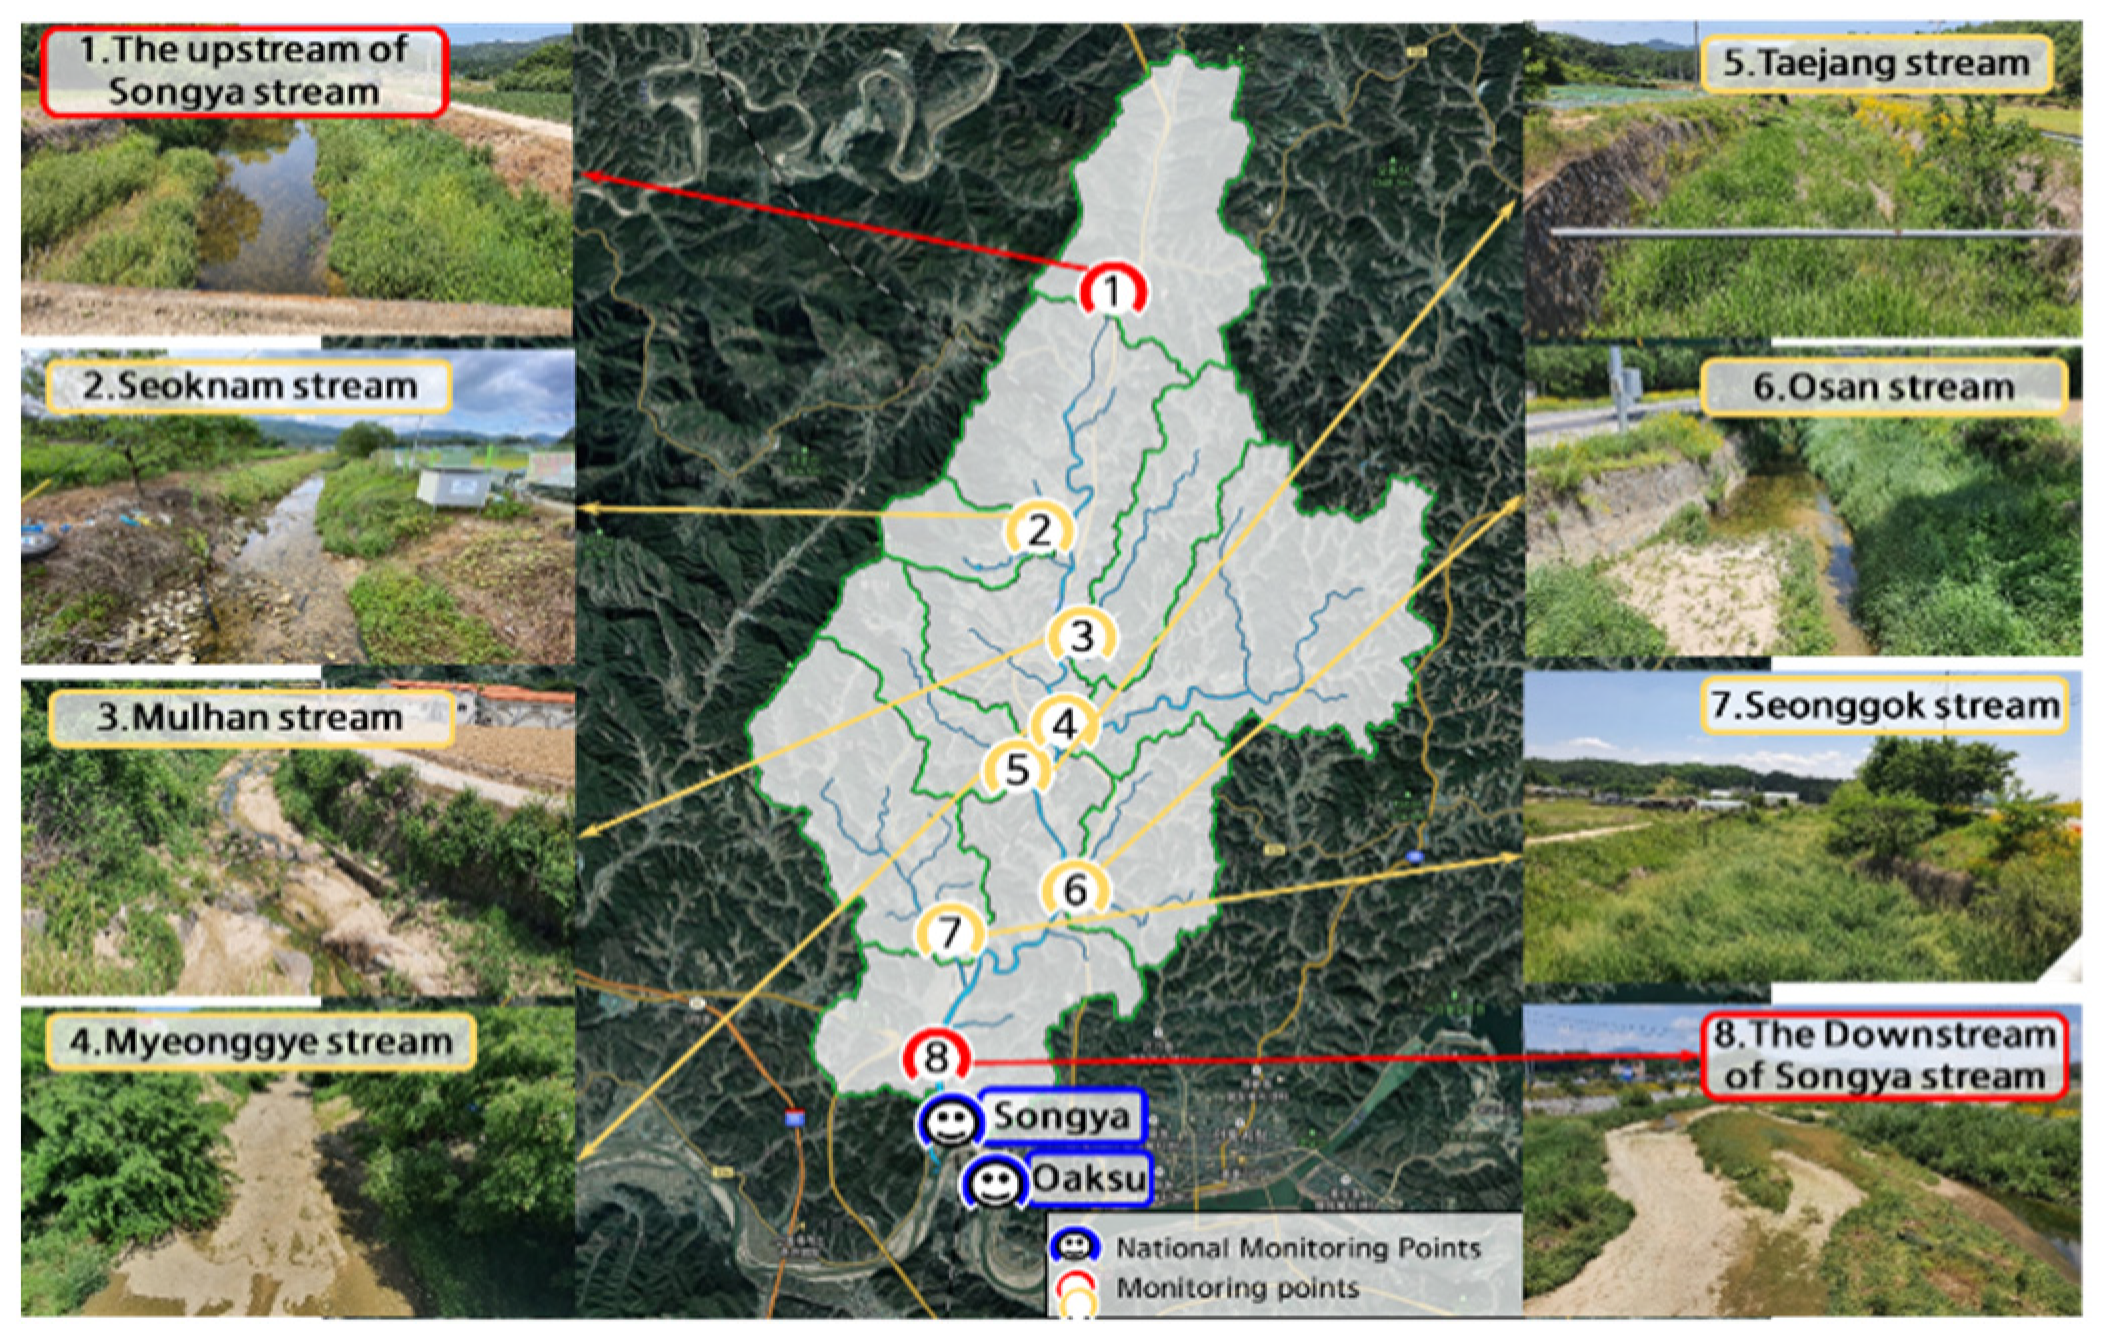
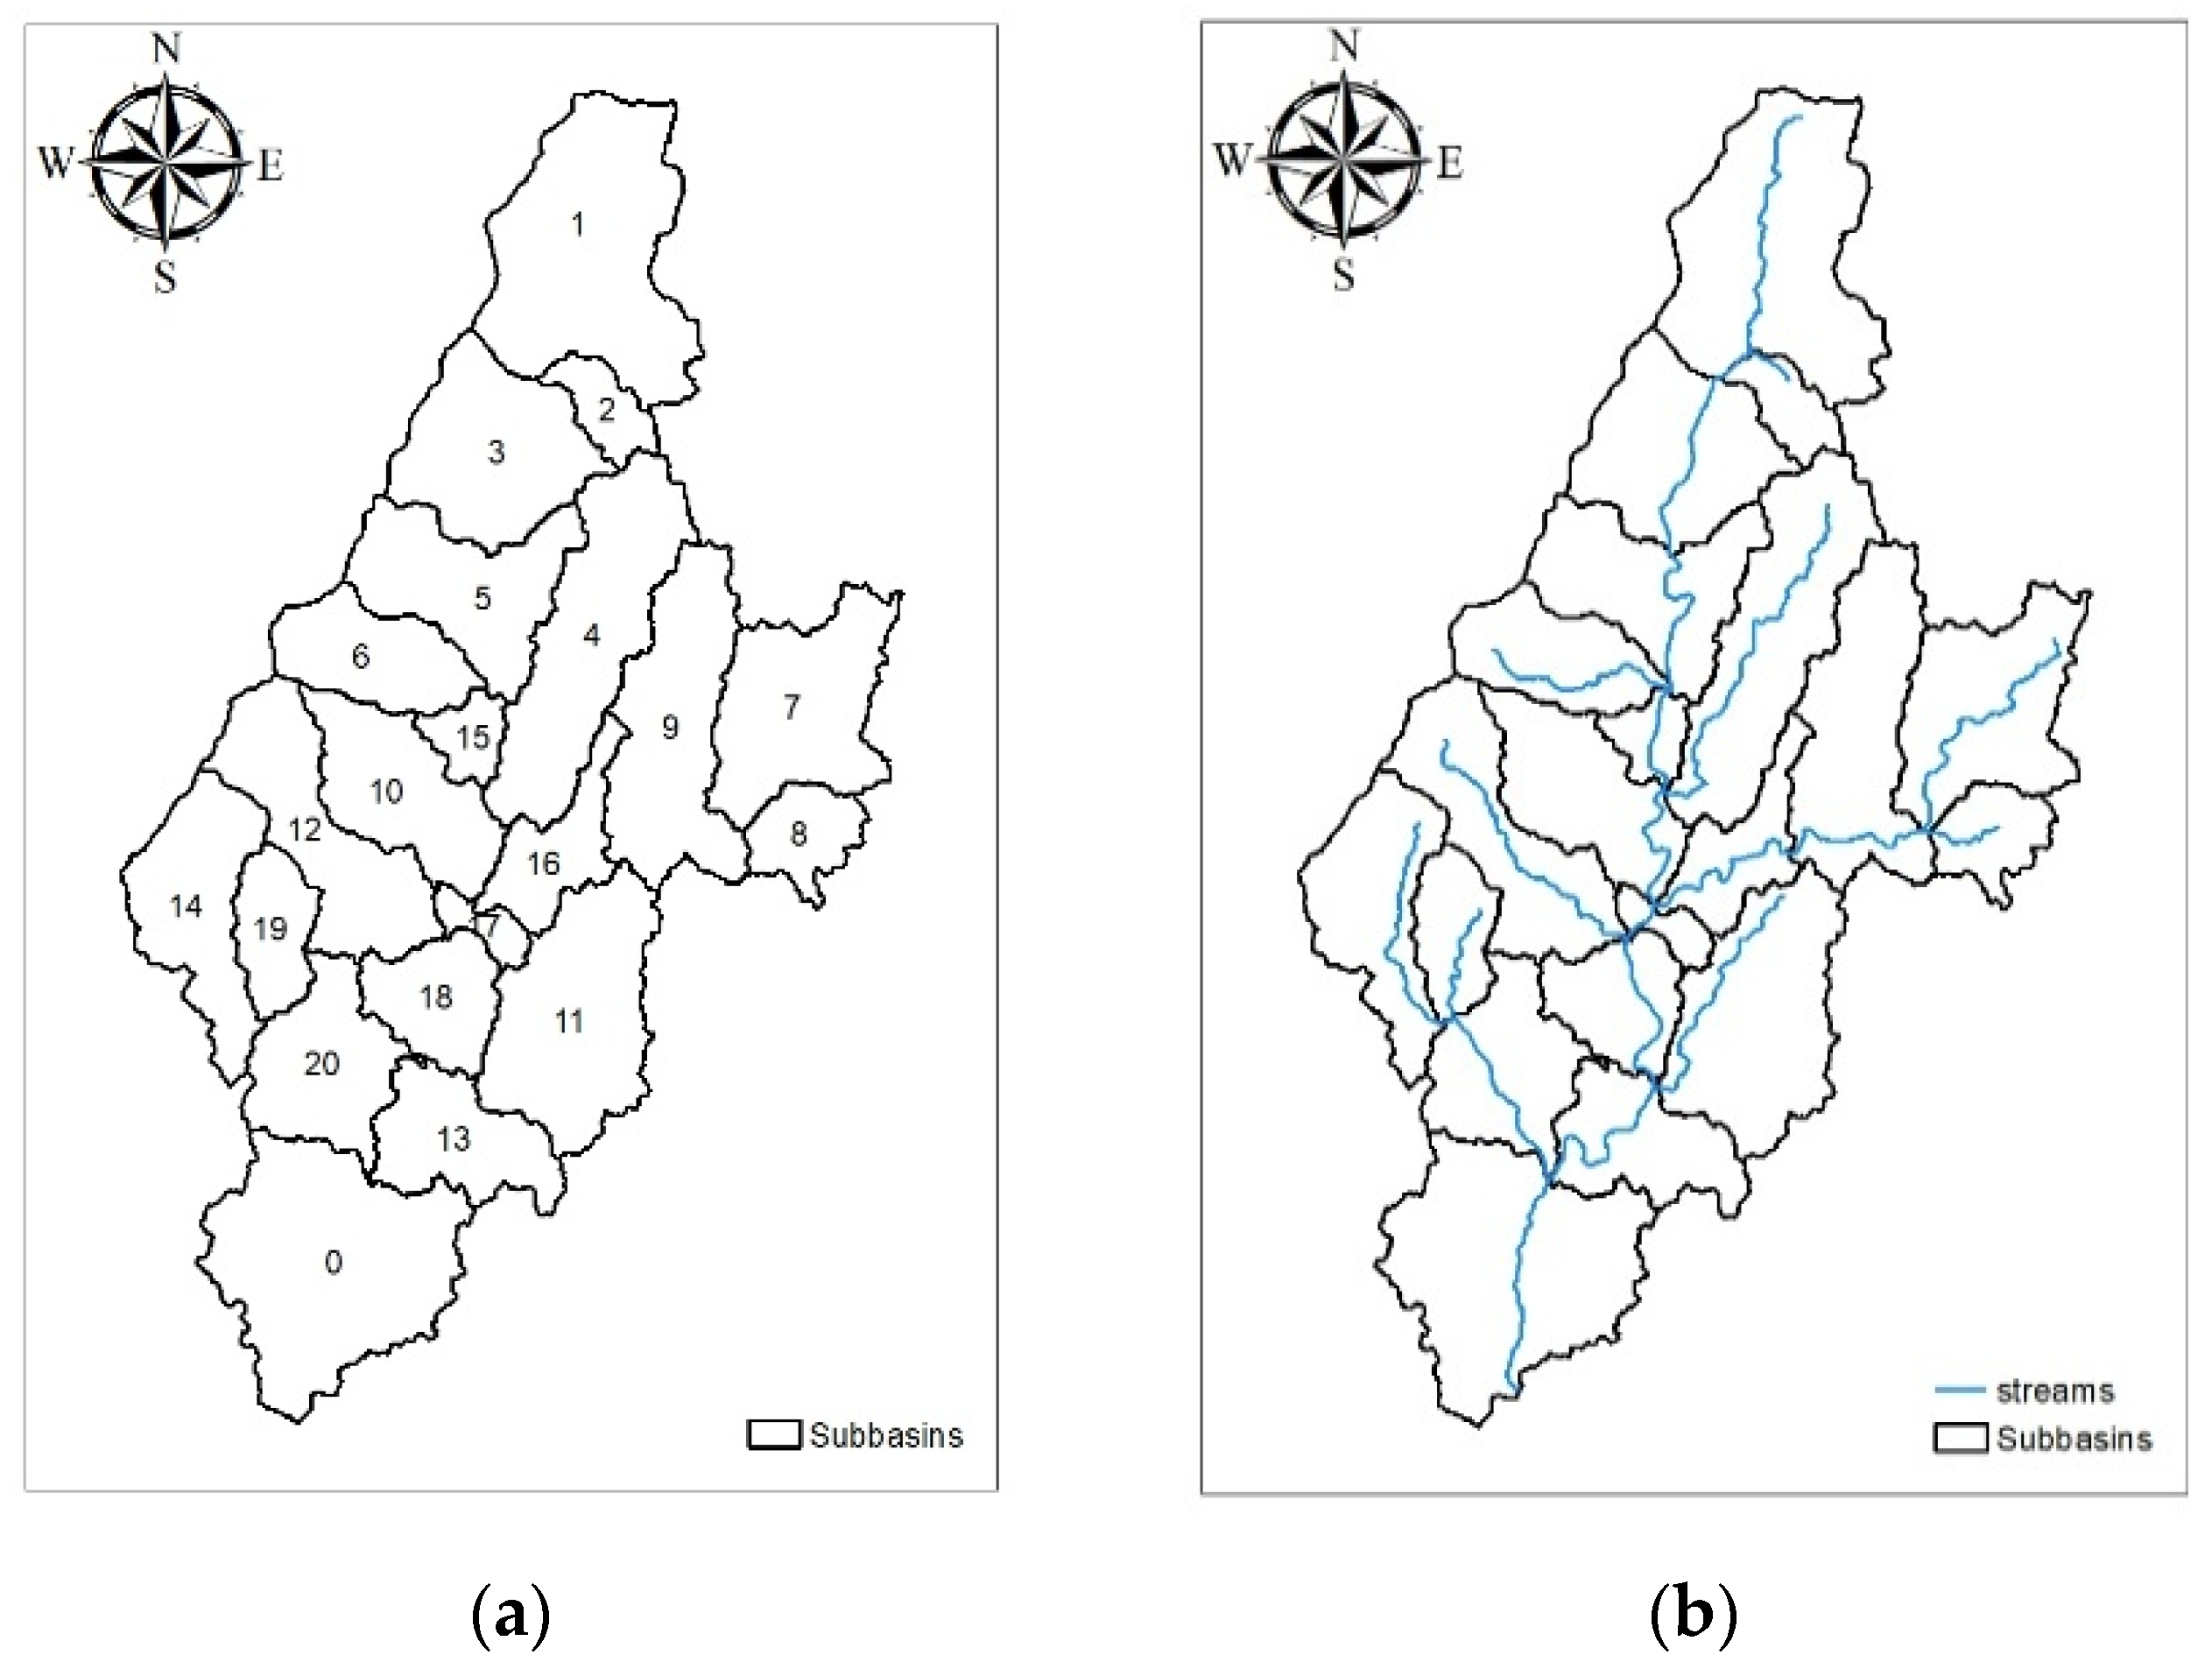
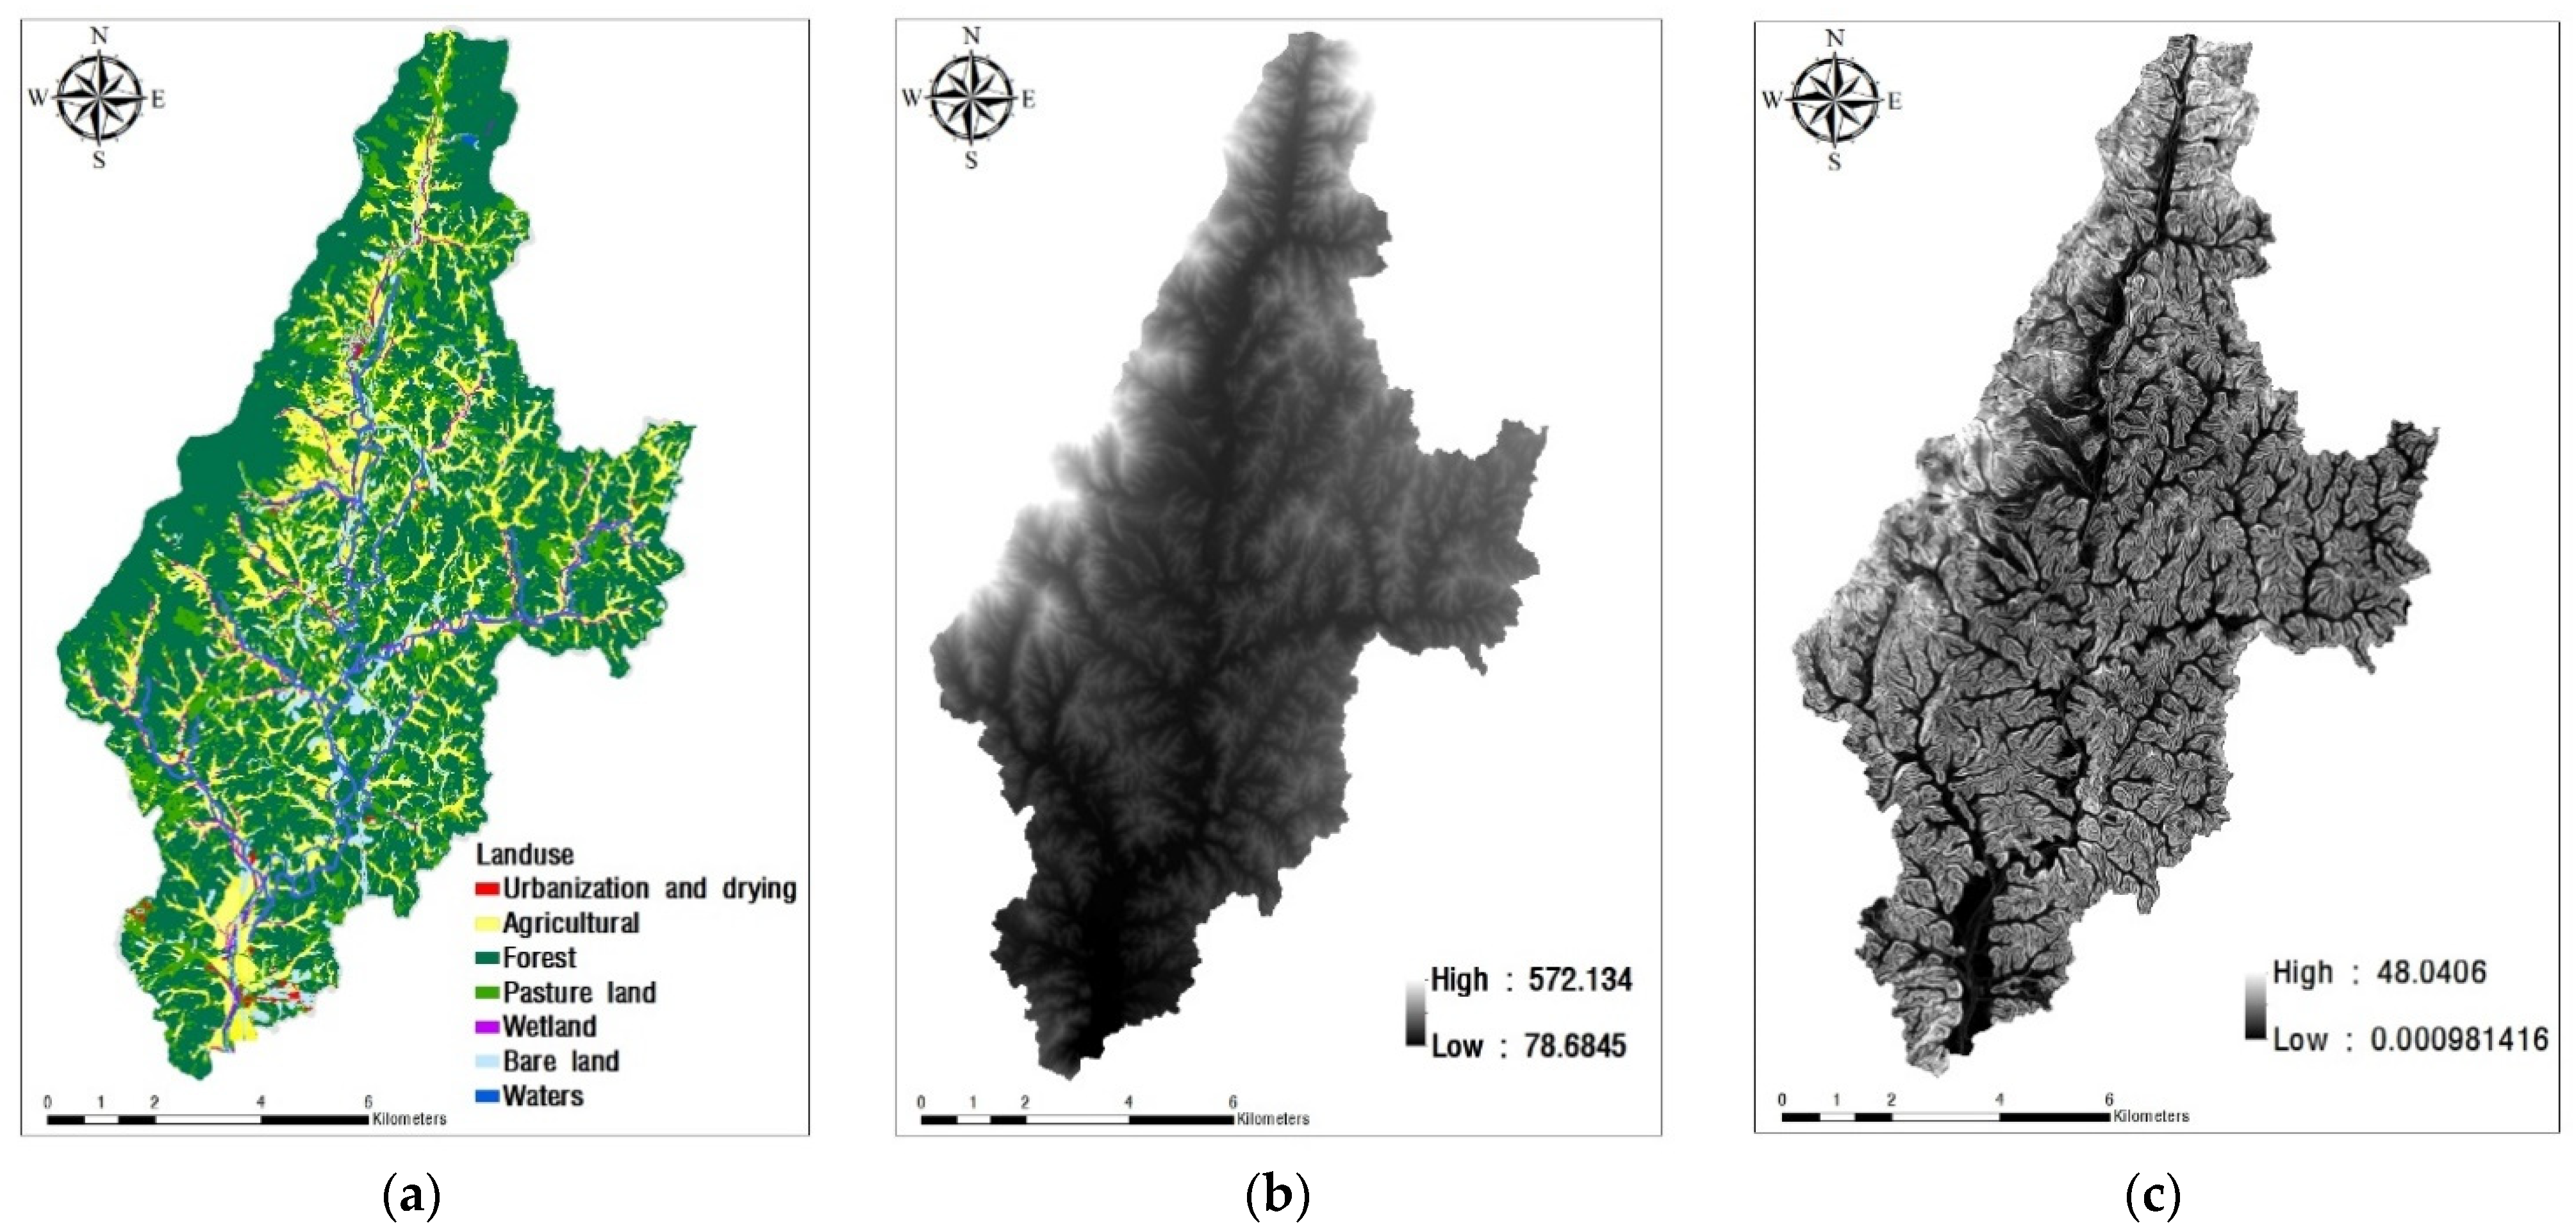
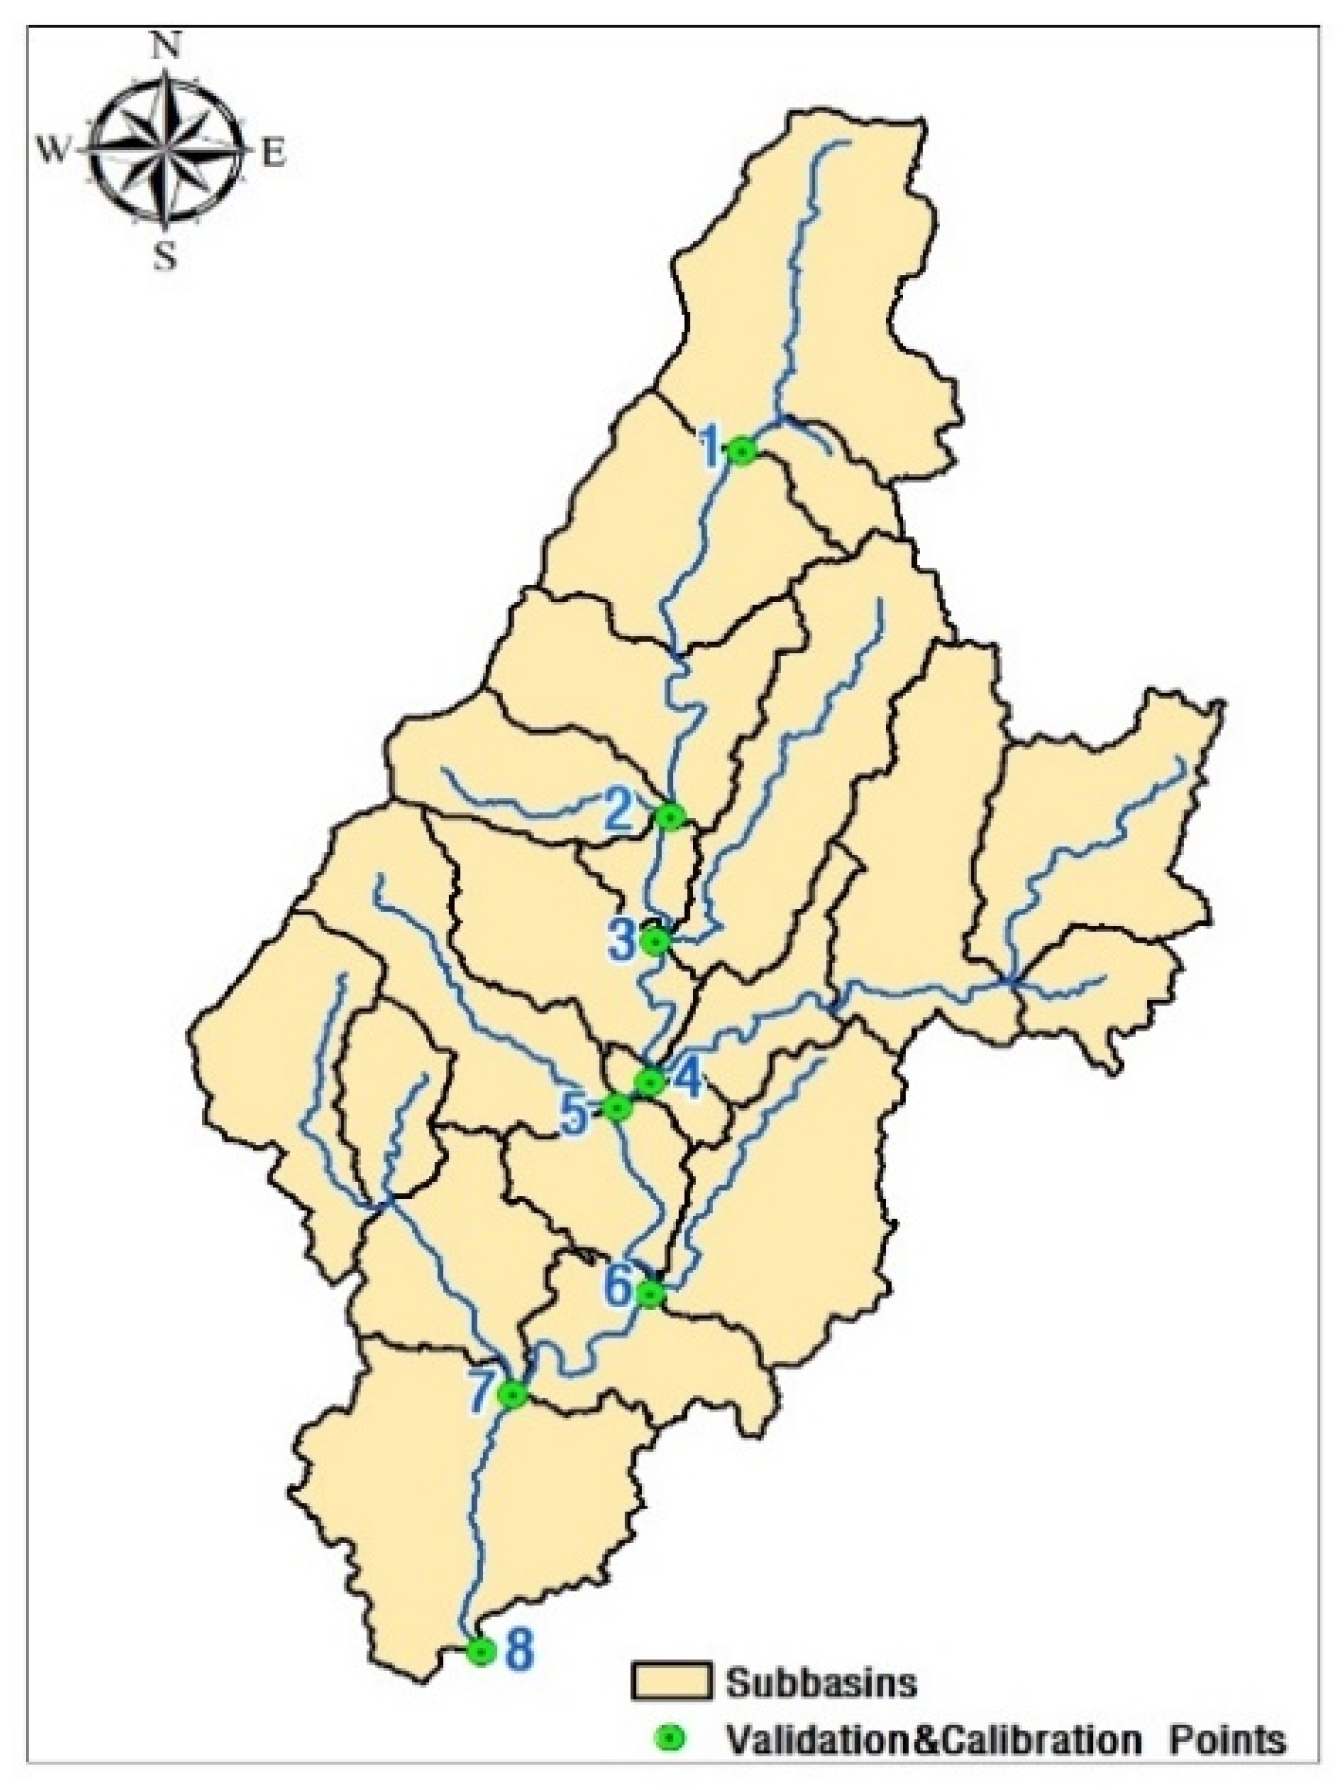
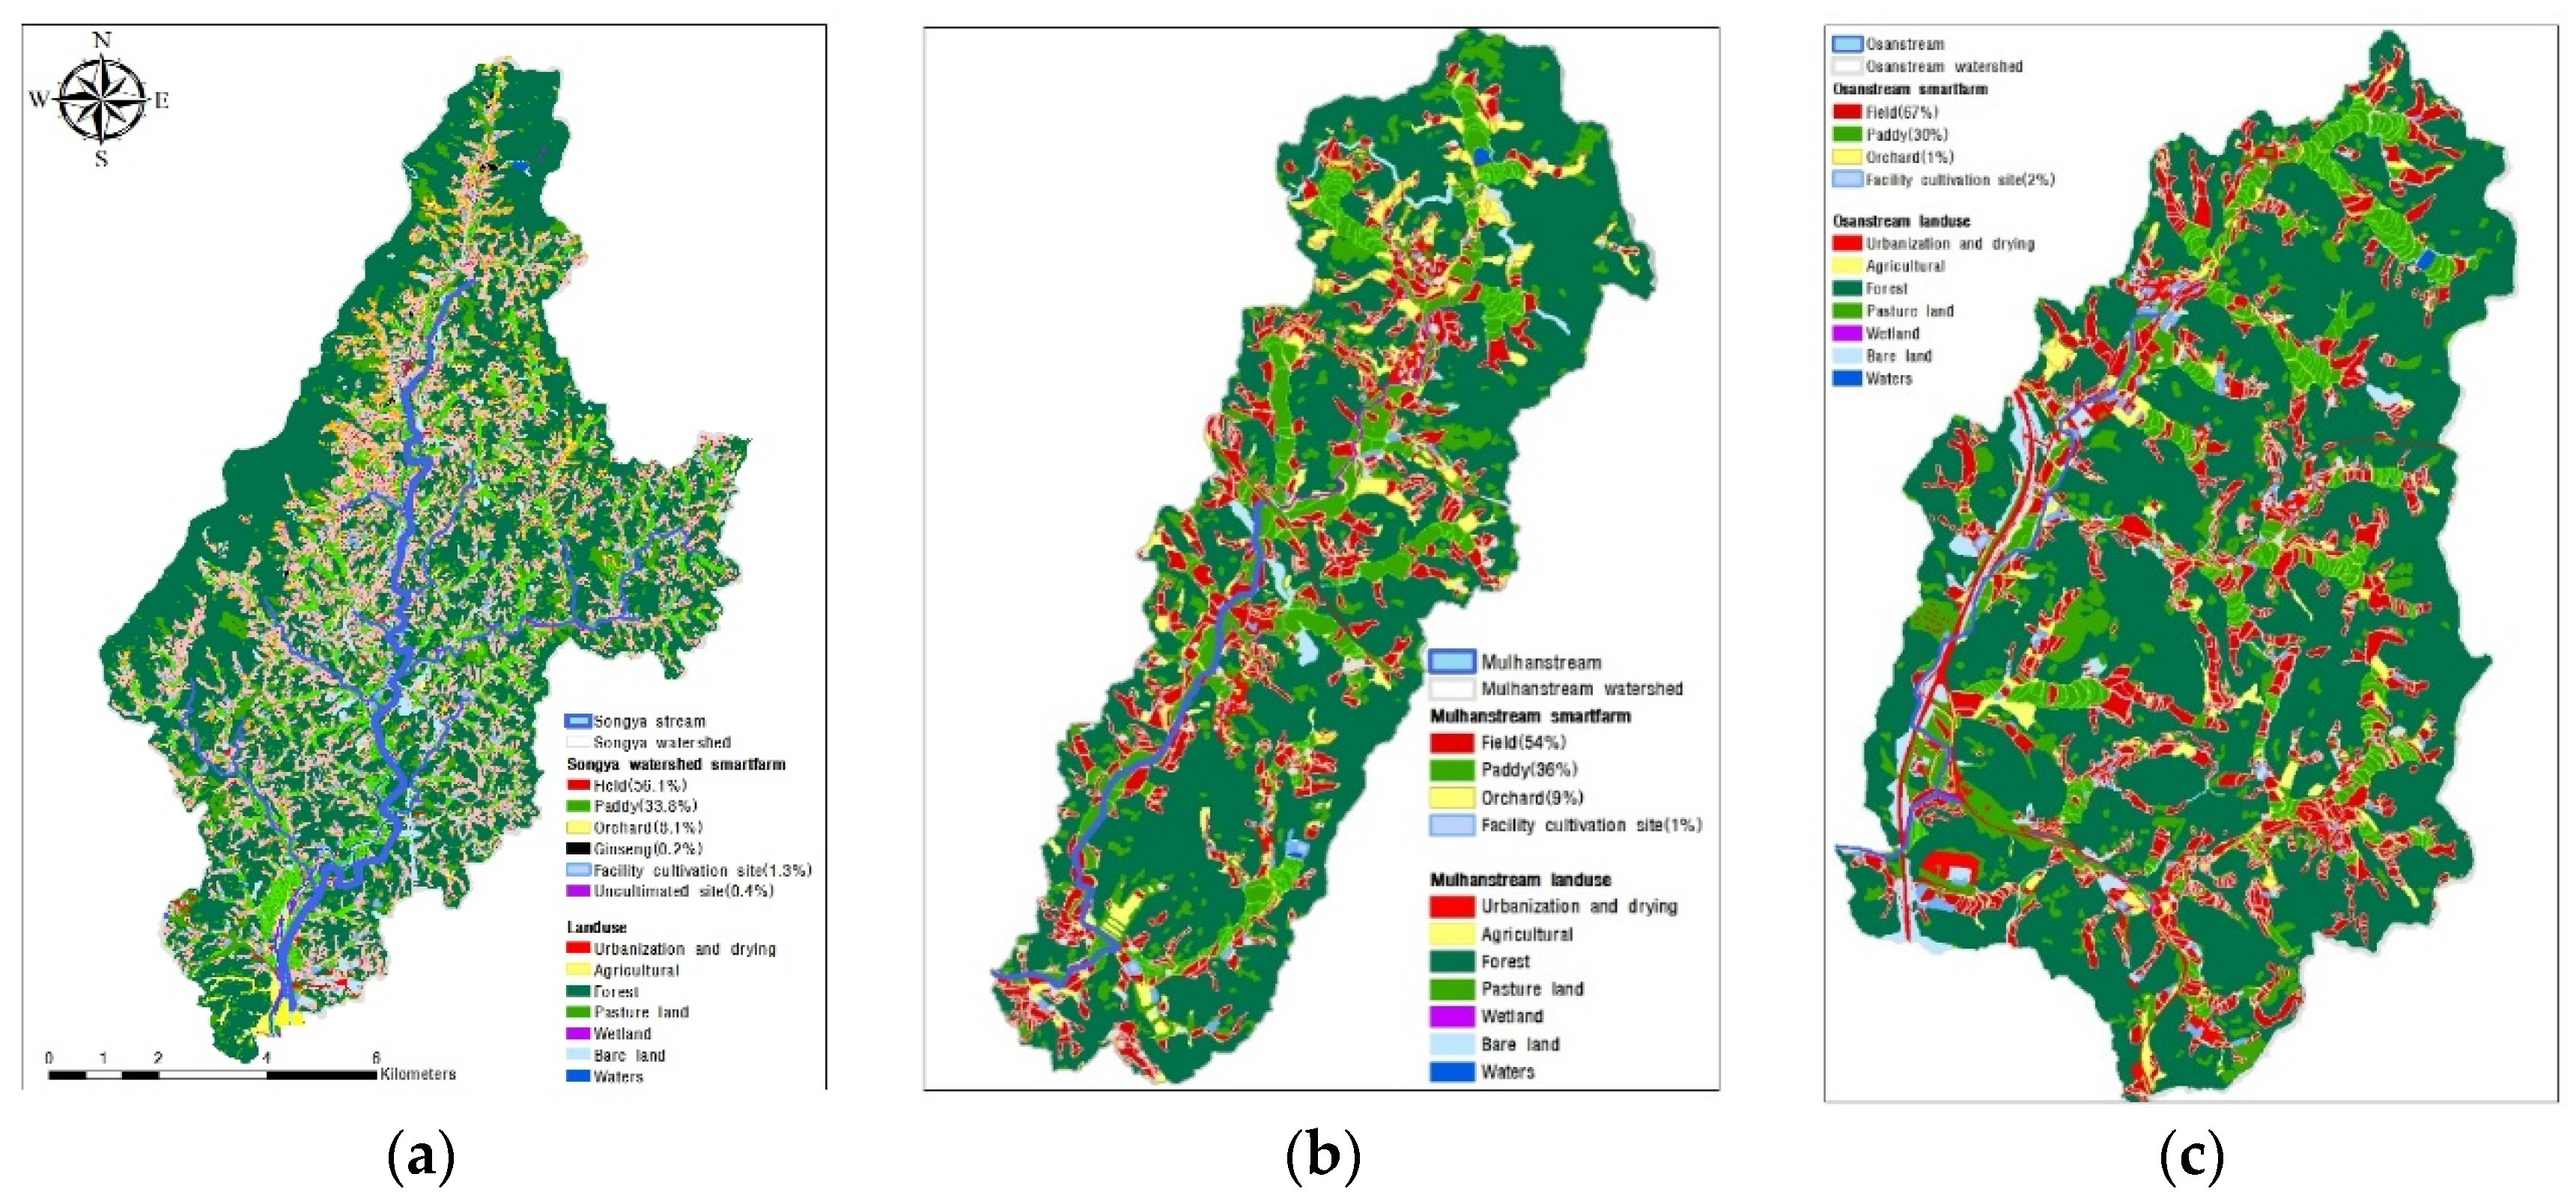
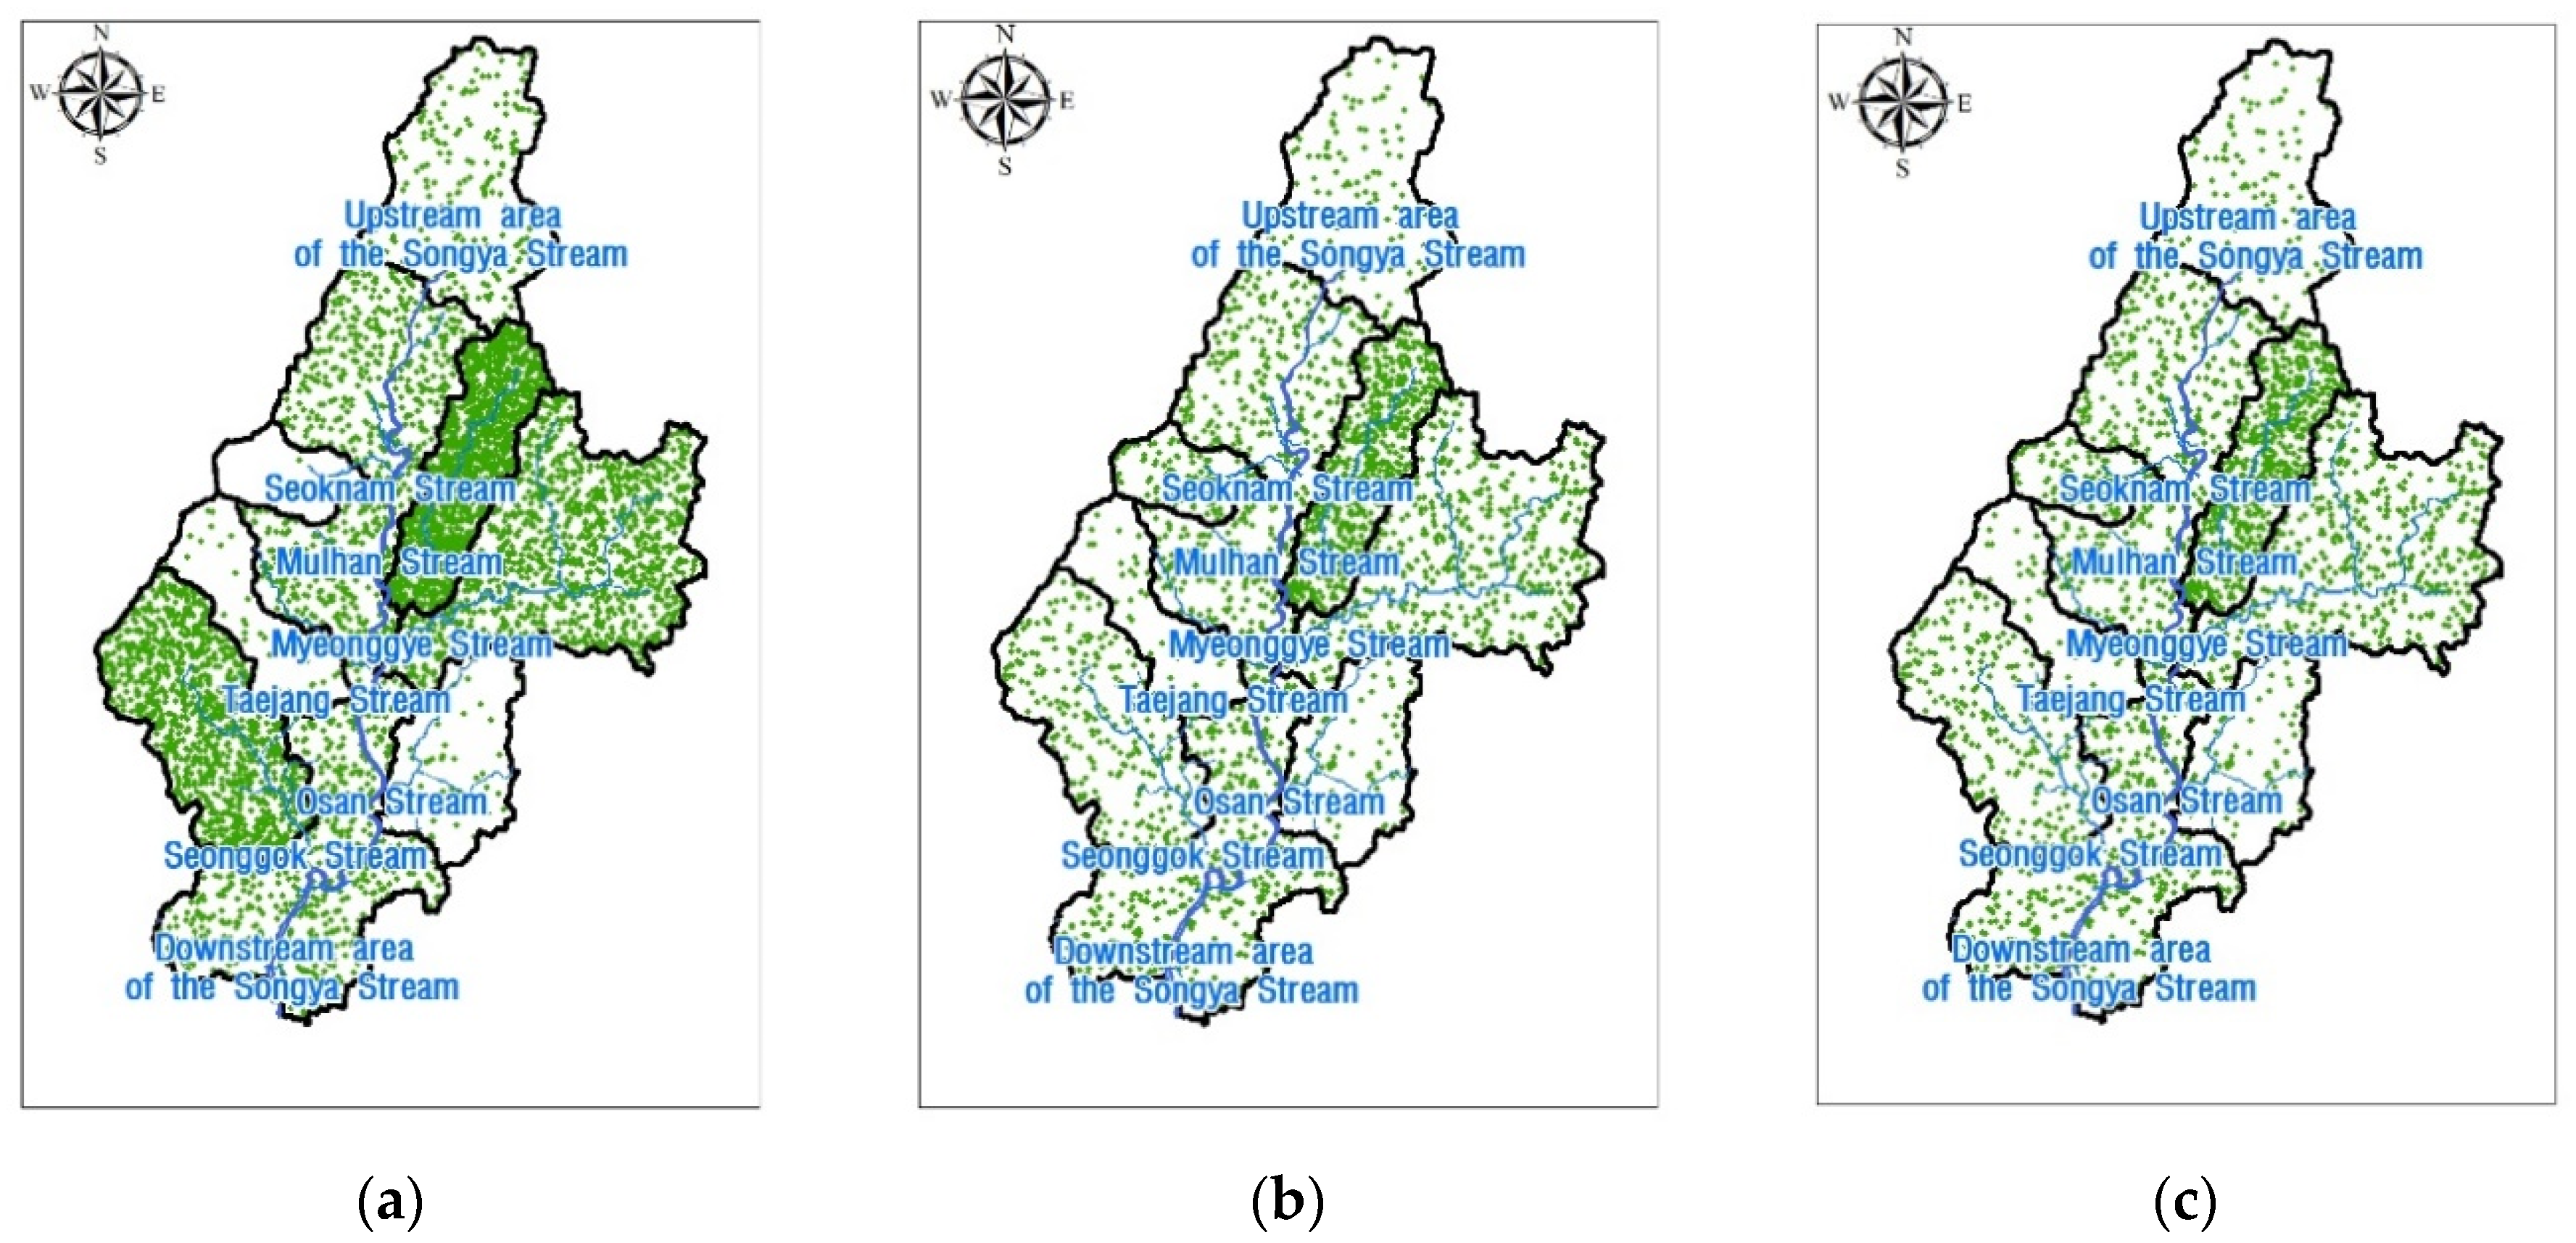
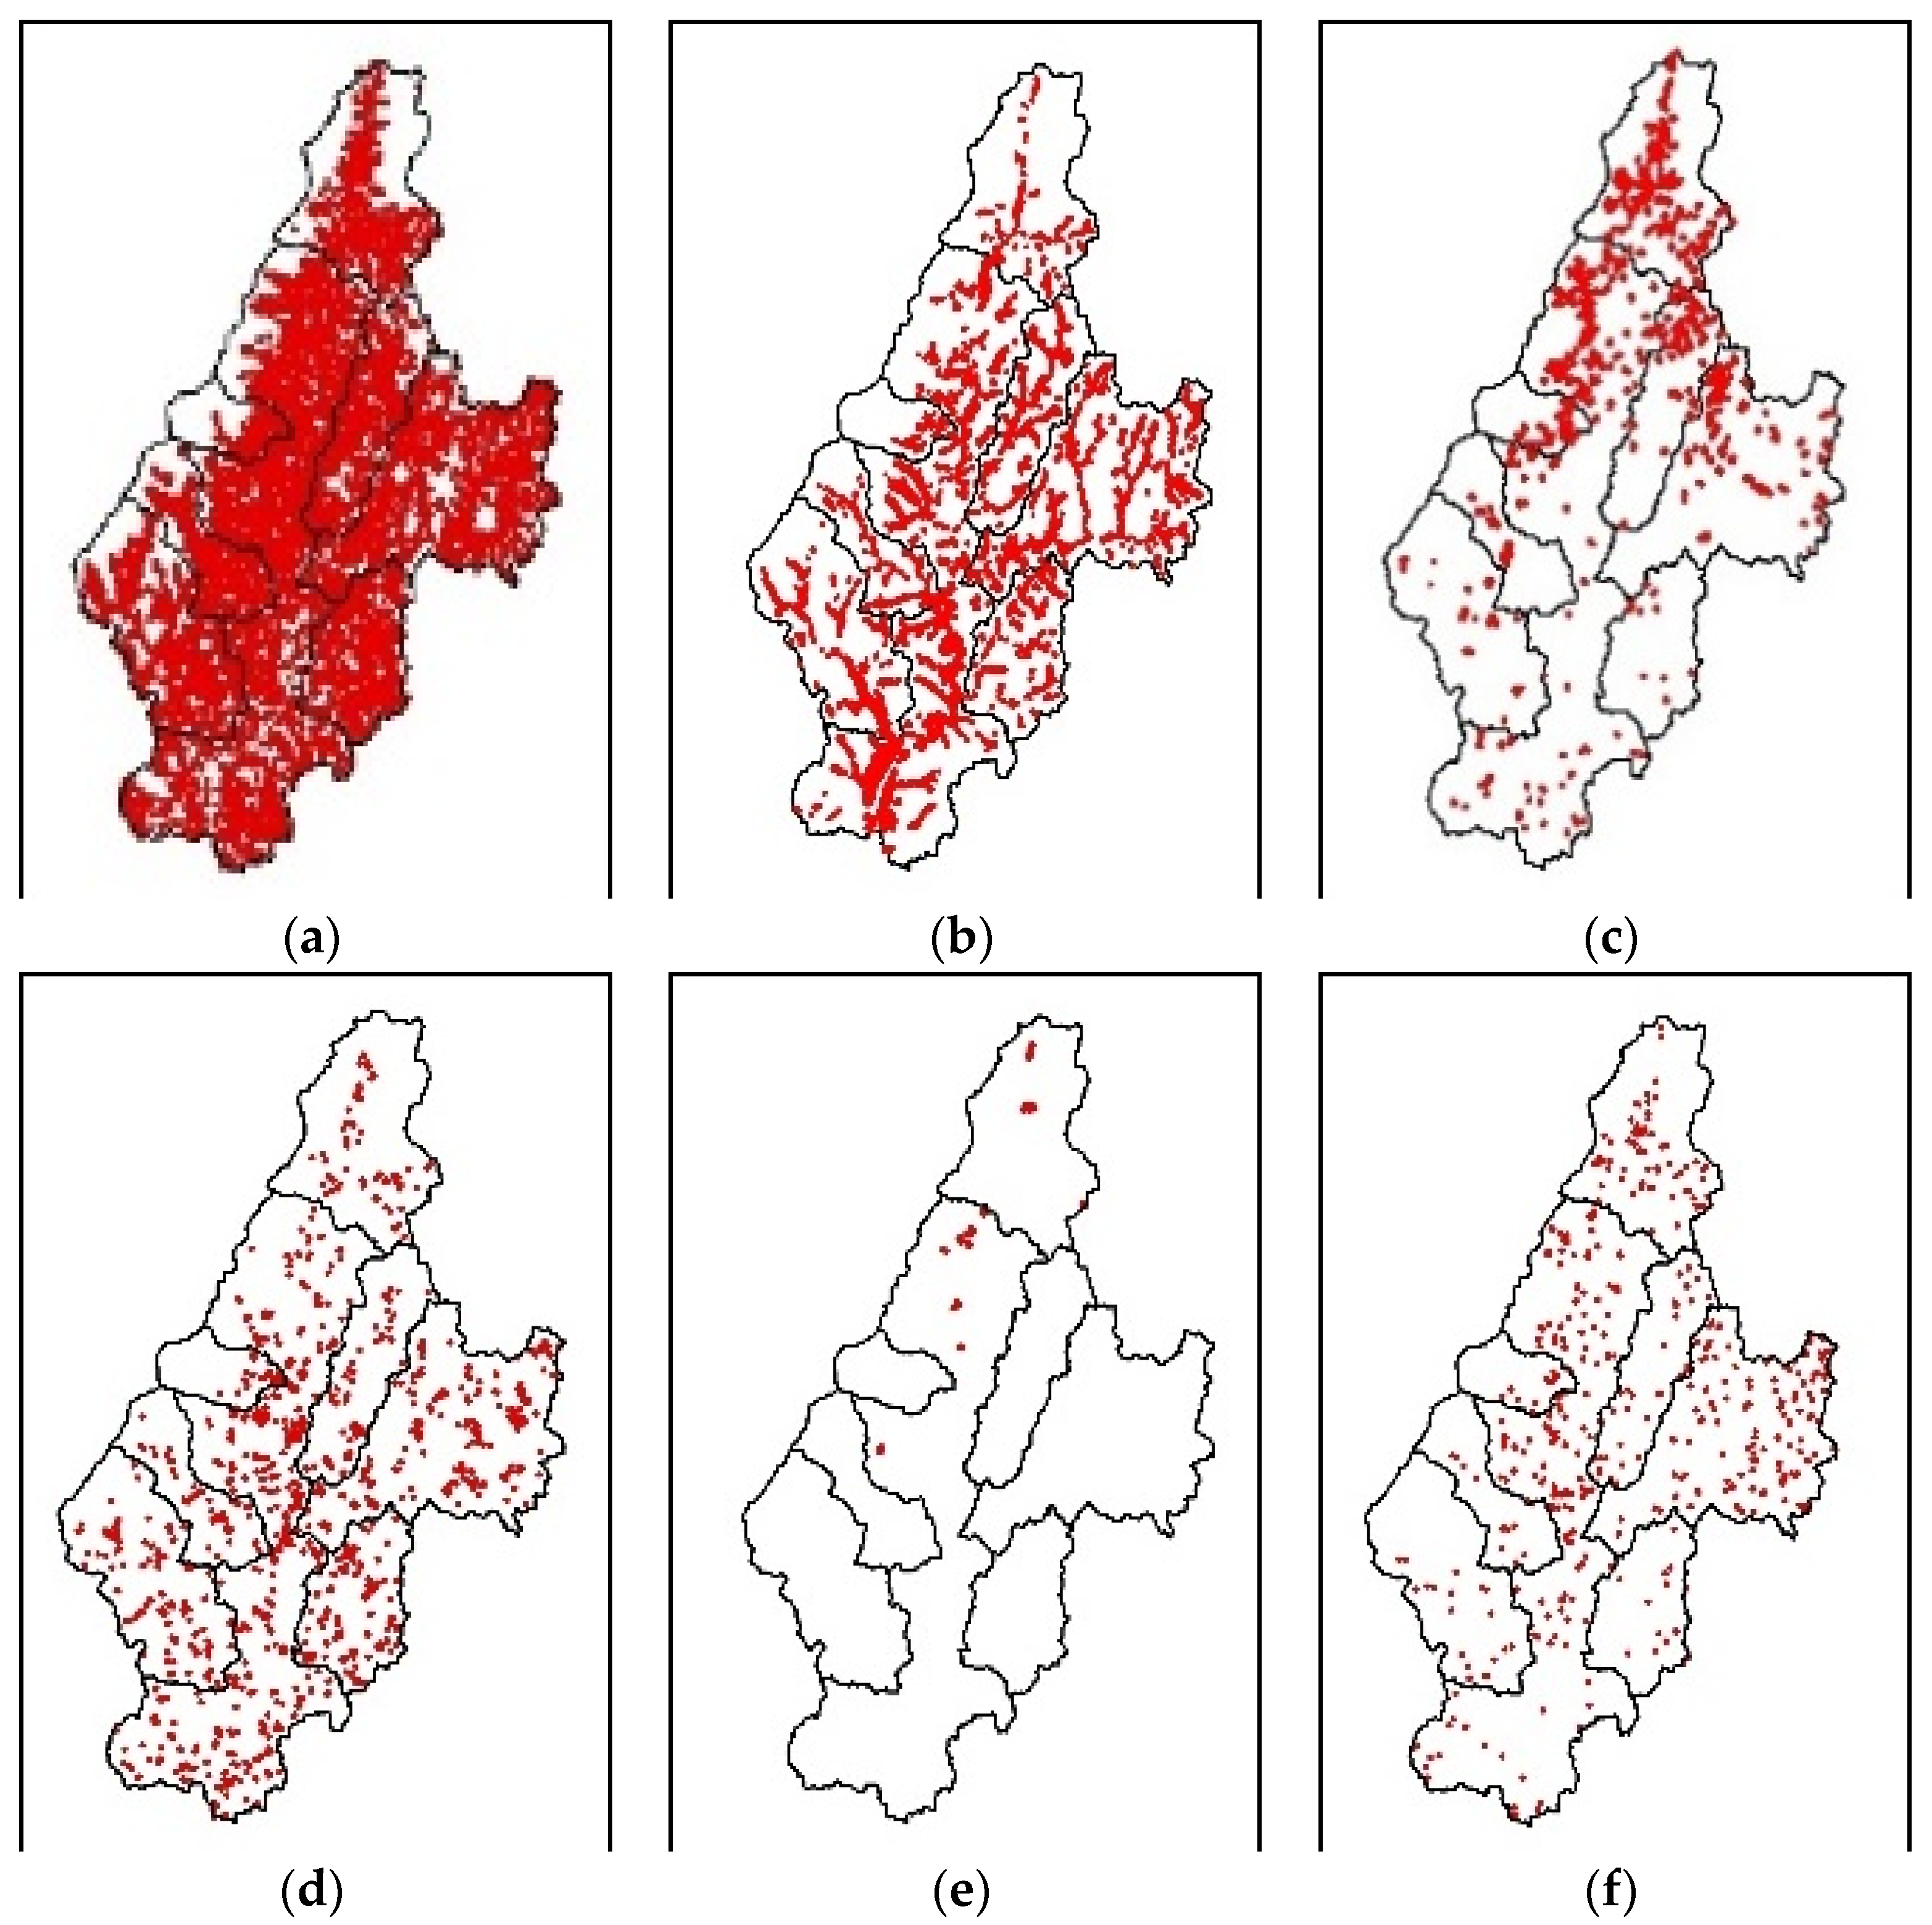
2.1. Target Area

The Songya watershed stretches from Pyeongon-myeon, Yeongju-si, Gyeongsangbuk-do to Bukhu-myeon, Andong-si, Gyeongsangbuk-do, covering an area of 107.06 km2. It is included in the middle area of the downstream area of the Andong Dam, and joins the Nakdong River through the Banbyeon Stream, a local river. Since the Andong Dam is located in the upstream area of the Nakdong River and the Imha Dam in the upstream area of the Byeonbyeon Stream, dam discharges affect the water quantity and quality in rivers. The Songya watershed, however, is not affected by the dams. It strongly requires NPS management as it was designated as an NPS management area. The target area is shown in Figure 1. The black line in Figure 1b is represented by the Thyssen network. Meteorological stations that are presented in the Korea Meteorological Administration’s floodgates and correspond to the target area can be selected. It was the Andong Observatory branch as a result of analyzing the Thyssen network in the basin through ESRI ArcGIS work. ESRI ArcGIS was used for the Coordinate System; the geographic coordinate system is GCS_Korean_Datum_1985.

2.2. Model Construction

The Hydrological Simulation Program-Fortran (HSPF) model used in this study is a watershed model developed by the U.S. Environmental Protection Agency (US EPA) to predict the flow and water quality caused by continuous rainfall in complex watersheds with rural and urban areas. This model simulates the NPS pollution load of specific pollutants according to the land use in a watershed as well as the load caused by rainfall and combines the results with the point source pollution load to link the change in flow caused by rainfall to the water quality model [2,3,4]. After watershed setting, topography, land cover, meteorological, and point source data are required as the HSPF model input data in the Table 1. For the land cover data, the large classification land cover data as of 2018 provided by the Environmental Geographic Information System (EGIS) of the Ministry of Environment (ME) were used. The model data for each watershed were constructed by superimposing the database input file onto the graphic data for land cover using the Shape file of ArcGIS.
The meteorological data entered into the watershed model were the precipitation, temperature, dew point temperature, cloud amount, solar radiation, wind speed, and evapotranspiration. The hourly data of the Andong automated synoptic observing system (ASOS) in the Songya watershed from 1 January 2011 to 31 December 2020 were entered after receiving them from the Korea Meteorological Administration. As for the pollution source input data of the HSPF model, the load was calculated from the data of the national pollution source survey between 2014 and 2018. For the discharge load, the total maximum daily load (TMDL) data from 2014 to 2018 were used. In addition, the daily discharge and discharge water quality, Dissolved Oxygen (DO), BOD, Total Nitrogen (TN), and TP data were entered using the wastewater generated and discharge load data as the point source pollution load input data. In addition, the proportions of nitrogen and phosphorus were entered after calculating them from the Organic Nitrogen (Org-N), Ammonia (NH3), Nitrate Nitrogen (NO3), Organic Phosphorus (Org-P), and Phosphate (PO4) water quality data required for model input. As for the flow and water quality data used for validation and calibration, the flow and water quality monitoring data obtained from the Songya point in the TMDL measurement network of ME (2014 to 2020) and those obtained six times during rainfall in 2020 from two mainstream points and six tributary points in the Songya watershed were used. The monitoring points are shown in Figure 2 and model input data in Table 1.
The calibration and validation of the model are performed through the simple trial and error method, which is the method of finding optimal points, such as the correlation coefficient and coefficient of determination, by changing various parameters of the model. In this method, provided that the %diff number of iterations is sufficient, the overall optimal point can be reached [5].
The validation and calibration results of the model were evaluated through the relative error (%, %Difference) that represents the difference between the measured and simulated values as suggested by US EPA (2011). The relative error is calculated using the following equation.
% d i f f = ( i = 1 n O i i = 1 n S i ) i = 1 n O i × 100
The coefficient of determination used to evaluate the model efficiency in watershed model calibration and validation, which serves as the application criterion of %Difference [6].

2.3. Selection of Priority Management Areas for NPSs (NPS Measures)

Since NPSs occur in multiple unspecific areas, it is difficult to find their accurate temporal and spatial discharge paths. Therefore, it is necessary to select and manage priority areas, in which major pollution sources are generated, for NPS management [7].
The evaluation items to select priority subbasins for NPS management are detailed in Table 2. In this study, research was conducted separately on the existing discharge items (A), evaluation items that may affect rural NPSs (B), and detailed evaluation items (C) in Table 2. The evaluation items (B) were evaluated by applying both the monitoring results and the values simulated by the model. NPSs exhibit large discharge differences during rainfall depending on the topography and land-use characteristics [8]. Therefore, monitoring that can quantify the area of various farming conditions and the number of pollutants is essential, and the event mean concentration (EMC) and the peak water quality concentration are evaluation items especially required for NPSs [9].
Therefore, in this study, evaluation items were selected as follows for reasonable NPS management by applying the monitoring results, including farming conditions, the area of land use, flow, and water quality, and the modeling results to analyze the spatiotemporal distribution of rivers. In the existing priority selection study, a major watershed was derived as the bottom load considering the influence of the pollutant source in the channel through modeling [10,11]. In a study using the existing monitoring method, it was selected as a result of the emission load per unit area such as pollutants [10,11]. In this study, the results of modeling or monitoring alone are: both modeling and monitoring results were used, not the method of selecting the non-point source priority areas in the existing agricultural areas. It was analyzed as a detailed evaluation item (C) in consideration of the factors considering non-point pollutants that may occur in agricultural areas. This is thought to be different from previous research.
Thus, in a large-scale watershed with insufficient data, applying model in the entire region for the priority subbasin selection method identification, and then adopting the export coefficient method for the load estimation in the identified the priority subbasin selection method is a practical way of delineating and evaluating the priority subbasin selection method, which will provide further support for BMPs selection. First, since evaluation criteria and types are different, a standardization process was performed for priority calculation. As for the method used in this study, the rankings of each evaluation item were listed in the following equation by applying the existing ranking method [12], and the three subbasins with the highest frequencies were finally selected.
The Method of selecting priority management areas for NPS management was detailed in Table 3.

2.4. Method of Selecting Appropriate BMPs

Since most rural areas have a NPS pollution discharge structure, and pollutants severely fluctuate, it is difficult to establish management criteria [7]. BMPs are mainly divided into structural and non-structural methods [13]. The structural methods mainly refer to the facility-type management method while the non-structural methods refer to methods other than the facility-type method, such as the use of eco-friendly fertilizers and education [13].
For the application of these techniques, BMPs are defined as the most appropriate methods to reduce the major NPSs discharged based on the characteristics of drainage areas during rainfall and improve water quality in Korea [14]. Therefore, appropriate BMPs were selected (draft), considering regional and environmental factors [15] as well as land use in drainage areas and maintenance by pollutants as in the following Table 4.
In this study, among the structural methods that can quantify the NPS improvement effect [16,17], an artificial wetland with the highest removal efficiency for nutrients from soil and fertilizers [18] was selected considering the land use concentrated on agriculture and livestock housing [19].

2.5. Analysis of the NPS Improvement Effect through the Application of Appropriate BMPs (NPS Reduction Facility Installation Point Evaluation)

For effective NPs management, Korea has designated areas where water quality and aquatic ecosystems are likely to be contaminated by NPSs as watershed units based on Article 56 of the Water Environment Conservation Act. As described above, NPS reduction facilities suitable for the regional characteristics must be selected [18], and finding application places where NPSs can be effectively improved is crucial to improving the water quality of rivers [20]. Since rivers perform self-purification, the pollutants introduced in upstream areas are purified through decomposition, sedimentation, and dilution processes, and thus facilities are applied at the end of the designated watershed [21]. Since the flow and water quality in upstream areas of a watershed are highly correlated to those in downstream areas, the end of a watershed is directly affected by the change in pollution or materials in upstream areas [22]. Rivers have the ability to purify water through self-purification, but that becomes dysfunctional if the introduction of pollutants, such as point sources and NPSs, increases [23]. Thus, it cannot be expected that water quality will be improved at the end of a river.
In this study, the drainage area was assumed by analyzing the available area at the end of the priority subbasin by excluding permeable layers, such as forests, compared to the watershed area, and model simulation was performed with the same capacity using BMPs in the HSPF model. The effect of facility application was presented by comparing and analyzing the water quality of BOD and TP before and after the application at the end of the priority subbasin and the end of the target basin (point 8).

3. Results

3.1. Results of Constructing the Watershed Model by Reflecting the Latest Watershed Information

The input data required to apply the HSPF model can be divided into topography, land cover map, soil map, and meteorological data. After generating the river network by calculating the flow direction and flow accumulation from the DEM of the Songya watershed, it was divided into 20 subbasins considering the river map, watershed map, and water quality measurement points in Figure 3.To construct the input data required for the simulation of spatially changing hydrologic phenomena and water quality within the watershed, the topographic characteristics of each subbasin, such as the area, slope, and average length, were extracted using DEM, the river map, and the watershed map. The input data were constructed so that infiltration and discharge within the watershed could be simulated. For the meteorological data and point source load, Watershed Data Management (WDM) files were created for each subbasin using WDMUtil, a WinHSPF data management software program.
The Sonya watershed in Andong-si has a low elevation of 79 to 572 m, except for some mountainous areas and gentle topography with a slope of up to 48°. As for the land use, the farmland distributed near the rivers has the highest proportion (25.5%) within the watershed, except for forest, followed by pastureland (6.2%), urbanization and drying (4.3%), bare land (1.6%), wetland (0.9%), and waters (0.4%), as shown in the Table 5 below. Therefore, it can be said that the target area of this study is an agricultural area rather than an urban area.
In Figure 4 is represented Songya watershed map for HSPF application in Songya watershed.

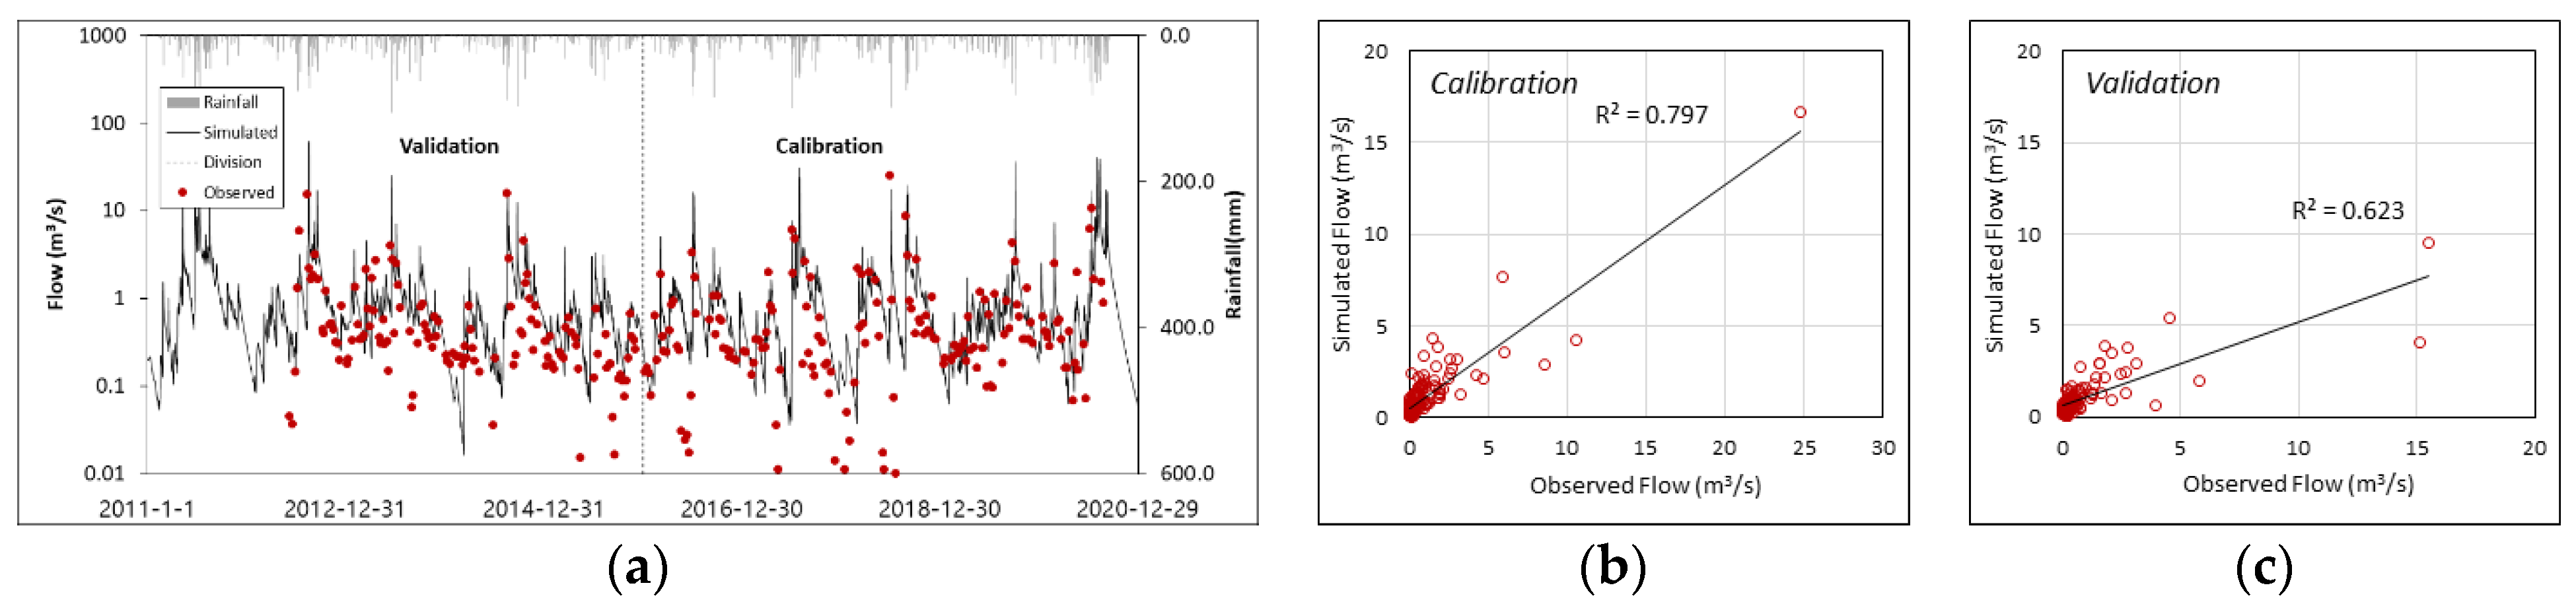
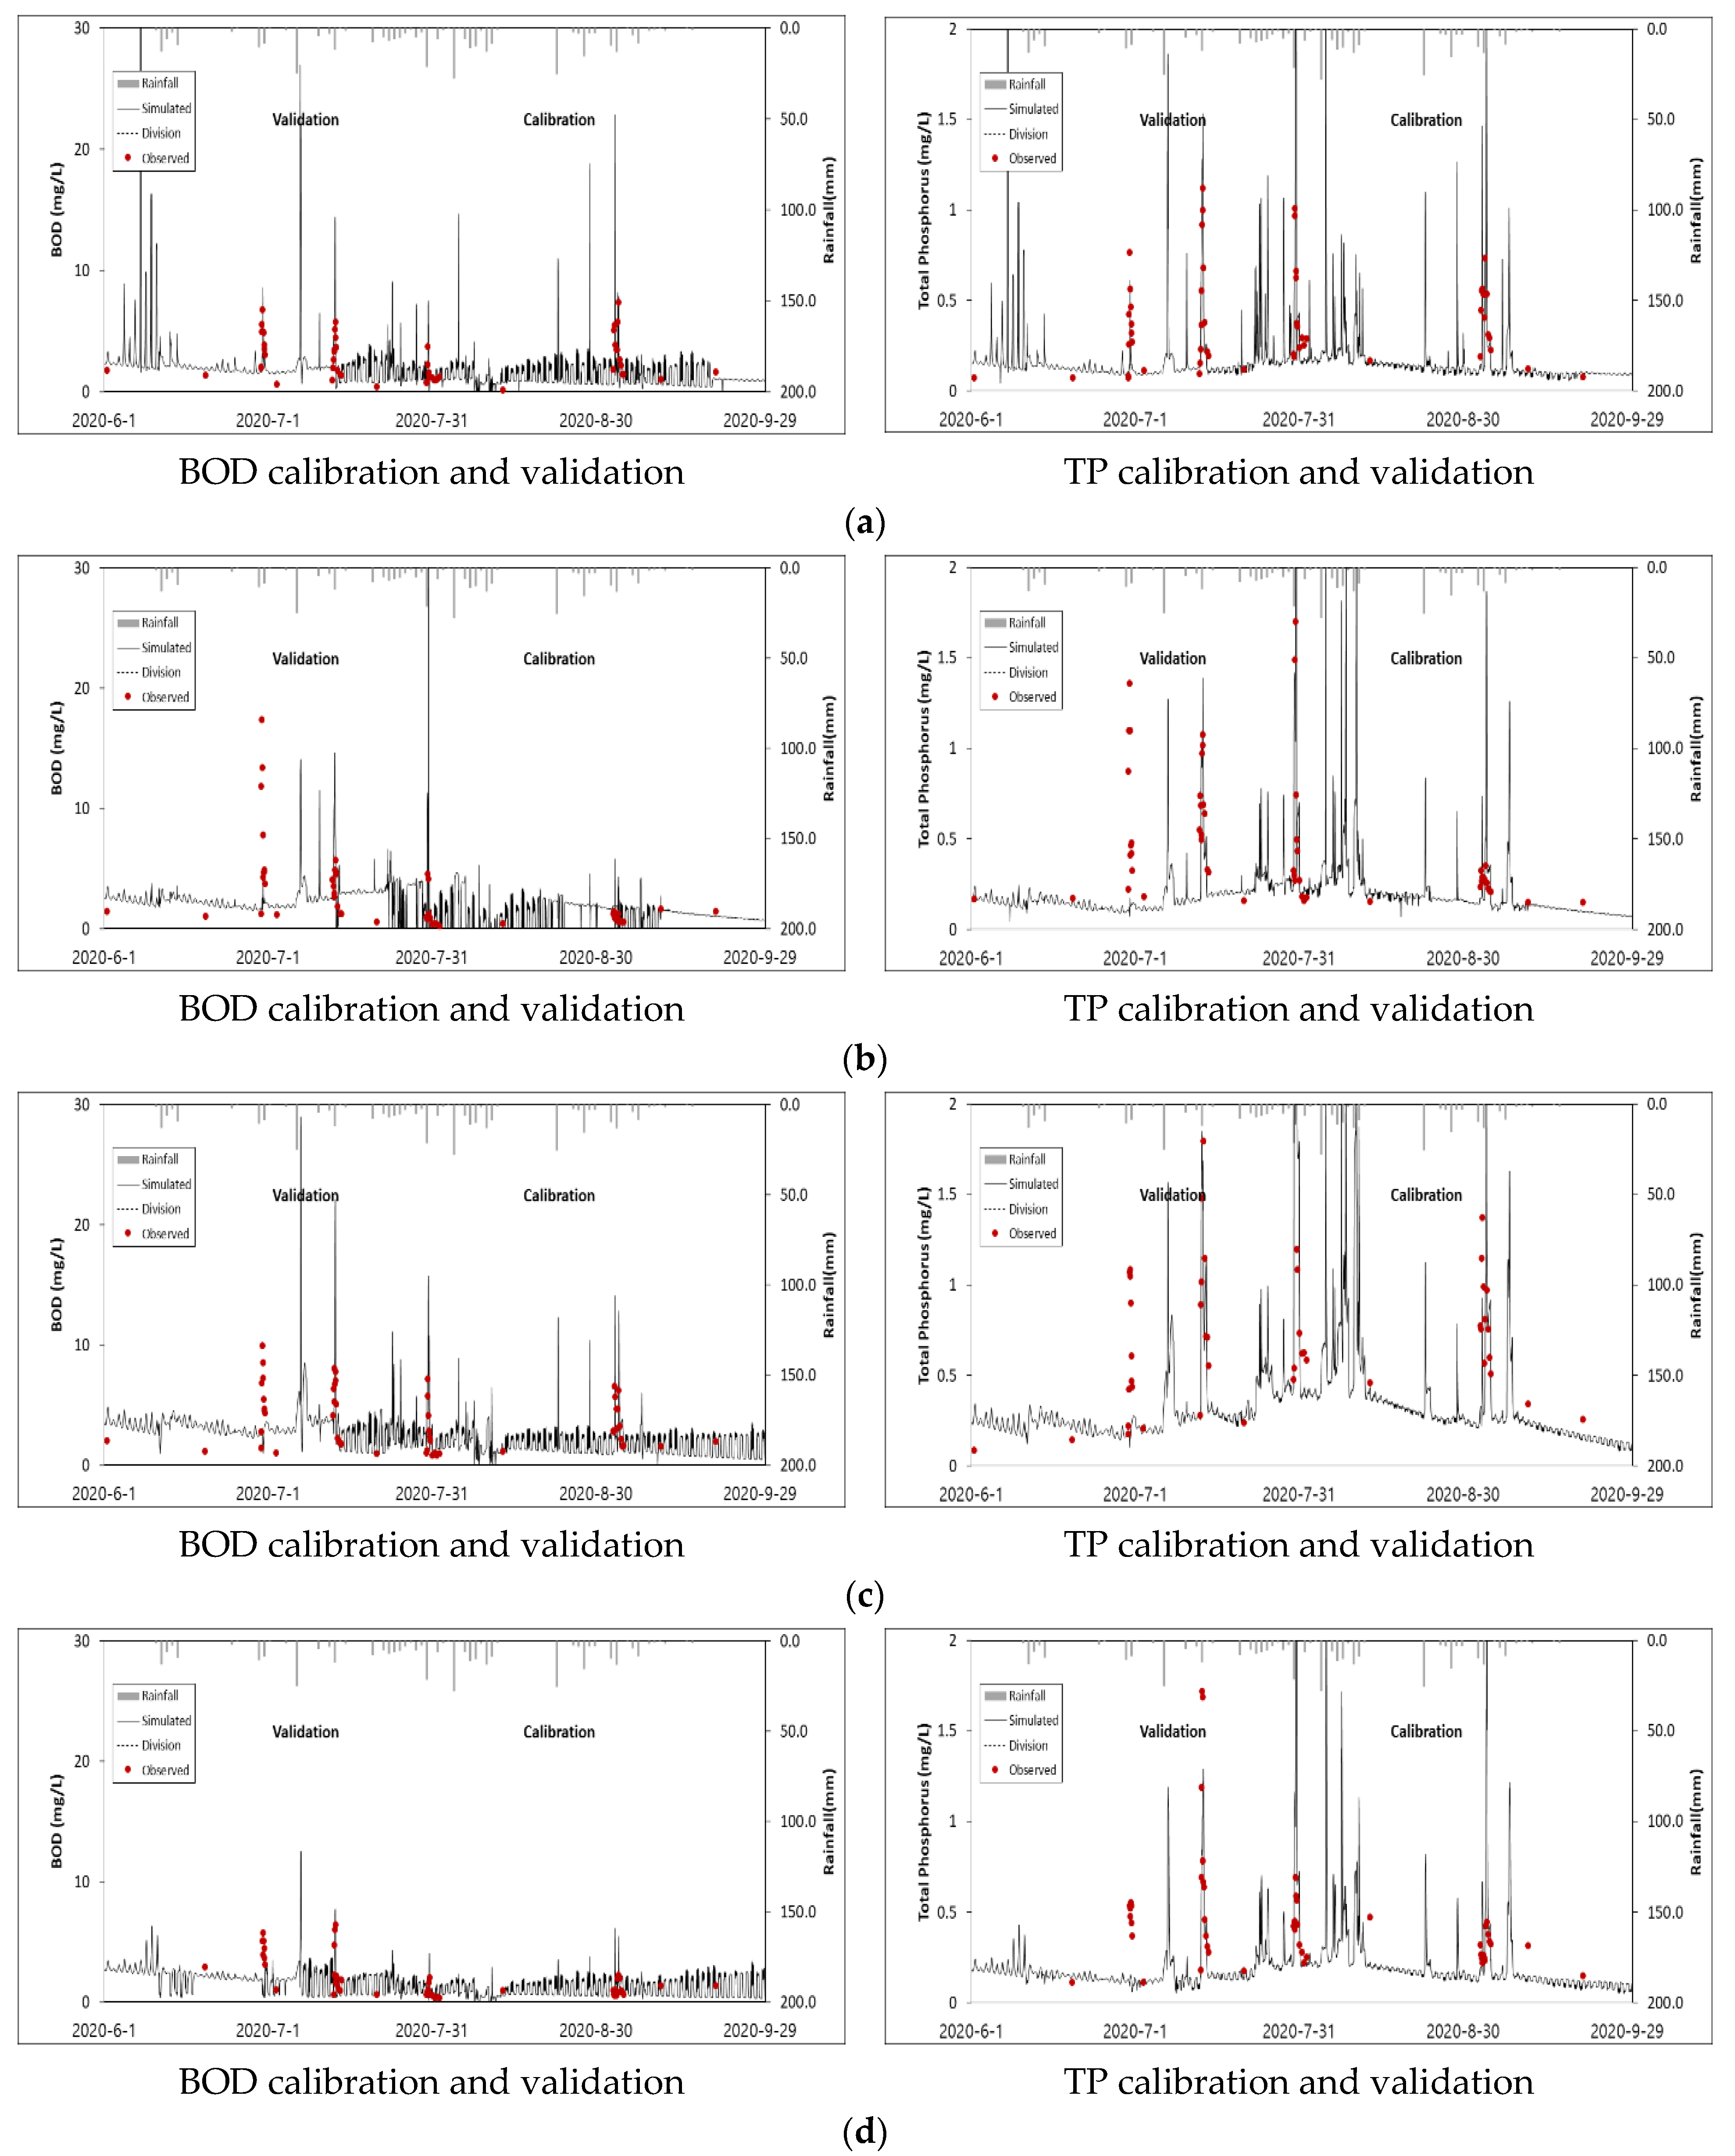
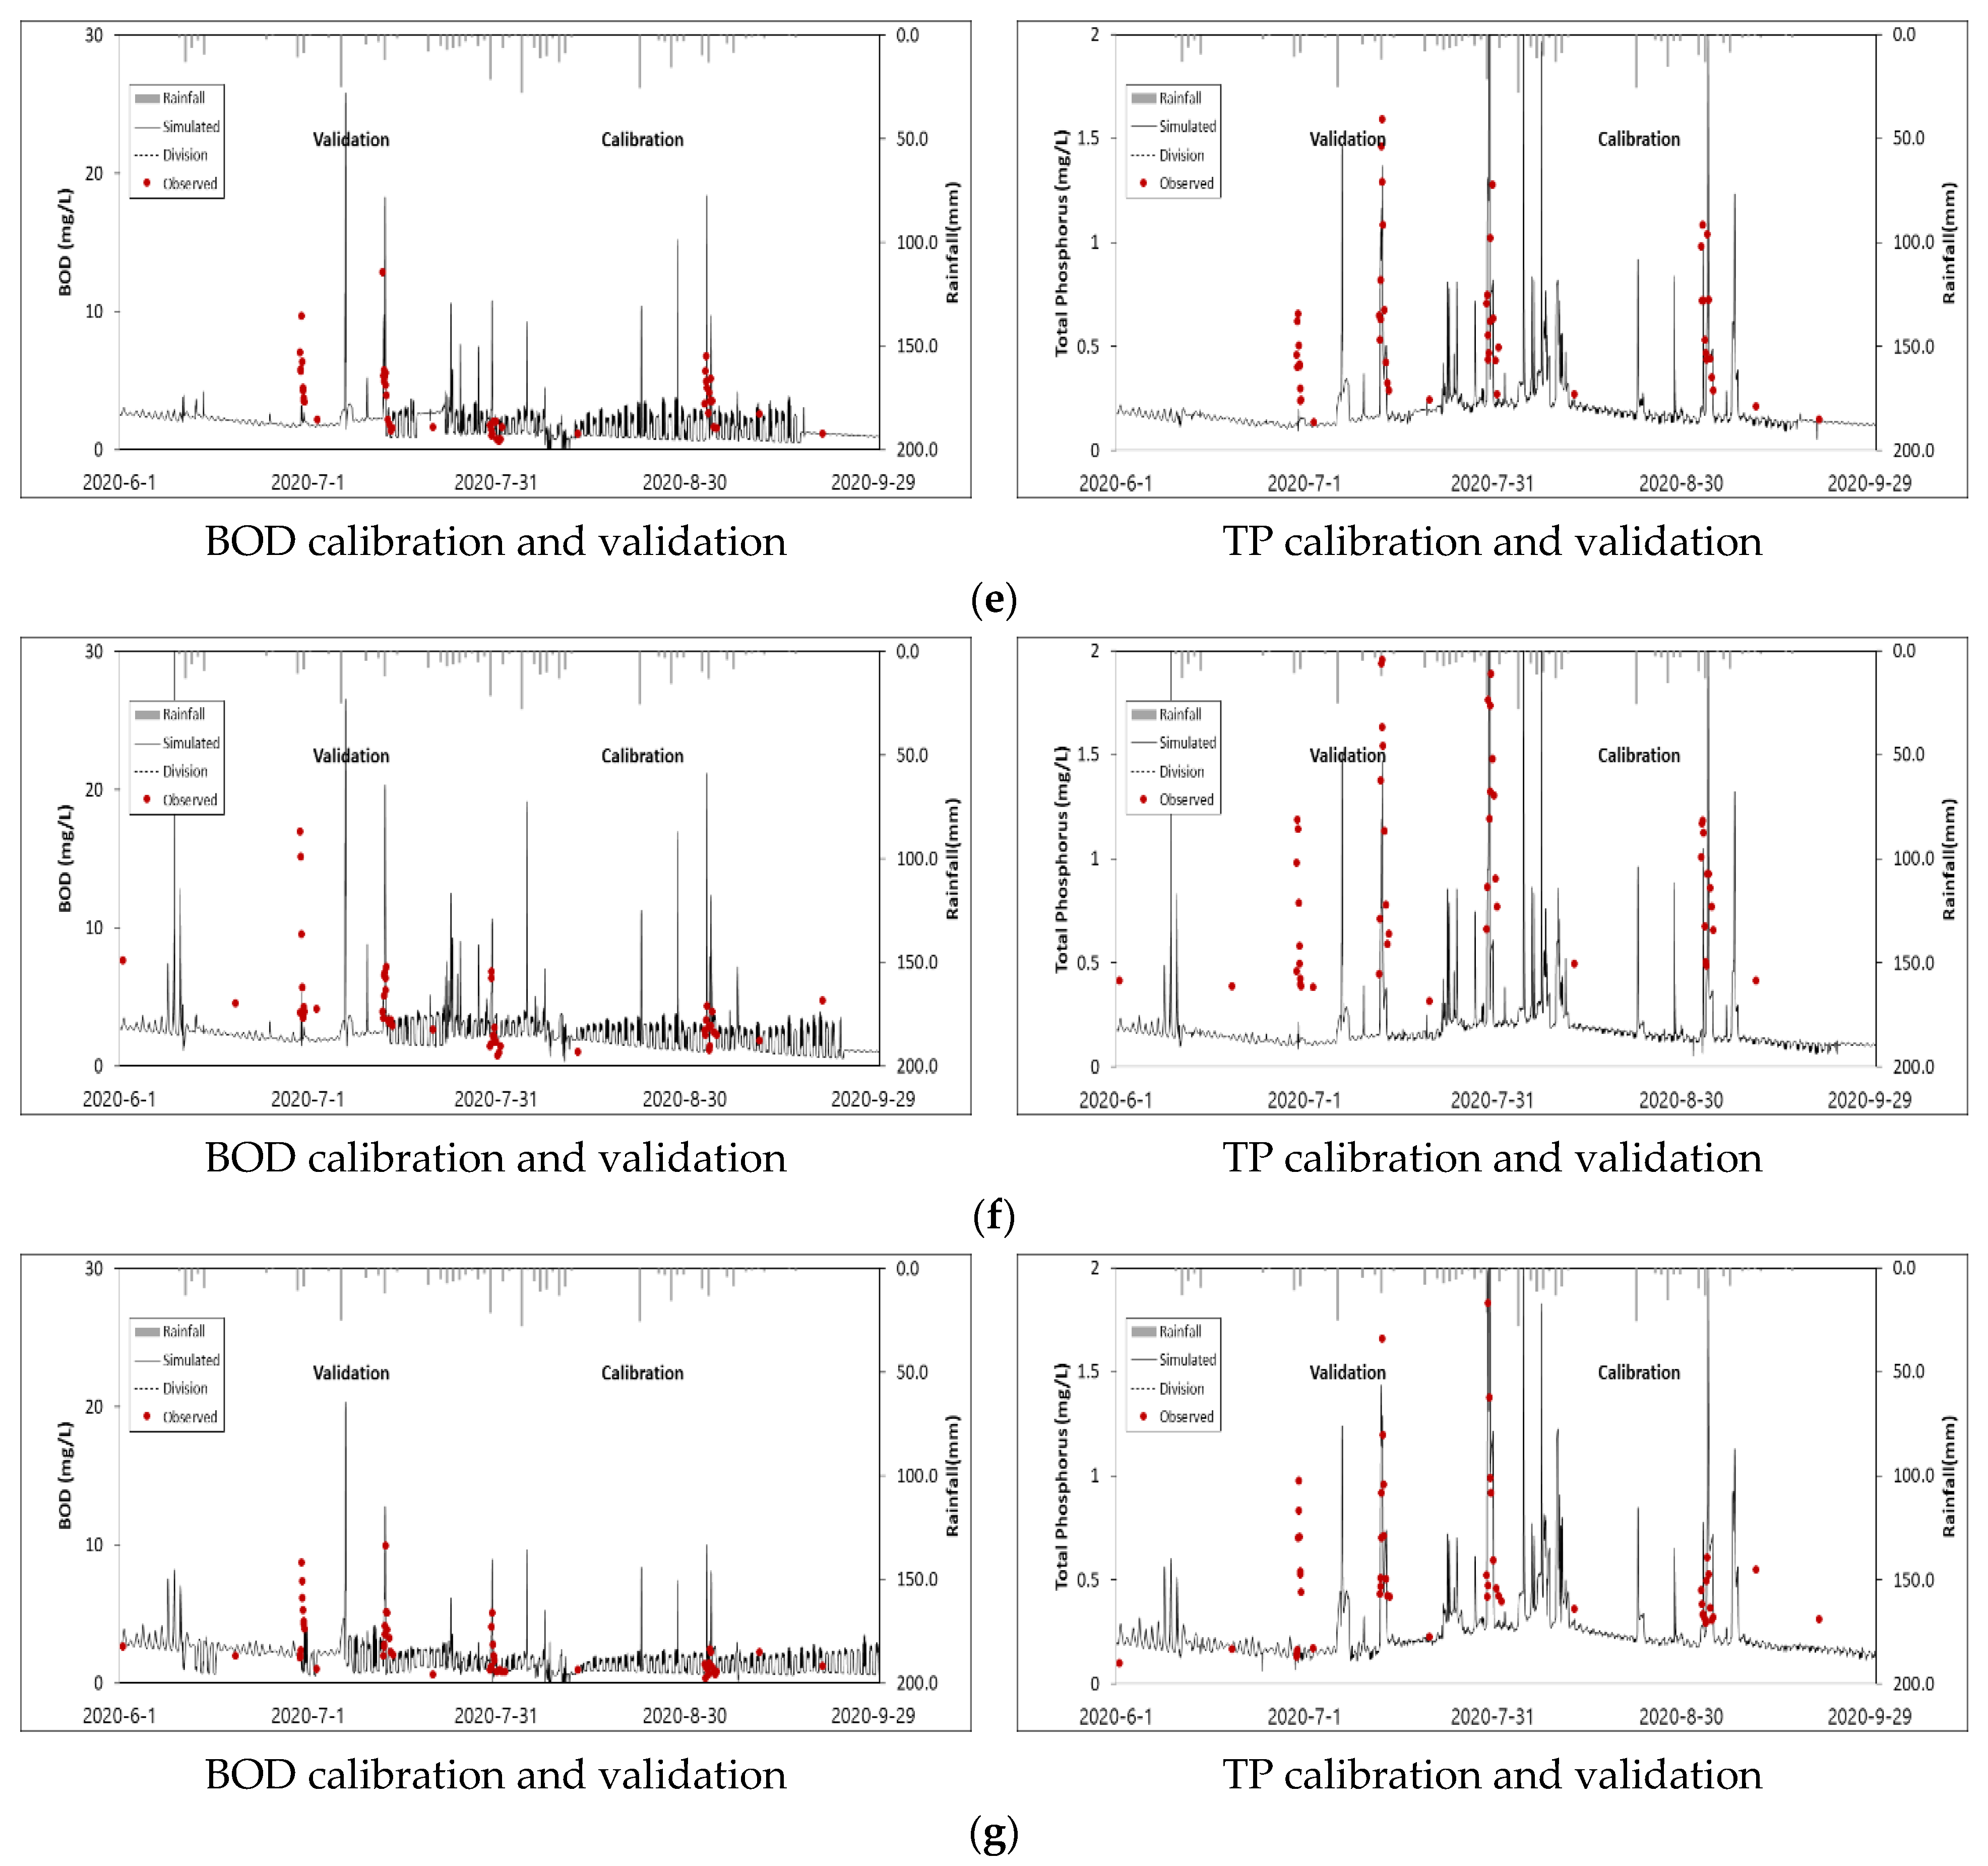
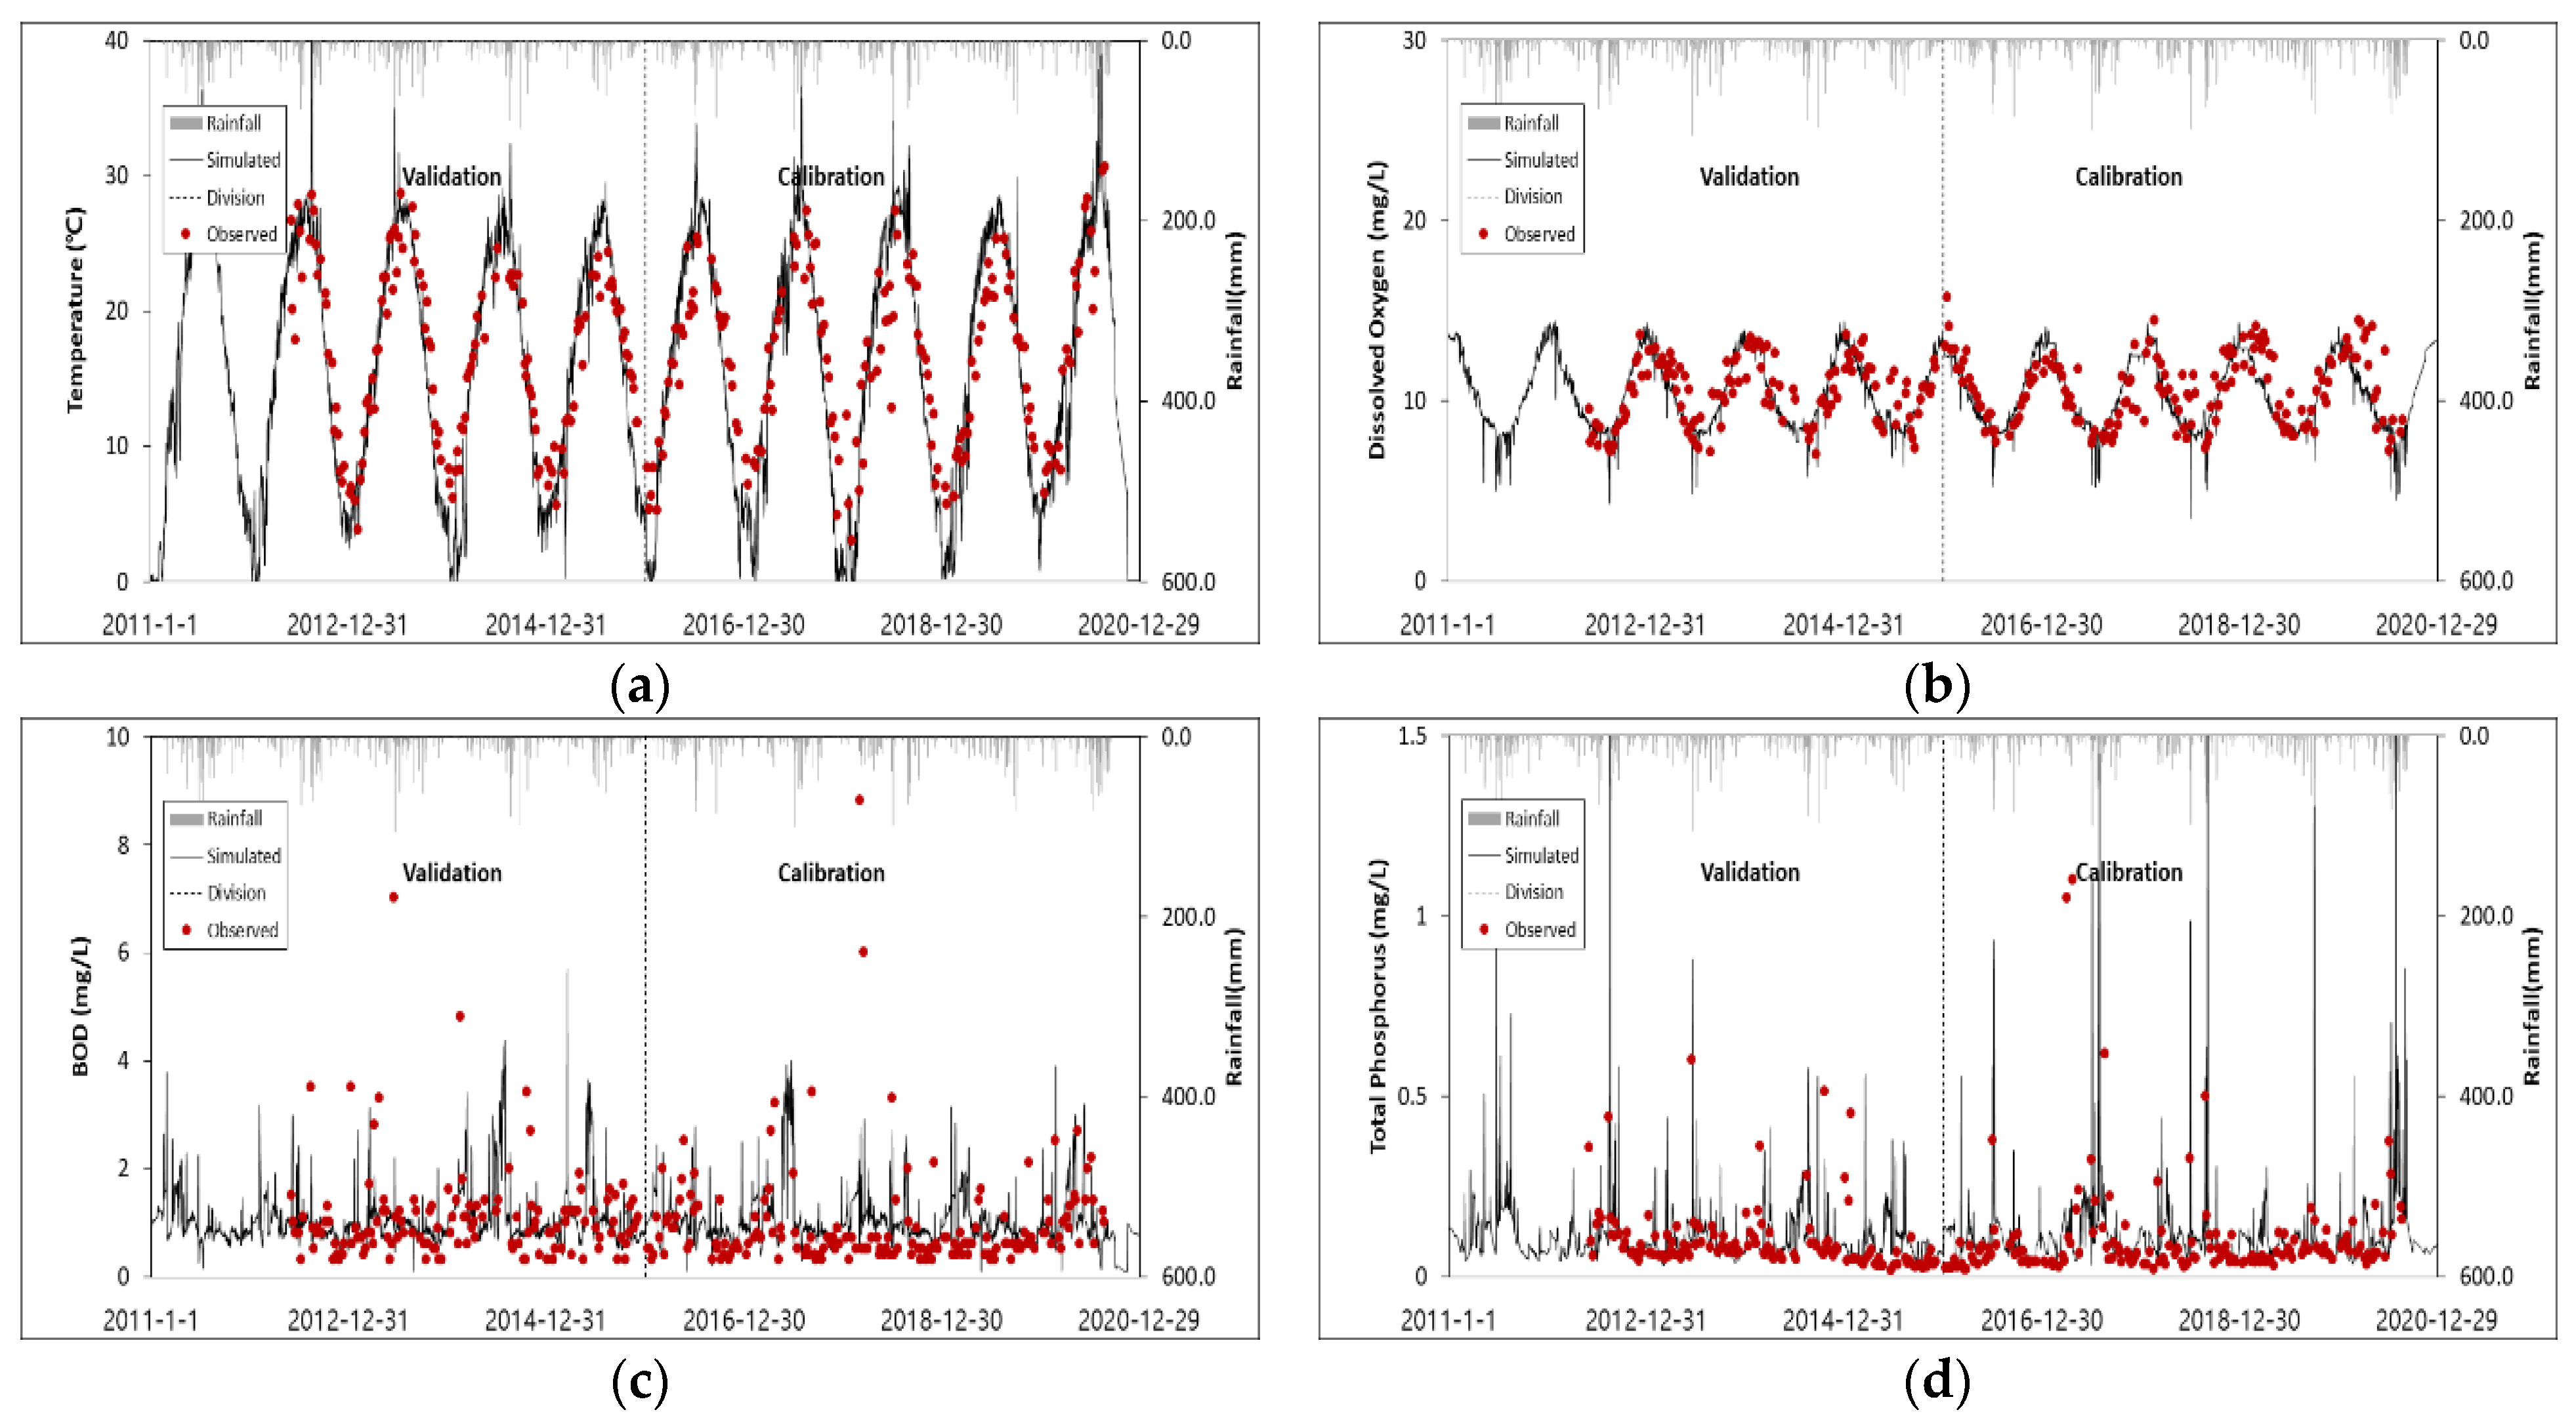
3.2. Model Applicability Evaluation

To evaluate the applicability of the HSPF model, the period from 2011 to 2020 was set as a stabilization period, and calibration and validation were performed for the period from 2009 to 2018. Model calibration is the process of matching the initial conditions and parameters of the model to the conditions of the watershed, and the values of the parameters when the calculated values are in the best agreement with the measured values are estimated [24,25,26]. In this study, %difference proposed by Donogian (2002) was calculated to evaluate the reproducibility of the model. It shows a value closer to zero, as the simulated value is close to the measured value. In addition, R2 proposed by US EPA (2011) was calculated. It shows a value closer to 1 as the simulated value is in better agreement with the measured value. The calibration and validation of the watershed hydrology simulation were performed using the time-series monitoring data at points 1 to 8 in the Figure 5, where monitoring was performed six times during rainfall in 2020. In this instance, since point 8 is the same point at the national measurement network (Songya point), calibration and validation were performed at a total of eight points using the eight-day interval data. It is shown in Figure 6.
When the discharge applicability to the end of the Songya Stream (point 8) was evaluated, it was found that the model reproduced the measured flow well, as the %difference value was Very good, R2 was Good for the calibration period from 2009 to 2013 and the %difference value was also Very good, and R2 was Fair for the validation period from 2014 to 2018 in the Table 6. It is judged that the measured values above a certain level can be reproduced in that the amount of measurement data for the validation period of the point was relatively small, and %difference showed a relatively low error rate.
The water quality calibration period was set as 2009 to 2013 and the validation period as 2014 to 2018. Water quality applicability was evaluated for BOD and TP in the Figure 7 and the Table 7. The results of simulation calibration for the end of the Songya Stream (point 8) showed to be Very good for both BOD and TP in the Figure 8 and the Table 8. The simulation validation results were Very good for BOD and Good for TP, indicating that the water quality simulation results properly reflected reality. In the case of points 1 to 7 in the Songya watershed, however, there were limitations, such as lack of data during rainfall at flow and water quality measurement points. If precise and specific data are supported during rainfall, a model with higher accuracy can be constructed.

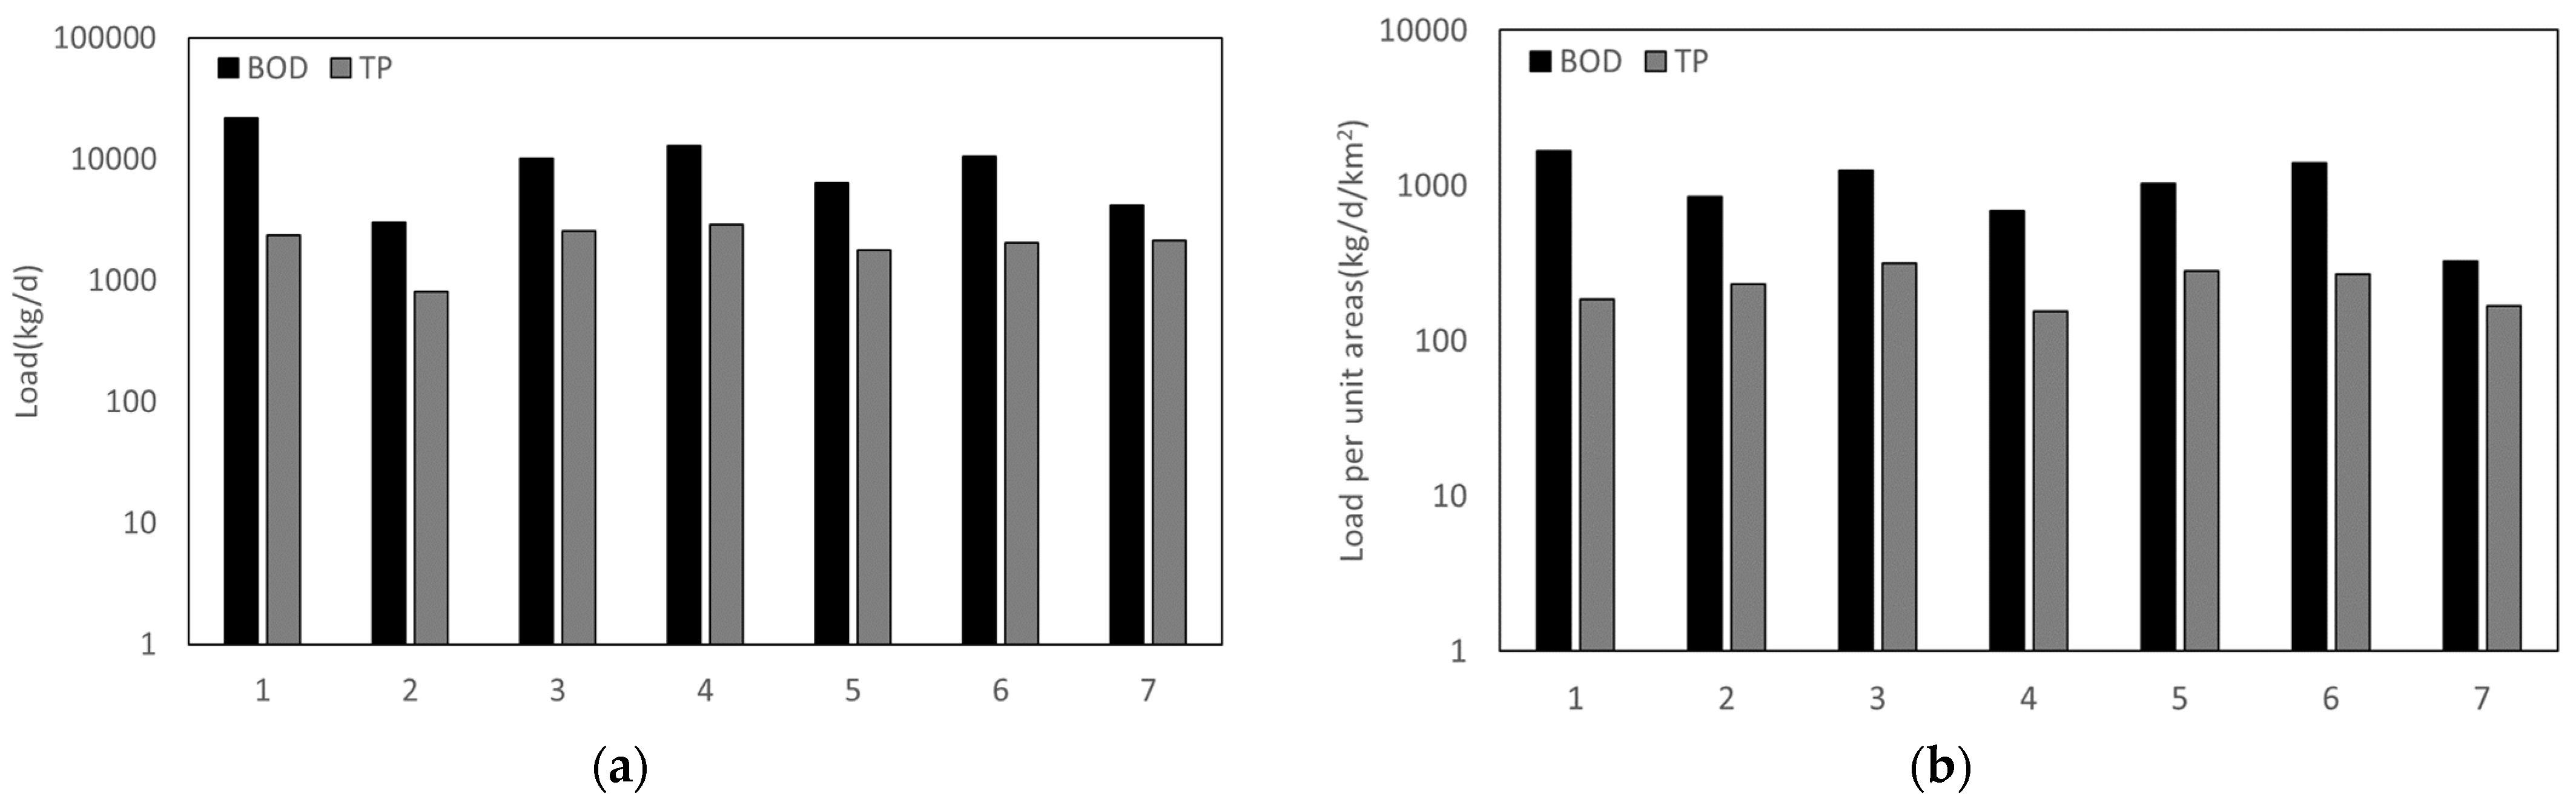
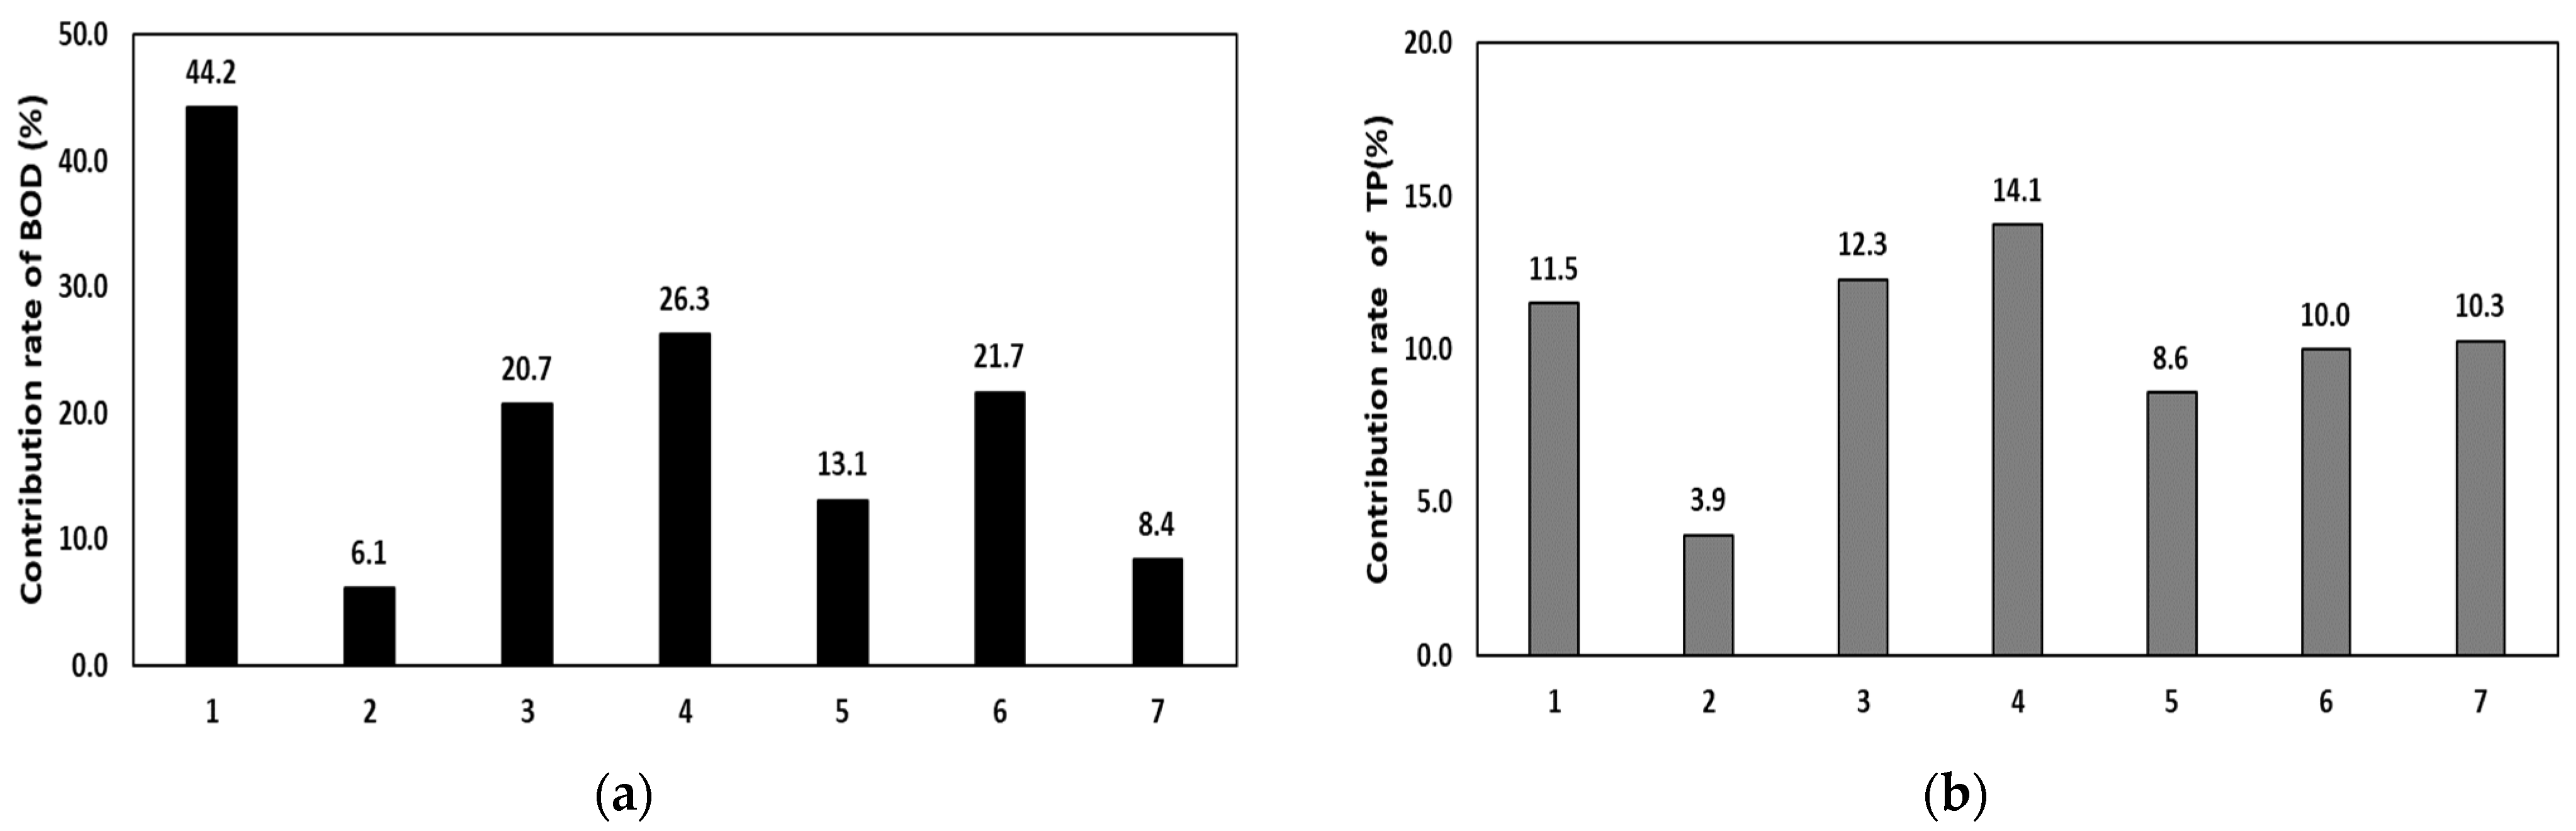
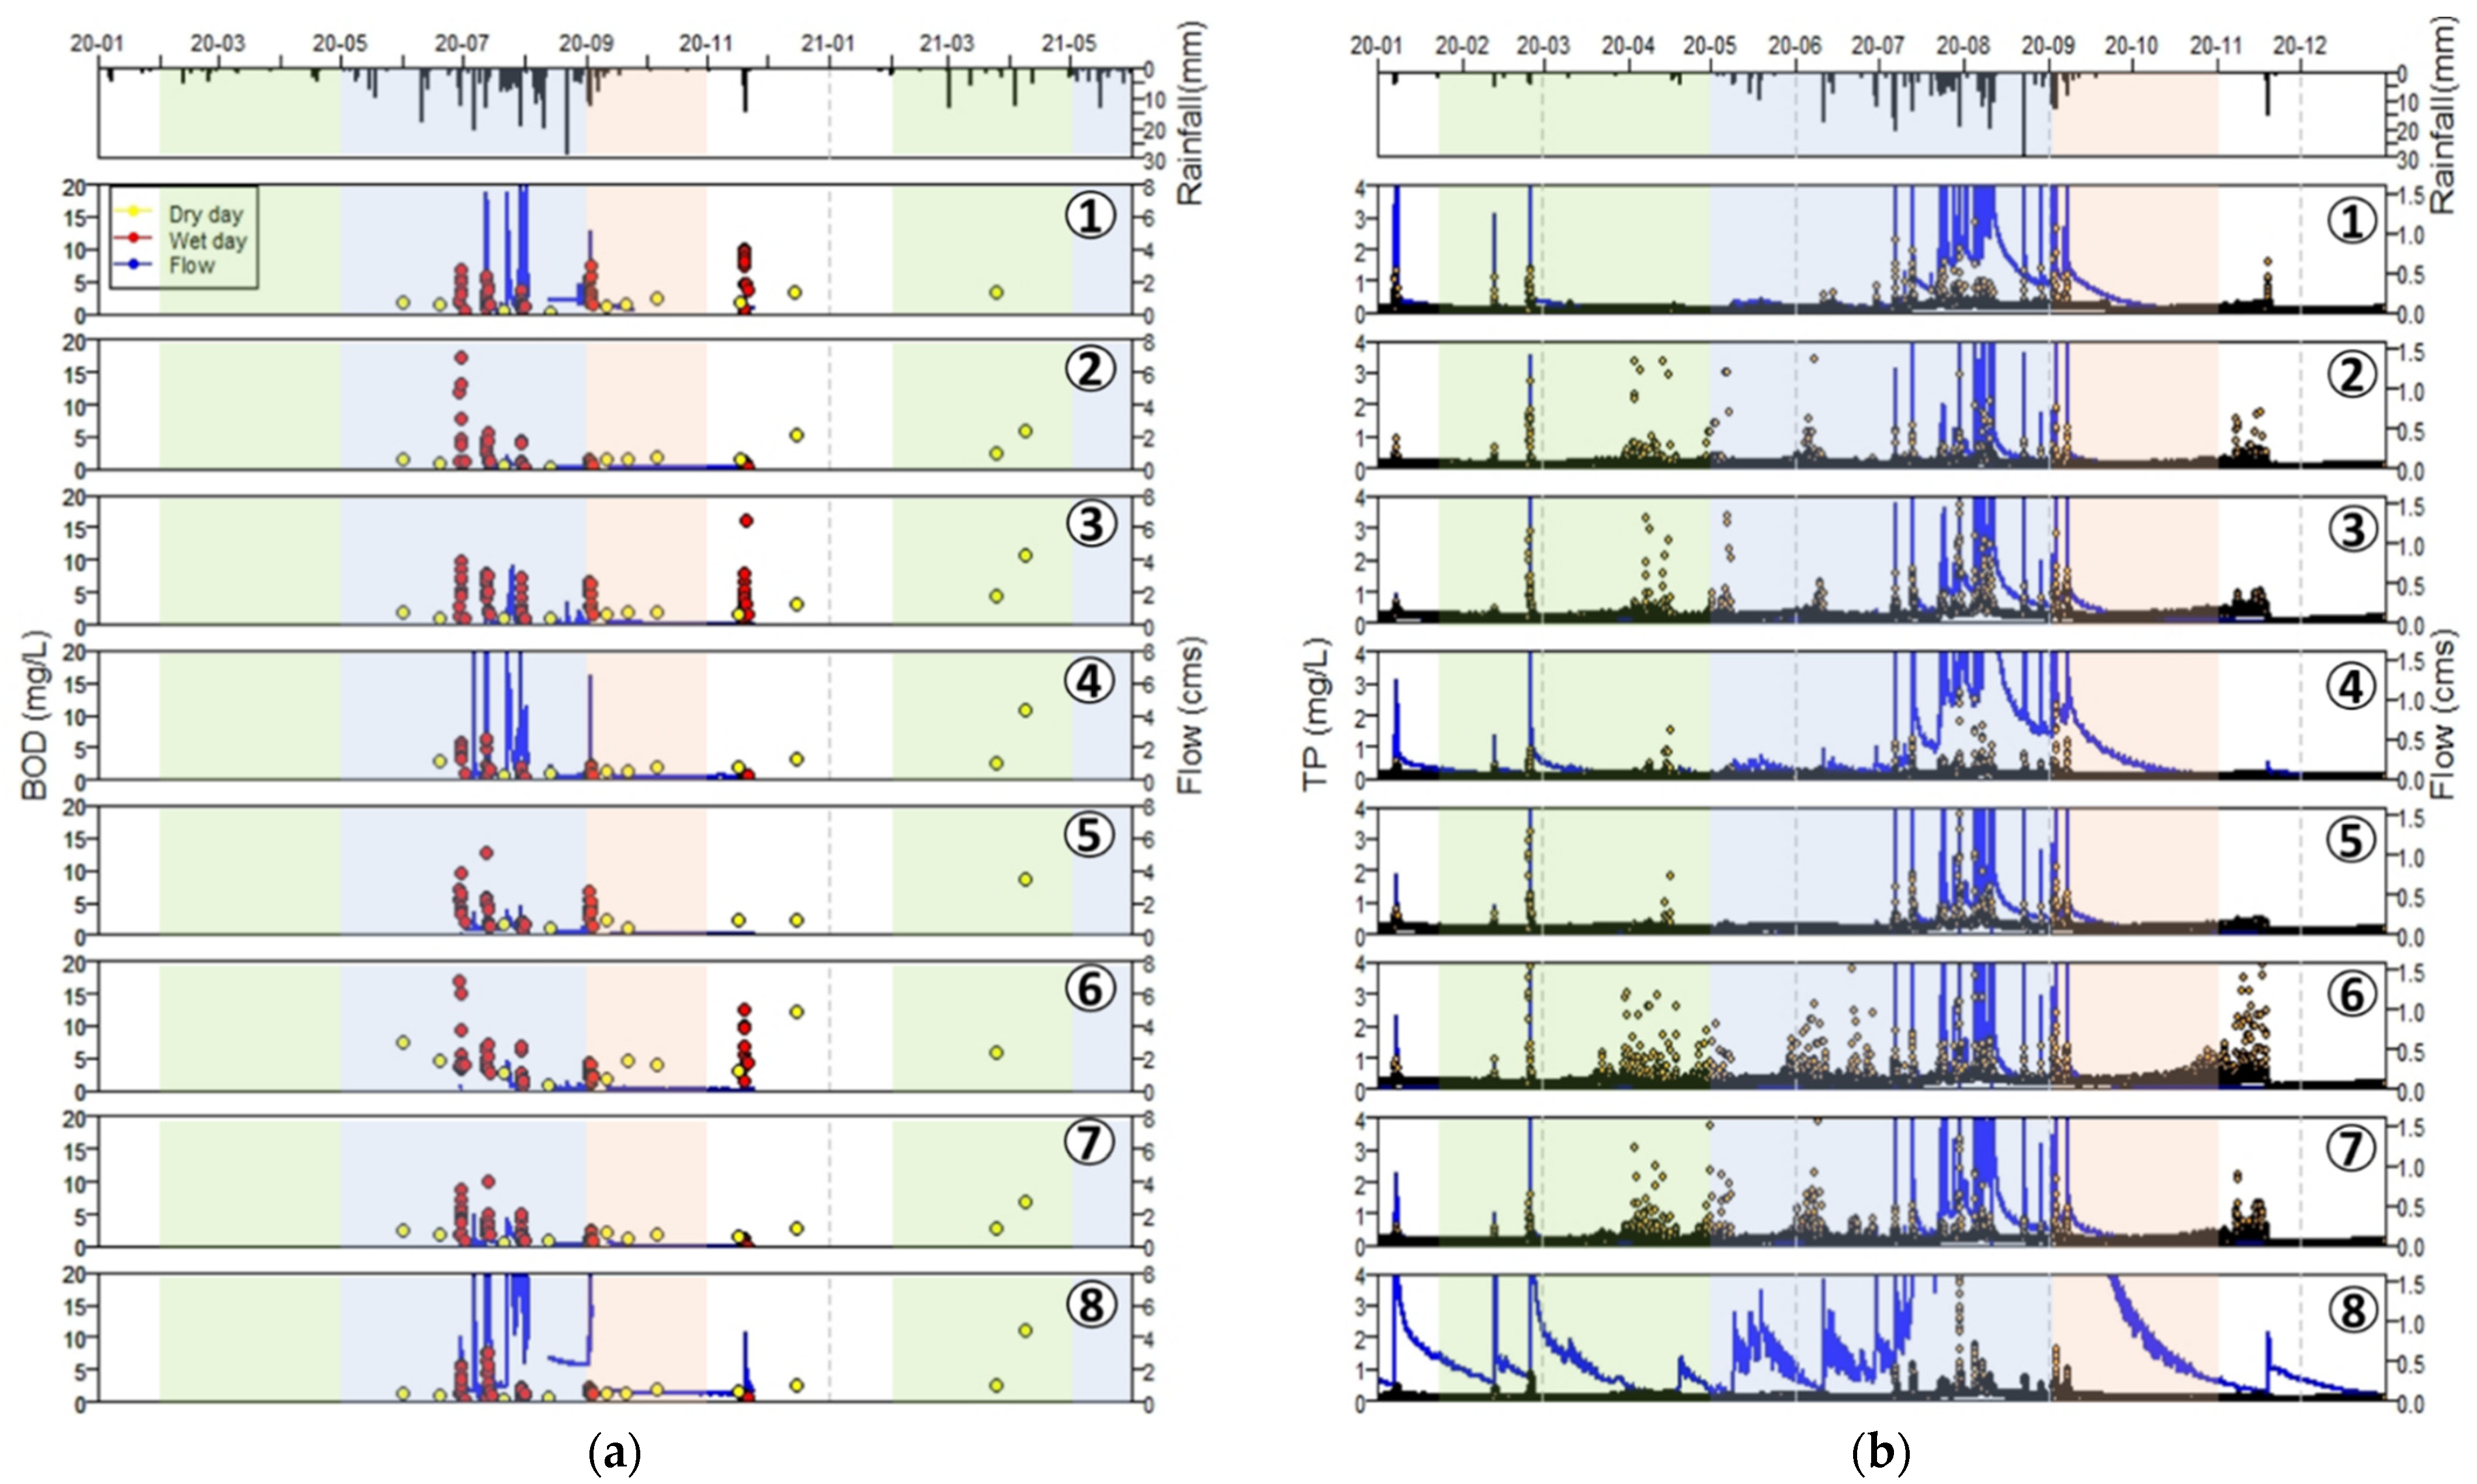
3.3. Calculation of the NPS Pollution Load by Subbasin Using the HSPF Model

To calculate the pollution load for each of the eight subbasins using the HSPF model results of the Songya watershed, the results of running the model after excluding the influence of point sources from the model with confirmed reproducibility were utilized. For each subbasin, the discharge load and the BOD and TP pollution loads per unit area were calculated.
The average BOD load per unit area in 2021 for the each subbasin was calculated to be 1677.1 kg/day/km2 for the upstream area of the Songya Stream, 849.9 kg/day/km2 for the Seoknam Stream, 1254.0 kg/day/km2 for the Mulhan Stream, 684.0 kg/day/km2 for the Myeonggye Stream, 1026.9 kg/day/km2 for the Taejang Stream, 1388.1 kg/day/km2 for the Osan Stream, 324.9 kg/day/km2 for the Seonggok Stream, and 464.4 kg/day/km2 for the downstream area of the Songya Stream. As shown in Figure 9b (black bars), the upstream area of the Songya Stream showed the highest BOD load per unit area followed by the Osan Stream and Mulhan Stream. In this instance, the BOD pollution load contribution to the downstream area of the Songya Stream by subbasin was found to be 44.2% for the upstream area of the Songya Stream, 6.1% for the Seoknam Stream, 20.7% for the Mulhan Stream, 26.3% for the Myeonggye Stream, 13.1% for the Taejang Stream, 21.7% for the Osan Stream, and 8.4% for the Seonggok Stream in the Figure 10a. The upstream area of the Songya Stream showed the highest BOD pollution load contribution followed by the Myeonggye Stream and Osan Stream.
The average TP load per unit area in 2021 for each subbasin was calculated to be 183.6 kg/day/km2 for the upstream area of the Songya Stream, 231.3 kg/day/km2 for the Seoknam Stream, 313.7 kg/day/km2 for the Mulhan Stream, 154.2 kg/day/km2 for the Myeonggye Stream, 283.6 kg/day/km2 for the Taejang Stream, 269.3 kg/day/km2 for the Osan Stream, 166.8 kg/day/km2 for the Seonggok Stream, and 195.5 kg/day/km2 for the downstream area of the Songya Stream. As shown in Figure 9b (gray bars), the Mulhan Stream showed the highest TP load per unit area followed by the Taejang Stream and Osan Stream. In this instance, the TP pollution load contribution to the downstream area of the Songya Stream by subbasin was found to be 11.5% for the upstream area of the Songya Stream, 3.9% for the Seoknam Stream, 12.3% for the Mulhan Stream, 14.1% for the Myeonggye Stream, 8.6% for the Taejang Stream, 10.0% for the Osan Stream, and 10.3% for the Seonggok Stream in the Figure 10b. The Myeonggye Stream showed the highest TP pollution load contribution followed by the Mulhan Stream and the upstream area of the Songya Stream.
The upstream area of the Songya Stream as well as the Mulhan Stream, Taejang Stream, and Osan Stream showed high BOD and TP loads per unit area. Among them, the Mulhan Stream and Osan Stream exhibited high loads for both BOD and TP.
The farming conditions in the target area, including the area (km2) and the proportion of the area used for farming among the area of paddies and fields in the watershed area (%), were analyzed using the farm map [27]. This includes geographic information, such as the land use, elevation, cultivation status, area, and slope, for each lot number of the target area in the Figure 11. The results are shown in the Table 9 below. The proportion of the area used for farming was as high as 99.8% for the Mulhan Stream and 99.9% for the Osan Stream. Studies that evaluated the major impact of NPSs that occur in rural areas [15,28,29] reported that the occurrence of NPSs increases during rainfall with the size of farmland. As in previous studies, the proportion of the area used for farming was also found to be high in the Mulhan Stream and Osan Stream with high BOD and TP pollution loads. The Mulhan Stream showed a high proportion of the uncultivated site (0.4%) in the target area, but the Osan Stream exhibited a low proportion of the uncultivated site (0.1%). The explanation in the target site was detailed in the Table 9. Therefore, it is judged that the degree of pollution sources, such as BOD and TP, is high during rainfall in the subbasins with active agricultural activities because fertilizers are discharged into the rivers along with soil due to surface runoff.

3.4. Selection of Priority Management Areas for NPSs (NPS Measures)

Overall rankings for the subbasins were calculated by estimating the pollution sources per unit area, river water quality, load, and nonpoint contribution rate, and the Songya watershed, the Mulhan Stream, Osan Stream, and the upstream area of the Songya Stream were derived as priority areas in order. In the target area, the population per unit area was in order of the Seoknam Stream (87 persons/km2), Osan Stream (66 persons/km2), and Seonggok Stream (51 persons/km2). The Seoknam Stream, which is the upstream subbasin of the Songya Stream, had the largest population.
The numbers of pigs, Korean cattle, and chickens are shown in the Figure 12 below. The Mulhan Stream showed the largest number of livestock per unit area (20,452 units/km2) followed by the Seonggok Stream (10,305 units/km2) and Myeonggye Stream (6945 units/km2). The Mulhan Stream had the largest area of fields and paddies per unit area (32.6%), followed by the Seoknam Stream (31.2%) and Myeonggye Stream (29.3%).
As shown in the Figure 13, the proportion of the area of fields, paddies, orchards, and ginseng farm in the farm map per the farmland area of the unit watershed was analyzed based on the results of Section 3.3 that used the farm map. The results are 100.0% for the Osan Stream, 84.8% for the Myeonggye Stream, and 81.3% for the Mulhan Stream.
To analyze the causes of various sources in these rural areas and the NPSs discharged to rivers during rainfall, the water quality, load, and nonpoint contribution rate of rivers were calculated.
As shown in the Figure 14, the average water quality concentration during rainfall for each river was found to range from 1.6 to 5.9 mg/L for BOD and from 0.388 to 1.228 mg/L for TP. In particular, TP was analyzed to be at a very bad level based on the river living environment criteria [29]. The maximum water quality concentration during rainfall was found to range from 9.9 to 49.8 mg/L for BOD and from 1.590 to 10.138 mg/L for TP. All items were analyzed to be at the very bad level based on living conditions criteria around rivers.
The Osan Stream showed the largest discharge of high-concentration pollutants during rainfall, followed by the upstream area of the Songya Stream and the Mulhan Stream. This result was similar to the model’s calculation of the NPS pollution load per unit area of the model, with the upstream area of the Songya Stream being highest, followed by the Osan Stream and the Mulhan Stream. It is judged that the monitoring results measured during rainfall can affect the NPS pollution load.
Based on the Table 10 below, the overall rankings were calculated in this study by grading the analysis results of each item into order, from the first to third. Farming condition areas are area of fields, paddies, orchards, facilities and ginseng farm per area of fields and paddies by subbasins.Consequently, the Mulhan Stream was ranked the highest rank, followed by the Osan Stream and the upstream area of the Songya Stream, and the Mulhan Stream was determined to be the priority management area. When the proportions of farmland and forests, which are representative land covers, were extracted and compared for each subbasin, it was found that the priority was relatively high in the subbasins with a high proportion of farmland. Therefore, the major river subbasins in the upstream area of the Songya Stream were selected as the areas where NPSs were highly likely to occur, requiring installation of NPS reduction facilities preferentially.

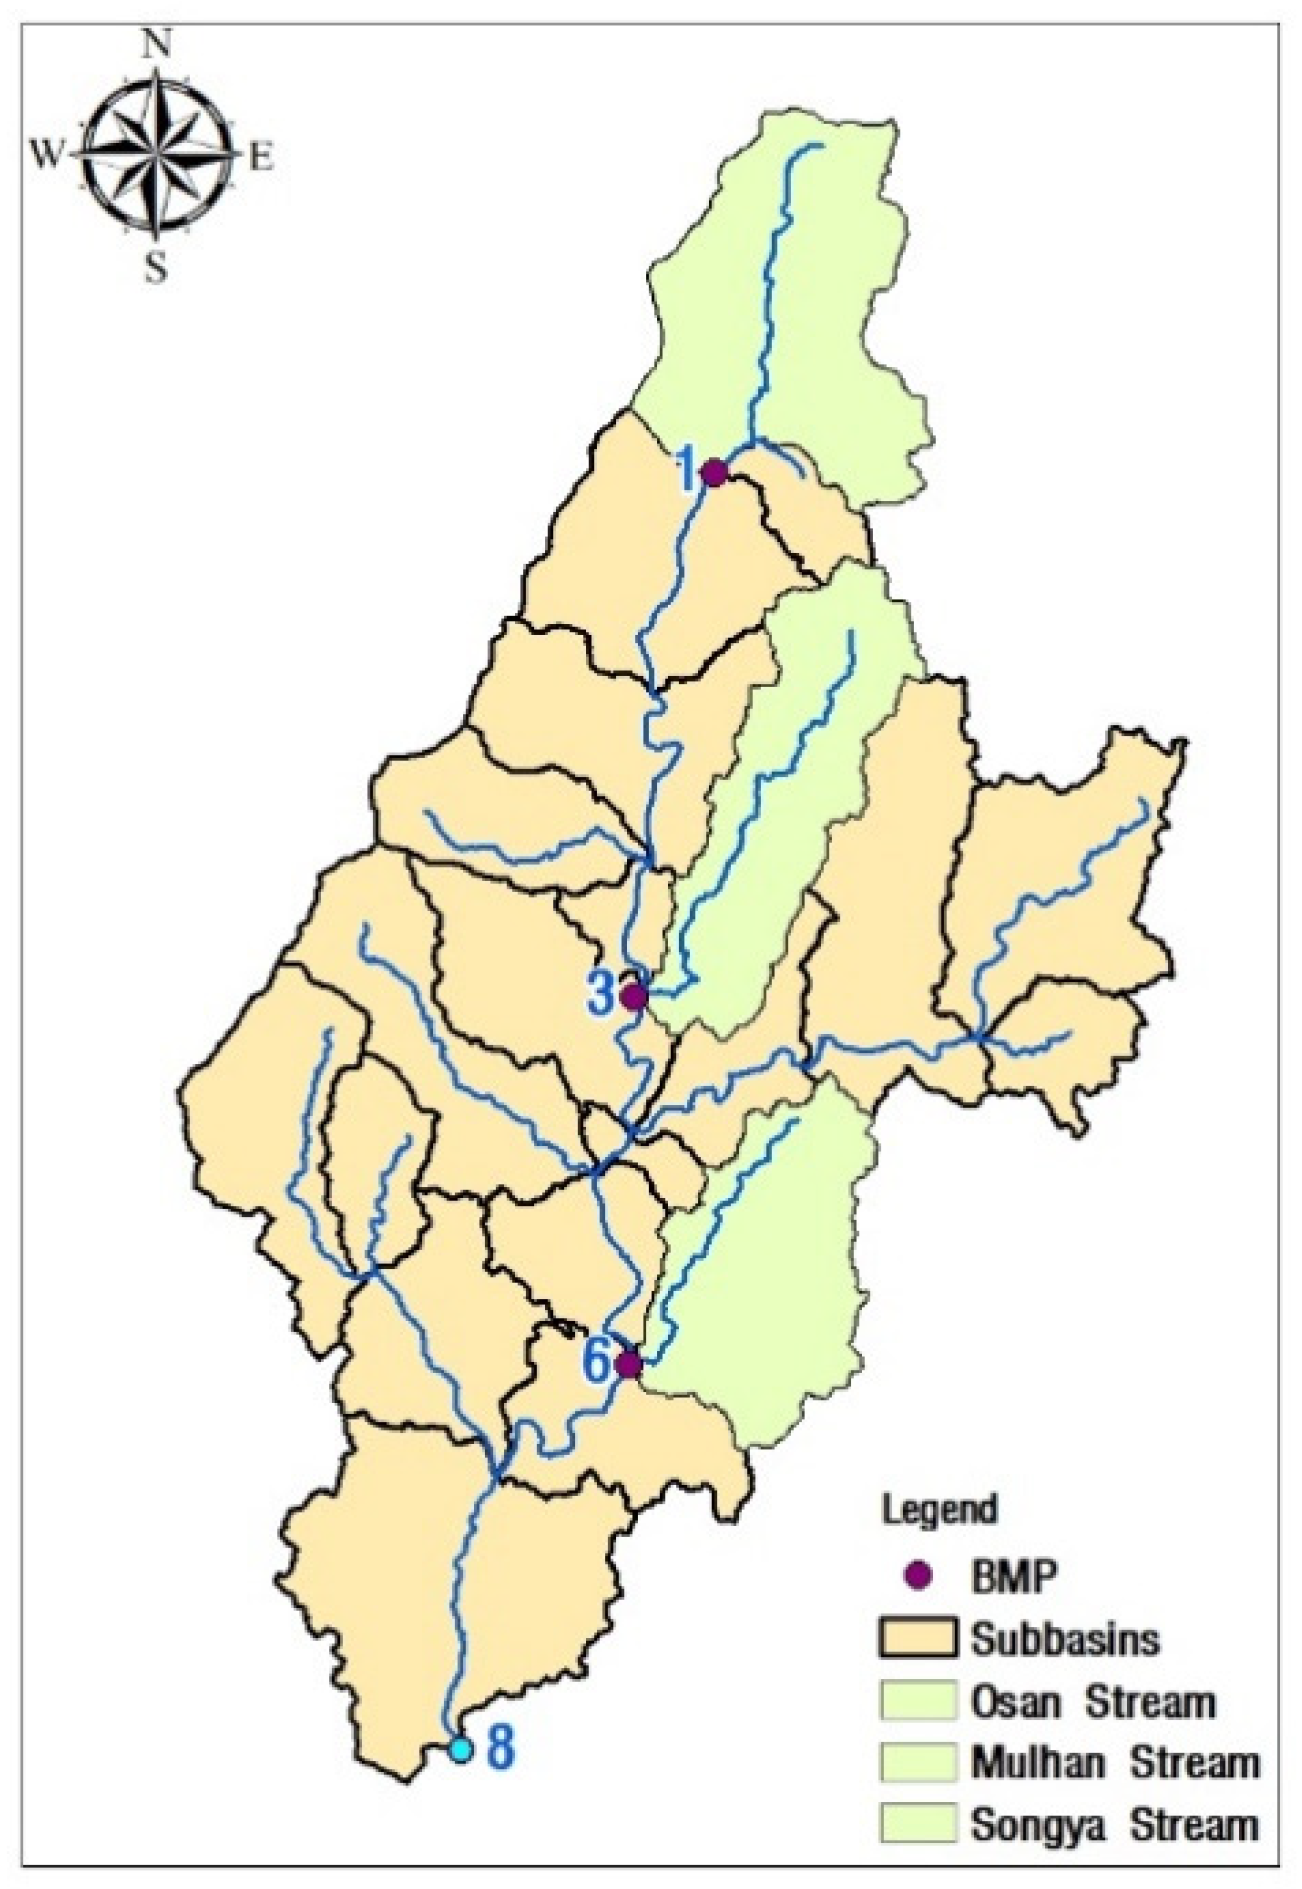
3.5. Analysis of the NPS Improvement Effect through the Application of Appropriate BMPs (NPS Reduction Facility Installation Point Evaluation)

As for appropriate BMPs, applicable facilities must be selected after analyzing major NPSs that occur during rainfall, based on the land-use characteristics of sites and drainage areas in the target area. In the target area of this study, farmland had the highest proportion at 25.5% among the land uses, excluding forests and including agricultural area with the characteristics of paddies, fields, facility cultivation sites, and livestock housing. Due to the generation of nutrients in farmland and livestock housing, it is deemed appropriate to select facilities with high removal efficiency for each item. Therefore, based on the manual and guidelines researched previously [18], an artificial wetland with the highest removal efficiency for BOD (53%) and TP (60%) among the target materials, as well as the storage function among the natural facilities, was selected [19].
The following scenarios were prepared and analyzed for the proper placement of facilities for rural NPS management. According to previous studies, some studies reported that the NPS improvement effect is high if NPS reduction facilities are installed at the end of a watershed in consideration of the self-purification of rivers [20]. Conversely, other studies reported that it is desirable to install such facilities in subbasins that may exhibit the largest amount of NPS pollutants as in this study because NPSs occur in multiple unspecific areas [17].
Therefore, in this study, the optimal management location was selected by executing the HSPF model after selecting the BMP artificial wetland with the same capacity at the priority management area and the end of the Songya Stream where tributaries join. As for the capacity, the initial rainfall of 5 mm was used as a value and the applicable area was assumed to be 20 ha in accordance with the existing domestic guidelines [19]. An artificial wetland with a capacity of 1000 m3 was installed at the end of the Mulhan Stream, Osan Stream, and the upstream area of the Songya Stream with high priority rankings. In addition, the watershed model HSPF was used to evaluate the NPS improvement effect at the end of the target area based on the water quality and load.
The artificial wetland was added into WDM by newly designing OUTDGT for the Mulhan Stream, Osan Stream, and the upstream area of the Songya Stream and adding the BMP function in the UCI file of HSPF. The BMP installation location is shown in Figure 15. In addition, the reduction efficiency of BOD 53% and TP 60% presented in the guidelines were entered. Consequently, for the Mulhan Stream, BOD (0.982 mg/L) was improved by 9.9% and TP (0.096 mg/L) by 8.2% compared to no countermeasure. For the Osan Stream, BOD (0.318 mg/L) was improved by 1.6% and TP (0.034 mg/L) by 4.5%. For the upstream area of the Songya Stream, BOD (0.268 mg/L) was improved by 17.3% and TP (0.026 mg/L) by 14.6%. After installing each facility in the priority areas, the water quality at the end of the Songya Stream (point 8) was improved by 9.2% for BOD (1.497 mg/L) and 6.0% for TP (0.178 mg/L).
These results can be compared with the results of the Lake Doam watershed, which has been designated as an NPS management area for more than ten years. In the Lake Doam watershed, a representative upland field, various facilities were applied from 2008 to 2017, including grit chambers and artificial wetlands. Consequently, at the target point of the Song Stream, which is the end of the management area, an improvement of approximately 18.1% was observed after the application of the management plan (SS 33.1 mg/L) compared to before the designation of the management area (SS 40.4 mg/L) [30,31]. Although there are differences in target materials, the results of this study according to the priority application are judged to be more economical in terms of time and space compared to the Lake Doam watershed. In this study, priority subbasins for NPS reduction facility installation were selected using the monitoring and HSPF results for the Songya watershed, followed by comparison and evaluation. The results of this study are expected to be used when management plans for the Songya watershed are established in the future. In the future, comprehensive research on the water quality improvement effect by various NPS reduction facilities will be required.

4. Conclusions

In this study, flow and water quality were monitored during rainfall for the Songya watershed, and priority subbasins were selected by constructing Hydrological Simulation Program Fortran (HSPF), a watershed model. Through the basic survey and the simulation of the watershed environment, including pollution sources in the target area and monitoring results during rainfall, this study examined the model’s reproducibility for BOD and TP from 2011 to 2020. After classifying eight subbasins for major streams and items for nonpoint source (NPS) evaluation, priority subbasins with high NPS occurrence were selected through a comprehensive evaluation method. As for indicators for priority evaluation, relevant indicators were sought by dividing NPS action stages into generation and discharge stages to select indicators that may have a significant impact on NPSs. NPS pollutant items that may affect public waters were considered as relevant indicators. Since evaluation criteria and types are different, a standardization process is required for priority calculation. The method used in this study involved determining rankings by grading the targets. After listing rankings for each evaluation item, three subbasins with the highest frequency were finally selected.
Consequently, the Mulhan Stream, Osan Stream, and the upstream area of the Songya Stream were selected as priority subbasins. The load of the Mulhan Stream, which ranked first, was calculated to be 12.5 kg/day/km2 for BOD and 3.1 kg/day/km2 for TP. The Mulhan Stream exhibited the largest area (278.53 ha; approximately 32.6% per unit area) of farmland (fields and paddies), and it was found that the farmland area in use was a major source of rural NPSs.
In this study, among the structural methods that can quantify the NPS improvement effect, an artificial wetland with the highest removal efficiency for nutrients from soil and fertilizers was selected which considered the land use concentrated on agriculture and livestock housing.
When the NPS improvement effect was evaluated by assuming an artificial wetland with the same capacity as a model at the end of the three subbasins selected as priority areas and the end of the target watershed, water quality at the end of the Songya Stream was improved (BOD 6.4% and TP 4.3%). This indicates that it is possible to manage rural NPSs, with a focus on the end of priority subbasins for the areas with monotonous natural flow and riverbeds, just like the target area of this study, amongst agricultural areas generally. In the future, if NPS reduction facilities are installed, efficient NPS management will be possible in areas similar to the target area of this study.

Author Contributions

Contributions: All authors contributed meaningfully to this study. Conceptualization and methodology, J.K.; software, J.K. and J.C.; formal analysis, J.K. and J.C.; investigation, J.M.L. and J.L. and H.J.; writing—original draft preparation, J.K.; writing—review and editing, M.P. and J.-H.M.; supervision, J.-H.M.; project administration, E.H.N. All authors have read and agreed to the published version of the manuscript.

Funding

This work was supported by a grant from the National Institute of Environmental Research (NIER), funded by the Ministry of Environment (ME) of the Republic of Korea (NIER-2021-01-01-029).

Institutional Review Board Statement

Not applicable.

Informed Consent Statement

Not applicable.

Data Availability Statement

Not applicable.

Conflicts of Interest

The authors declare no conflict of interest.

References

  1. Ministry of Water and Environment Policy of Environment. The Third Comprehensive Measures for Rainfall Runoff; Ministry of Water and Environment Policy of Environment: Sejong-si, Korea, 2020.
  2. Yoon, C.G. Development of Nonpoint Source Pollution Reduction and Optimal Management Techniques for Paddies; Korean Society of Agricultural Engineering: Seoul, Korea, 2017.
  3. Korea Environment Institute (KEI). Reduction of the Non-Point Source Pollution in the Rice Paddy Field; Korea Environmental Institute: Sejong, Korea, 1998. [Google Scholar]
  4. Song, H.W. Application of HSPF Model for Effect Analyses of Watershed Management Plans on Receiving Water Qualities. J. Korean Soc. Environ. Eng. 2009, 31, 358–363. [Google Scholar]
  5. Maugis, C.; Celeux, G.; Martin-Magniette, M.L. Variable selection in model-based clustering: A general variable role modeling. Comput. Stat. Data Anal. 2009, 53, 3872–3882. [Google Scholar] [CrossRef] [Green Version]
  6. Daniel, N.M.; Jeffrey, G.A.; Michael, W.V.; Ronald, L.B.R.; Daren, H.; Tamie, L.V. Model Evaluation Guidelines for Systematic Quantification of Accuracy in Watershed Simulations. Am. Soc. Agric. Biol. Eng. 2007, 50, 885–900. [Google Scholar]
  7. National Institute of Environmental Research (NIER). A Study on the Preparation of Guidelines on Rural Non-Point Source Management Planning; National Institute of Environmental Research: Incheon, Korea, 2014.
  8. Kang, M.A. Loading Characteristics of Non-Point Source Pollutants during Rainfall. J. Eng. Geol. 2009, 19, 365–371. [Google Scholar]
  9. Korea Environment Institute (KEI). Discussion on Real-Time Water Quality Monitoring and Modeling System; Korea Environmental Institute: Sejong, Korea, 2009. [Google Scholar]
  10. Kang, Y.M. Standardization Method for Selecting Priority Ownership Area and Water Quality Improvement Using CE-QUAL-W2 Model; Kwangwoon University: Seoul, Korea, 2020. [Google Scholar]
  11. Zhenyao, S. A framework for priority non-point source area identification and load estimation integrated with APPI and PLOAD model in Fujiang Watershed, China. Agric. Water Manag. 2011, 98, 977–989. [Google Scholar]
  12. Kang, Y.M. Water Quality Improvement in Nakdong River Subwatershed by Priority Selection. J. Korean Soc. Urban Environ. 2019, 19, 181–188. [Google Scholar] [CrossRef]
  13. Natural Resources Conservation Service (usda.gov); U.S. Department of Agriculture-National Resources Conservation Service; USDA-NRCS. Available online: https://www.nrcs.usda.gov/ (accessed on 1 January 2018).
  14. National Institutue of Environment Research (NIER). Guidelines on Optimal Non-Point Source Management for TMDL; National Institute of Environmental Research: Incheon, Korea, 2017. [Google Scholar]
  15. Go, H.W. Statistical Analysis and Review of Event Mean Concentrations in Stormwater Runoff from Agricultural Nonpoint Source Pollution by Land Use Type. Korean Soc. Environ. Eng. 2021, 43, 664–678. [Google Scholar] [CrossRef]
  16. Kim, D.H. Assessing Water Quality Impacts of Governance Operation from Paddy Fields for Managing Agri-NPS Pollution; Korean Society of Agricultural Engineering: Seoul, Korea, 2019. [Google Scholar]
  17. Lee, D.G. Impact of Reduction of Non-Point Source Pollution Depending on Application of Best Management Practices on Stream; Korean Society of Agricultural Engineering: Seoul, Korea, 2017. [Google Scholar]
  18. National Institutes Environment Research (NIER). Manual for the Installation, Management, and Operation of Non-Point Source Pollution Reduction Facilities; National Institute of Environmental Research: Incheon, Korea, 2017. [Google Scholar]
  19. Republic of Korea of Ministry of Water and Environment Policy Ministry of Environment. Guidelines on National Subsidy Projects for Non-Point Source Reduction; Republic of Korea of Ministry of Water and Environment Policy Ministry of Environment: Sejong-si, Korea, 2021.
  20. Lee, H.S. Assessment of Apprehensive Area of Non-Point Source Pollution Using Watershed Model Application in Juam Dam Watershed. J. Korean Soc. Environ. Eng. 2015, 37, 551–557. [Google Scholar]
  21. Wikipedia Definition, Self-Purification of Rivers. Available online: https://ko.wikipedia.org/Rivers (accessed on 1 January 2018).
  22. Chang, I.S. Analysis of Correlation between Flow and Water Quality at Up and Down Streams. J. Korean Environ. Sci. Soc. 2010, 19, 771–778. [Google Scholar]
  23. Lim, H.M. Development of Natural Purification Technology Considering Material Cycle in River Reaches. Korea Ecol. Resilient Infrastruct. 2016, 3, 213–214. [Google Scholar] [CrossRef]
  24. Kim, T.G. Assessment of Watershed Characteristics for Apprehensive Area of Non-Point Source Pollution Using Load Duration Curve. J. Korean Soc. Environ. Technol. 2014, 15, 1–11. [Google Scholar]
  25. Yi, H.S. Modeling Study of Turbid Water in the Stratified Reservoir using linkage of HSPF and CE-QUAL-W2. J. Korean Soc. Environ. Eng. 2008, 30, 69–78. [Google Scholar]
  26. Bicknel, B.R.; Imhoff, J.C.; Kittle, J.L.; Donigian, A.S.; Johanson, R.C. Hydrological Simulation Program-FORTRAN User's Manual for Release 12; U.S. Environmental Protection Agency, Environmental Research Laboratory: Athens, GA, USA, 1993.
  27. Agri-Food Farm Map Service. Available online: www.agis.epis.or.kr (accessed on 1 January 2018).
  28. Park, Y.H. Development of Non-Point Source Pollution Load Function Based on Rainfall Intensity and Land Use Type. Korean Soc. Environ. Eng. 2004, 26, 1070–1078. [Google Scholar]
  29. Republic of Korea Ministry of Agriculture, Food and Rural Affairs. Management and Control of Nonpoint Source Pollution in Rural Area; Republic of Korea Ministry of Agriculture, Food and Rural Affairs: Sejong, Korea, 2007.
  30. Water Environment Conservation Act, based on Living Conditions Criteria around Rivers. 2022. Available online: https://www.law.go.kr/ (accessed on 1 January 2018).
  31. Ryu, J.C. Evaluation of the Soil Erosion Mitigation through Muddy Water Reduction Project in the Doam Lake Watershed Non-Point Source Management Zone. J. Korea Environ. Policy Adm. Soc. 2018, 26, 1–19. [Google Scholar]
Figure 1. The target area. (a) NPS Management area in Korea. (b) Andong Songya watershed in Korea.
Sustainability 14 13999 g001
Figure 2. The Monitoring Points.
Sustainability 14 13999 g002
Figure 3. The target watershed. (a) Songya subbasins using DEM Subbasins. (b) Streams.
Sustainability 14 13999 g003
Figure 4. Songya watershed map for HSPF application in Songya watershed. (a) Landuse (b) Altitude (c) Slope (%).
Sustainability 14 13999 g004
Figure 5. Calibration and validation points (1 to 8).
Sustainability 14 13999 g005
Figure 6. Comparison of the observed and simulated flow at point 8. (a) Calibration and validation. (b) Calibration (R2). (c) Validation (R2).
Sustainability 14 13999 g006
Figure 7. Comparison of the observed and simulated daily flow on water quality at points 1 to 7. 1: Upstream area of the Songya Stream, 2: Seoknam Stream, 3: Mulhan Stream, 4: Myeonggye Stream, 5: Taejang Stream, 6: Osan Stream, 7: Seonggok Stream, and 8: downstream area of the Songya Stream. (a) Validation/calibration Number 1 (Upstream area of the Songya Stream). (b) Validation/calibration Number 2 (Seoknam Stream). (c) Validation/calibration Number 3 (Mulhan Stream). (d) Validation/calibration Number 4 (Myeonggye Stream). (e) Validation/calibration Number 5 (Taejang Stream). (f) Validation/calibration Number 6 (Osan Stream). (g) Validation/calibration Number 7 (Seonggok Stream).
Sustainability 14 13999 g007aSustainability 14 13999 g007b
Figure 8. Comparison of the observed and simulated daily flow on water quality at points 8. Validation/calibration Number 8 (downstream of the Songya Stream). (a) Water temperature calibration and validation. (b) DO calibration and validation. (c) BOD calibration and validation. (d) TP calibration and validation.
Sustainability 14 13999 g008
Figure 9. The Load of BOD, TP in Songya 1: Upstream area of the Songya Stream, 2: Seoknam Stream, 3: Mulhan Stream, 4: Myeonggye Stream, 5: Taejang Stream, 6: Osan Stream, 7: Seonggok Stream, and 8: downstream area of the Songya Stream. (a) The Load of BOD, TP (kg/day). (b) The Load per area of BOD, TP (kg/day/km2).
Sustainability 14 13999 g009
Figure 10. The Contribution rate of BOD, TP load (%)1: Upstream area of the Songya Stream, 2: Seoknam Stream, 3: Mulhan Stream, 4: Myeonggye Stream, 5: Taejang Stream, 6: Osan Stream, and 7: Seonggok Stream. (a) The Contribution rate of BOD load (%). (b) The Contribution rate of TP load (%).
Sustainability 14 13999 g010
Figure 11. Songya watershed farming type and land use. (a) Songya Stream watershed. (b) Mulhan stream subbasin. (c) Osan Stream subbasin.
Sustainability 14 13999 g011
Figure 12. Status of livestock animals (number of livestock units) by subbasins. (a) Pig. (b) Korean cattle. (c) Chicken.
Sustainability 14 13999 g012
Figure 13. Farming conditions by subbasins. (a) Field. (b) Paddy. (c) Orchard. (d) Facility. (e) Ginseng. (f) Uncultivated site.
Sustainability 14 13999 g013
Figure 14. Monitoring results during rainfall by subbasins1: Upstream area of the Songya Stream, 2: Seoknam Stream, 3: Mulhan Stream, 4: Myeonggye Stream, 5: Taejang Stream, 6: Osan Stream, and 7: Seonggok Stream. 8: Downstream of the Songya Stream. (a) BOD. (b) TP.
Sustainability 14 13999 g014
Figure 15. BMP installation locations in the target area. 1: Upstream area of the Songya Stream, 3: Mulhan Stream, 6: Osan Stream, and 8: downstream area of the Songya Stream.
Sustainability 14 13999 g015
Table 1. The model input data.
TypeSourceScaleInformation
Digital
Elevation Models
National Geographic
Information Institute
1:5000Digital Elevation Model; 10 m × 10 m
Land-use map Ministry of Environment1:25,000Large classification land cover
Meteorological dataKorea Meteorological
Administration
Daily,
hourly
Precipitation, average temperature,
relative humidity, solar radiation
quantity, wind velocity, cloud
amount, etc.
Flow rateMinistry of Environment/
Water resources Management Information System (WAMIS)
8-day/
month
Auto/manual monitoring network,
Water Quality Monitoring Networks
Data
Water qualityMinistry of Environment/
Environmental Management
Office
8-day/
month
Water Quality Monitoring Networks
Data
(water temperature, DO, BOD, TN,
TP, etc.)
Pollution sourceMinistry of Environment-National pollution source survey data
Quantity of water intakelocal autonomous entity/
Water resources Management Information System(WAMIS)
Monthly,
Daily
Data collection of intake/pumping
station in target reservoir
Watershed mapMinistry of Environment-Unit watershed map, middle area map, large area map, and administrative district border map
Table 2. Evaluation items to select priority subbasins for NPS management.
Category and Items (A)Evaluation Item (B)Detailed Evaluation Item (C)
GenerationPollution source
(per unit area)
Population densityPopulation per unit area
Number of livestockTotal number of livestock per unit area (sum of all livestock species)
Land use areaArea of fields and paddies per unit area
Farming conditionsAreas of fields, paddies, orchards, and ginseng farmland per field and paddy area
DischargeWater qualityAverage (monitoring)EMC (BOD and TP)
Maximum (monitoring)Peak water quality concentration (BOD and TP)
Average (simulation)EMC (BOD and TP)
Maximum (simulation)Peak water quality concentration (BOD and TP)
LoadLoad (simulation)Average load per unit area
Nonpoint contribution rateNonpoint contribution (simulation)BOD and TP
Table 3. Method of selecting priority management areas for NPS management.
CategoryMethod
STEP 1Calculation of eight subbasin values for each evaluation item:
The results of the evaluation category of basins
STEP 2Calculation of eight subbasin rankings for each evaluation item
R a n k i n g   =   X i , X i 1 ,   X i 2 X n
STEP 3Calculation of the sum of frequencies by ranking among eight subbasins for each evaluation item:
  T h e   o f   t h e   n u m b e r   o f   F r e q u e n c y = i = 1 n T h e   n u m b e r   o f   b a s i n s   r a n k i n g
STEP 4Final selection of the three subbasins with the highest frequencies:
1st to 3rd ranking
Table 4. BMPs selection method.
StepMethodContents
1Analysis of the watershed characteristicsConsideration of the land use characteristics
StepMethodContentsRemoval efficiency by facility
2Major pollutantsSince discharged pollutant types are different depending on the land use, the characteristics of major pollutants per unit area are considered (e.g., water quality and load)Ex) underground storage tank BOD 53%, TN 37%, TP 60%
StepMethodContents
3Consideration of regional and environmental factorsSelection of appropriate facilities for the target watershed considering maintenance, local community, cost, safety, and habitat
StepMethodContents
4Appropriate treatment method selectionAppropriate management method selection according to Step 1~3
Table 5. The area and land-use ratio of each subwatershed in Songya watershed.
CategoryArea (km2)Proportion of the Land Use Compared to the Watershed Area (%)
Urbanization and drying5.144.3
Agriculture30.5025.5
Forest73.1661.1
Pasture7.446.2
Wetland1.130.9
Bare land1.921.6
Waters0.490.4
Table 6. Results of calibration and validation of flow at the number of 8 point.
CalibrationValidation
ResultEvaluationResultEvaluation
%Diff14.83Good12.81Good
R20.797Very Good0.623Fair
Table 7. Statistical analysis of calibration and validation for water qualities at all points.
12345678
BOD%Diff3.70(-)66.814.5319.008.811.322.266.47
gradeV.GoodPoorV.GoodGoodV.GoodV.GoodV.GoodV.Good
TP%Diff8.49(-)76.1716.0320.5515.7951.7515.5610.13
gradeV.GoodPoorGoodGoodGoodPoorGoodV.Good
1: Upstream area of the Songya Stream, 2: Seoknam Stream, 3: Mulhan Stream, 4: Myeonggye Stream, 5: Taejang Stream, 6: Osan Stream, 7: Seonggok Stream, and 8: downstream area of the Songya Stream.
Table 8. Statistical analysis of calibration and validation for water qualities at point 8.
%Difference
CalibrationValidation
%Diff.Grade%Diff.Gsrade
BOD6.38Very Good12.74Very Good
TP5.13Very Good18.67Good
Table 9. Area used for farming and proportion (%) in the target site.
SubbasinsArea Used for Farming and Proportion (%)Used for FarmingUnused
FieldPaddyOrchardFacilityGinseng FarmUn-Cultivated SiteTotalField + Paddy + Orchard + Facility + Ginseng FarmUncultivated Site
1 Area (km2)1.050.340.550.010.030.011.9979.330.40
Proportion (%)52.816.927.50.71.40.510099.30.5
2Area (km2)0.380.120.100.01- 0.6156.170.00
Proportion (%)62.619.916.01.0-0.510099.50.5
3Area (km2)1.160.770.190.020.000.012.1481.270.30
Proportion (%)54.135.88.80.90.20.410099.80.4
4Area (km2)2.501.760.320.04-0.034.6584.800.48
Proportion (%)53.837.86.91.0-0.610099.50.6
5Area (km2)0.810.320.040.01-0.001.1872.800.11
Proportion (%)68.526.93.60.9-0.110099.90.1
6Area (km2)1.090.480.030.02-0.001.62168.170.18
Proportion (%)67.129.81.61.4-0.110099.90.1
7Area (km2)1.470.710.070.02-0.002.2720.240.10
Proportion (%)64.831.13.00.9-0.110099.80.1
Table 10. Rankings by detailed evaluation consideration factors.
SubbasinsCategory
GenerationDischarge
Pollution SourceWater Quality(Monitoring)
1.The Population Density
(Persons/km2)
2. Livestock Density
(Total numbers/km2)
3. Area of Fields and Paddies Area by Subbasins
(km2/ km2 )
4. Farming Condition Area
(km2/ km2 )
5. Average during Rainfall
(mg/L)
6. Maximum during Rainfall
(mg/L)
ResultsRankingResultsRankingResultsRankingResultsRankingResultsRankingResultsRanking
BODTPBODTP
15141912419.7779.344.40.677340.110.0032
2871193731.2256.272.50.464517.31.6994
343720452132.6181.334.50.967225.63.1583
45056946329.3384.821.60.38876.41.7147
54561205525.9572.853.60.586412.81.5905
66621642629.14100.015.91.228149.810.1381
751310305225.5670.262.20.53769.92.0726
SubbasinsCategory
DischargeThe Results of the Priority Management subbasins
Water Quality(Simulation)LoadNPS Contribution Rate
7. Average during Rainfall
(mg/L)
8. Maximum during Rainfall
(mg/L)
9. Average load per subbasins(kg/day)10. NPS contribution rate per subbains (load/total load)
ResultsRankingResultsRankingResultsRankingResultsRankingFinal Results
BODTPBODTPBODTPBODTP1st rank: Mulhan Stream
2nd rank: Osan Stream
3rd rank: Upstream Area of The Songya Stream
14.50.491221.92.63316.81.8144.211.51
22.20.396612.75.95868.52.356.13.97
34.00.889318.614.743212.53.1320.712.33
41.60.43877.67.99776.81.5626.314.12
53.10.679418.14.421510.32.8413.18.65
66.10.909151.56.850113.92.7221.710.04
72.20.571513.99.15443.21.778.410.36
Publisher’s Note: MDPI stays neutral with regard to jurisdictional claims in published maps and institutional affiliations.

