
Triple-C: A Tridimensional Sustainability-Oriented Indicator for Assessing Product Circularity in Public Procurement
Abstract
:1. Introduction
1.1. The Need for a New Composite Indicator for the Circular Economy
The view provided by the [present] [circularity] indicators [shows] some lacks […]. (M)ost of the [circularity] indicators depict economic and environmental impacts, social consequences remaining barely addressed. This missing dimension is an issue often highlighted (in research on Sustainable Development Indexes).
1.2. Literature Review
1.2.1. Sustainability, Its Assessment, and Indicators
- Principle: “aspirational goal that governs decisions or behaviour”
- Criterion: “requirement that describes what is to be assessed”
- Indicator: “quantitative, qualitative or binary variable that can be measured or described to assess an aspect of a defined criterion”
1.2.2. Current State of Circular Economy Indicators
(T)he majority of indicators is focused on recycling, end-of-life management or remanufacturing, while fewer indicators consider disassembly, lifetime extension, waste management, resource-efficiency or reuse.
Product-Level Indicators
|
|
Company- and Country-Level Indicators
- Although examples of a combination of circularity and life-cycle assessments, including life-cycle costing, could be identified (see, e.g., [19,20]), our analysis confirmed that an appropriate combined product-level indicator, which provides a single score for all sustainability pillars, is missing.
- The limitations of the indicators in [18]’s overview, described by these authors themselves, were presented above. Regarding the two examples, C2C and MCI, additional limitations exist in the context of our study.
- ○
- C2C does not include LCA or ESM, which is also specifically focusses on the needs of component-based products. The absence of this aspect is a remarkable gap, which refers, for example, to international LCA standards or ESM’s focus on political policies. The economic dimension and life-cycle cost, which are very important for procurement decisions, are barely considered by C2C.
- ○
- The MCI is presented as a tool for designers. However, the linkage to other sustainability indicators is a gap. Even if designers use more indicators, the question of how to relate these indicators and come to overall conclusions remains. An attempt to combine indicators is made by [59]’s MCI-based cost-normalized material circular economy indicator MCIE. However, other environmental and social aspects are not considered.
- Even the two advanced product-related indicators UMI and Madaster, with the narrow scope on buildings, consider selected sustainability areas only. In particular, they are not combined with information on social sustainability, although the need for integrated analyses with additional environmental, social, and economic indicators is understood, e.g., [19,20].
- In general, social indicators are underrepresented in the 87 contributions on product indicators, with [21] as the only important example.
(F)ew studies compare circularity indicators with environmental performance or link the circularity indicators between society levels ([…]. However, adequate tools exist at each level (e.g., life cycle assessment (LCA) […]).
1.3. The Integrated Assessment Tool
1.4. Sustainability Criteria Included in Public Procurement Regulations
- “have been manufactured using production processes that conserve raw materials, save energy, conserve water, are low in pollutants or low in waste,
- have been produced by preparing them for reuse or by recycling waste, in particular by using recycled materials, or from renewable raw materials
- are characterized by durability, ease of repair, reusability, and recyclability, or
- lead to less waste or less pollutant waste compared to other products or are more suitable for environmentally sound waste management.” (own translation)
- to develop a sustainability-centered indicator for assessing product circularity that also considers the needs of component-based products explicitly
- to address all sustainability pillars by the solution
- to facilitate the representation of the results by one single figure
- to provide a solution that addresses the needs of public procurement specifically.
2. Materials and Methods
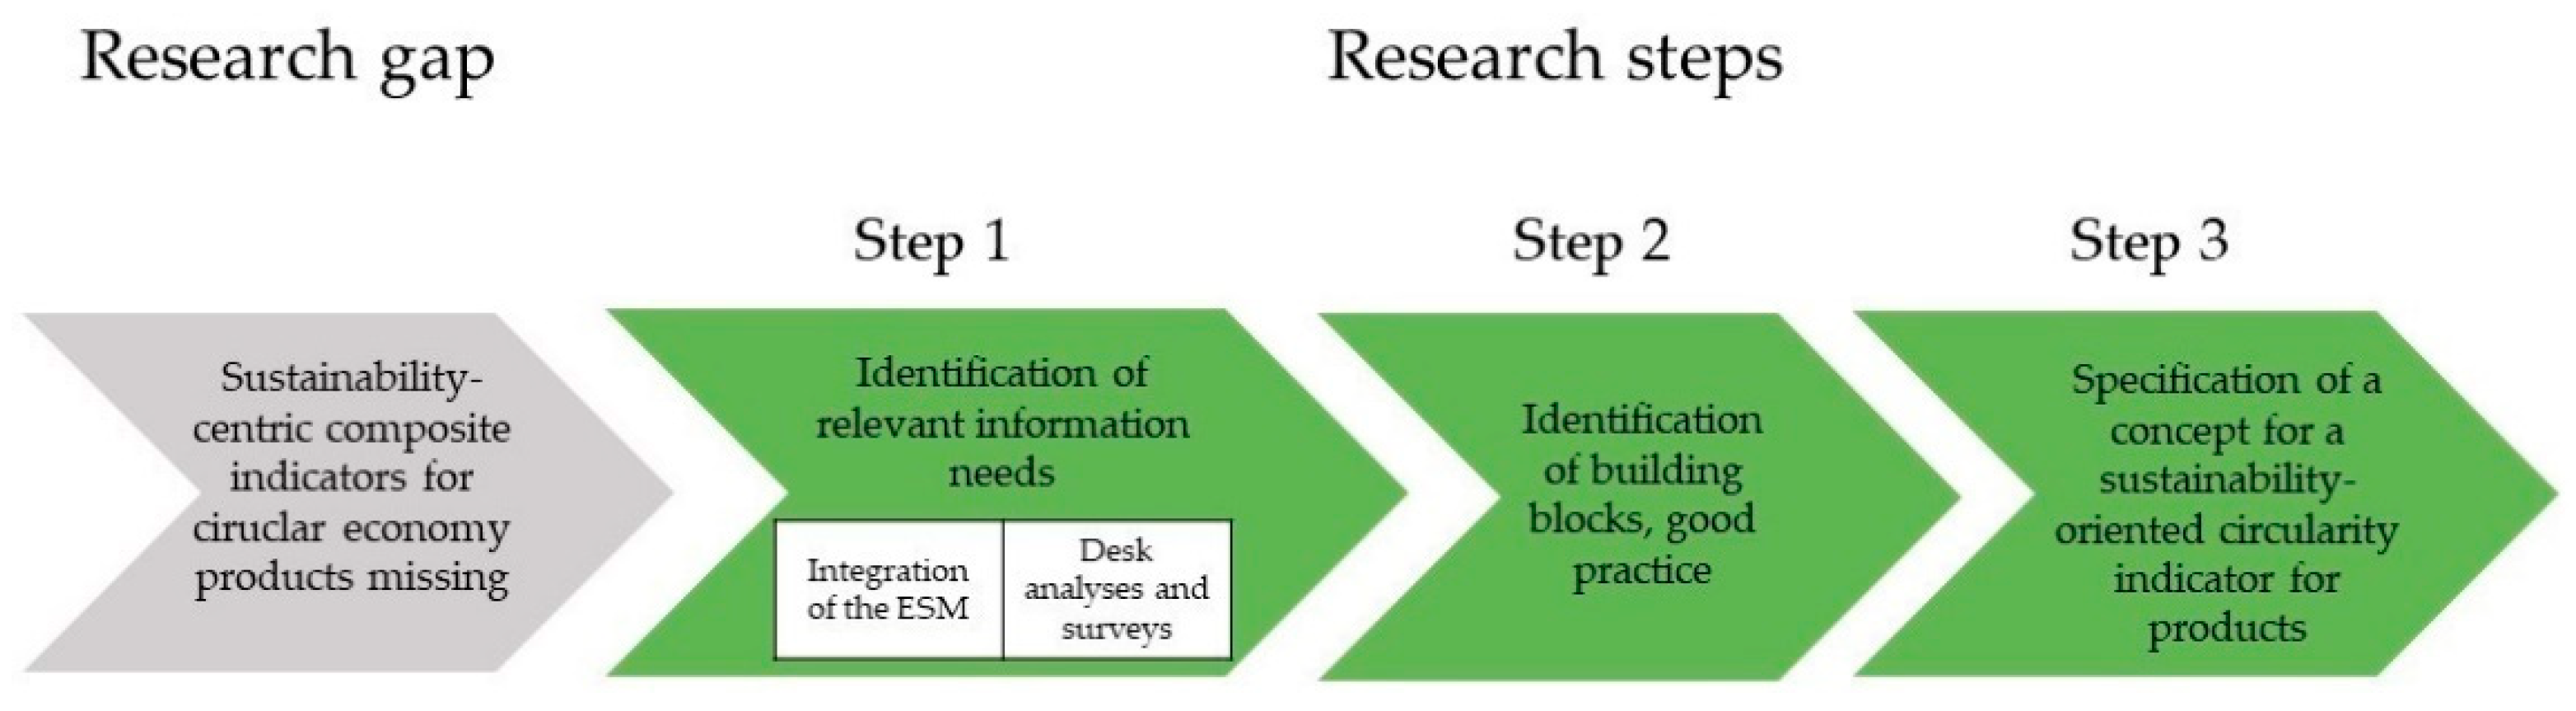
- Identification of relevant information needs by desk research and surveys
- Identification of building blocks for the indicator framework
- Specification of a concept for a sustainability-oriented circularity indicator for products—the Triple-C.
- Step 1-Identification of relevant information needs by desk research and surveys:
- 2.
- Step 2-Identification of building blocks for the indicator framework:
- 3.
- Step 3-Specification of a concept for a sustainability-oriented circularity indicator for products:
3. Results
3.1. Basic Requirements
3.1.1. Identified Information Needs
- Relevant sustainability information according to state of the art in literature (see Section 1)
- The requirement for an overall assessment of the product’s sustainability through production, use and disposal, taking into account ecological, social and economic aspects indicated by 57% of the professionals involved in the second round of the survey among fleet managers.
- The wish that “there must (…) be an index (that) evaluates certain aspects of sustainability. For example, recyclability (…).” in the survey among researchers.
- Fundamental information needs by public procurement professionals based on federal law and federal states regulation, e.g., regarding social sustainability.
- The stakeholder consultation on 24 June 2022 that stressed the importance of LCC information for procurement professionals.
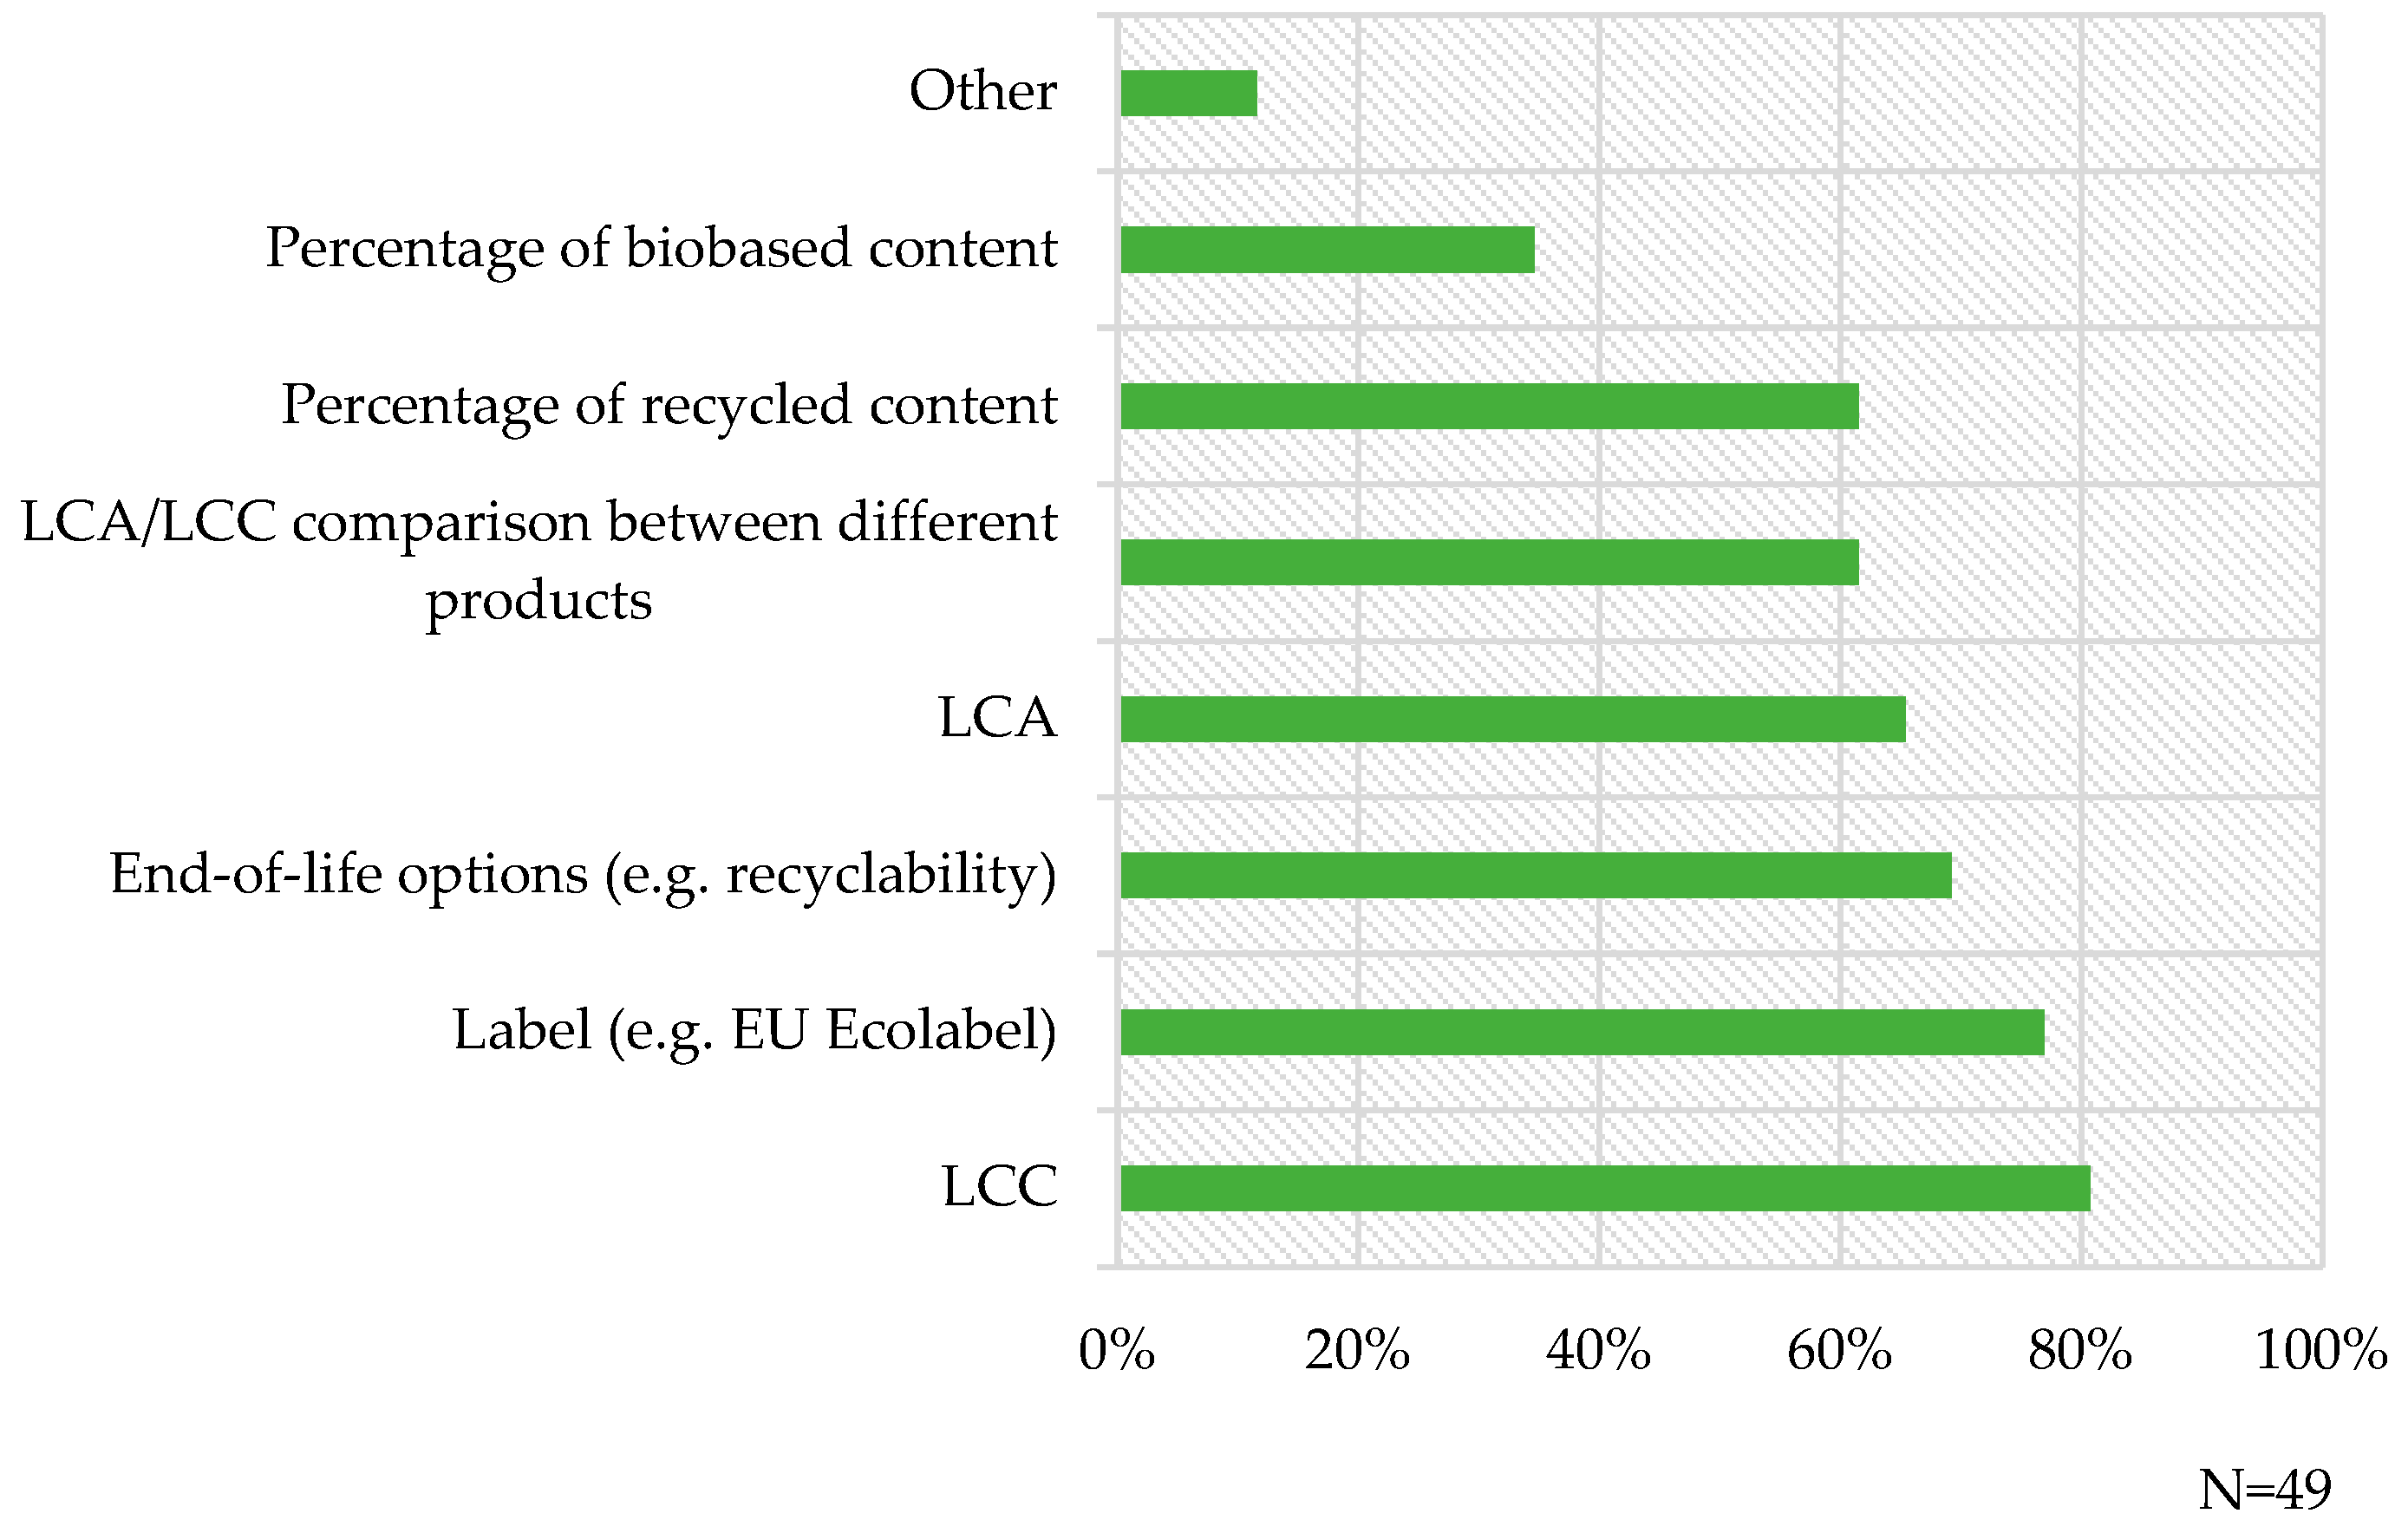
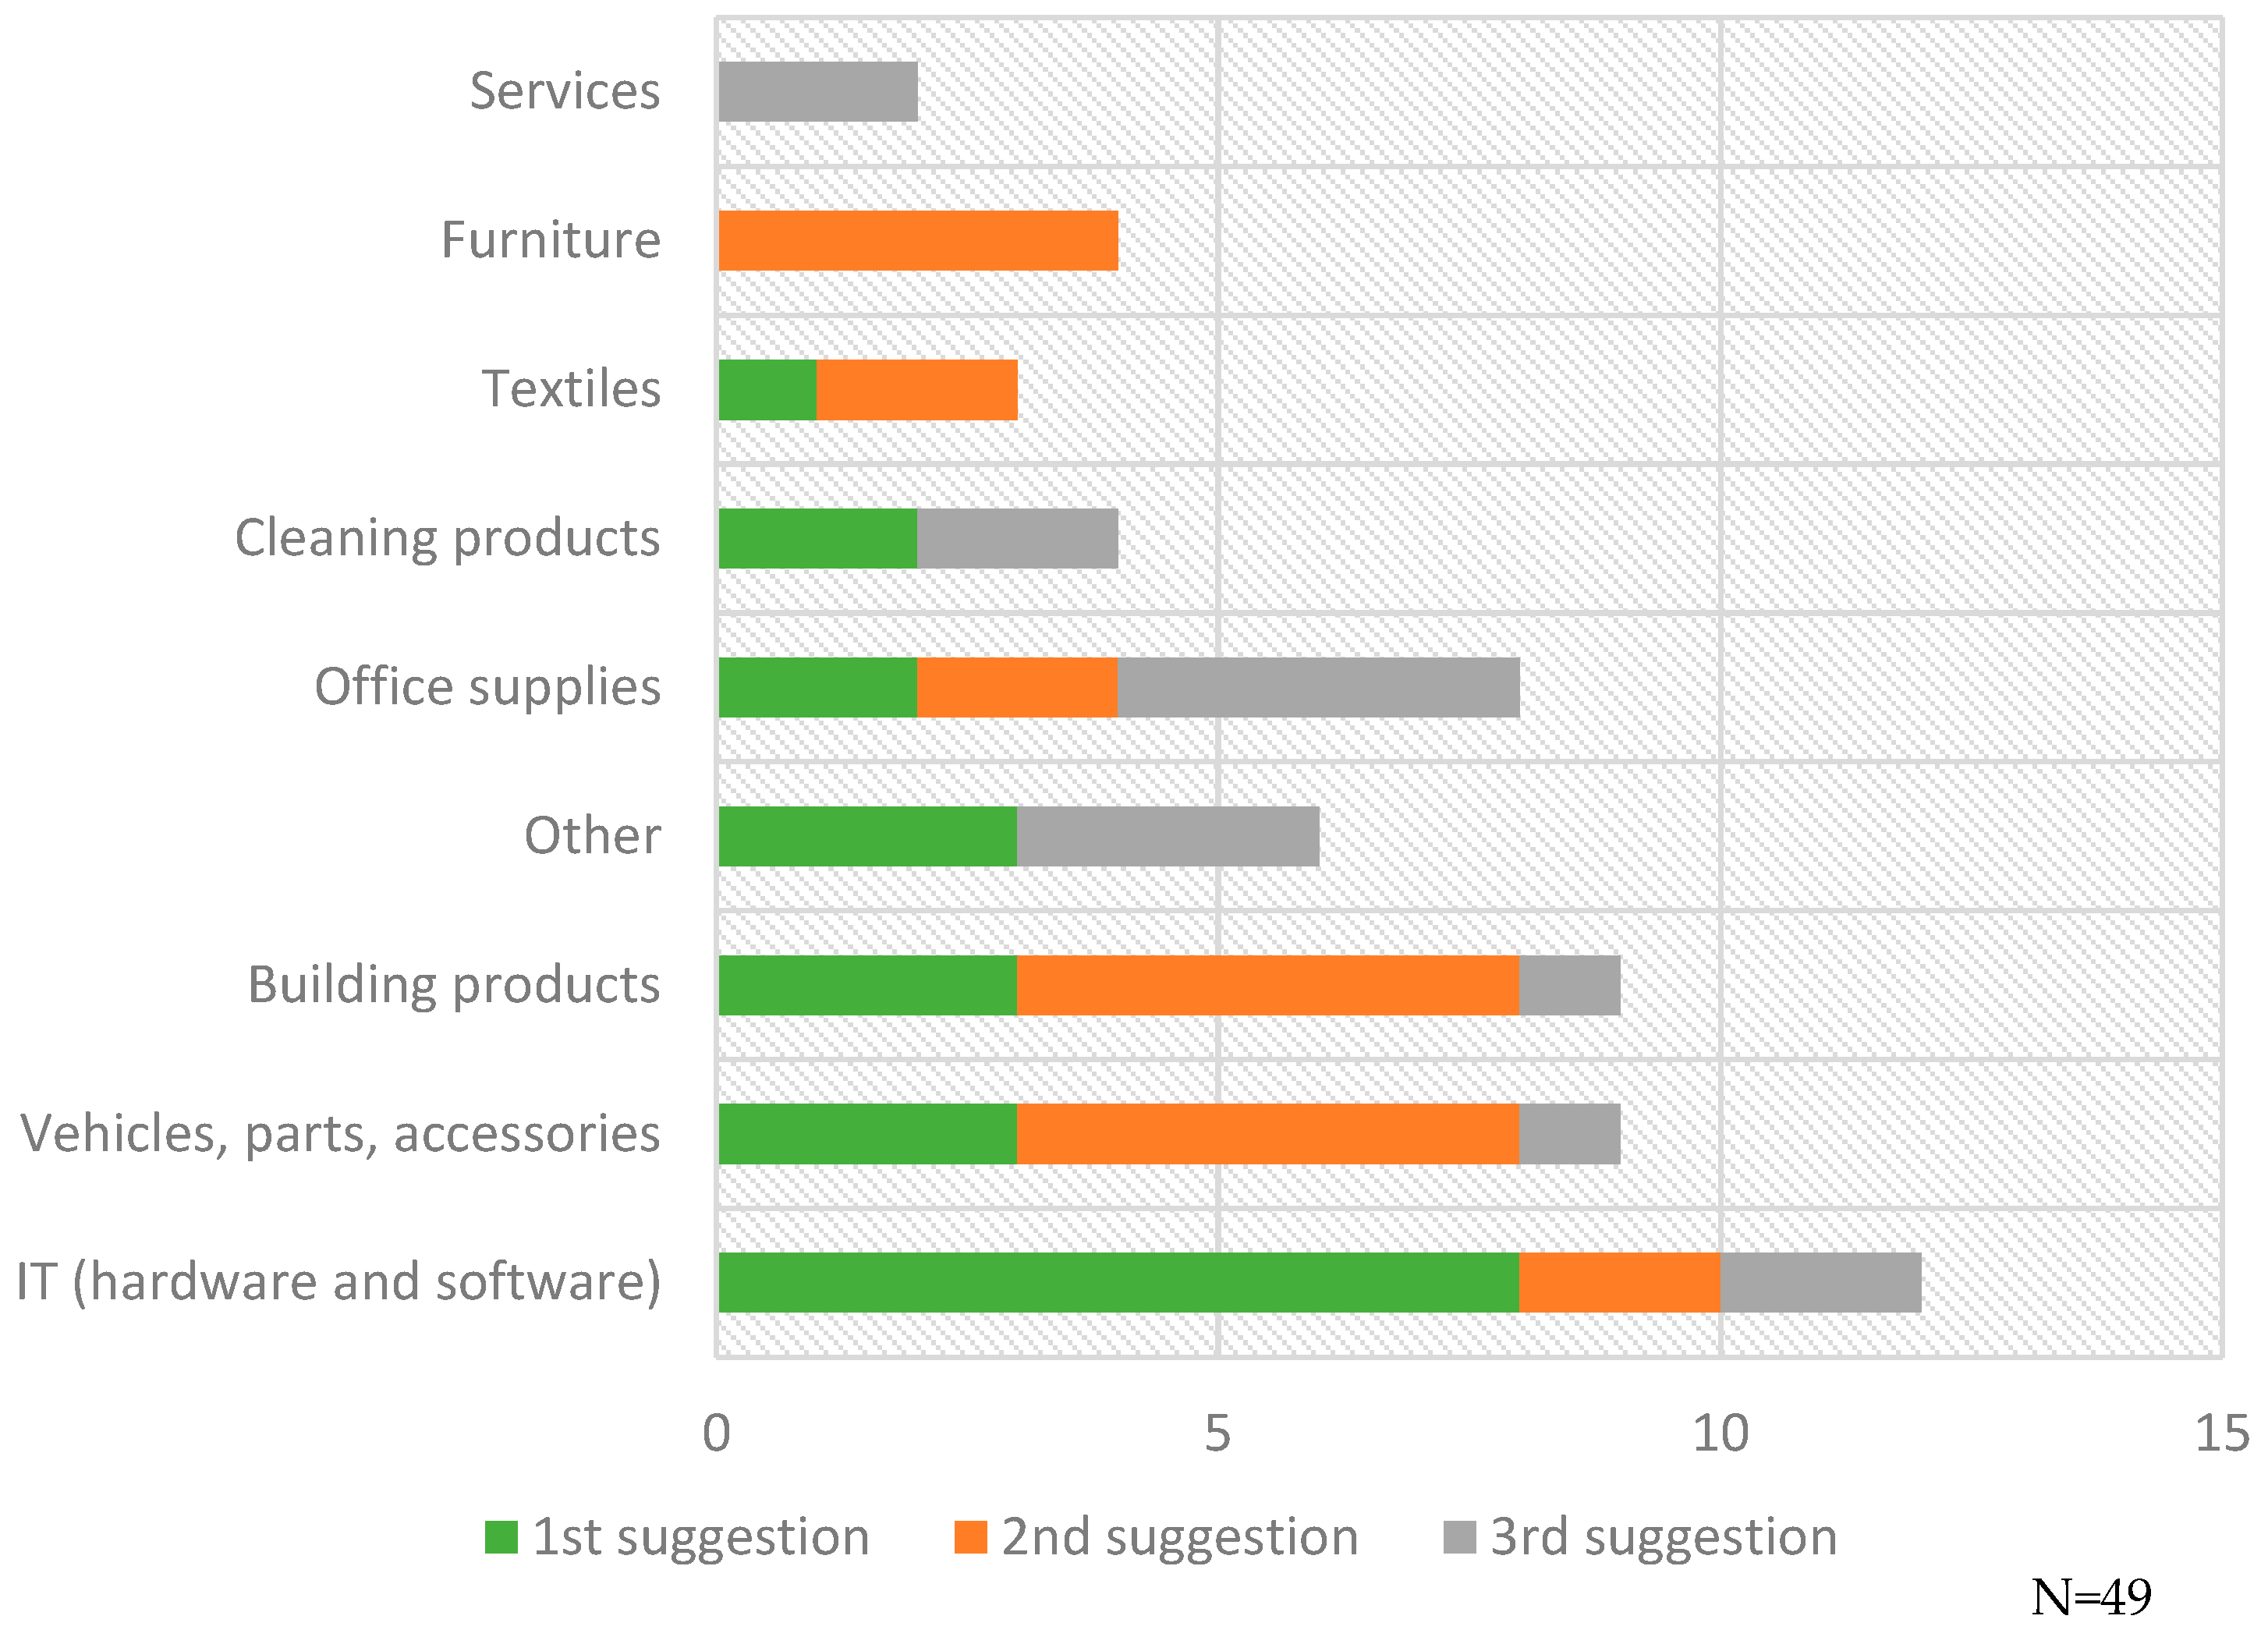
- Additional survey results described in Figure 4 and at the end of this section.
3.2. Key Building Blocks Identified and Selected to Be Included in the Proposed Indicator Structure
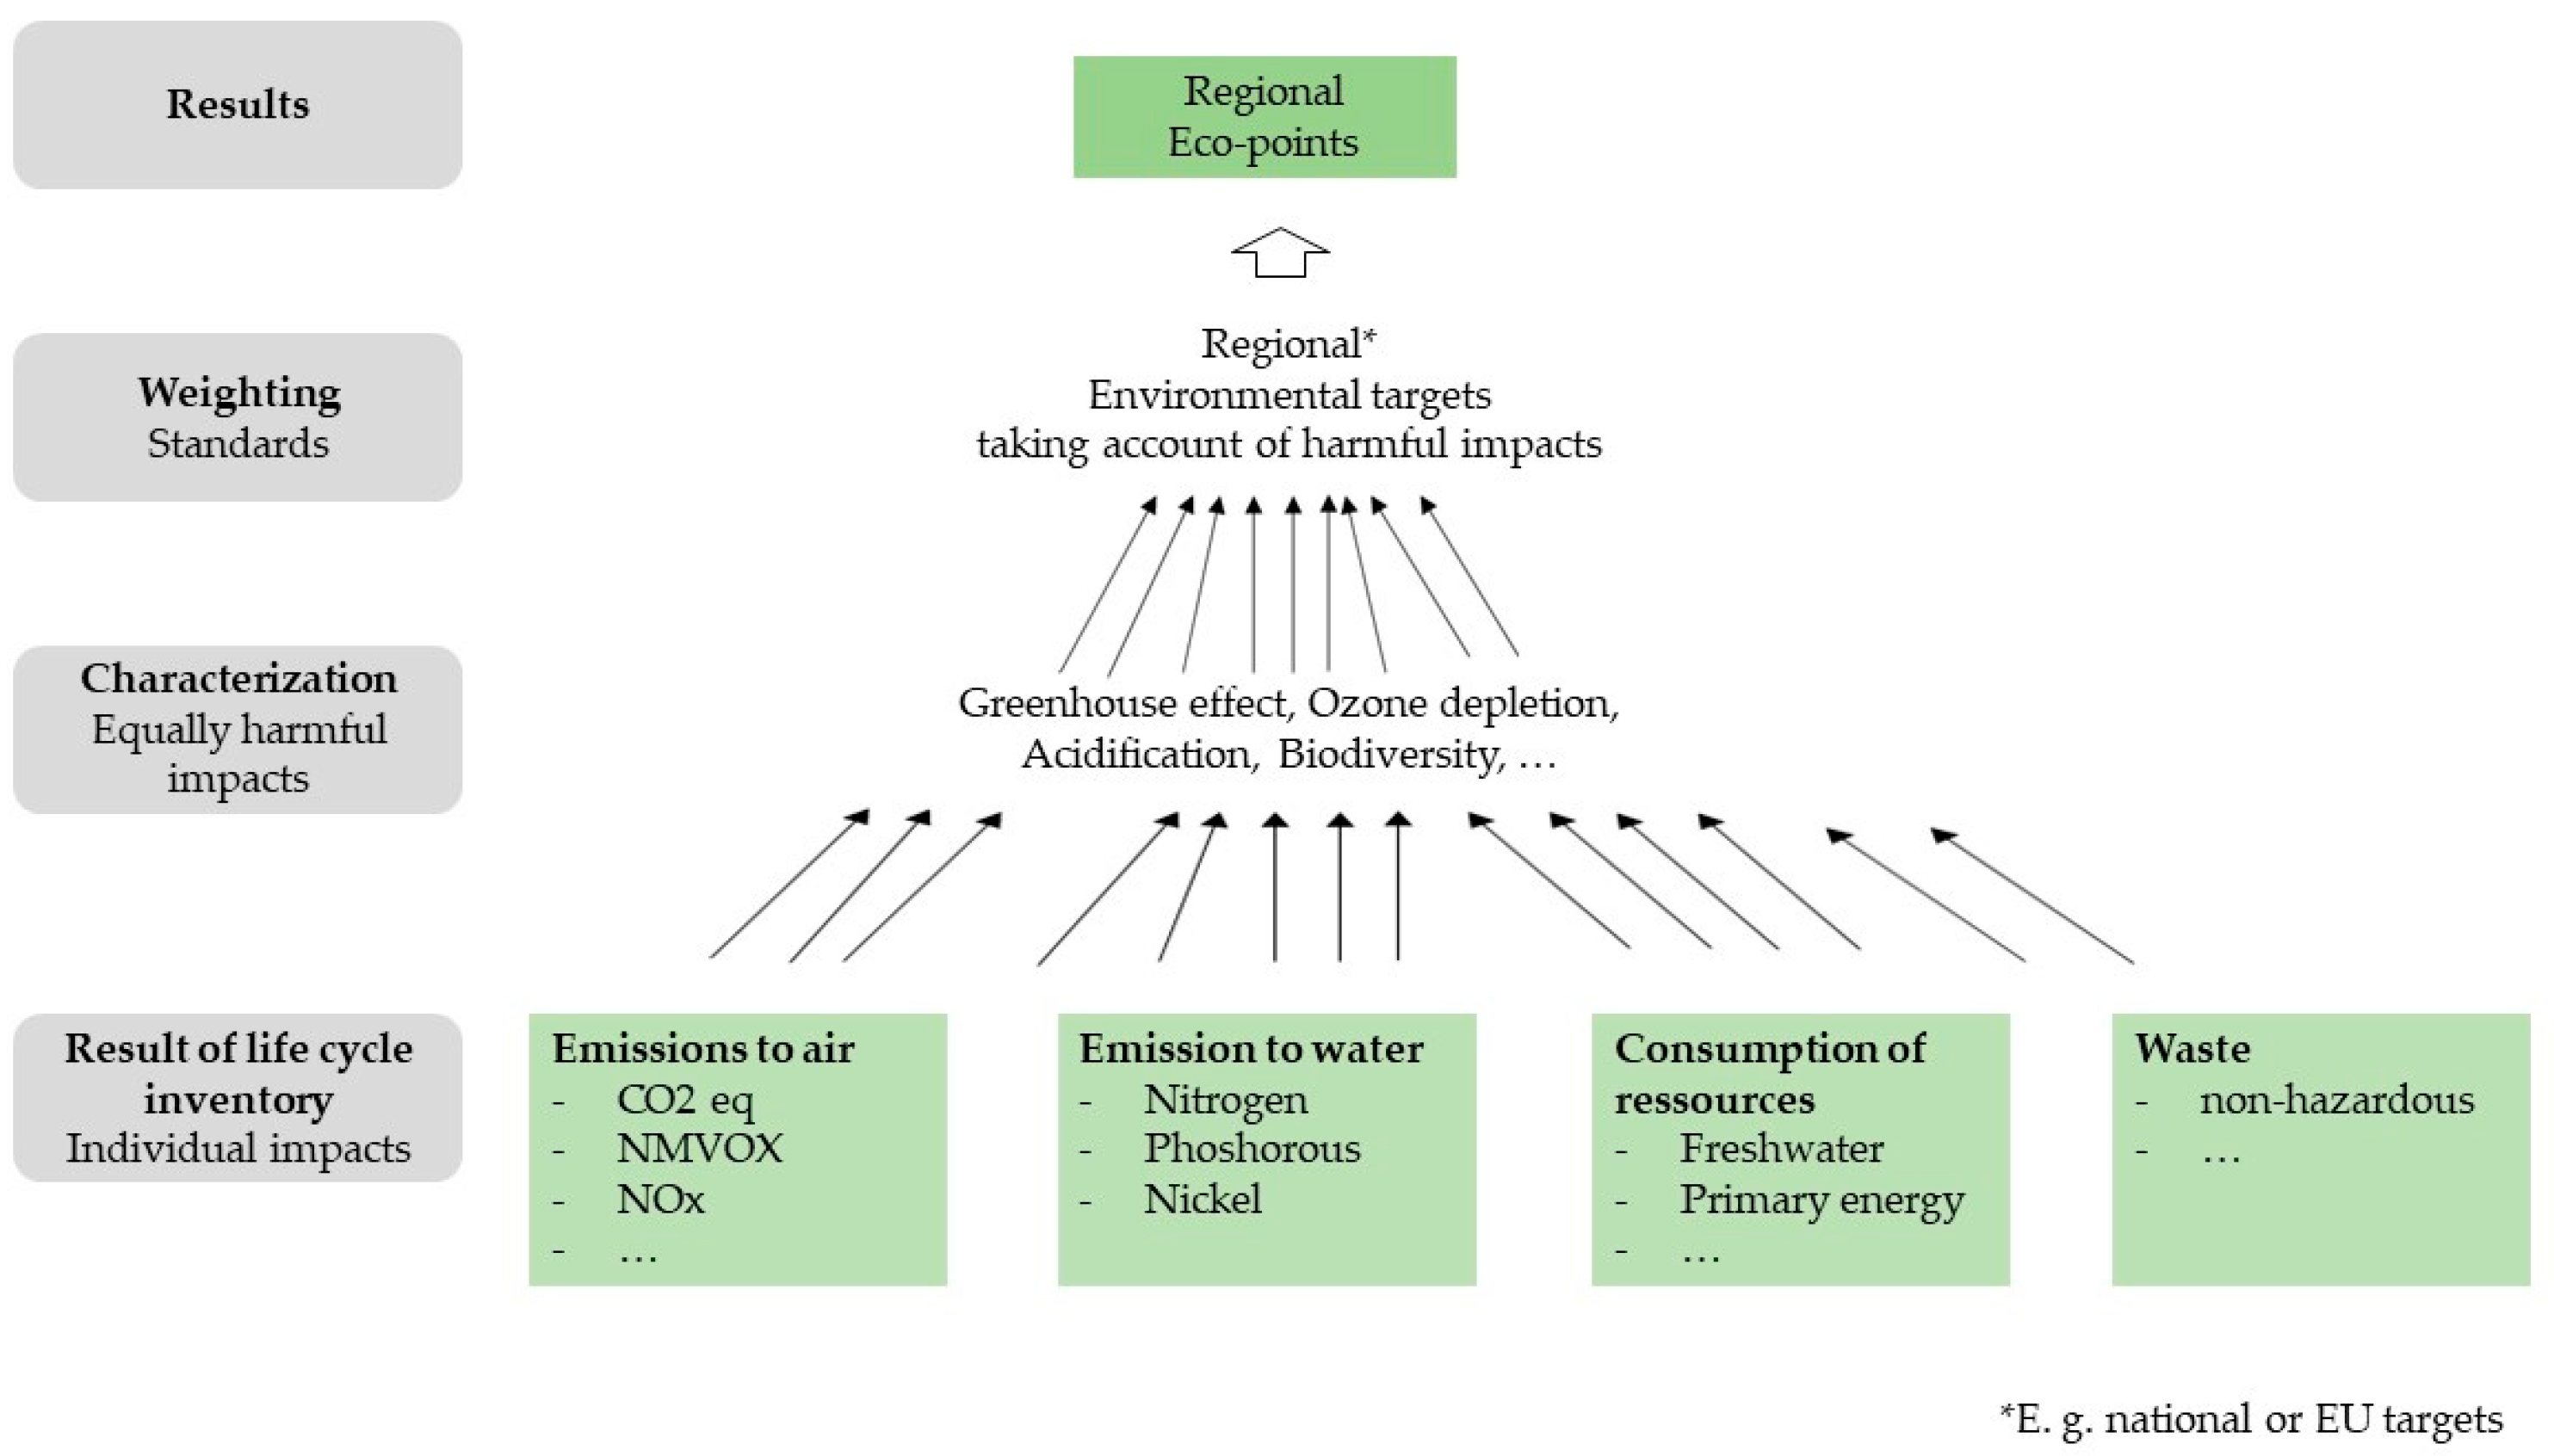
3.2.1. The Ecological Scarcity Method
- The method has a wide range of relevant environmental impacts that are included to give an overall picture close to the actual conditions.
- As a one-dimensional method, it enables direct environmental comparison of companies, products, or services based on a single indicator. Despite this broad approach, a clear result is obtained when the method is applied.
- ESM has a versatile application possibility, and thus the method is transferable in all conceivable and necessary industries.
- ESM is comprehensive in terms of environmental impacts. It can be applied extensively and provides a single value for the total environmental impact.
- The method is based on the policy objectives in a country or region. ESM, therefore, provides a transparent presentation for each country.
- For laypersons, the result is easy to understand.
- As an innovative solution, the ESM was not yet established as software in Germany. Therefore, ConCirMy aimed to offer a first attempt to make this method accessible as software for enterprises and usable for the public. The development of the software should be carried out based on life-cycle assessment data.
3.2.2. Life-Cycle Costing
3.2.3. Building Blocks of the Integrated Assessment Tool for Bio-Based Products
3.3. First Draft of the Triple-C Indicator Concept
3.4. Development of the ESM-Based Triple-C Indicator Concept
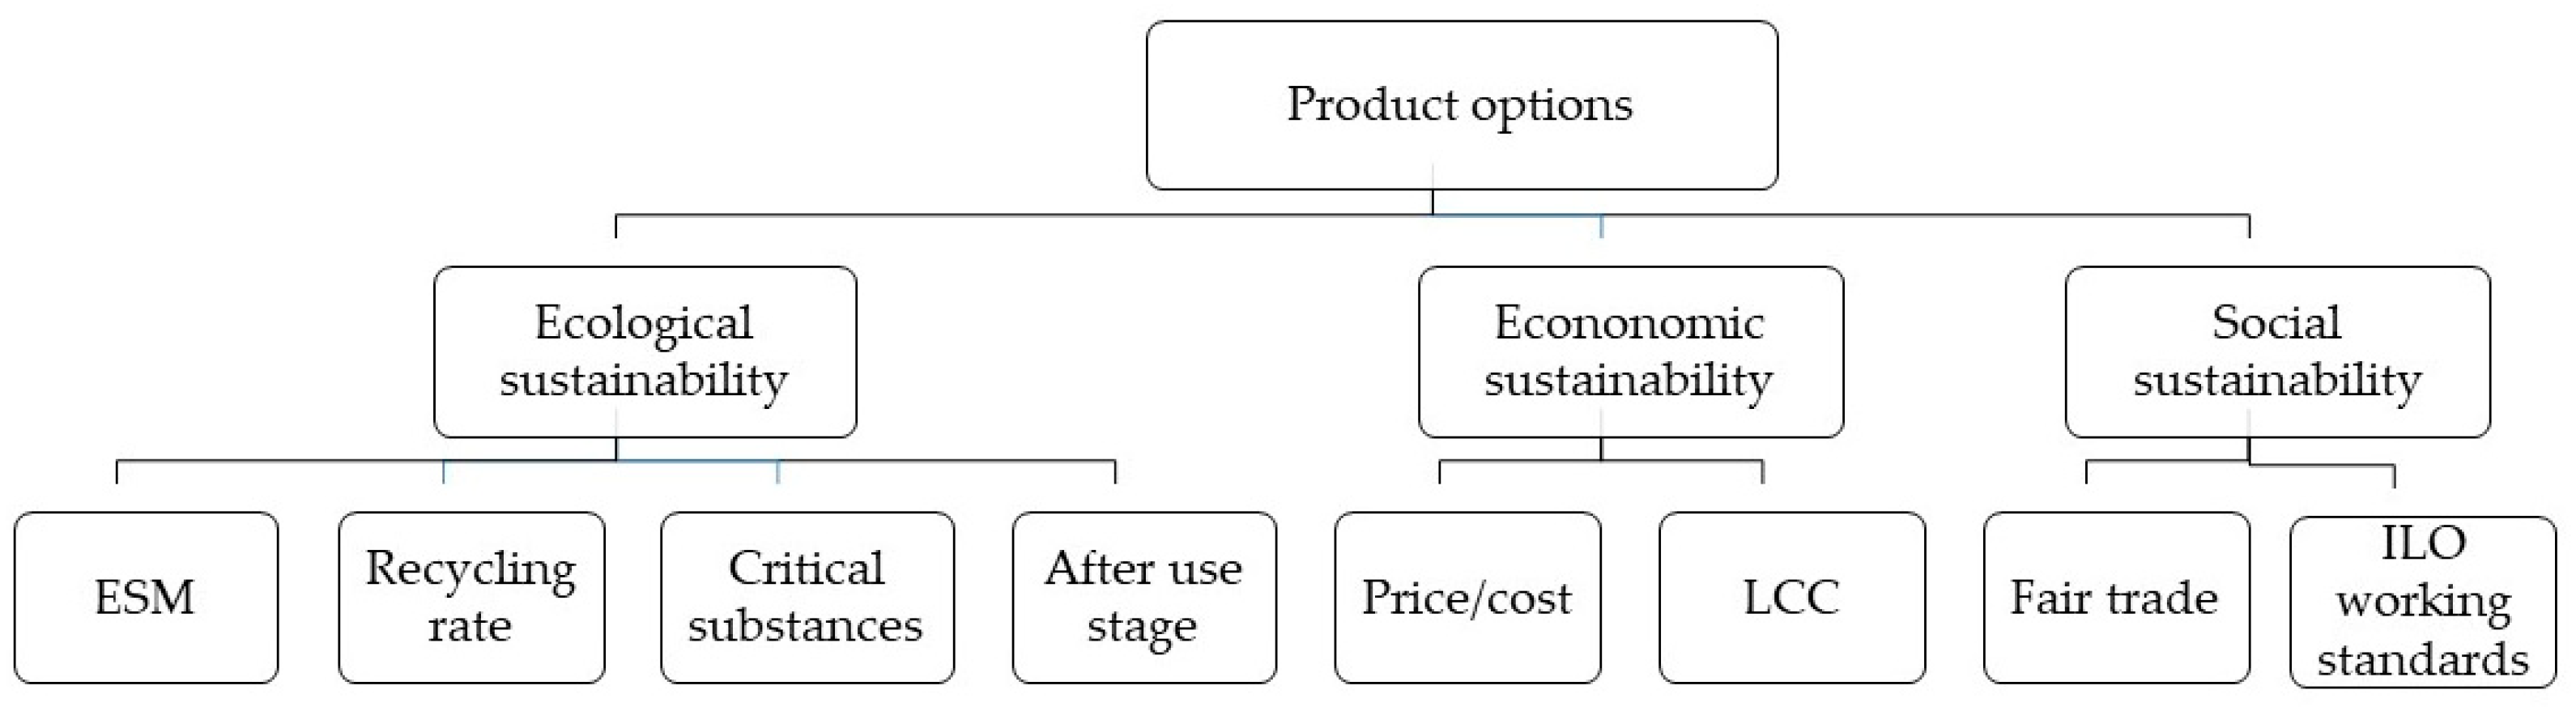
- ESM: indicator 1
- Recycled content: indicators 4 and 5
- Critical substances: indicators 1 and 2
- After-use: indicator 7 (see also comment below)
- Price: considered as part of the ConCirMy approach, see Section 3.7
- LCC: indicator 4
- Fair trade: indicator 20
- ILO core working standards: indicators 12-16
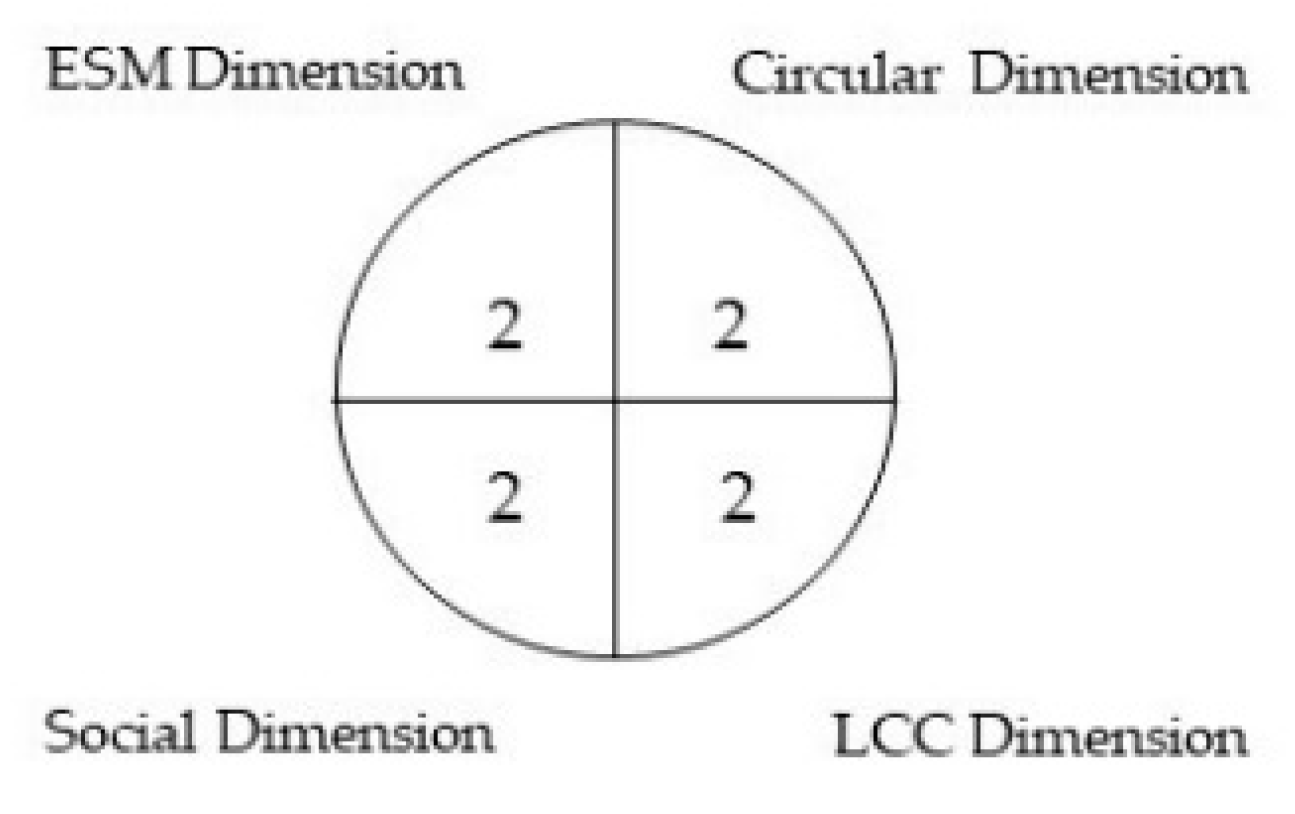
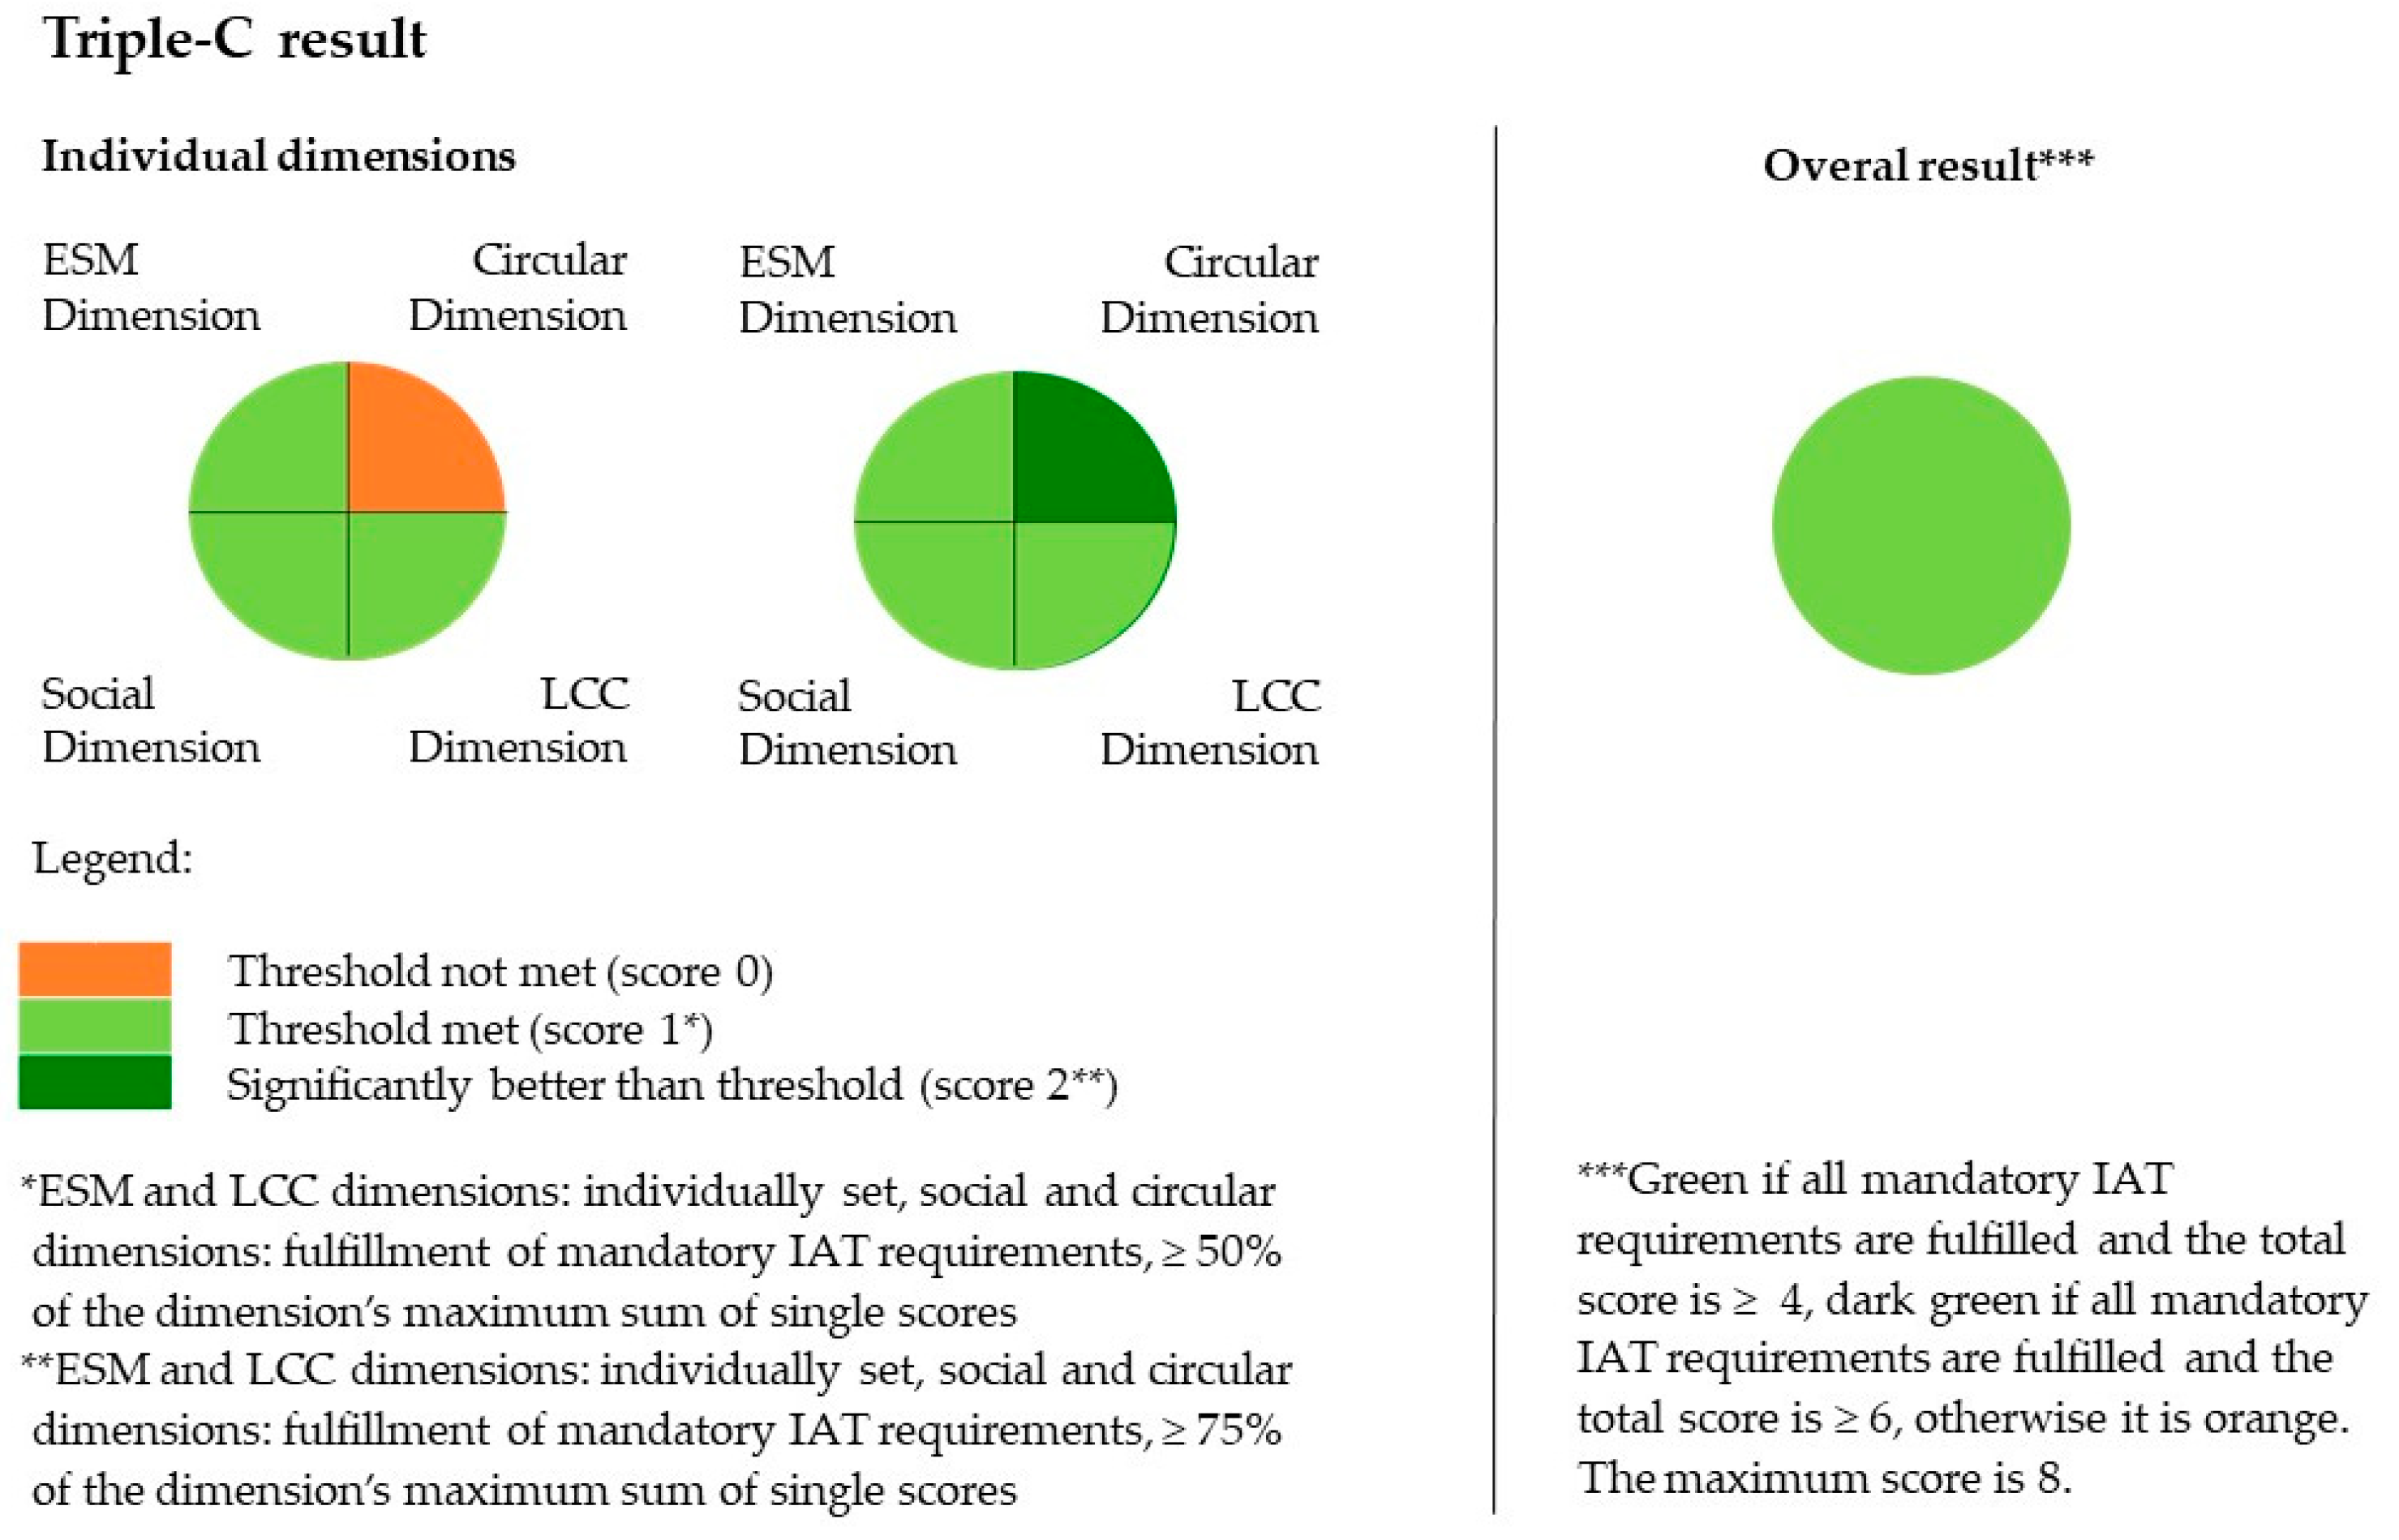
3.5. Triple-C Score and Presentation
- producer’s data regarding all Triple-C indicators, including ESM and LCC results, and
- users’ specification of ESM and LCC thresholds.
3.6. Product-Specific Applications of the Triple-C
3.7. Consideration of Other Life-Cycle Assessment Methods by Triple-C
4. Discussion
4.1. Contributions of This Research
- A structure for an ideal easy-to-use multidimensional circular economy indicator, covering all three sustainability pillars. Specifically, it provides a composite indicator with 20 indicators, including the two combined ESM and LCC elements and 18 single indicators (see Table 4).
- An indicator structure that relies on existing formal international and European standards, ESM, the MCI, and the IAT. On this basis, we also provide the first ESM-based integrated sustainability indicator for the circular economy.
- A practice-oriented indicator structure that considers the needs of public procurement explicitly. Specifically, it shall help buyers to conduct sustainable purchasing decisions and therefore promote sustainable products, their future creation, and, finally, sustainable development.
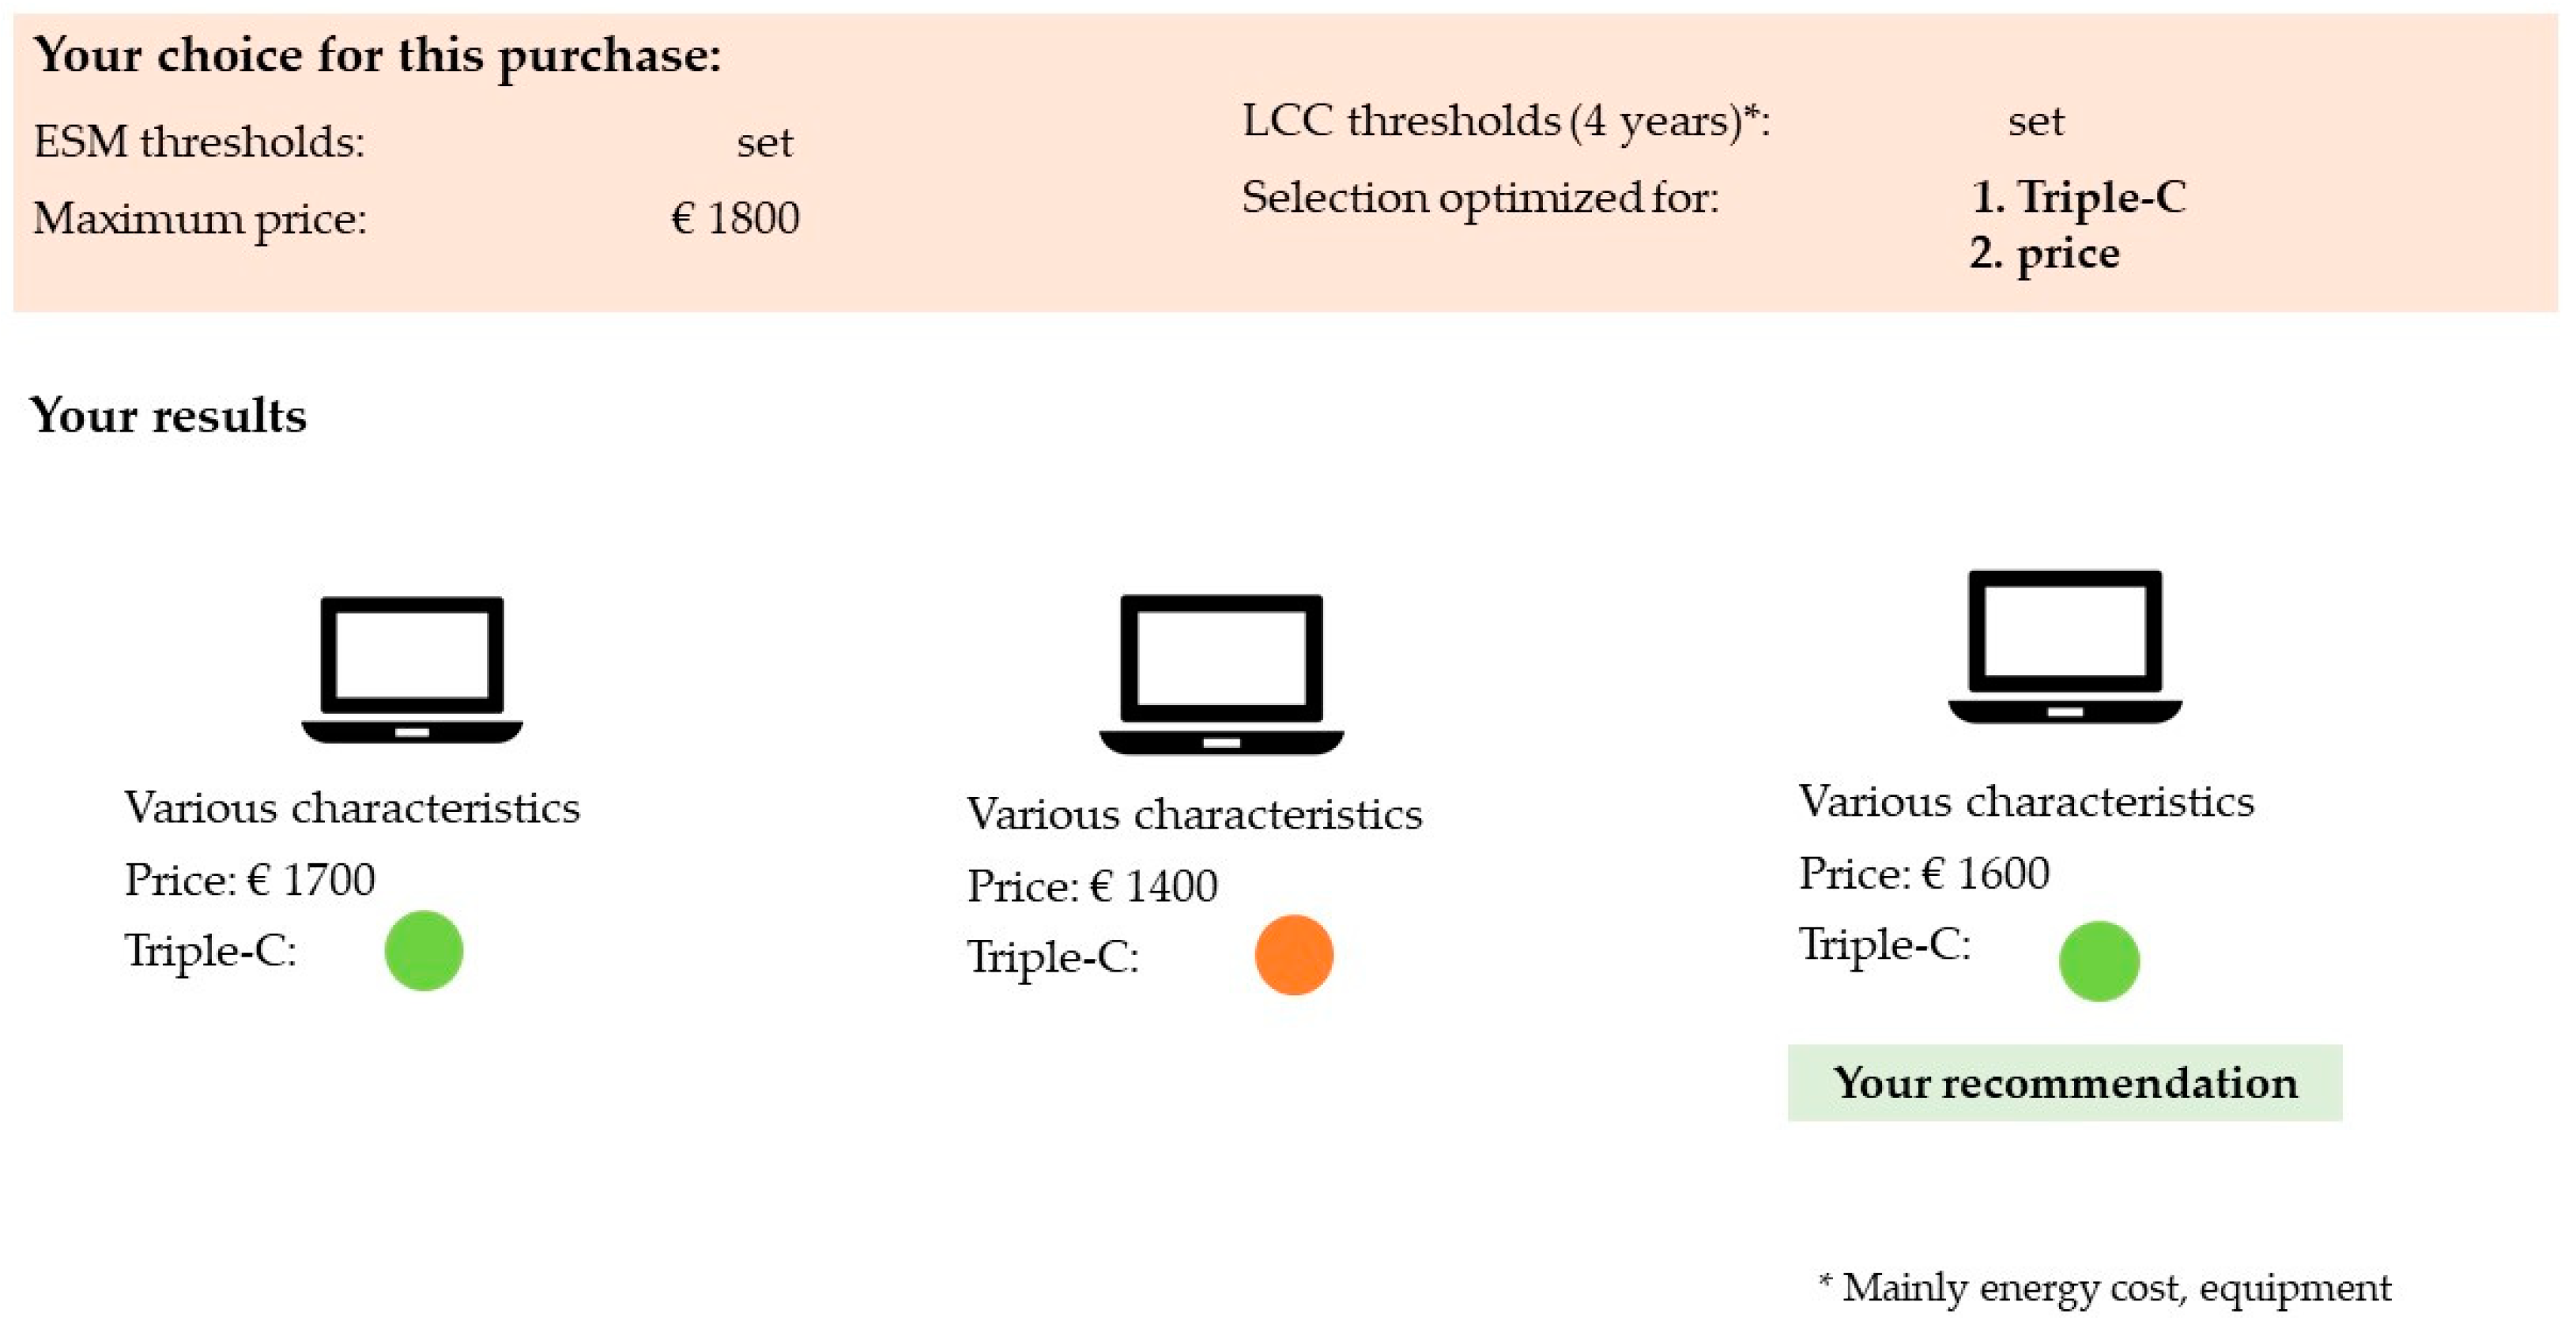
- An example of sustainability recommendation software that uses a multidimensional circular economy indicator. It is the first of its kind that works with ESM values.
- Suggestions for specific product applications for the indicator’s application in public procurement, particularly regarding information technology, mobility, and building products.
4.2. Limitations
- One limitation is its geographic scope. Specifically, Section 1 described the role of sustainable and circular products for Germany’s public procurement, relevant German and European regulation, and resulting needs for sustainability indicators. However, even in Germany, sustainability-related public procurement requirements vary, for example, regarding social sustainability, particularly ILO working standards. Triple-C considers the three sustainability dimensions profoundly. In addition, variants referring to individual federal states’ specific public procurement needs with fewer indicators might be interesting. Regarding the circular economy indicators, regional versions with fewer indicators might also be considered.
- As in the IAT, several parts only cover the life cycle until the end of the production phase. The current concept addresses new products with circular content, but without giving specific information on use stages with different loops. Such information can be relevant for sustainability-conscious buyers and secondhand markets. Additional indicators considering the other “R” elements, such as “reuse”, “repair”, and “refurbish” would be useful if applicable.
5. Conclusions
- As mentioned at the beginning, our Triple-C element ESM is closely related to public policies, and its eco-points represent the ratio of desired policy targets to the current environmental situation. Regarding sustainable development, various policies referring to minimum quotas for certain sustainability characteristics also exist or are discussed, e.g., regarding recycled content. Likewise, an analysis seems helpful for which products minimum Triple-C requirements should be defined, e.g., regarding public procurement.
- In addition to the survey results presented in Section 3, public procurement professionals expressed the specific need for product labels to support their procurement decisions. This will be an appropriate next step, for which Triple-C provides building blocks already. In Europe’s quality infrastructure, various sustainability issues are considered by the EU Ecolabel. Therefore, further work is encouraged to analyze Triple-C’s potential contribution in this context.
- Triple-C was developed as a generic, product-independent composite indicator. Beyond this application, experts involved in our studies also highlighted the importance of considering product group-specific aspects in sustainability assessment. Likewise, Ref. [62] have shown by the example of bio-based products that individual product groups may require additional indicators. This will be subject to further work. Indeed, more research is needed to adjust Triple-C in this context. As this paper primarily addresses the needs of German stakeholders, further research will also allow the integration of additional international perspectives.
- Section 1 and Section 3.1.1 described the research gap and options to address it. Our approach relies on good practice in other research areas specifically. Depending on the research focus, additional research options can serve further interests of research and practice. Such research should rely on four steps: (1) the identification of environmental, social and economic impact assessment methods, (2) the analysis and specification of options to integrate circular economy aspects, (3) the specification of indicator elements, and (4) the specification of the indicator, its structure and the weights of the different elements.
Author Contributions
Funding
Institutional Review Board Statement
Informed Consent Statement
Data Availability Statement
Conflicts of Interest
References
- European Commission. Communication from the Commission to the European Parliament, the Council, the European Economic and Social Committee and the Committee of the Regions. A New Circular Economy Action Plan: For a Cleaner and More Competitive Europe. COM (2020) 98 Final. 2020. Available online: https://eur-lex.europa.eu/legal-content/EN/TXT/HTML/?uri=CELEX:52020DC0098&from=EN (accessed on 27 September 2021).
- Circle Economy. Circularity Gap Report 2021. 2021. Available online: https://www.circularity-gap.world/2021#downloads (accessed on 24 September 2022).
- European Commission. Circular Economy Action Plan. For a Cleaner and More Competitive Europe. 2020. Available online: https://ec.europa.eu/environment/pdf/circular-economy/new_circular_economy_action_plan.pdf (accessed on 27 June 2022).
- European Parliament. Circular Economy: Definition, Importance and Benefits. 2015. Available online: https://www.europarl.europa.eu/news/en/headlines/economy/20151201STO05603/circular-economy-definition-importance-and-benefits (accessed on 28 February 2022).
- Potting, J.; Hekkert, M.; Worrell, E.; Hanemaaijer, A. Circular Economy: Measuring Innovation in the Product Chain. 2017. Available online: https://www.pbl.nl/sites/default/files/downloads/pbl-2016-circular-economy-measuring-innovation-in-product-chains-2544.pdf (accessed on 10 March 2022).
- Kirchherr, J.; Reike, D.; Hekkert, M. Conceptualizing the circular economy: An analysis of 114 definitions. Resour. Conserv. Recycl. 2017, 127, 221–232. [Google Scholar] [CrossRef]
- Wurster, S. Stichwort Circular Economy: Normen, Standards und Potential für Neuartige Taxonomische Positionierung. 2022. Available online: https://din.one/pages/viewpage.action?pageId=98369740&preview=%2F98369740%2F98369744%2FDIN+Mitteilungen+2022-05+-+Circular+Economy+-+Stand+der+Normung%2C+Standardisierung+und+Potential+f%C3%BCr+neuartige+Klassifizierung+%28von+Dr.+Simone+Wurster%2C+TU+Berlin%29.pdf (accessed on 30 July 2022).
- Valverde, J.-M.; Avilés-Palacios, C. Circular Economy as a Catalyst for Progress towards the Sustainable Development Goals: A Positive Relationship between Two Self-Sufficient Variables. Sustainability 2021, 13, 12652. [Google Scholar] [CrossRef]
- European Commission. Communication from the Commission to the European Parliament, the Council, the European Economic and Social Committee and the Committee of the Regions. Closing the Loop-An EU Action Plan for the Circular Economy: COM/2015/0614 Final. 2015. Available online: https://eur-lex.europa.eu/legal-content/EN/TXT/?uri=CELEX%3A52015DC0614 (accessed on 26 September 2022).
- SPD, Bündnis 90/Die Grünen, FDP. Koalitionsvertrag 2021–2025 Zwischen SPD, Bündnis 90/Die Grünen und FDP: Mehr Fortschritt Wagen. Bündnis für Freiheit, Gerechtigkeit und Nachhaltigkeit. 2021. Available online: https://www.spd.de/fileadmin/Dokumente/Koalitionsvertrag/Koalitionsvertrag_2021-2025.pdf (accessed on 20 April 2022).
- Acatech, Circular Economy Initiative Deutschland, SYSTEMIQ. Circular Economy Roadmap für Deutschland. 2021. Available online: https://www.acatech.de/publikation/circular-economy-roadmap-fuer-deutschland/ (accessed on 25 May 2022).
- DIN. Standardization Roadmap Circular Economy. 2022. Available online: https://www.din.de/en/innovation-and-research/circular-economy/standardization-roadmap-circular-economy (accessed on 15 July 2022).
- Wurster, S.; Schulze, R.; Simon, R.G.; Hoyer, S. A Grounded Theory on Sustainable Circular Public Procurement in Germany: Specific Product Case and Strategies. Sustainability 2021, 13, 13525. [Google Scholar] [CrossRef]
- Wurster, S.; Schulze, R.; Simon, R.G. On the Road to Circular Public Procurement: Case, Variations, and Potential Actions in Germany. Sustainability 2021, 13, 13784. [Google Scholar] [CrossRef]
- Bosio, E.; Djankov, S.; Glaeser, E.; Shleifer, A. Public Procurement in Law and Practice. 2020. Available online: https://scholar.harvard.edu/files/shleifer/files/public_procurement_law_practice_11_may_2020.pdf (accessed on 30 September 2021).
- Edler, J.; Georghiou, L. Public procurement and innovation—Resurrecting the demand side. Res. Policy 2007, 36, 949–963. [Google Scholar] [CrossRef]
- European Commission. Green Public Procurement. 2020. Available online: https://ec.europa.eu/environment/gpp/index_en.htm (accessed on 30 July 2022).
- Saidani, M.; Yannou, B.; Leroy, Y.; Cluzel, F.; Kendall, A. A taxonomy of circular economy indicators. J. Clean. Prod. 2019, 207, 542–559. [Google Scholar] [CrossRef] [Green Version]
- Maceno, M.M.C.; Pilz, T.L.; Oliveira, D.R. Life Cycle Assessment and Circular Economy: A Case Study of a Photovoltaic Solar Panel in Brazil. JEAM 2020, 10, 99–111. [Google Scholar] [CrossRef]
- Senán-Salinas, J.; Blanco, A.; García-Pacheco, R.; Landaburu-Aguirre, J.; García-Calvo, E. Prospective Life Cycle Assessment and economic analysis of direct recycling of end-of-life reverse osmosis membranes based on Geographic Information Systems. J. Clean. Prod. 2021, 282, 124400. [Google Scholar] [CrossRef]
- D’Adamo, I.; Falcone, P.M.; Imbert, E.; Morone, P. A Socio-economic Indicator for EoL Strategies for Bio-based Products. Ecol. Econ. 2020, 178, 106794. [Google Scholar] [CrossRef]
- Kristensen, H.S.; Mosgaard, M.A. A review of micro level indicators for a circular economy–moving away from the three dimensions of sustainability? J. Clean. Prod. 2020, 243, 118531. [Google Scholar] [CrossRef]
- Wurster, S.; Reis, C.F.D.B. Priority Products for Sustainability Information and Recommendation Software: Insights in the Context of the EU’s Action Plan Circular Economy. Sustainability 2022, 14, 11951. [Google Scholar] [CrossRef]
- Finkbeiner, M.; Inaba, A.; Tan, R.; Christiansen, K.; Klüppel, H.J. The New International Standards for Life Cycle Assessment: ISO 14040 and ISO 14044. Int. J. Life Cycle Assess 2006, 11, 80–85. [Google Scholar] [CrossRef]
- Tarne, P.; Traverso, M.; Finkbeiner, M. Review of Life Cycle Sustainability Assessment and Potential for Its Adoption at an Automotive Company. Sustainability 2017, 9, 670. [Google Scholar] [CrossRef] [Green Version]
- Ahbe, S. Methode der ökologischen Knappheit für Deutschland: Umweltbewertungen in Unternehmen; eine Initiative der Volkswagen AG, 2., überarbeitete Auflage. AutoUni-Schriftenreihe; Logos-Verlag: Berlin, Germany, 2014; Volume 68. [Google Scholar]
- Bundesamt für Umwelt BAFU. Ökofaktoren Schweiz 2021 Gemäss der Methode der Ökologischen Knappheit: Methodische Grundlagen und Anwendung auf die Schweiz. 2021. Available online: https://www.bafu.admin.ch/bafu/de/home/themen/wirtschaft-konsum/publikationen-studien/publikationen/oekofaktoren-schweiz.html (accessed on 1 August 2022).
- Ahbe, S.; Weihofen, S.; Wellge, S. The Ecological Scarcity Method for the European Union: A Volkswagen Research Initiative: Environmental Assessments; SpringerLink Bücher vol 105; Springer: Wiesbaden, Germany, 2018. [Google Scholar]
- Muhl, M.; Berger, M.; Finkbeiner, M. Development of Eco-factors for the European Union based on the Ecological Scarcity Method. Int. J. Life Cycle Assess 2019, 24, 1701–1714. [Google Scholar] [CrossRef]
- Scharlemann, J.P.W.; Laurance, W.F. Environmental science. How green are biofuels? Science 2008, 319, 43–44. [Google Scholar] [CrossRef]
- Ahbe, S.; Braunschweig, A.; Müller-Wenk, R. Methodik für Ökobilanzen auf der Basis ökologischer Optimierung: 133; Bundesamt für Umwelt, Wald und Landschaft (BUWAL): Bern, Germany, 1990. [Google Scholar]
- BAFU. Umweltbelastungspunkte für Personenwagen. Zusammensetzung und Rechenbeispiele. 2009. Available online: https://www.newsd.admin.ch/newsd/message/attachments/16214.pdf (accessed on 29 September 2022).
- Rathi, R.; Kaswan, M.S. An inclusive review of Green Lean Six Sigma for sustainable development: Readiness measures and challenges. IJAOM 2021, 13, 129. [Google Scholar] [CrossRef]
- Kaswan, M.S.; Rathi, R.; Garza-Reyes, J.A.; Antony, J. Green lean six sigma sustainability–oriented project selection and implementation framework for manufacturing industry. IJLSS 2022, 2040–4166. [Google Scholar] [CrossRef]
- Rathi, R.; Kaswan, M.S.; Garza-Reyes, J.A.; Antony, J.; Cross, J. Green Lean Six Sigma for improving manufacturing sustainability: Framework development and validation. J. Clean. Prod. 2022, 345, 131130. [Google Scholar] [CrossRef]
- CEN. EN 16751, 2016 Bio-Based Products—Sustainability Criteria (BSI Version). 2016. Available online: https://www.en-standard.eu/bs-en-16751-2016-bio-based-products-sustainability-criteria/ (accessed on 29 July 2022).
- JRC. Composite Indicators—A Review: Second Workshop on Composite Indicators of Country Performance, Feb. 26-27th 2004. OECD, Paris. 2006. Available online: https://www.oecd.org/sti/ind/29398640.pdf (accessed on 29 July 2022).
- PACE Circular Indicators For Governments: 2021. Available online: https://pacecircular.org/sites/default/files/2021-04/CircularIndicatorsForGovernments_FINAL.pdf (accessed on 29 July 2022).
- Circle Economy & PACE. Circular Metrics for Businesses: Finding Opportunities in the Circular Economy. 2020. Available online: https://www.circle-economy.com/resources/metrics (accessed on 29 July 2022).
- Gonçalves, M.; Freire, F.; Garcia, R. Material flow analysis of forest biomass in Portugal to support a circular bioeconomy. Resour. Conserv. Recycl. 2021, 169, 105507. [Google Scholar] [CrossRef]
- Haupt, M.; Hellweg, S. Measuring the environmental sustainability of a circular economy. Environ. Sustain. Indic. 2019, 1–2, 100005. [Google Scholar] [CrossRef]
- Medeiros, D.L.; Braghirolli, F.L.; Ramlow, H.; Ferri, G.N.; Kiperstok, A. Environmental improvement in the printing industry: The case study of self-adhesive labels. Environ. Sci. Pollut. Res. Int. 2019, 26, 13195–13209. [Google Scholar] [CrossRef]
- Ecolabel Index. Ecolabel Index. 2022. Available online: https://www.ecolabelindex.com/ (accessed on 30 July 2022).
- C2C. Get Cradle to Cradle Certified™. 2022. Available online: https://www.c2ccertified.org/get-certified/levels/ (accessed on 22 September 2022).
- Kompass Nachhaltigkeit. T-Shirts: 23 Labels. 2022. Available online: https://www.kompass-nachhaltigkeit.de/en/product-search/apparel-textiles/t-shirts#/filters/query (accessed on 22 September 2022).
- Ellen MacArthur Foundation. Material Circularity Indicator (MCI). 2022. Available online: https://ellenmacarthurfoundation.org/material-circularity-indicator (accessed on 30 July 2022).
- Sphera. Circular Economy. Material Circularity Indicator (MCI). 2022. Available online: ttps://gabi.sphera.com/solutions/circular-economy/ (accessed on 21 July 2022).
- Gil Muñoz, V.; Muneta, L.M.; Carrasco-Gallego, R.; de Juanes Marquez, J.; Hidalgo-Carvajal, D. Evaluation of the Circularity of Recycled PLA Filaments for 3D Printers. Appl. Sci. 2020, 10, 8967. [Google Scholar] [CrossRef]
- Rukundo, R.; Bergeron, S.; Bocoum, I.; Pelletier, N.; Doyon, M. A Methodological Approach to Designing Circular Economy Indicators for Agriculture: An Application to the Egg Sector. Sustainability 2021, 13, 8656. [Google Scholar] [CrossRef]
- Urban Mining Index. The Urban Mining Index Pursues the Aim of Keeping Building Materials in as Closed Cycles as Possible. 2022. Available online: https://urban-mining-index.de/ (accessed on 28 July 2022).
- Rosen, A. Urban Mining Index: Entwicklung Einer Systematik zur quantitativen Bewertung der Kreislaufkonsistenz von Baukonstruktionen in der Neubauplanung. Dissertation. 2020. Available online: https://www.irbnet.de/daten/rswb/21049001601.pdf (accessed on 30 July 2022).
- Heisel, F.; Rau-Oberhuber, S. Calculation and evaluation of circularity indicators for the built environment using the case studies of UMAR and Madaster. J. Clean. Prod. 2020, 243, 118482. [Google Scholar] [CrossRef]
- Madaster. Madaster-Das Kataster für Materialien. 2022. Available online: http://madaster.de (accessed on 9 July 2022).
- HOP. The French Repairability Index. A First Assessment—One Year after Its Implementation. 2022. Available online: https://www.halteobsolescence.org/wp-content/uploads/2022/02/Rapport-indice-de-reparabilite.pdf (accessed on 28 July 2022).
- Ellen MacArthur Foundation. Method Introduction. 2021. Available online: https://emf.thirdlight.com/link/hpqctc2qdako-v1xw8g/@/#id=0 (accessed on 30 July 2022).
- Ellen MacArthur Foundation. Circulytics: Resources. 2022. Available online: https://ellenmacarthurfoundation.org/resources/circulytics/resources (accessed on 29 July 2022).
- UNEP. The New Plastics Economy Global Commitment. Available online: https://www.unep.org/new-plastics-economy-global-commitment (accessed on 9 July 2022).
- Ecovadis. Materials. 2022. Available online: https://resources.ecovadis.com/ecovadis-solution-materials (accessed on 28 July 2022).
- Tashkeel, R.; Rajarathnam, G.P.; Wan, W.; Soltani, B.; Abbas, A. Cost-Normalized Circular Economy Indicator and Its Application to Post-Consumer Plastic Packaging Waste. Polymers 2021, 13, 3456. [Google Scholar] [CrossRef]
- Harris, S.; Martin, M.; Diener, D. Circularity for circularity’s sake? Scoping review of assessment methods for environmental performance in the circular economy. Sustain. Prod. Consum. 2021, 26, 172–186. [Google Scholar] [CrossRef]
- STAR-ProBio. Sustainability Transition Assessment and Research of Bio-Based Products. 2020. Available online: http://www.star-probio.eu/ (accessed on 30 July 2022).
- Ladu, L.; Morone, P. Holistic approach in the evaluation of the sustainability of bio-based products: An Integrated Assessment Tool. Sustain. Prod. Consum. 2021, 28, 911–924e6. [Google Scholar] [CrossRef]
- ADB/ILO. Core Labour Standards Handbook. 2006. Available online: https://www.ilo.org/wcmsp5/groups/public/---asia/---ro-bangkok/---ilo-manila/documents/publication/wcms_126253.pdf (accessed on 30 September 2021).
- BMJV und BfJ. Gesetz zur Förderung der Kreislaufwirtschaft und Sicherung der Umweltverträglichen Bewirtschaftung von Abfällen (Kreislaufwirtschaftsgesetz-KrWG). 2021. Available online: https://www.gesetze-im-internet.de/krwg/BJNR021210012.html (accessed on 26 July 2022).
- BMJV/BfJ. Bundeshaushaltsordnung (BHO): Bundeshaushaltsordnung vom 19. August 1969 (BGBl. I S. 1284), Die Zuletzt Durch Artikel 2 Des Gesetzes Vom 1. Juli 2022 (BGBl. I S. 1030) Geändert Worden Ist. 2022. Available online: https://www.gesetze-im-internet.de/bho/__7.html (accessed on 26 July 2022).
- BMU. Umweltfreundliche Beschaffung. 2020. Available online: https://www.bmu.de/themen/nachhaltigkeit-digitalisierung/konsum-und-produkte/umweltfreundliche-beschaffung (accessed on 1 November 2021).
- European Commission. Life Cycle Costing. 2022. Available online: https://ec.europa.eu/environment/gpp/lcc.htm (accessed on 22 September 2022).
- Axsen, J.; TyreeHageman, J.; Lentz, A. Lifestyle practices and pro-environmental technology. Ecol. Econ. 2021, 82, 64–74. [Google Scholar] [CrossRef]
- FEMNET. Möglichkeiten Einer Ökologisch Und Sozial Nachhaltigen Öffentlichen Beschaffung. Leitfaden Erstellt im Auftrag von FEMNET e.V. 2019. Available online: https://femnet.de/download/send/22-beschaffung/98-moeglichkeiten-einer-oekologischen-sozial-nachhaltigen-beschaffung-femnet-leitfaden.html (accessed on 27 September 2021).
- DIN. DIN SPEC 77234:2013-09 Leitlinien für die Bewertung von Lebenszykluskosten in Produkt-Dienstleistungssystemen. 2013. Available online: https://www.beuth.de/de/technische-regel/din-spec-77234/189457814 (accessed on 1 August 2022).
- VDI. VDI-Richtlinie VDI 2884, Beschaffung, Betrieb und Instandhaltung von Produktionsmitteln unter Anwendung von Life Cycle Costing (LCC). 2005. Available online: https://www.vdi.de/richtlinien/details/vdi-2884-beschaffung-betrieb-und-instandhaltung-von-produktionsmitteln-unter-anwendung-von-life-cycle-costing-lcc (accessed on 1 August 2022).
- Sonigo, P.; Bain, J.; Kong, M.A. Policies to Encourage Sustainable Consumption: Full Report; European Communities: Luxembourg, 2012. [Google Scholar]


| Application Area | Bio-Based Products |
|---|---|
| Content | The IAT represents a cumulative scoring system, in particular on policies, environmental LCA results, indirect land use change (ILUC) aspects, circularity, social and economic aspects. |
| Indicators and thresholds | The 48 IAT indicators rely on 33 sustainability protection areas and 24 principles. Six indicators are critical and must be met to achieve a sustainability score. The concept provides thresholds for each indicator compared to an ideal situation, a specific target, a reference scenario, or a minimum requirement. |
| Scoring | The IAT provides numerical scores according to the characteristic of each indicator. For quantitative indicators, the assigned score is 2 when the indicator performs as expected; for qualitative indicators, the comparable score is 1. If an indicator cannot refer to appropriate results, the assigned score is 0. The maximum score is 105. |
| Representation | Visualization of the score is possible |
| No. of Cost Element | Cost Element | Cost Group |
|---|---|---|
| 1 | Purchase price | Acquisition costs |
| 2 | Installation costs | |
| 3 | If applicable, further acquisition costs | |
| 4 | Insurance | Follow-up costs |
| 5 | Maintenance (material costs, procured service), spare parts, if applicable, further follow-up costs | |
| 6 | Electricity | Operating supplies |
| 7 | Drinking water (supply, disposal), rainwater/service water | |
| 8 | Other operating supplies, if applicable | |
| 9 | Personnel (according to relevant pay groups) | Personnel |
| 10 | Disposal fees, other disposal costs, if applicable | Disposal |
| Pillar | No. | Basic IAT Indicator No. | |
|---|---|---|---|
| Environ-mental | Life-cycle aspects | 1–9 | 1–6, 12, 19, 20 |
| Circular aspects | 10–18 | 22, 24–26, 28–32 | |
| Economic | 19 | 33 (modified) | |
| Social | 20–28 | 35–42, 48 | |
| Total | |||
| Pillar | No. | Basic IAT Indicator | Indicator On | Expected Performance | Threshold To Be Met | |
|---|---|---|---|---|---|---|
| Environmental | Life cycle | 1 1 | - | ESM with 10 elements (a) CO2 eq, (b) NMVOX, (c) Nox, (d) Nitrogen, (e) Phosphorus, (f) Nickel, (g) Freshwater, (h) primary energy, (i) non-hazardous waste, (j) additional aspects) Note: a–c = emissions to air, d–f = emission to water, g,h = consumption of resources | According to regulation or to be set by the user | Expected performance |
| Circular aspects | 2–10 | 22, 24–26, 28–32 | (2). greener alternatives to the use of substances of very high concern, (3). % of biogenic carbon/total carbon (product) renewability, (4). use of recycled or renewable raw materials and the recyclability of the end product, (5). the product’s MCI, (6). measures to manage and reduce waste, (7). guidance and clear instructions to consumers on how the product should be disposed after use, (8). energy efficiency, (9). measures taken to promote the use of renewable energy, (10). share of renewable energy compared to a relevant process | IAT [62] minimum requirements | Expected performance | |
| Economic | 11 | 33 | The analysis of the LCC elements * meets thresholds set by the user * (a) purchase price, (b) installation costs, (c) if applicable, further acquisition costs, (d) insurance, (e) maintenance (material costs, procured service), spare parts, if applicable, further follow-up costs, (f) electricity cost, (g) water cost, (h) other operating supplies if applicable, (i) personnel cost, (j) disposal fees, other disposal costs if applicable | To be set by the user | Expected performance | |
| Social | 12–20 | 35–42, 48 | (12). forced labor, (13). child labor, (14). salary of workers, (15). equal opportunities, (16). health and safety of workers, (17). health and safety of end users, (18). mechanisms for users to provide feedback, (19). measures taken to address transparency, (20). fair market competition | IAT [62] minimum requirements | Expected performance | |
| Environmental Dimension ESM Indicator with 10 Elements | Circular Dimension 9 IAT Indicators | Social Dimension 9 IAT Indicators | Economic DimensionLCC Indicator with 10 Elements |
|---|---|---|---|
 |  |  |  |
Publisher’s Note: MDPI stays neutral with regard to jurisdictional claims in published maps and institutional affiliations. |
© 2022 by the authors. Licensee MDPI, Basel, Switzerland. This article is an open access article distributed under the terms and conditions of the Creative Commons Attribution (CC BY) license (https://creativecommons.org/licenses/by/4.0/).
Share and Cite
Wurster, S.; Ladu, L. Triple-C: A Tridimensional Sustainability-Oriented Indicator for Assessing Product Circularity in Public Procurement. Sustainability 2022, 14, 13936. https://doi.org/10.3390/su142113936
Wurster S, Ladu L. Triple-C: A Tridimensional Sustainability-Oriented Indicator for Assessing Product Circularity in Public Procurement. Sustainability. 2022; 14(21):13936. https://doi.org/10.3390/su142113936
Chicago/Turabian StyleWurster, Simone, and Luana Ladu. 2022. "Triple-C: A Tridimensional Sustainability-Oriented Indicator for Assessing Product Circularity in Public Procurement" Sustainability 14, no. 21: 13936. https://doi.org/10.3390/su142113936