Article

Building a Sustainable Energy Community: Design and Integrate Variable Renewable Energy Systems for Rural Communities

1
Mechanical Engineering Department, College of Engineering, Najran University, P.O. Box 1988, Najran 61441, Saudi Arabia
2
Department of Applied Mechanical Engineering, College of Applied Engineering, Muzahimiyah Branch, King Saud University, P.O. Box 800, Riyadh 11421, Saudi Arabia
3
Department of Mechanical and Aeronautical Engineering, University of Pretoria, Private Bag X20, Hatfield 0028, Pretoria 0002, South Africa
4
Department of Medical Research, China Medical University Hospital, China Medical University, Taichung 404, Taiwan
*
Authors to whom correspondence should be addressed.
Sustainability 2022, 14(21), 13792; https://doi.org/10.3390/su142113792
Submission received: 4 September 2022 / Revised: 12 October 2022 / Accepted: 18 October 2022 / Published: 24 October 2022

Abstract

:
This study proposes a decentralized hybrid energy system consisting of solar photovoltaics (PV) and wind turbines (WT) connected with the local power grid for a small Najran, Saudi Arabia community. The goal is to provide the selected community with sustainable energy to cover a partial load of the residential buildings and the power requirements for irrigation. For this, a dynamic model was constructed to estimate the hourly energy demand for residential buildings consisting of 20 apartments with a total floor area of 4640 m 2 , and the energy requirements for irrigation to supply a farm of 10,000 m 2 with water. Subsequently, HOMER software was used to optimize the proposed hybrid energy system. Even considering the hourly fluctuations of renewable energies, the artificial neural network (ANN) successfully estimated PV and wind energy. Based on the mathematical calculations, the final R-square values were 0.928 and 0.993 for PV and wind energy, respectively. According to the findings, the cost of energy (COE) for the optimized hybrid energy system is $0.1053/kWh with a renewable energy penetration of 65%. In addition, the proposed system will save 233 tons of greenhouse gases annually.

1. Introduction

Global warming is a devastating event that threatens the life of human beings. Because of the excessive use of fossil fuel for energy generation, air pollution is increasing at an alarming level. Fortunately, The Paris Agreement committed to keep global warming below 2 °C [1]. To achieve this objective, technologies and innovations are needed to address the energy crises, especially in developing nations. Since the early 1970s, the demand for energy in Saudi Arabia has increased rapidly due to human expansion, economic growth, and low energy prices [2]. The energy demand in Saudi Arabia in 2018 was 299.2 terawatt-hours (TWh). This energy demand is comparable to countries with larger populations (e.g., Mexico had a population of 127.5 million in 2019, compared to Saudi Arabia’s population of 34.2 million) [2]. The energy demands expanded quickly for decades under the backing of government incentives through fixed and low energy prices. This trend of rising energy demand coupled with low energy prices was considered unsustainable since it threatened the government’s capacity to maintain its budget [2].
The transition toward sustainable energy begins by transforming our communities to adopt renewable energy. People within a community embrace sustainable energy technologies such as renewable energy in a shared manner compared to the conventional individual practice of utilizing energy. Many communities and regions have stated clear goals to move their community to sustainable energy and to become energy independent. For example, in the Netherlands, many cities and towns have developed ambitious plans to become energy neutral and achieve low carbon emissions [3]. The Environmental and Energy Study Institute (EESI) community energy is another initiative that aims to make renewable energy more accessible to locals [4]. This initiative focuses on strategies that allow different households and businesses to create, own, or share the expenses of local energy projects.
Saudi Arabia has made it plain that it intends to switch from conventional power facilities that depend on fuel to more environmentally friendly options. By boosting the penetration of renewable energy, Saudi Arabia plans to decarbonize half of its energy industry by 2030 [5]. Transitioning to renewable energy will be impossible without tackling the high demand of energy in the residential and agricultural sectors, which absorb a significant amount of Saudi Arabia’s overall energy production (KSA). As a result, this research aims to contribute to the Kingdom’s transition to a green economy by designing an energy system for a rural community.
The following is a description of the paper’s structure. A review of the literature and an outline of the main contribution are presented in Section 2. Section 3 begins with a description of the proposed microgrid-hybrid energy system. Then, a detailed mathematical model is developed in Section 4 to estimate buildings’ energy demands and farming energy requirements for irrigation. Section 5 shows the selected location, resource analysis, and electrical load profile. The results and discussion of the proposed system are described in Section 6. Finally, the conclusions and implications of the study are presented in Section 7.

2. Literature

The focus on energy consumption and management can be examined in different ways [6,7,8,9,10,11,12,13]. Nanoparticles, which have been widely studied since the last century [14,15,16,17,18], can also be used in this direction [19,20,21,22,23,24,25]. This section summarizes the literature review related to this study. The first section reviews previous studies that aim to optimize hybrid energy systems for residential buildings. The second section discusses the optimization techniques for an irrigation system. In section three, we summarize previous studies that used machine learning for energy forecasting and optimization.

2.1. Hybrid Energy System for Residential Buildings

Hybrid energy systems that consist of two or more renewable energy sources have been widely used to develop a sustainable energy community [26,27,28,29,30]. For example, Nyeche and Diemuodeke developed an optimized hybrid energy system comprised of a photovoltaic array, wind turbine, and hydro energy storage [31]. The suggested system was optimized and sized using a genetic algorithm to meet the energy needs for a typical Patani coastline community while minimizing the disparity between energy demand and energy generated. The results showed that the suggested system’s levelized cost of energy (COE) was $0.27/kWh. Pal and Bhattacharjee proposed a decentralized biogas-based hybrid energy system to provide sustainable energy for a small rural community located in India [32]. The system component was optimized, and the overall net present value was minimized using particle swarm optimization (PSO). The hybrid renewable energy system was simulated based on typical meteorological year (TMY) data. To ensure that the power supply was not disrupted, an energy management strategy was developed. The proposed hybrid system had a cost of energy of $0.12/kWh, which is attractive compared to similar systems. Another study investigated the potential of developing a hybrid energy system for the Rohingya refugee community in Bangladesh [33]. The proposed system consists of a combination of PV panels, wind turbines, and energy storage. The results of the study indicated that 87% of the energy demand comes from renewable energy resources. The total energy cost for their study was $0.35/kW.
Buildings consume 80% of total electricity in Saudi Arabia, with the residential sector accounting for 50% [34]. Due to population growth, the pace of increase in energy demand continues to climb. In order to create an energy-efficient hybrid system that will deliver a stable source of energy for residential construction, several studies have been conducted. A techno-economic optimization of hydrogen power production using solar and wind energy was established by Al-Sharafi et al. [35]. The suggested system investigated several climatic conditions in the Saudi Arabian Kingdom. The minimal levelized COE for the study was $1.208/kWh. Another study [36] investigated the use of a solar PV and wind hybrid energy system for residential buildings in four different climate zones in Saudi Arabia: Yanbu, Sharurah, Hafar Albatin, and Riyadh. Because of the significant renewable energy penetration in Yanbu, the study’s findings showed that the suggested hybrid energy system was economically viable. The study’s main contribution was reducing greenhouse gas emissions while lowering energy expenses. Baseer et al. [37] investigated the techno-economic analysis and evaluation of a hybrid energy system for residential areas in Jubail. This hybrid energy system combined PV/wind/diesel and PV/wind with battery storage to meet the electric load requirements for three housing compounds. The technical and economic feasibility of various configurations was assessed using HOMER software. Three compounds had a minimal COE of $0.217 per kWh. PV and wind turbines with energy storage had a minimal COE of $0.25/kWh, allowing for 100 percent renewable energy penetration. In addition, the ideal planned system is expected to reduce 2800 tons of CO2 each year. A hybrid system with solar PV, wind turbines, and a diesel generator was also constructed for a town in Saudi Arabia [38]. The proposed hybrid system will replace eight diesel generators that were previously used to supply the village’s power needs. With a 35 percent renewable energy penetration, the energy cost was $0.212/kWh according to the optimal results. In addition, Almehmadi and Aljabr studied the possible peak energy reduction of a residential building in a hot and dry climate in Saudi Arabia [39]. A comparative analysis between utilizing variable compressor speed versus integrating an air conditioning system with Maisotsenko evaporative cooling (M-cycle) was theoretically investigated. Results show that using variable compressor speed reduced the peak energy by 20%.

2.2. Hybrid Energy System for Irrigation Systems

Hybrid energy systems also have been used widely for agricultural irrigation. For example, Hassan and Kamran proposed a hybrid energy system that consists of PV panels for an irrigation water pump for rural agriculture areas in Pakistan [40]. The proposed hybrid system intends to provide a reliable energy source at a reasonable cost to meet the irrigation needs of farms in Pakistan. In addition, small-scale irrigation powered by solar and WT were designed for the Kalangala district in Uganda [41]. This hybrid system optimized for a stand-alone irrigation system to supply a farm with 33.73   m 3 / day of water. According to the study’s findings, the hybrid system may offer farmers a reliable energy source with an annual rate of return of 3.5%.
An experimental verification and sizing optimization for a hybrid water pumping system in a greenhouse was proposed in [42]. The study aimed to develop an optimization model to determine the optimum size of a hybrid PV/WT with a battery-generated system that leads to a minimum annual operating cost. The best configuration of the optimized system was evaluated experimentally for 15 days in a greenhouse in Weinan. The results of the experiment illustrated that the power generated from PV and wind turbine was 41.74 kW and 6.235 kW. This indicated that the proposed hybrid system could meet the irrigation pumping energy requirements.
Ouachani et al. proposed an intelligent algorithm for an optimum renewable energy system for irrigation [43]. This hybrid system consisted of PV/WT and battery banks for energy storage. The goal of the developed algorithm was to ensure continuous and safe operations. Another study attempted to design a sustainable source of energy to cover the irrigation energy requirements as well. The proposed system was conducted in Mecha woreda (district), with a focus on the Koga irrigation command regions. Solar and small-scale hydropower systems incorporated with the microgrid were proposed in [44]. Interestingly, any extra energy produced by the proposed hybrid system would be distributed to the public for other purposes, such as lighting and cooking, to improve the overall quality of life. Therefore, the study concluded that a renewable energy-based microgrid is attractive at the social and environmental level. Another study used a genetic algorithm optimized to find the ideal size of the hybrid system that consists of PV/wind power to meet the irrigation needs [45]. Results demonstrated that a hybrid system comprised of PV/wind was economically feasible for the city of Abu-Rudies with a levelized COE of around $0.179/kWh.

2.3. Machine Learning Algorithm for Energy Optimization and Forecasting

Machine learning algorithms have been widely used for optimally sizing sustainable energy systems and forecasting the power output. Because one of the fundamental limitations of machine learning is the absence of training data that are relevant on a large scale, it is necessary to merge physics-based modeling with machine learning. Recently, scientists in many disciplines such as image classification, building energy forecasting, etc., have shown great interest in machine learning due to its capability of analyzing a huge amount of data. Most of the previous studies that aim to forecast energy demand on buildings utilizing machine learning have been solely driven by data [46].
Physical-based modeling and machine learning can be combined in a variety of ways. For example, Li et al. combined the physic-based model machine learning algorithm, namely, support vector machine (SVM) to predict hourly cooling load in office buildings [47]. The input features of the SVM, such as the climate conditions, were obtained from Guangzhou’s climate database for a normal meteorological year. The simulated cooling load for the building was used to train the ML model. The study concluded that the SVM model is accurate, especially when the training dataset is limited. In addition, Vaghefi et al. merged a physic-based model and a data-driven approach to forecast and control heating/cooling systems in buildings [48]. A combination of historic real data and datasets generated using Energy Plus were employed to train the ML model to control heating/cooling for buildings optimally. Results indicated that the developed productive model could accurately forecast the indoor temperature for a short period of time, and the overall predicted energy demand was accepted.
Sustainable centralized energy system development has recently received more attention to smooth the transition to sustainability. For example, Zhou et al. utilized a supervised machine learning algorithm to forecast on-site renewable energy production [49]. Unlike the physics-based simulation, which usually comes with a high computational cost, the developed driven data approach can predict on-site power generation with high accuracy and at a lower computational cost. In addition, Hou et al. developed a data-driven approach for identifying the effect of high renewable energy perpetration [50].

2.4. Research Objective

Saudi Arabia consumes a portion of its oil for electricity production. The residential sector consumes around 52% of total power produced, and the average electricity consumption is three times higher than the world average [51]. In addition, according to the International Energy Agency (IEA), Saudi agricultural power usage more than doubled between 1988 and 2014, rising from 0.05 to 0.39 million tons of oil [52]. Given that the residential and agriculture sectors consume a large portion of energy, maximizing the penetration of sustainable energy in these sectors is a priority. Integrated strategies at all societal and institutional levels are needed to resolve this issue, live in harmony with the environment, and develop a sustainable and green community that will ensure a better future and reduce dependence on oil for electricity production. The transition to sustainability in residential and agricultural sectors could be accomplished through technologies and innovation that combine and optimize different types of renewable energy production and energy storage.
The primary goal of this study was to investigate the possibility of maximizing the renewable energy penetration in rural communities in Saudi Arabia, and based on techno-economic optimizations, to meet partial electrical loads within the community. Thus, we proposed a microgrid hybrid energy system that intends to provide a rural community with resilience and a reliable energy source to meet the energy demand for residential buildings and irrigation energy required for farms. In addition, this study attempted to integrate machine learning and physics-based simulation to create a robust model for predictions and hybrid energy optimizations.
The current effort resulted in a referable approach for sustainable development in rural communities with a reliable energy source, which can enhance the transition to a green economy. The following are the study’s main contributions:
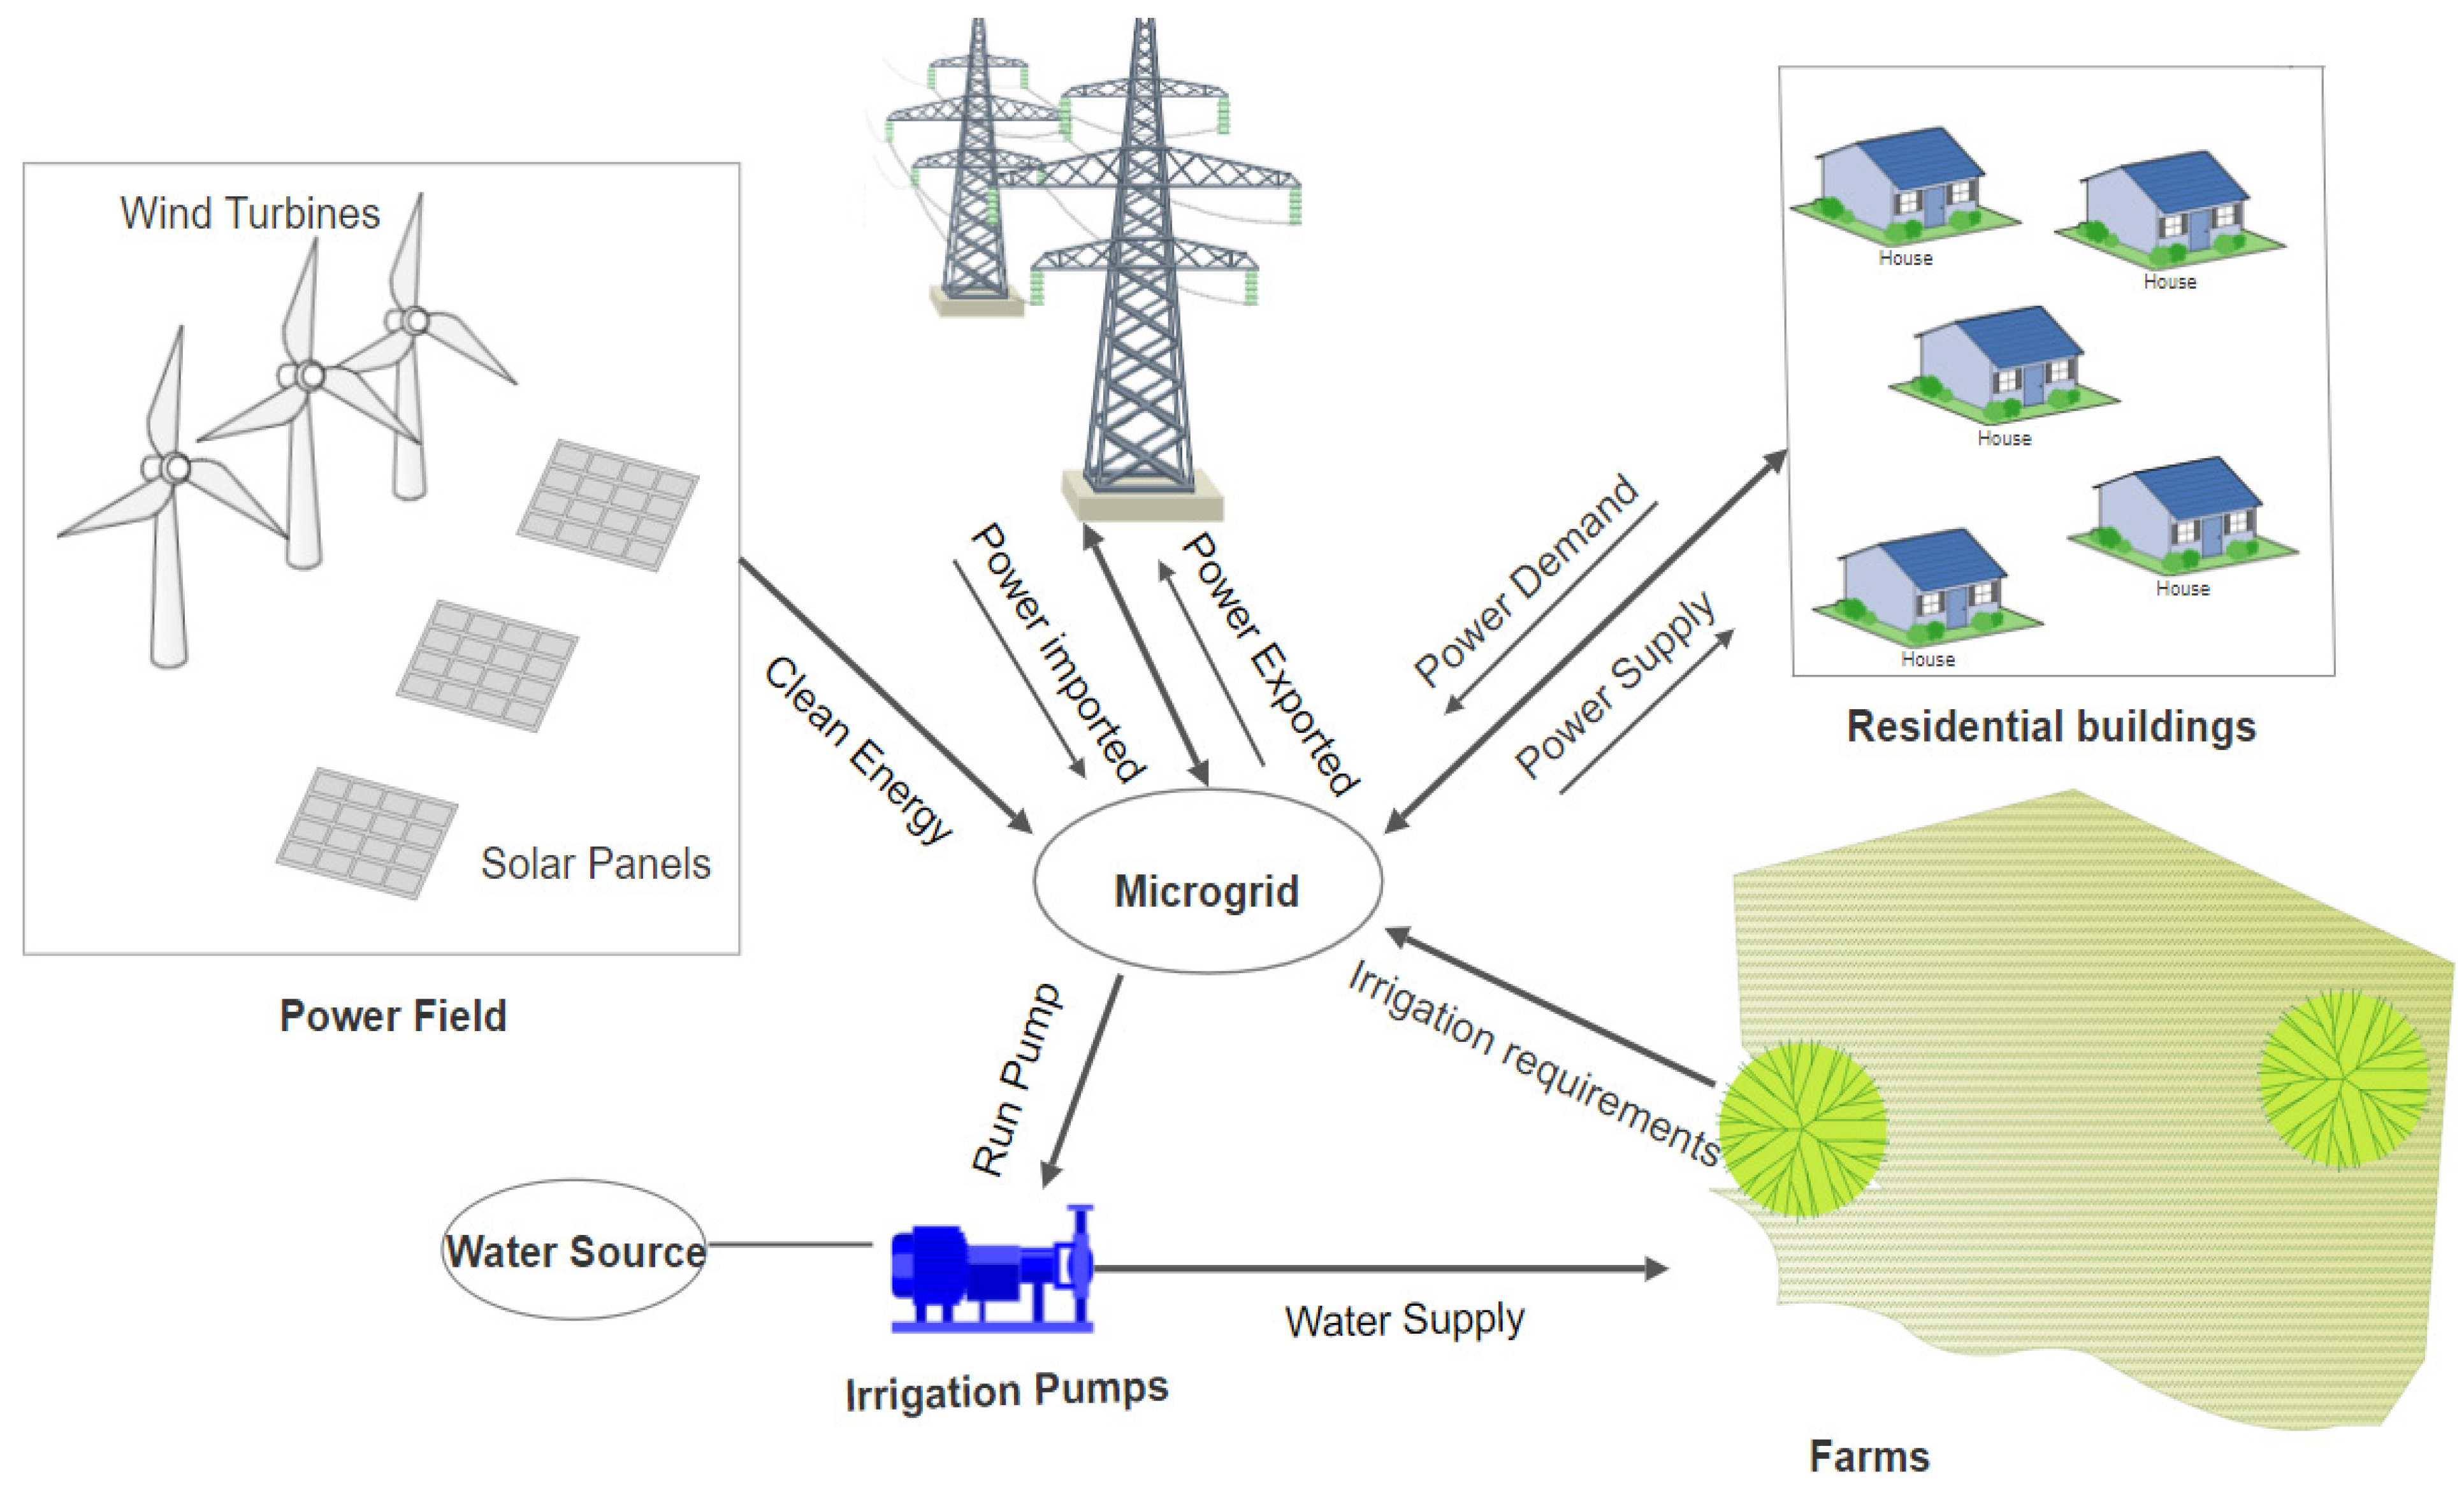
  • Create a micro-grid hybrid energy system comprised of PV and wind energy to meet partial energy demand in a small rural community in the southwest of Saudi Arabia.
  • Develop a dynamic model that appropriately forecasts the hourly energy demand in the communities based on weather conditions for the selected location.
  • Estimate the water requirements to grow potatoes, tomatoes, and wheat for a 10,000 m2 farm using CROPMAT software and determine an appropriate irrigation schedule to supply the farm with the necessary amount of water.
  • Optimize the sizing of the proposed system using HOMER software to minimize the total COE.
  • Integrate the physics-based model with machine learning (ANN) to create robust model production and hybrid energy optimizations.
To the best of our knowledge, this is the first research of its sort for the Najran region. The proposed hybrid system aims to accelerate the transition to a green economy by reducing the reliance on non-sustainable energy. This study’s findings apply to similar locations with similar meteorological and soil conditions.

2.5. Description and Modeling of the Proposed System

This study considers a hybrid energy system comprised of solar PV/WT for a rural community. The objective of the proposed hybrid system is to provide a reliable source of energy to cover the partial load of a residential building along with the necessary power for irrigation. Figure 1 illustrates the proposed hybrid system. It contains a power field, residential buildings, and a community farm. The power field subsystem includes PV modules and WT. The energy produced from the power field will cover the electric load within the residential buildings and the required pumping energy used for irrigation. When the energy produced from the power field exceeds the demands, the excess energy will be sold back to the grid. On the contrary, grid power will be utilized when the proposed hybrid system cannot meet the energy demand for the residential building and the power needed for irrigation.

3. Model

3.1. Typical Residential Building Model

The following is a description of the developed model of a residential building. First, a typical residential building model is constructed based on geometrical and energy characteristics defined in Table 1. This model is developed to estimate the energy consumption of specific typical buildings.

3.2. Residential Buildings Energy Requirements

This section creates a model for a residential building that can forecast heat gains/losses, related heating/cooling requirements for the exterior environment, and estimations of energy consumption from plug-in loads, such as lighting and other equipment. The developed model aims to evaluate hourly energy consumption and forecast heat losses/gains of the building with the surrounding environment to determine the amount of cooling/heating energy needed to maintain a 24 °C interior temperature. As a result, the total energy consumption of a residential structure can be estimated as follows [54]:
E . total = E . HVAC + E . baseline  
where E . total and E . baseline   are the total electricity and the baseline energy loads expressed in kWh. Estimating cooling/heating loads involves modeling the dynamic behavior of a typical residential building. HVAC energy consumption was calculated with the following equation:
V ρ a c pa dT indoor dt =   UA (   T amb T idoor ) +   Q gen + V ρ a c pa ACH ( T amb T indoor )   Q . cooling COP
where T amb and T idoor are the ambient and indoor temperatures, respectively, expressed in °C; V , ρ a ,   and   c pa are the volume of the house, air density, and specific heat capacity of air, respectively; UA and ACH are the overall heat transfer coefficient of the W/°C; and the air change per hour, respectively; and Q . cooling and COP are the cooling loads required to maintain indoor temperature at 24 °C and the coefficient performance of the unit, respectively. The heat generated inside the house from occupants, lighting, and appliances is expressed as Q gen .

3.3. Irrigation Pumping Energy Requirements

Estimating the crop water requirements (CRW) of various crops grown, particularly in arid regions, is vital. Due to the low level of rainfall, knowing the crop water requirements allows for more effective water use and efficient irrigation practices. The FAO-CROPWAT model was adopted to estimate the crop water needs of the main crop cultivated in the city of Najran, Saudi Arabia [55]. According to the Ministry of Municipal and Rural Affairs [56], agriculture is one of Najran’s most important economic sectors. In 2011, the total crop area was estimated to be around 11,000 hectares, accounting for about 1.4 percent of the entire crops in the Kingdom. The FAO CROPWAT model, which adopts the Penman–Monteith method to estimate the evapotranspiration (ET0), was used to calculate the CRW according to [57].
To estimate the total irrigation requirements of the selected crops (potatoes, wheat, and tomatoes), the climate condition of the city of Najran was entered into CROPWAT software. This includes the planting and harvesting dates, and soil types.

4. The Selected Location, Resource Analysis, and Electrical Load Profile

4.1. Selected Location

The region of Najran lies in the south of Saudi Arabia and has more than 100 ancient sites. Najran has been a key link connecting the north, west, and Yemen throughout history. Geographically, it is located between 17 and 20 degrees north in latitude, and between 44 and 52 degrees east in longitudes (18.00° N, 45.40° E). The climate in this area includes dry winters with humid-subtropical (specified by the Köppen–Geiger climate classification system: “CWa” [58]) and receives a lot of sunlight all year. Even though it is likely that this district could use solar energy, it is difficult to find specific information about solar energy on flat and sloped surfaces.
The hybrid system’s performance and economic viability were investigated based on the actual weather conditions for the city of Najran. Figure 2 shows the specifically selected area of the study. Najran is considered one of the most modern cities. The entire population of the Najran region was 569,000 individuals in 2014, accounting for 1.85 percent of the Kingdom’s overall population of 30.8 million [56]. The majority of the Najran valley is made up of agricultural lands, which are mainly used for growing wheat, maize, palm, and acidic fruit crops. West Najran is surrounded by mountains and has several residential communities and agricultural farms, whereas East Najran is primarily desert [56]. In 2011, the overall agricultural area was estimated to be 11,000 hectares, accounting for about 1.4 percent of the total crops in the Kingdom, which totaled 788,000 hectares in the same year [56].

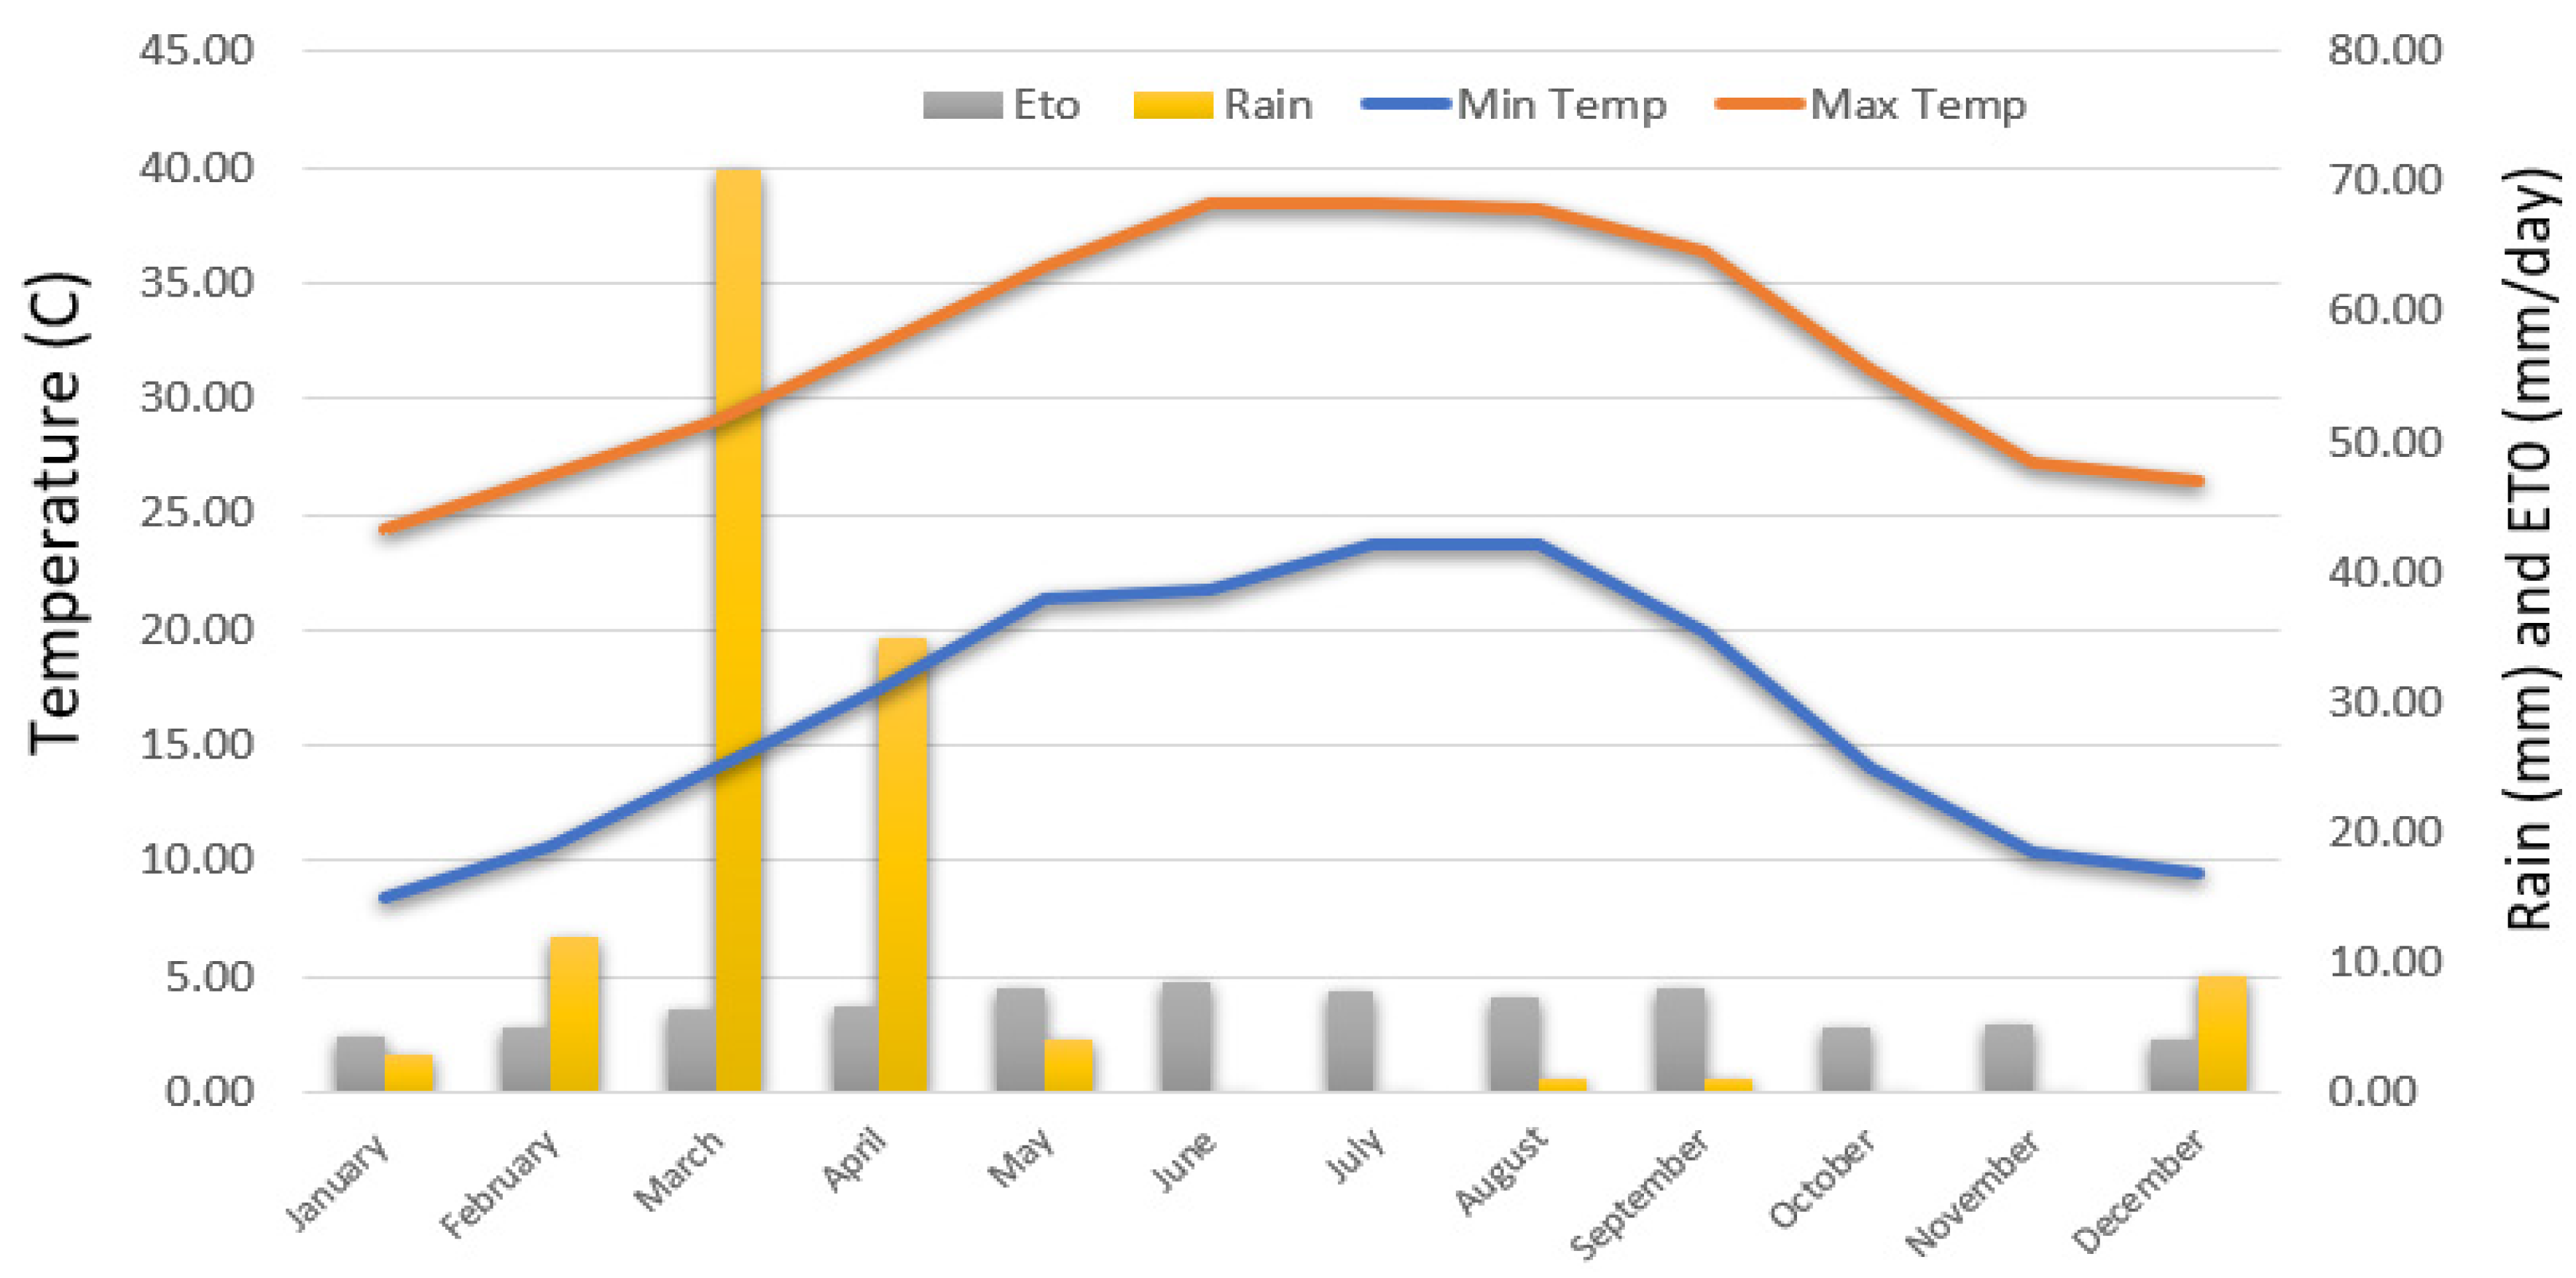
4.2. Resource Analysis

Table 2 shows the climate characteristics, rainfalls levels, and the average estimated ET0 for each month. The average yearly ET0 was estimated to be 6.55 mm.
Overall, the outdoor temperature and rainfall vary significantly throughout the year, as shown in Figure 3. Rainfall is at its peak during March and April. Throughout the summer, the city of Najran has a very high-temperature record that reaches its peak in August.
Figure 4 shows the probable distribution of wind speed at the selected location. To evaluate the available wind resource, a Weibull distribution analysis has been implemented. The x-axis in Figure 4 shows that the scale parameter represents wind speed in m/s, and the shape parameter is shown in the y-axis. A closer look at the figure illustrates that the wind speed ranged from 4 to 6 m/s most of the time during the year.

4.3. Electric Load Profile: A Case Study

To assess the potential value of the proposed hybrid energy system, an estimate of the hourly power demand for the selected community is established for a typical weather year. A MATLAB dynamic model was constructed based on the data in Table 1, Table 2 and Table 3 and Equations (1) and (2) to estimate residential buildings’ hourly electric load profiles.
Results show that the total annual energy demand for the community is 753,568 kWh, while the peak energy demand is 170 kW. Figure 5A demonstrates the daily pumping energy requirements along with the water flow rate needed for the farms. Figure 5B shows the total power demand for the community. A closer look at Figure 5B reveals that power demand spikes during summer due to higher outdoor temperatures.

4.4. Benchmark Comparison of the Developed Model

There are a few benchmarks for residential buildings’ energy intensities in Saudi Arabia. Thus, the energy consumption of the developed physics model of a residential building was compared against benchmark data reported by Krarti et al. [53]. Their study reported the yearly fluctuation in electricity use for residential building in Saudi Arabia. Annual electricity demand in four KSA regions was reported in terms of energy use intensity (EUI) and expressed in kWh m 2   year . Results show that the East Region of KSA has the highest EUI, reaching 182.4 kWh m 2   year . In addition, the southern region of Saudi Arabia has the lowest EUI with 125.6 kWh m 2   year . In this study, the benchmark results for the southern region reported in [46] was used to validate the developed model for residential buildings. Based on the physic-based model illustrated in Equations (1) and (2) and the defined building’s characteristics in Table 1, the EUI is 134 kWh m 2   year .

5. Result and Discussion

A typical meteorological condition for the city of Najran, Saudi, was used to evaluate the proposed hybrid system. Figure 6 shows a detailed description of the chosen renewable energy sources connected to the utility grid. Figure 6 also dictates the implemented procedure used to evaluate the hybrid system, divided into two main steps. The first step is estimating the selected community’s electric load profile. As mentioned previously, the community consists of residential buildings surrounded by farms. Thus, the total load profile represents the energy required for the residential and agriculture sector within the community. A MATLAB dynamic model was developed to estimate the hourly electric load profile for the residential buildings based on the information presented in Table 1 and Equations (1) and (2). It is critical to determine the CWR for irrigation energy requirements, which was accomplished using CROPWAT software. Based on the results obtained from CROPWAT, the pumping energy requirements to supply the farm with the required water were calculated. The second step was an optimization to determine the optimum size of the PV/wind system. The proposed hybrid system was simulated and optimized using HOMER Software. HOMER is an optimization software primarily used to enhance the size of various renewable energy systems based on net present value (NPC) and the COE. It has been widely used for optimization, and environmental and economic analysis [59].
Table 4 summarizes the physical and economic characteristics used in the simulation. It also shows the price list for each component.

5.1. Optimum Size

Combinations of the hybrid energy system, PV/WT, connected with the conventional power grid are the only energy sources to the community. The selected community can access the local grid power but might experience inconsistent electrical supply. Thus, this study aims to develop a hybrid energy system to provide the community with sustainable energy sources with access to the grid. The hybrid system is optimized to determine the proper component size, leading to a minimum renewable energy penetration of 50%. The electricity purchase and sell back rates in case of shortage or excess production are set at US $0.08/kWh and US $0.06/kWh, respectively (Table 5).

5.2. Energy Analysis for the Optimum Size

Figure 7 shows the monthly energy load for the community where the energy demand spikes during the summer due to the high outdoor temperatures. As a result of increasing energy demand during the summer months, the produced power from the PV/WT is not sufficient, which leads to an increase in the reliance on the power from the grid. From May to August, it is estimated that 51% of the electricity demand was purchased from the grid.
Figure 8A,B demonstrate the power output of the WT and PV panels simultaneously during the course of the year for 24 h a day. As shown, solar power is intermittent because the sun is not available at all hours of the day. The power output from the PV is available for about 11.8 h per day, and it fluctuates between 5 and 40 kW depending on the available solar resources. The WT gives more consistent energy during the day and operates at partial load during the off-peak hours. The proposed hybrid design in this study does not have energy storage systems. Thus, excess energy will be sold back to the grid at a rate of $0.06/kWh.

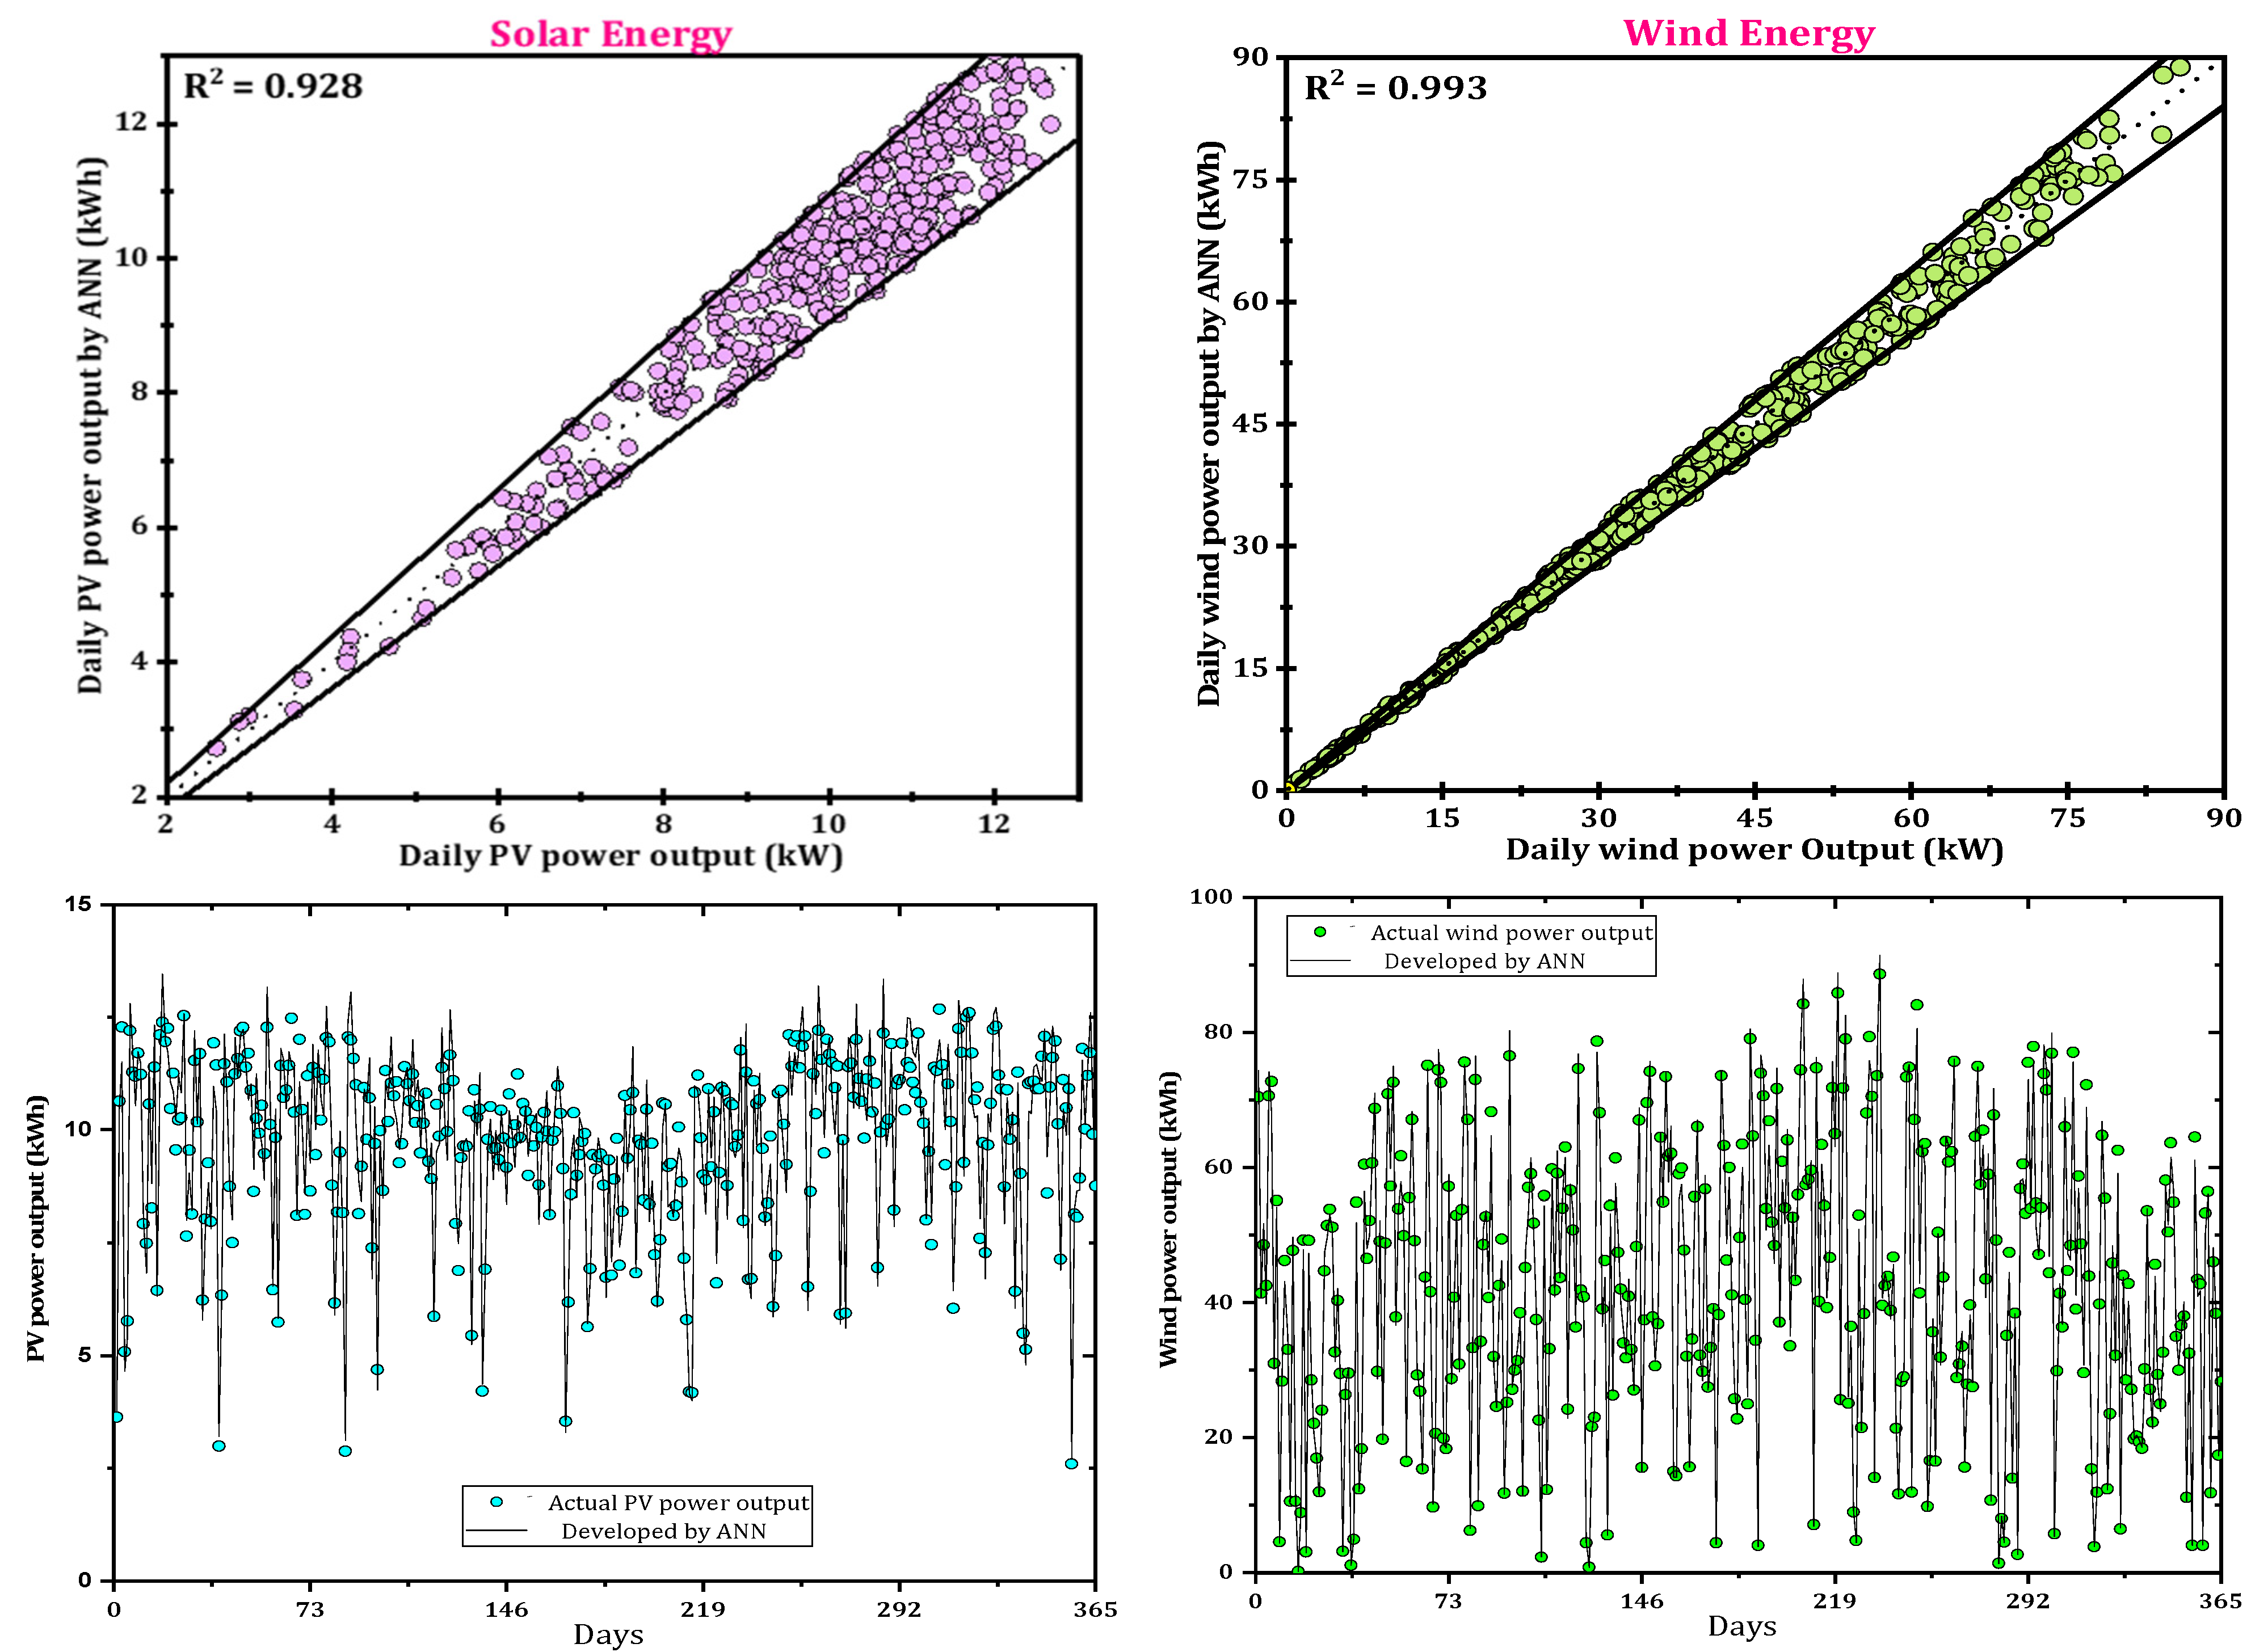
5.3. Artificial Neural Network Implementation

The essence of renewable energies is their temporal and geographical nationality. Renewable energies, such as solar and wind [61], experience extreme fluctuations that make them very difficult to analyze. Generally, similar to many studies in which data mining-based methods were used [62,63,64,65,66], the renewable energy is also predictable through this methodology [67]
To simulate renewable energy and its sensitivity to the location and the prevailing climate, its daily or hourly changes must be analyzed. By considering the hourly values shown in Figure 9, the average production power associated with wind and solar energies can be obtained. Then, a neural network is developed for it by creating input, middle, and output layers. In Figure 9, the correlations are depicted, and it is clear that the closer the data is to the bisector, the better the ANN results. In Figure 9 (bottom), the actual and predicted values of the power output for PV and wind energy are demonstrated. The number of fluctuations in wind energy is greater, but still, the neural network provides better results in estimating wind energy. It should be noted that although the error rate for some points in Figure 9 appears to be high, considering an annual analysis, the calculations show that the error for PV and wind energy is below 4%.
Figure 10 shows the amount of error due to the use of the neural network in estimating solar/wind energy. As expected, for this solar system, citizenship is much stronger than time, so the amount of predictive error is even greater.

5.4. Economic and Energy Analysis

An economic analysis of the proposed hybrid system was investigated at different renewable penetration (RP) values (Figure 11 (upper)). The COE at 75% RP was 13% higher than the non-renewable energy option. The computed COE was found to be more than the average cost of power provided by the local grid, which was estimated to be $0.08 kWh. The lowest COE of the PV/WT was $0.1053/kWh at an RP of 65%. The obtained COE at an RP of 65% was a turning point and could be considered the optimized value. Increasing the RP beyond 65% led to higher COE. This was attributed to high capital expenditures due to the oversized nature of the system. Previous studies have shown that the energy cost varies from 0.1 to 0.3 $/kWh [35,38].The simulated results from this study were compared to previous studies where the COE was $0.1053/kWh. In addition, conventional power plants relying on fossil fuels are the primary source of electricity in Saudi Arabia. Efforts have been made to shift to more sustainable energy sources to reduce the dependency on fossil fuels and lower greenhouse emissions [36,54]. Figure 11 (lower) depicts the amount of CO2 emissions in kg/year as a function of the total renewable penetration. It was estimated that increasing the renewable energy perpetration from 25% to 75% would reduce CO2 emissions by 47%. In addition, this figure shows the yearly imported and exported energy in kWh from the grid. Results showed that the grid’s annual energy purchases and sales at 75% penetration were 251,034 and 923,444 kWh, respectively.
The competitive economy of the proposed system would be greatly influenced by the capital and investment cost of the PV/WT system. Figure 12 shows the results of the sensitivity analysis, which explored the impact of the capital price of the PV/wind system on the COE $/kWh. The proposed hybrid system’s COE and the system’s cost details used in the simulation shown in Table 4 represent base case 1. In this case, the capital costs of PV and WT were 3463 $/kW and 5000 $/kW, respectively. Therefore, the COE for base case 1 was $0.1053/kWh. The economic feasibility of the proposed system is influenced by the investment and capital cost of purchasing solar energy, namely, PV and WT. At the current market price, the COE of the hybrid system is higher than the local grid price. In this figure, the impact of the capital and installation cost is explored. This analysis revealed that the proposed hybrid system would be economically viable if the cost of purchasing the system’s equipment was 20% less than the current market price.

6. Implications of the Proposed System

The COE of the proposed hybrid system is marginally higher than the local grid’s average cost, which is assumed to be 0.08 $/kWh. Currently, the average energy cost produced by renewable sources is not attractive from an economic standpoint to consumers due to the low energy prices generated by conventional power plants. For example, the energy price in Saudi Arabia between 1988 and 2014 was less than 50% of the global average [68]. However, the average cost of energy from renewable resources in Saudi Arabia from previous studies is in the range of 0.15 to 0.3 $/kWh [38]. This makes such systems economically unfeasible compared to the energy cost from local providers.
Reduced electricity prices are a result of Saudi government subsidies. Low energy costs stimulate increases in energy demand and inefficient use of energy. Additionally, they limit consumers from investing in energy efficiency and slow the transition to more sustainable energy. For example, energy incentives through government assistance are crucial for the agriculture sector, since it is essential to the production process and assists the agricultural region to thrive. However, cheap energy can potentially lead to wasteful use of energy resources [69], such as increased gas emissions, degradation of the environment, and an impediment to social initiatives [70]. Napoli et al. suggested that implicit and explicit incentives for the agricultural industry may not be sustainable in the long run [71].
Generally, increasing the cost of renewable energy is a barrier that prevents a smooth transition to a sustainable energy community, especially when the electricity price of a conventional power plant powered by fossil fuels is low. Therefore, the proposed hybrid system might not be appealing from an economic standpoint without the government’s financial support or reforming energy costs to align with the average international level. Fortunately, the Saudi government has implemented a domestic energy price reform to boost energy efficiency and gradually eliminate energy subsidies by 2025 [72]. In addition, the Saudi government’s proposed 2030 vision aims to diversify the country’s energy production, reduce the reliance on fossil fuels, and increase the use of natural gas and renewable energy to 50% [5]. With subsidies ending in the energy sector, and Saudi’s plan to diversify energy production in the near future, the proposed system discussed in this study might be attractive in the coming years.

7. Conclusions

Developing sustainable energy sources is a critical factor in improving the socio-economic situation of rural communities. In this study, an attempt was made to design a sustainable energy community, where community members can work collaboratively to fund a project and receive a share of their investment. As previously stated, the selected community is comprised of residential buildings surrounded by farms. Thus, the hybrid energy system proposed in this study aims to supply the community with clean energy to cover the demand in the residential and agriculture sectors.
A MATLAB dynamic model was developed to predict the hourly energy demand for residential buildings. The CWR for the selected crops defined in Table 3 was estimated using CROPWAT, and subsequently, the pumping energy needed to supply water to the community’s farm was determined. Based on the theoretical power demand estimation, HOMER software was used to optimize the size of the proposed hybrid PV/WT energy system. The objective of the optimization was to minimize the COE $/kWh supplied. Results of the study revealed that the COE of the proposed system is influenced by the renewable energy penetration and the capital investment cost. The optimized hybrid renewable energy system is capable of supplying reliable energy to a remote area in the southwest of KSA and could save more than 200 tons of greenhouse gases annually. In addition, the hybrid system was simulated with different renewable energy penetrations where the lowest COE was $0.1053/kWh at an RP of 65%. Therefore, the results from this simulation could potentially help motivate the selected community to become energy independent. PV and wind energy are time-dependent, especially for solar energy, which has a stronger function. The neural network can be useful for estimating both energies by establishing connections between neurons. The neural network R-square was 0.928 for PV and 0.993 for wind energy. This indicates that the neural network was more in tune with wind energy. The error rate in the annual analysis for PV and wind energy was less than 4%.
Aside from developing a sustainable energy system for a rural community, this study attempted to design an energy-efficient irrigation system. Farmers need access to technology at a competitive cost to reduce food waste and boost agriculture yields. This potential integration was created to enhance the overall energy efficiency and help reduce the reliance on fossil fuel as the main energy source. The results of this technology may also help farmers gain access to a sustainable source of energy that enables them to grow crops sustainably.
Future research might investigate the following:
(I) Perform experimental work to compare the outcomes with the theoretical results in this study.
(II) Study the possibility of designing net zero energy consumption for the selected community.
(III) Incorporate a biogas plant into the proposed study and study its economic and environmental impacts.
(IV) Investigate the economic impact of extending the service life of the project beyond 25 years.

Author Contributions

J.M. and F.A.A. performed the literature review, modelling, theoretical framework, and paper drafting. S.A. and M.S. performed an extensive analysis of the draft, developed the experiment framework, and developed the simulation models. J.M., F.A.A., S.A. and M.S. contributed to the critical revision of the work. All authors have read and agreed to the published version of the manuscript.

Funding

This research was funded by the Najran Region Research Program Funding program grant code (NU/NAR/SERC/11/1).

Institutional Review Board Statement

Not applicable.

Informed Consent Statement

Not applicable.

Data Availability Statement

Not applicable.

Acknowledgments

The authors are thankful to the Deanship of Scientific Research at Najran University for funding this work under the Najran Region Research Program Funding program grant code (NU/NAR/SERC/11/1).

Conflicts of Interest

The authors declare no conflict of interest.

Nomenclature

SymbolsName of SymbolsUnit
E . total Total electricity consumption kWh
E . HVAC HVAC energy consumption to control indoor temperaturekWh
T indoor Indoor temperatureC
T amb Outdoor temperatureC
Q gen Heat generated inside the housekWh
AFloor aream2
ACHAir change per hour1/h
  ρ a Air densitym3/kg
C a Specific heat of airkJ/kg-k
V House volumem3
UA Overall heat transfer coefficient W / K

References

  1. Welsby, D.; Price, J.; Pye, S.; Ekins, P. Unextractable fossil fuels in a 1.5 C world. Nature 2021, 597, 30–234. [Google Scholar] [CrossRef] [PubMed]
  2. Soummane, S.; Ghersi, F. Projecting Saudi sectoral electricity demand in 2030 using a computable general equilibrium model. Energy Strategy Rev. 2022, 39, 100787. [Google Scholar] [CrossRef]
  3. Vernay, A.-L.; Sebi, C. Energy communities and their ecosystems: A comparison of France and the Netherlands. Technol. Forecast. Soc. Chang. 2020, 158, 120123. [Google Scholar] [CrossRef]
  4. Lackney, J.A. Energy Smart Schools: Opportunities to Save Money, Save Energy and Improve Student Performance. In A Congressional Briefing to the US House of Representatives Committee on Science; the Environmental Energy Study Institute (EESI): Washington, DC, USA, 1999. [Google Scholar]
  5. Owusu, P.A.; Asumadu-Sarkodie, S. A review of renewable energy sources, sustainability issues and climate change mitigation. Cogent Eng. 2016, 3, 1167990. [Google Scholar] [CrossRef]
  6. Wang, H.; Hou, K.; Zhao, J.; Yu, X.; Jia, H.; Mu, Y. Planning-Oriented resilience assessment and enhancement of integrated electricity-gas system considering multi-type natural disasters. Appl. Energy 2022, 315, 118824. [Google Scholar] [CrossRef]
  7. Xu, X.; Niu, D.; Peng, L.; Zheng, S.; Qiu, J. Hierarchical multi-objective optimal planning model of active distribution network considering distributed generation and demand-side response. Sustain. Energy Technol. Assess. 2022, 53, 102438. [Google Scholar] [CrossRef]
  8. Li, B.; Li, C.; Zhang, Y.; Wang, Y.; Jia, D.; Yang, M. Grinding temperature and energy ratio coefficient in MQL grinding of high-temperature nickel-base alloy by using different vegetable oils as base oil. Chin. J. Aeronaut. 2016, 29, 1084–1095. [Google Scholar] [CrossRef] [Green Version]
  9. Li, H.; Hou, K.; Xu, X.; Jia, H.; Zhu, L.; Mu, Y. Probabilistic energy flow calculation for regional integrated energy system considering cross-system failures. Appl. Energy 2022, 308, 118326. [Google Scholar] [CrossRef]
  10. Zhao, F.; Song, L.; Peng, Z.; Yang, J.; Luan, G.; Chu, C.; Ding, J.; Feng, S.; Jing, Y.; Xie, Z. Night-time light remote sensing mapping: Construction and analysis of ethnic minority development index. Remote Sens. 2021, 13, 2129. [Google Scholar] [CrossRef]
  11. Kalbasi, R. Usefulness of PCM in building applications focusing on envelope heat exchange—Energy saving considering two scenarios. Sustain. Energy Technol. Assess. 2022, 50, 101848. [Google Scholar] [CrossRef]
  12. Kalbasi, R.; Afrand, M. Which one is more effective to add to building envelope: Phase change material, thermal insulation, or their combination to meet zero-carbon-ready buildings? J. Clean. Prod. 2022, 367, 133032. [Google Scholar] [CrossRef]
  13. Liu, W.; Kalbasi, R.; Afrand, M. Solutions for enhancement of energy and exergy efficiencies in air handling units. J. Clean. Prod. 2020, 257, 120565. [Google Scholar] [CrossRef]
  14. Said, Z.; Sundar, L.S.; Rezk, H.; Nassef, A.M.; Chakraborty, S.; Li, C. Thermophysical properties using ND/water nanofluids: An experimental study, ANFIS-based model and optimization. J. Mol. Liq. 2021, 330, 115659. [Google Scholar] [CrossRef]
  15. Said, Z.; Jamei, M.; Sundar, L.S.; Pandey, A.; Allouhi, A.; Li, C. Thermophysical properties of water, water and ethylene glycol mixture-based nanodiamond+ Fe3O4 hybrid nanofluids: An experimental assessment and application of data-driven approaches. J. Mol. Liq. 2022, 347, 117944. [Google Scholar] [CrossRef]
  16. Said, Z.; Cakmak, N.K.; Sharma, P.; Sundar, L.S.; Inayat, A.; Keklikcioglu, O.; Li, C. Synthesis, stability, density, viscosity of ethylene glycol-based ternary hybrid nanofluids: Experimental investigations and model-prediction using modern machine learning techniques. Powder Technol. 2022, 400, 117190. [Google Scholar] [CrossRef]
  17. Said, Z.; Arora, S.; Farooq, S.; Sundar, L.S.; Li, C.; Allouhi, A. Recent advances on improved optical, thermal, and radiative characteristics of plasmonic nanofluids: Academic insights and perspectives. Sol. Energy Mater. Sol. Cells 2022, 236, 111504. [Google Scholar] [CrossRef]
  18. Said, Z.; Ghodbane, M.; Boumeddane, B.; Tiwari, A.K.; Sundar, L.S.; Li, C.; Aslfattahi, N.; Bellos, E. Energy, exergy, economic and environmental (4E) analysis of a parabolic trough solar collector using MXene based silicone oil nanofluids. Sol. Energy Mater. Sol. Cells 2022, 239, 111633. [Google Scholar] [CrossRef]
  19. Ponmurugan, M.; Ravikumar, M.; Selvendran, R.; Medona, C.M.; Arunraja, K.M. A review on energy conserving materials for passive cooling in buildings. Mater. Today Proc. 2022, 64, 1689–1693. [Google Scholar] [CrossRef]
  20. Alqaed, S.; Mustafa, J.; Sharifpur, M. Annual energy analysis of a building equipped with CaCl2·6H2O as PCM and CaCl2·6H2O/CsxWO3 as nano PCM—Useless of adding nanoparticles. J. Build. Eng. 2022, 53, 104527. [Google Scholar] [CrossRef]
  21. Alqaed, S.; Mustafa, J.; Almehmadi, F.A. Design and energy requirements of a photovoltaic-thermal powered water desalination plant for the middle east. Int. J. Envir. Res. Public Health 2021, 18, 1001. [Google Scholar] [CrossRef] [PubMed]
  22. Mustafa, J.; Alqaed, S.; Almehmadi, F.A.; Jamil, B. Development and comparison of parametric models to predict global solar radiation: A case study for the southern region of Saudi Arabia. J. Therm. Anal. Calorim. 2022, 147, 9559–9589. [Google Scholar]
  23. Mustafa, J.; Alqaed, S.; Sharifpur, M. Evaluation of energy efficiency, visualized energy, and production of environmental pollutants of a solar flat plate collector containing hybrid nanofluid. Sustain. Energy Technol. Assess. 2022, 53, 102399. [Google Scholar] [CrossRef]
  24. Mustafa, J.; Alqaed, S.; Aybar, H.Ş.; Husain, S. Investigation of the effect of twisted tape turbulators on thermal-hydraulic behavior of parabolic solar collector with polymer hybrid nanofluid and exergy analysis using numerical method and ANN. Eng. Anal. Bound. Elem. 2022, 144, 81–93. [Google Scholar] [CrossRef]
  25. Mustafa, J.; Alqaed, S.; Sharifpur, M.; Alharthi, M.A. Combined simulation of molecular dynamics and computational fluid dynamics to predict the properties of a nanofluid flowing inside a micro-heatsink by modeling a radiator with holes on its fins. J. Mol. Liq. 2022, 362, 119727. [Google Scholar] [CrossRef]
  26. Pan, W.-T.; Zhuang, M.-E.; Zhou, Y.-Y.; Yang, J.-J. Research on sustainable development and efficiency of China’s E-Agriculture based on a data envelopment analysis-Malmquist model. Technol. Forecast. Soc. Change 2021, 162, 120298. [Google Scholar] [CrossRef]
  27. Xu, L.; Liu, X.; Tong, D.; Liu, Z.; Yin, L.; Zheng, W. Forecasting Urban Land Use Change Based on Cellular Automata and the PLUS Model. Land 2022, 11, 652. [Google Scholar] [CrossRef]
  28. Zhao, F.; Zhang, S.; Du, Q.; Ding, J.; Luan, G.; Xie, Z. Assessment of the sustainable development of rural minority settlements based on multidimensional data and geographical detector method: A case study in Dehong, China. Socio-Econ. Plan. Sci. 2021, 78, 101066. [Google Scholar] [CrossRef]
  29. Alqaed, S.; Mustafa, J.; Hallinan, K.P.; Elhashmi, R. Hybrid CHP/geothermal borehole system for multi-family building in heating dominated climates. Sustainability 2020, 12, 7772. [Google Scholar] [CrossRef]
  30. Alqaed, S.; Mustafa, J.; Sharifpur, M.; Alharthi, M.A. Numerical simulation and artificial neural network modeling of exergy and energy of parabolic trough solar collectors equipped with innovative turbulators containing hybrid nanofluids. J. Therm. Anal. Calorim. 2022, 1–16. [Google Scholar] [CrossRef]
  31. Nyeche, E.; Diemuodeke, E. Modelling and optimisation of a hybrid PV-wind turbine-pumped hydro storage energy system for mini-grid application in coastline communities. J. Clean. Prod. 2020, 250, 119578. [Google Scholar] [CrossRef]
  32. Pal, A.; Bhattacharjee, S. Effectuation of biogas based hybrid energy system for cost-effective decentralized application in small rural community. Energy 2020, 203, 117819. [Google Scholar] [CrossRef]
  33. Chowdhury, T.; Chowdhury, H.; Miskat, M.I.; Chowdhury, P.; Sait, S.M.; Thirugnanasambandam, M.; Saidur, R. Developing and evaluating a stand-alone hybrid energy system for Rohingya refugee community in Bangladesh. Energy 2020, 191, 116568. [Google Scholar] [CrossRef]
  34. Krarti, M.; Dubey, K.; Howarth, N. Evaluation of building energy efficiency investment options for the Kingdom of Saudi Arabia. Energy 2017, 134, 595–610. [Google Scholar] [CrossRef]
  35. Al-Sharafi, A.; Sahin, A.Z.; Ayar, T.; Yilbas, B.S. Techno-economic analysis and optimization of solar and wind energy systems for power generation and hydrogen production in Saudi Arabia. Renew. Sustain. Energy Rev. 2017, 69, 33–49. [Google Scholar] [CrossRef]
  36. Alharthi, Y.Z.; Siddiki, M.K.; Chaudhry, G.M. Resource assessment and techno-economic analysis of a grid-connected solar PV-wind hybrid system for different locations in Saudi Arabia. Sustainability 2018, 10, 3690. [Google Scholar] [CrossRef] [Green Version]
  37. Baseer, M.; Alqahtani, A.; Rehman, S. Techno-economic design and evaluation of hybrid energy systems for residential communities: Case study of Jubail industrial city. J. Clean. Prod. 2019, 237, 117806. [Google Scholar] [CrossRef]
  38. Rehman, S.; Alam, M.M.; Meyer, J.P.; Al-Hadhrami, L.M. Feasibility study of a wind–pv–diesel hybrid power system for a village. Renew. Energy 2012, 38, 258–268. [Google Scholar] [CrossRef] [Green Version]
  39. Almehmadi, F.; Aljabr, A. Investigate the Potential Peak Energy Reduction of Integrated M-Cycle Evaporative Cooling with HVAC in Hot and Dry Climate. In ASME International Mechanical Engineering Congress and Exposition; American Society of Mechanical Engineers: New York, NY, USA, 2019; Volume 59438, p. V006T06A042. [Google Scholar]
  40. Hassan, W.; Kamran, F. A hybrid PV/utility powered irrigation water pumping system for rural agricultural areas. Cogent Eng. 2018, 5, 1466383. [Google Scholar] [CrossRef]
  41. Ssenyimba, S.; Kiggundu, N.; Banadda, N. Designing a solar and wind hybrid system for small-scale irrigation: A case study for Kalangala district in Uganda. Energy Sustain. Soc. 2020, 10, 6. [Google Scholar] [CrossRef]
  42. Li, D.; Zhu, D.; Wang, R.; Ge, M.; Wu, S.; Cai, Y. Sizing optimization and experimental verification of a hybrid generation water pumping system in a greenhouse. Math. Probl. Eng. 2020, 2020, 3194196. [Google Scholar] [CrossRef]
  43. Ouachani, I.; Rabhi, A.; Yahyaoui, I.; Tidhaf, B.; Tadeo, T.F. Renewable energy management algorithm for a water pumping system. Energy Procedia 2017, 111, 1030–1039. [Google Scholar] [CrossRef]
  44. Emmanouil, S.; Philhower, J.; Macdonald, S.; Khadim, F.K.; Yang, M.; Atsbeha, E.; Nagireddy, H.; Roach, N.; Holzer, E.; Anagnostou, E.N. A comprehensive approach to the design of a renewable energy microgrid for rural Ethiopia: The technical and social perspectives. Sustainability 2021, 13, 3974. [Google Scholar] [CrossRef]
  45. Ahmed, N.M.; Farghally, H.M.; Fahmy, F.H. Optimal sizing and economical analysis of PV-wind hybrid power system for water irrigation using genetic algorithm. Int. J. Electr. Comput. Eng. 2017, 7, 1797. [Google Scholar] [CrossRef]
  46. Kong, K.G.H.; How, B.S.; Teng, S.Y.; Leong, W.D.; Foo, D.C.; Tan, R.R.; Sunarso, J. Towards data-driven process integration for renewable energy planning. Curr. Opin. Chem. Eng. 2021, 31, 100665. [Google Scholar] [CrossRef]
  47. Li, Q.; Meng, Q.; Cai, J.; Yoshino, H.; Mochida, A. Applying support vector machine to predict hourly cooling load in the building. Appl. Energy 2009, 86, 2249–2256. [Google Scholar] [CrossRef]
  48. Vaghefi, S.A.; Jafari, M.A.; Zhu, J.; Brouwer, J.; Lu, Y. A hybrid physics-based and data driven approach to optimal control of building cooling/heating systems. IEEE Trans. Autom. Sci. Eng. 2014, 13, 600–610. [Google Scholar] [CrossRef] [Green Version]
  49. Zhou, Y.; Zheng, S.; Zhang, G. Machine-learning based study on the on-site renewable electrical performance of an optimal hybrid PCMs integrated renewable system with high-level parameters’ uncertainties. Renew. Energy 2020, 151, 403–418. [Google Scholar]
  50. Hou, Q.; Du, E.; Zhang, N.; Kang, C. Impact of high renewable penetration on the power system operation mode: A data-driven approach. IEEE Trans. Power Syst. 2019, 35, 731–741. [Google Scholar] [CrossRef]
  51. A KSA Power Consumption 3 Times World Average | Arab News. Available online: https://www.arabnews.com/news/598481 (accessed on 1 September 2022).
  52. Capuano, L. International Energy Outlook 2018 (IEO2018); US Energy Information Administration (EIA): Washington, DC, USA, 2018; Volume 2018, p. 21. [Google Scholar]
  53. Krarti, M.; Aldubyan, M.; Williams, E. Residential building stock model for evaluating energy retrofit programs in Saudi Arabia. Energy 2020, 195, 116980. [Google Scholar] [CrossRef]
  54. Almehmadi, F.A.; Najib, A.; Ali, E.; Al-Ansary, H.; Orfi, J. Sustainable Approach of Generating Water and Energy: Techno-Economic Analysis of a Hybrid Solar Photoactive Thermal System Coupled with Direct Contact Membrane Distillation for Water Purification and Electricity Generation. Appl. Sci. 2022, 12, 9137. [Google Scholar] [CrossRef]
  55. Anstalt, S.V. Food and Agriculture Organization of the United Nations. 2013. Available online: https://www.fao.org/home/en (accessed on 1 September 2022).
  56. Najran City Profile | UN-Habitat. Available online: https://unhabitat.org/najran-city-profile (accessed on 14 July 2021).
  57. Smith, M. CROPWAT: A Computer Program for Irrigation Planning and Management; Food & Agriculture Org.: Rome, Italy, 1992. [Google Scholar]
  58. Kottek, M.; Grieser, J.; Beck, C.; Rudolf, B.; Rubel, F. World map of the Köppen-Geiger climate classification updated. Meteorol. Z. 2006, 15, 259–263. [Google Scholar] [CrossRef]
  59. About HOMER Energy LLC—Creators of Hybrid Renewable Microgrid System Design Software. Available online: https://www.homerenergy.com/company/index.html (accessed on 15 July 2021).
  60. Distributed Generation Renewable Energy Estimate of Costs. Available online: https://www.nrel.gov/analysis/tech-lcoe-re-cost-est.html (accessed on 2 July 2021).
  61. Xu, X.; Niu, D.; Xiao, B.; Guo, X.; Zhang, L.; Wang, K. Policy analysis for grid parity of wind power generation in China. Energy Policy 2020, 138, 111225. [Google Scholar] [CrossRef]
  62. Zhang, Y.; Shi, X.; Zhang, H.; Cao, Y.; Terzija, V. Review on deep learning applications in frequency analysis and control of modern power system. Int. J. Electr. Power Energy Syst. 2022, 136, 107744. [Google Scholar] [CrossRef]
  63. Zheng, W.; Liu, X.; Yin, L. Research on image classification method based on improved multi-scale relational network. PeerJ Comput. Sci. 2021, 7, e613. [Google Scholar] [CrossRef] [PubMed]
  64. Jia, T.; Cai, C.; Li, X.; Luo, X.; Zhang, Y.; Yu, X. Dynamical community detection and spatiotemporal analysis in multilayer spatial interaction networks using trajectory data. Int. J. Geogr. Inf. Sci. 2022, 36, 1–22. [Google Scholar] [CrossRef]
  65. Li, S.; Liu, C.H.; Lin, Q.; Wen, Q.; Su, L.; Huang, G.; Ding, Z. Deep residual correction network for partial domain adaptation. IEEE Trans. Pattern Anal. Mach. Intell. 2020, 43, 2329–2344. [Google Scholar] [CrossRef] [Green Version]
  66. Ma, Z.; Zheng, W.; Chen, X.; Yin, L. Joint embedding VQA model based on dynamic word vector. PeerJ Comput. Sci. 2021, 7, e353. [Google Scholar] [CrossRef]
  67. Abidi, A.; Khdair, A.I.; Kalbasi, R. Using ANN techniques to forecast thermal performance of a vacuum tube solar collector filled with SiO2/EG-water nanofluid. J. Taiwan Inst. Chem. Eng. 2021, 128, 301–313. [Google Scholar] [CrossRef]
  68. Brown, J.J.; Das, P.; Al-Saidi, M. Sustainable agriculture in the Arabian/Persian Gulf region utilizing marginal water resources: Making the best of a bad situation. Sustainability 2018, 10, 1364. [Google Scholar] [CrossRef] [Green Version]
  69. Mehrara, M. Energy consumption and economic growth: The case of oil exporting countries. Energy Policy 2007, 35, 2939–2945. [Google Scholar] [CrossRef]
  70. Badiani, R.; Jessoe, K.K.; Plant, S. Development and the environment: The implications of agricultural electricity subsidies in India. J. Environ. Dev. 2012, 21, 244–262. [Google Scholar] [CrossRef]
  71. Napoli, C.; García-Téllez, B. Energy for Water in Agriculture: A Partial Factor Productivity Analysis; King Abdullah Petroleum Studies and Research Center (KAPSARC): Riyadh, Saudi Arabia, 2016. [Google Scholar]
  72. Hasanov, F.J. Electricity incentives for agriculture in Saudi Arabia. Is that relevant to remove them? Energy Policy 2020, 144, 111589. [Google Scholar] [CrossRef]
Figure 1. Block diagram of the proposed system; subsystems include the power field, irrigation pumps, residential buildings, and farm.
Sustainability 14 13792 g001
Figure 2. Google image of the city of Najran along with the selected community area.
Sustainability 14 13792 g002
Figure 3. Monthly average outdoor temperature, rain rate, and evapotranspiration data for Najran city.
Sustainability 14 13792 g003
Figure 4. Weibull distribution for wind speed.
Sustainability 14 13792 g004
Figure 5. Pumping energy requirements for irrigation (A), and the estimated total electric load profile for a rural community (B).
Sustainability 14 13792 g005
Figure 6. Flowchart procedures of the simulation.
Sustainability 14 13792 g006
Figure 7. Monthly power generation of the PV/wind system, load demand, and exported and imported grid power to the community.
Sustainability 14 13792 g007
Figure 8. Power generation of the hybrid PV/wind system.
Sustainability 14 13792 g008
Figure 9. Correlation between numerical results and neural network for solar and wind energy.
Sustainability 14 13792 g009
Figure 10. Error distribution owing to the use of ANN for PV and wind.
Sustainability 14 13792 g010
Figure 11. Net present value (NPC) and the cost of energy at different renewable penetration values (upper), and yearly CO2 emissions, grid purchases, and sales at different renewable penetration values of the proposed system (lower).
Sustainability 14 13792 g011
Figure 12. The sensitivity of varying PV/WT capital and installation cost on the cost of energy.
Sustainability 14 13792 g012
Table 1. Geometrical and energy characteristics of a typical house [53].
FeaturesValue
Number of floors in each building2
Total floor area232 m 2
Total window area15% of the wall area
Power density for lighting4 W/ m 2
U Wall   0.34 W/ m 2 K
U Roof   0.2 W/ m 2 K
Thermostat settingT = 24 °C
Electric plug load3.5 W/ m 2
Number of occupants per apartment6
Energy efficient ratio EER8.5
Domestic hot water11 L/person/day
Table 2. Climate and evapotranspiration (ET0) data of Najran, Saudi Arabia [55].
MonthMin TempMax TempHumidityWindSunRadEto
°C°C%km/DayhoursMJ/m2/Daymm/Day
January8.4024.4037.00216.007.5016.604.35
February10.6026.7037.00216.008.3019.304.96
March14.0029.0029.00259.008.7021.706.35
April17.5032.3033.00216.009.0023.206.56
May21.4035.7017.00259.007.0020.407.97
June21.8038.5014.00259.008.0021.708.57
July23.7038.5013.00216.006.5019.507.72
August23.7038.2025.00216.006.4019.207.36
September19.9036.4016.00259.007.7020.508.09
October14.0031.3019.00130.008.1019.405.10
November10.4027.3028.00216.008.6018.405.16
December9.5026.5038.00173.007.0015.404.04
Average16.8532.5724.36223.827.8019.996.56
Table 3. A detailed description of the selected community.
Location
Najran city-
Latitude17.5656° N
Longitude44.2289° E
Residential Buildings
Total floor area (m2)5000
Estimated number of apartments 20
Community Farms
Total area (m2)10,000
Irrigation water requirements (m3/season)9910
Crops
PotatoesPlanted January 1, harvested May 9
TomatoesPlanted April 2, harvested August 23
WheatPlanted January 1, harvested May 5
Table 4. The hybrid system’s cost details used in the simulation.
ComponentsParametersValueRef
PVCapacity1 (kw)-
Capital and installed cost3463 ($/kW)[60]
Replacements3463 ($/kW)-
O&M200 ($/year)-
Lifetime25 (years)-
Wind TurbineCapital5000 ($/kw)[60]
Replacements5000 ($/kw)-
O&M1200 ($/year)-
Lifetime
System ConverterCapital300 ($/kW)[37]
Replacements300 ($/kW)
Table 5. Optimum sizing and cost summary of the proposed system.
ComponentParametersValue
PVRated capacity44.3 kW
Total production 85,437 kWh
PV penetration11.4%
Levelized cost 0.142 $/kWh
Hours of operation4319 h
Wind TurbineRated capacity100 kW
Total production370,360 kWh
Wind penetration49.3%
Levelized cost 0.121 $/kWh
Hours of operation7252 h
Grid PowerPurchases337,121 kWh
Sales94,883 kWh
System ConverterCapacity169 kW
CostTotal NPC1,133,324
Levelized cost0.105 $/kWh
Operating cost32,503.37
Publisher’s Note: MDPI stays neutral with regard to jurisdictional claims in published maps and institutional affiliations.

