Article

The Process of Digitalization of the Urban Environment for the Development of Sustainable and Circular Cities: A Case Study of Bologna, Italy

Department of Architecture, University of Bologna, 40136 Bologna, Italy
*
Author to whom correspondence should be addressed.
Sustainability 2022, 14(21), 13740; https://doi.org/10.3390/su142113740
Submission received: 15 September 2022 / Revised: 3 October 2022 / Accepted: 4 October 2022 / Published: 24 October 2022

Abstract

:
The residential heritage that was built during the great expansion of real estate after the Second World War has severe deficiencies in structural safety, fire resistance, energy efficiency, and accessibility and these cannot be solved with sustainable renovation measures. This study focuses on replacement interventions and promotes a management model that addresses three areas (technical, social, and economic) and it refers to the application of the circularity principle to the construction sector for the goal of climate neutrality by 2050. The final objective is to define a protocol—namely, the guidelines—to reference in a decision-making process that promotes urban regeneration by comparing demolition with reconstruction and renovation. The proposed methodology allows for the determination of suitable areas in Bologna for replacement and the joining of the municipal geodatabase with data from archival research on building permits in 1949–1965 by using GIS software. This digital archive can be implemented in a digital twin for an urban block, which can become a predictive tool for urban planning and the management of the whole life of a building. The main result is the characterization of urban blocks by identifying typical features belonging to specific building libraries that are validated with density analyses. These urban clusters and building archetypes can be used to assess targeted intervention measures by using specific tools, such as predictive maps and 3D city models.

1. Introduction

Reports and surveys on climate change have highlighted the predominant role of the atmospheric concentration of greenhouse gases (GHGs), especially CO2, as they are mainly responsible for climate-altering action and increases in temperature [1]. This negatively affects the loss of biodiversity and, thus, food production, as well as alterations in other planetary limits, on which the Earth’s equilibrium depends [2,3].
The second-to-last IPCC report [4] categorized GHG emissions by economic sector (electricity and heat production, AFOLU, buildings, transport, industry, and other energy) and distinguished direct from indirect emissions. Direct emissions are related to the combustion of gases and fuels that are used by a sector (i.e., gas for heating or domestic hot water production, fuel for transports) or attributable to that sector (emissions from livestock farming, agricultural production, fertilizer use) [5]. Indirect emissions are produced by one sector but used in other sectors than those in which they are produced [5]. In order to get an overall and ‘true’ indication of each sector’s impact, it is appropriate to add up direct and indirect emissions: the construction sector has risen to third place (18.4%), right after AFOLU (agriculture, forestry, and other land use, 24.87%) and industry (33%) [4]. According to the most recent prospects (2019) on the world’s GHG emissions by sector, which were developed by Climate Watch [6] and elaborated by the World Resources Institute [7], the total amount of GHG emissions was 49.8 GtCO2e and the most relevant sectors (considering both direct and indirect emissions) were industry (31%), AFOLU (23.7%), and buildings (18%). Even though there could be slight variations depending on the methodology used for the calculations, these figures reflect that the global impact did not significantly change from 2010 to 2019.
The present research focuses on studying the environmental impact on urban areas and the construction sector in terms of emissions.
In 2018, 55% of the world’s population lived in urban areas [8], which occupy a small part of the Earth’s surface (1–3%) and are responsible for the majority of GHG emissions, natural resource consumption, and waste generation. By 2050, cities are expected to have a major impact in terms of natural resource consumption, waste production, and GHG emissions [9]. A study on 167 cities worldwide highlighted that only 15% of the cities (namely, 25 cities located in Asia, Europe, Japan, Russia, and Turkey) are responsible for 52% of the total GHG emissions [10]. This is significant as it points out that if a few cities invest in reducing their impacts, there would be a relevant advantage. Another study [11] on cities of the C40 cities network (in 2020) [12] found out that the majority of emissions are indirect, so they do not depend on the transportation and production of goods directly in a city, but rather on things that are produced elsewhere and imported into a city to be consumed. More specifically, according to the consumption-based model, the total impacts of the C40 cities resulted in 4.5 GtCO2e, which was 55% higher than the production-based impact (2.9 GtCO2e). This provides a valuable basis for reflection on the relevance of consumption rather than production in urban areas and for targeted action to reduce the impacts.
Buildings are responsible for 40% of the EU’s total energy and 36% of the GHG emissions for energy, such as in the use and operational phases. However, if we consider the whole life cycle and the embodied carbon stored in buildings, an increase of 10% is estimated [13].
These facts inform us of the relevance and impact of the built environment in the process of ecological transition. Over recent decades, plans and programs have set ambitious targets for emission reductions, such as, at the European level, “A Renovation Wave for Europe” (2020) [14], the revision of the European directives on energy performance and renewable energy sources (2019–2021) [15] and “A New Circular Economy Action Plan” (2020) [16]; all of these are implementation tools for the EU Green Deal [12] in order to achieve the target of “zero emissions by 2050”.
The strategy of the European Union for existing building stock aims at reducing impacts through a vision of deep interrelation between the areas involved in the construction sector: energy, resources, and materials [17]. The new CEAP (Circular Economy Action Plan) proposes the introduction of reference limit values, such as for the carbon footprints of materials in buildings, and the application of mandatory tools for assessing building sustainability. It also acknowledges the relevant role of the digitization of the built environment in the pursuit of sustainability goals. It makes explicit the urgency of updating existing legislation on construction and demolition waste and excavation soils together with the inclusion of targets for the use of secondary raw materials [17].
Interventions in the existing building stock need to be supported by circular design strategies, the integration of life-cycle thinking, the minimization of energy consumption, and the use of only renewable energy sources. In “Circular Economy-Principles for Building Design” [18], a new model of sustainable design was proposed; it was aimed at improving material efficiency and circularity in the life cycle by pursuing three main objectives: waste utilization, resource optimization, and reduction in environmental impacts throughout the life cycle through increased attention on design and material choice. The LCA (Life Cycle Assessment or Life Cycle Analysis) methodology is a valuable tool to assess the energy–environmental performance of a construction product and a building by producing comparative scenarios and interpreting results with a critical eye. For instance, it is demonstrated that in existing buildings, the most significant contributing factor is related to the operational carbon associated with the use phase. Contrarily, in new, energy-efficient buildings, the embodied carbon becomes the most significant contributing factor, accounting for 40–70% of total emissions. As such, the future trend for the building stock will be characterized by a progressive increase in energy-efficient buildings, with the greatest impact on materials [19]. It is, thus, crucial to identify benchmarks, targets, and environmental performance categories defining environmental performance requirements for buildings, which take into account not only energy consumption in the operation of buildings but also the entire life cycle and the share of reused and reusable materials, aiming to 100% circular buildings and 100% renewable energy supply.
Despite the ongoing discussions around strategies and targets, finding the appropriate tools for achieving the mentioned objectives, numerous difficulties are to be faced. In 2021, ENEA (Italian National Agency for New Technologies, Energy and Sustainable Economic Development—Agenzia nazionale per le nuove tecnologie, l’energia e lo sviluppo economico sostenibile), outlined, in its latest report, the recovering rates for existing buildings necessary to ensure that the reduction targets are achieved and highlighted that these are far from the actual rates, e.g., the last rate, registered in the previous period, is much lower that the necessary one [20]. This shows that, so far, the current conditions have not allowed us to achieve the targets in a very short period of time.
At the European level, 11% of existing buildings, every year, show interest in energy refurbishment interventions. It is worth mentioning also that throughout Europe, the current rate for deep renovations stands only at 0.2% [14], following the current reduction target (−60% GHG emissions in the building stock). In Italy, the Annex to the Ministerial Decree of 11 October 2017 (Minimum Environmental Criteria for the awarding of design services and works for the new construction, renovation and maintenance of public buildings, Criteri ambientali minimi per l’affidamento di servizi di progettazione e lavori per la nuova costruzione, ristrutturazione e manutenzione di edifici pubblici) [21] defines the minimum environmental criteria for construction materials, i.e., environmental performance characteristics to follow during all phases of tendering procedures, aiming to improve the environmental impact of the intervention. However, the proposed minimum values are still far from the 100% circular building goal.
The present contribution describes, in detail, a methodology having, as the final objective, the identification of the decision support tools for administrations and professionals to be used during the preliminary phases, in an effort to facilitate the application of specific strategies on the existing building stock in accordance with the realization of the 2050 zero-emission target. These strategies shall be based on specific and detailed georeferenced knowledge of the existing building stock. Numerous studies have recently investigated the GIS-based methodologies, aiming to characterize the existing building stock to measure its impact in terms of energy and GHG emissions in the life cycle. As such, through the elaboration of georeferenced databases and the creation of conceptual energy building models, it is, thus, possible to estimate the energy demand profiles, e.g., in Milan (Italy), and to then map these results on the territory in an effort to support energy planning [22,23]. Additionally, a methodology to integrate large-scale LCA was conducted on Esch-Sur-Alzette (Luxemburg) existing building stock in GIS software: it allowed for the production of thematic mapping and directly linked the information about the impact (GHG emissions) on the territory [24]. In this case, the identification of renovation scenarios with defined time intervals and rate of interventions allowed for the evaluation of the benefit of GHG emission reduction and compare these results with the EU target. Another study, developed for Helsinki (Finland), created the “Helsinki’s Energy and Climate Atlas” [25,26], which is a 3D-city model with three 3D simulations based on three different scenarios, including predictions on GHG emission reductions by 2050. This research is based on the organization of building libraries (with construction, use, and energy information) that have been linked to the buildings in the 3D-city model so that simulation results can be directly viewed in the virtual city. All the mentioned studies are relevant for the present research as they set out a methodology, including data and results, valuable to measure the buildings’ impact in georeferenced maps that can be directly viewed on the territory and used as decision-support tools by public administrations and professionals.

2. Materials and Methods

In this study, the “Reconstruction for Regeneration” (R4R) paradigm is intended as a long-term strategy applied to the existing building stock, promoting urban regeneration and ecological transition. Additionally, it proposes urban renewal plans and programs to favor sustainable planning by integrating environmental impacts and large-scale LCA through the opportunities offered by digitization tools. R4R is addressed to the first urban peripheries and can potentially extend not only to a European but also to a global level. It promotes more radical interventions beyond standard energy refurbishments, i.e., the application of insulating envelopes, high-performance windows and doors, and advanced plant systems. This paradigm supports the demolition, including the reconstruction of the unlisted residential building stock in Italian cities, mainly built during the period of maximum expansion, i.e., between the first and second half of the 20th century. These buildings are at the end of their service life and have structural and energy deficiencies belonging to a building method that represents that specific epoch and appears over time. These criticalities are hard to recover and the interventions proposed in the renovation–recovery–renewal scenarios are often unsustainable according to a cost–benefit analysis from an economic point of view and for engineering optimization. As such, the following section will provide further details about the R4R paradigm, focused on replacement approach and applied to the residential built heritage located in the first peripheries of Bologna (Italy). The said paradigm, on the one hand, does meet the demanding and performance framework in accordance with the regulatory requirements set by the relevant European legislation and, on the other hand, favors further changes.
The present contribution is situated in the framework of a broader research project aiming to create an innovative model of the entire building process associated with the circular economy principles and based on the “Reconstruction for Regeneration” (R4R) paradigm applied to the residential building stock of first urban peripheries. The model is then related to a design proposal, e.g., a housing unit prototype, representing the practical application to a real context and, thus, the final step in the process. The model is developed in the technical, social, and economic areas, as it proposes an integrated intervention that considers not only technical issues (materials, construction solutions, etc.) but also analyzes its social impact and economic feasibility.
The study herein presented addresses the methodological aspects involved in the process of the model’s formalization and focuses on the definition of the solid knowledge base about the building stock that shall be used for developing the decision-support tools, such as the predictive environmental impact maps in GIS software.
Additionally, the method is divided into four phases: (2.1) creation of a knowledge base of the residential building stock in Bologna, constructed in 1946–70, (2.2) digital implementation of the data collected in the previous stage, through GIS software (ArcGIS by Esri) and urban fabrics characterization, (2.3) validation of the procedure for urban fabrics characterization, and (2.4) identification of decision-support tools for the intervention strategies in urban areas.

2.1. Creation of a Knowledge Base for the Residential Building Stock in Bologna

The first phase of the described method focuses on the creation of a knowledge base of the residential stock in Bologna (Italy), built between the first and second half of the 20th century, including the first peripheries of the city, which are characterized by a high number of dwellings and buildings, relevant density values, and non-compliance with the current requirements in terms of structural safety and energy efficiency. Moreover, it has the most significant transformative potential in terms of impact on the urban territory and feasibility of replacement intervention.
Within this context, it is worth mentioning the CRESME report [27] on the consistency of the built heritage in relation to construction epochs and territorial context, and the data provided by ISTAT relative to the last population and housing census on the national territory, focusing on the Municipality of Bologna [28,29]. The analysis of this data leads to the following considerations:
In Italy, it is registered diffused and small-scale housing, where the highest number of dwellings is located in multi-family buildings in urban areas;
The residential stock in Bologna is divided almost equally into two chronological periods: prior to 1945 and between 1946 and 1970. Indeed, 43% of the existing buildings were constructed in 1946–70, 42% in previous epochs, and 15% in later ones. However, on a national level, 30.8% of the existing residential buildings were constructed between 1946 and 1970, thus, more than 3.7 million buildings, 25.9% in previous epochs and 43.4% from 1971 to 2011.
It is, thus, uncontested that half of the multi-family buildings in the cities is located in the historic centers and was built before 1945 and the other half, in the first suburbs, was built between 1946 and 1970 in response to increases in population given the progressive consolidation of a state of prosperity due to economic recovery and increasing industrialization processes after World War II.
These considerations, developed in light of statistical data and report consultation, constitute a valuable support in the choice of the reference period, e.g., 1946–70. Indeed, the buildings constructed during this period of time represent the majority of the existing stock that does not meet the current regulatory standards established for structural safety, energy efficiency, and fire resistance. As such, they are the ideal buildings for the R4R paradigm’s investigation.

2.1.1. Archival Research

Extensive archival and documentary research was conducted as statistical data are not reliable and precise enough to develop the knowledge base. As such, two main strands were followed:
Consultation of maps and aerial photographs of Bologna in the period 1919–1971 to qualitatively reconstruct its expansion by the construction period and outline the urbanized perimeter as of 1971;
Collection and cataloguing of the building permits for the period 1940–1965 (available at the municipal archives) to conduct some analyses on the building sector’s development during the period of interest and to create a digital archive providing typological and construction information on residential buildings [30].

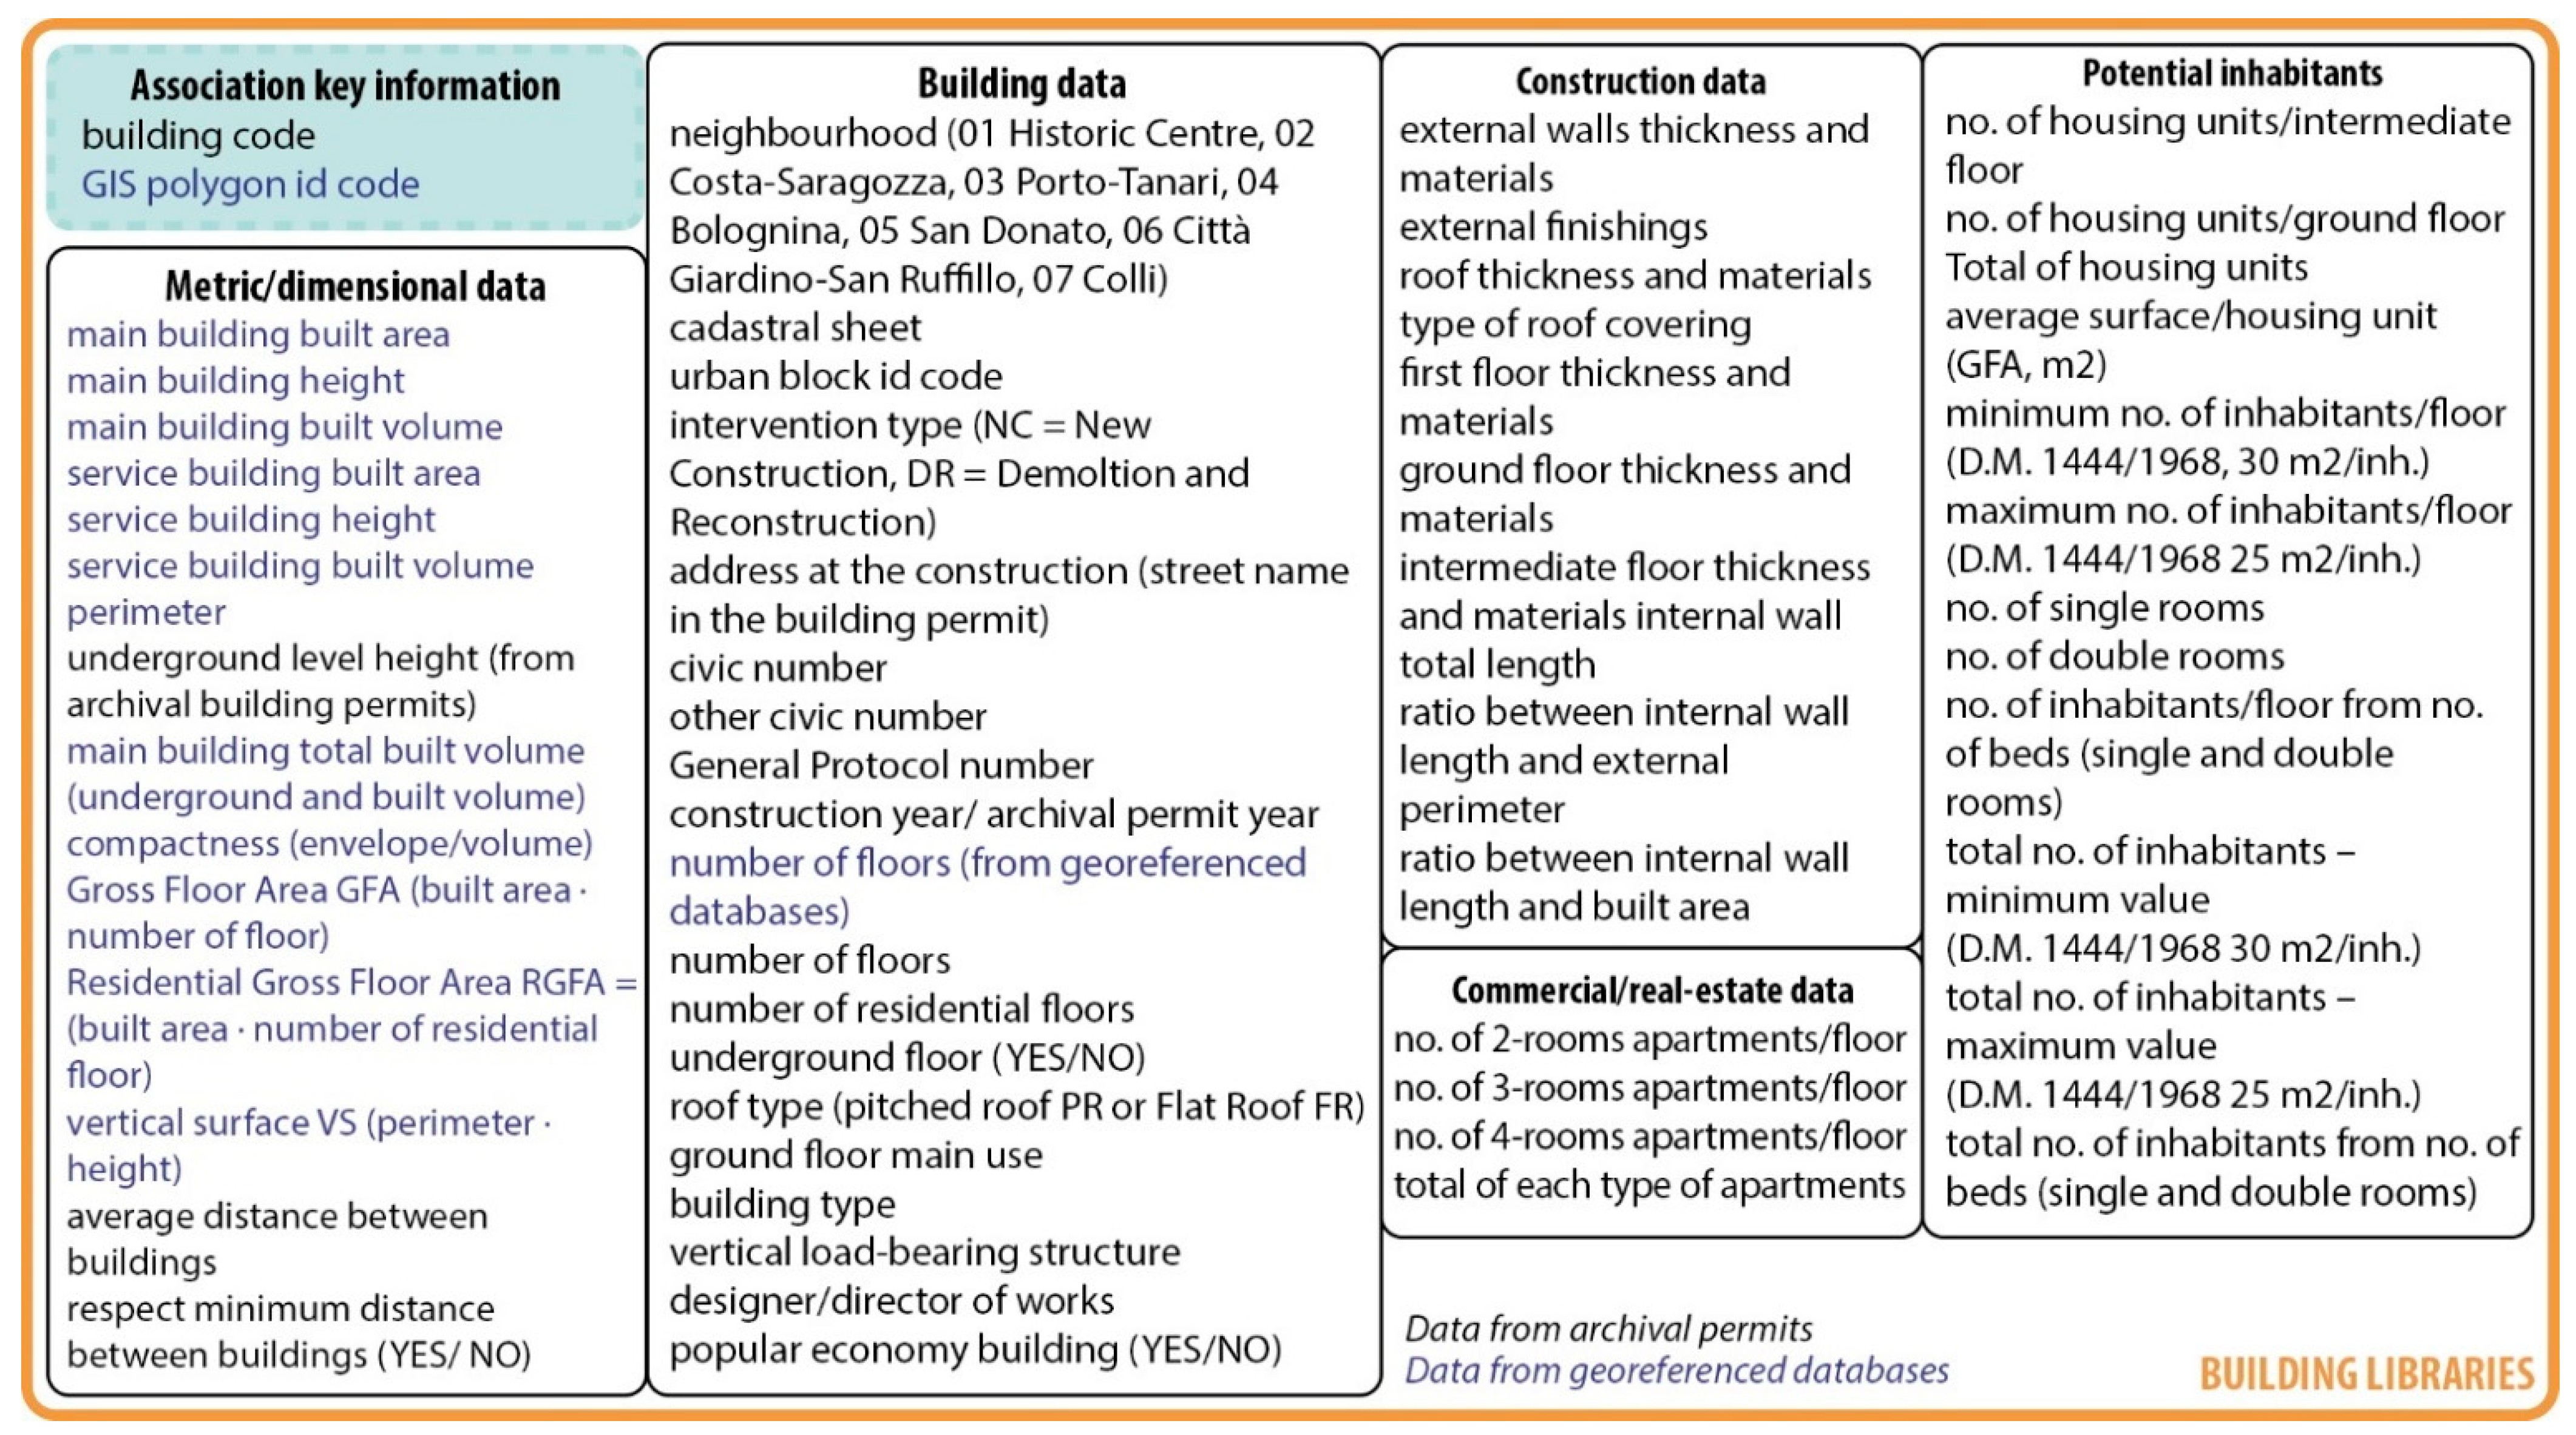
2.1.2. Organizing the Dataset

The digital archive includes the building permits (in chronological order) and General Protocol (GP) number, for easier access to the originals stored in the municipal archives. Additionally, further support is provided by a spreadsheet organized into several information packages that can be integrated into the Municipality of Bologna georeferenced databases through an association key based on building identification codes, e.g., “CODEDIF” [30]. As such, the available knowledge base is further increased through the architectural and construction information, which can be used to set out the recurring features of buildings and determine some archetypes [31] directly related to the entire building stock to be studied and that can be extended and applied to other contexts.
The information packages collected in the Excel spreadsheet for each building that was analyzed, namely each building for which the archival permit was found, are based on the following data from archival permit consultation and georeferenced municipal database:
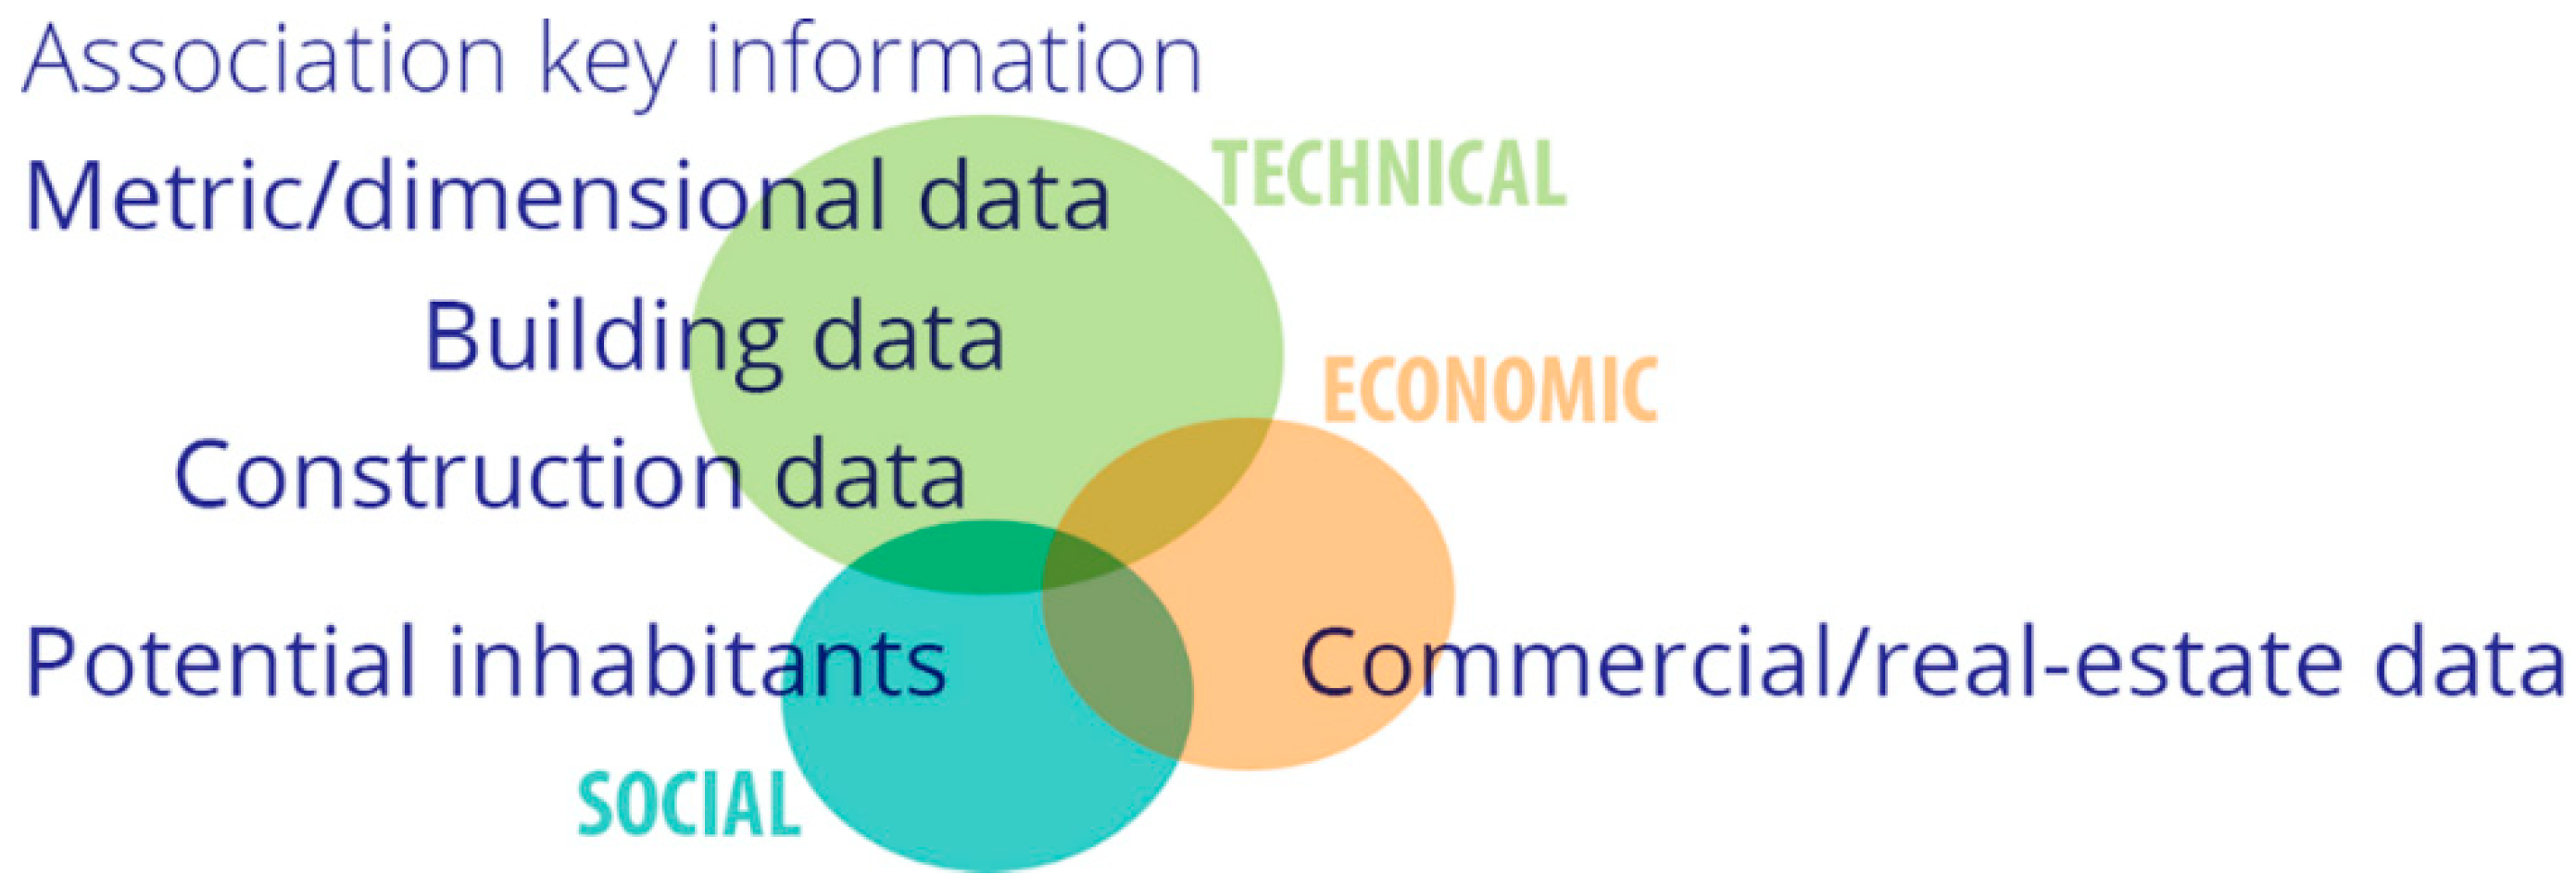
  • Association key information,
  • Metric/dimensional data,
  • Building data,
  • Construction data,
  • Potential inhabitants,
  • Commercial/real-estate data.
The different packages collect information that refers to three main development areas of the model (technical, social, and economic) (Figure 1).

2.2. Digital Implementation Using a GIS Software

Once the database structure and the different packages of information that are needed to characterize the residential building stock are defined, the following phase of the research focuses on digital implementation and integration with the georeferenced municipal database about buildings and urban territory toward the future definition of the digital twin/3D-city model [32,33,34] of Bologna. During the process of digitalizing the building stock in Bologna, the study of GIS software and other 3D-city models [35,36,37] allows for organizing all the databases from the Municipality and archival research.
The data collected from archival research shall be accessed, searched, and visualized easily on the territory and integrated within georeferenced municipal databases [38]. As shown in Figure 2, a georeferenced map was created, including three main information layers [39].
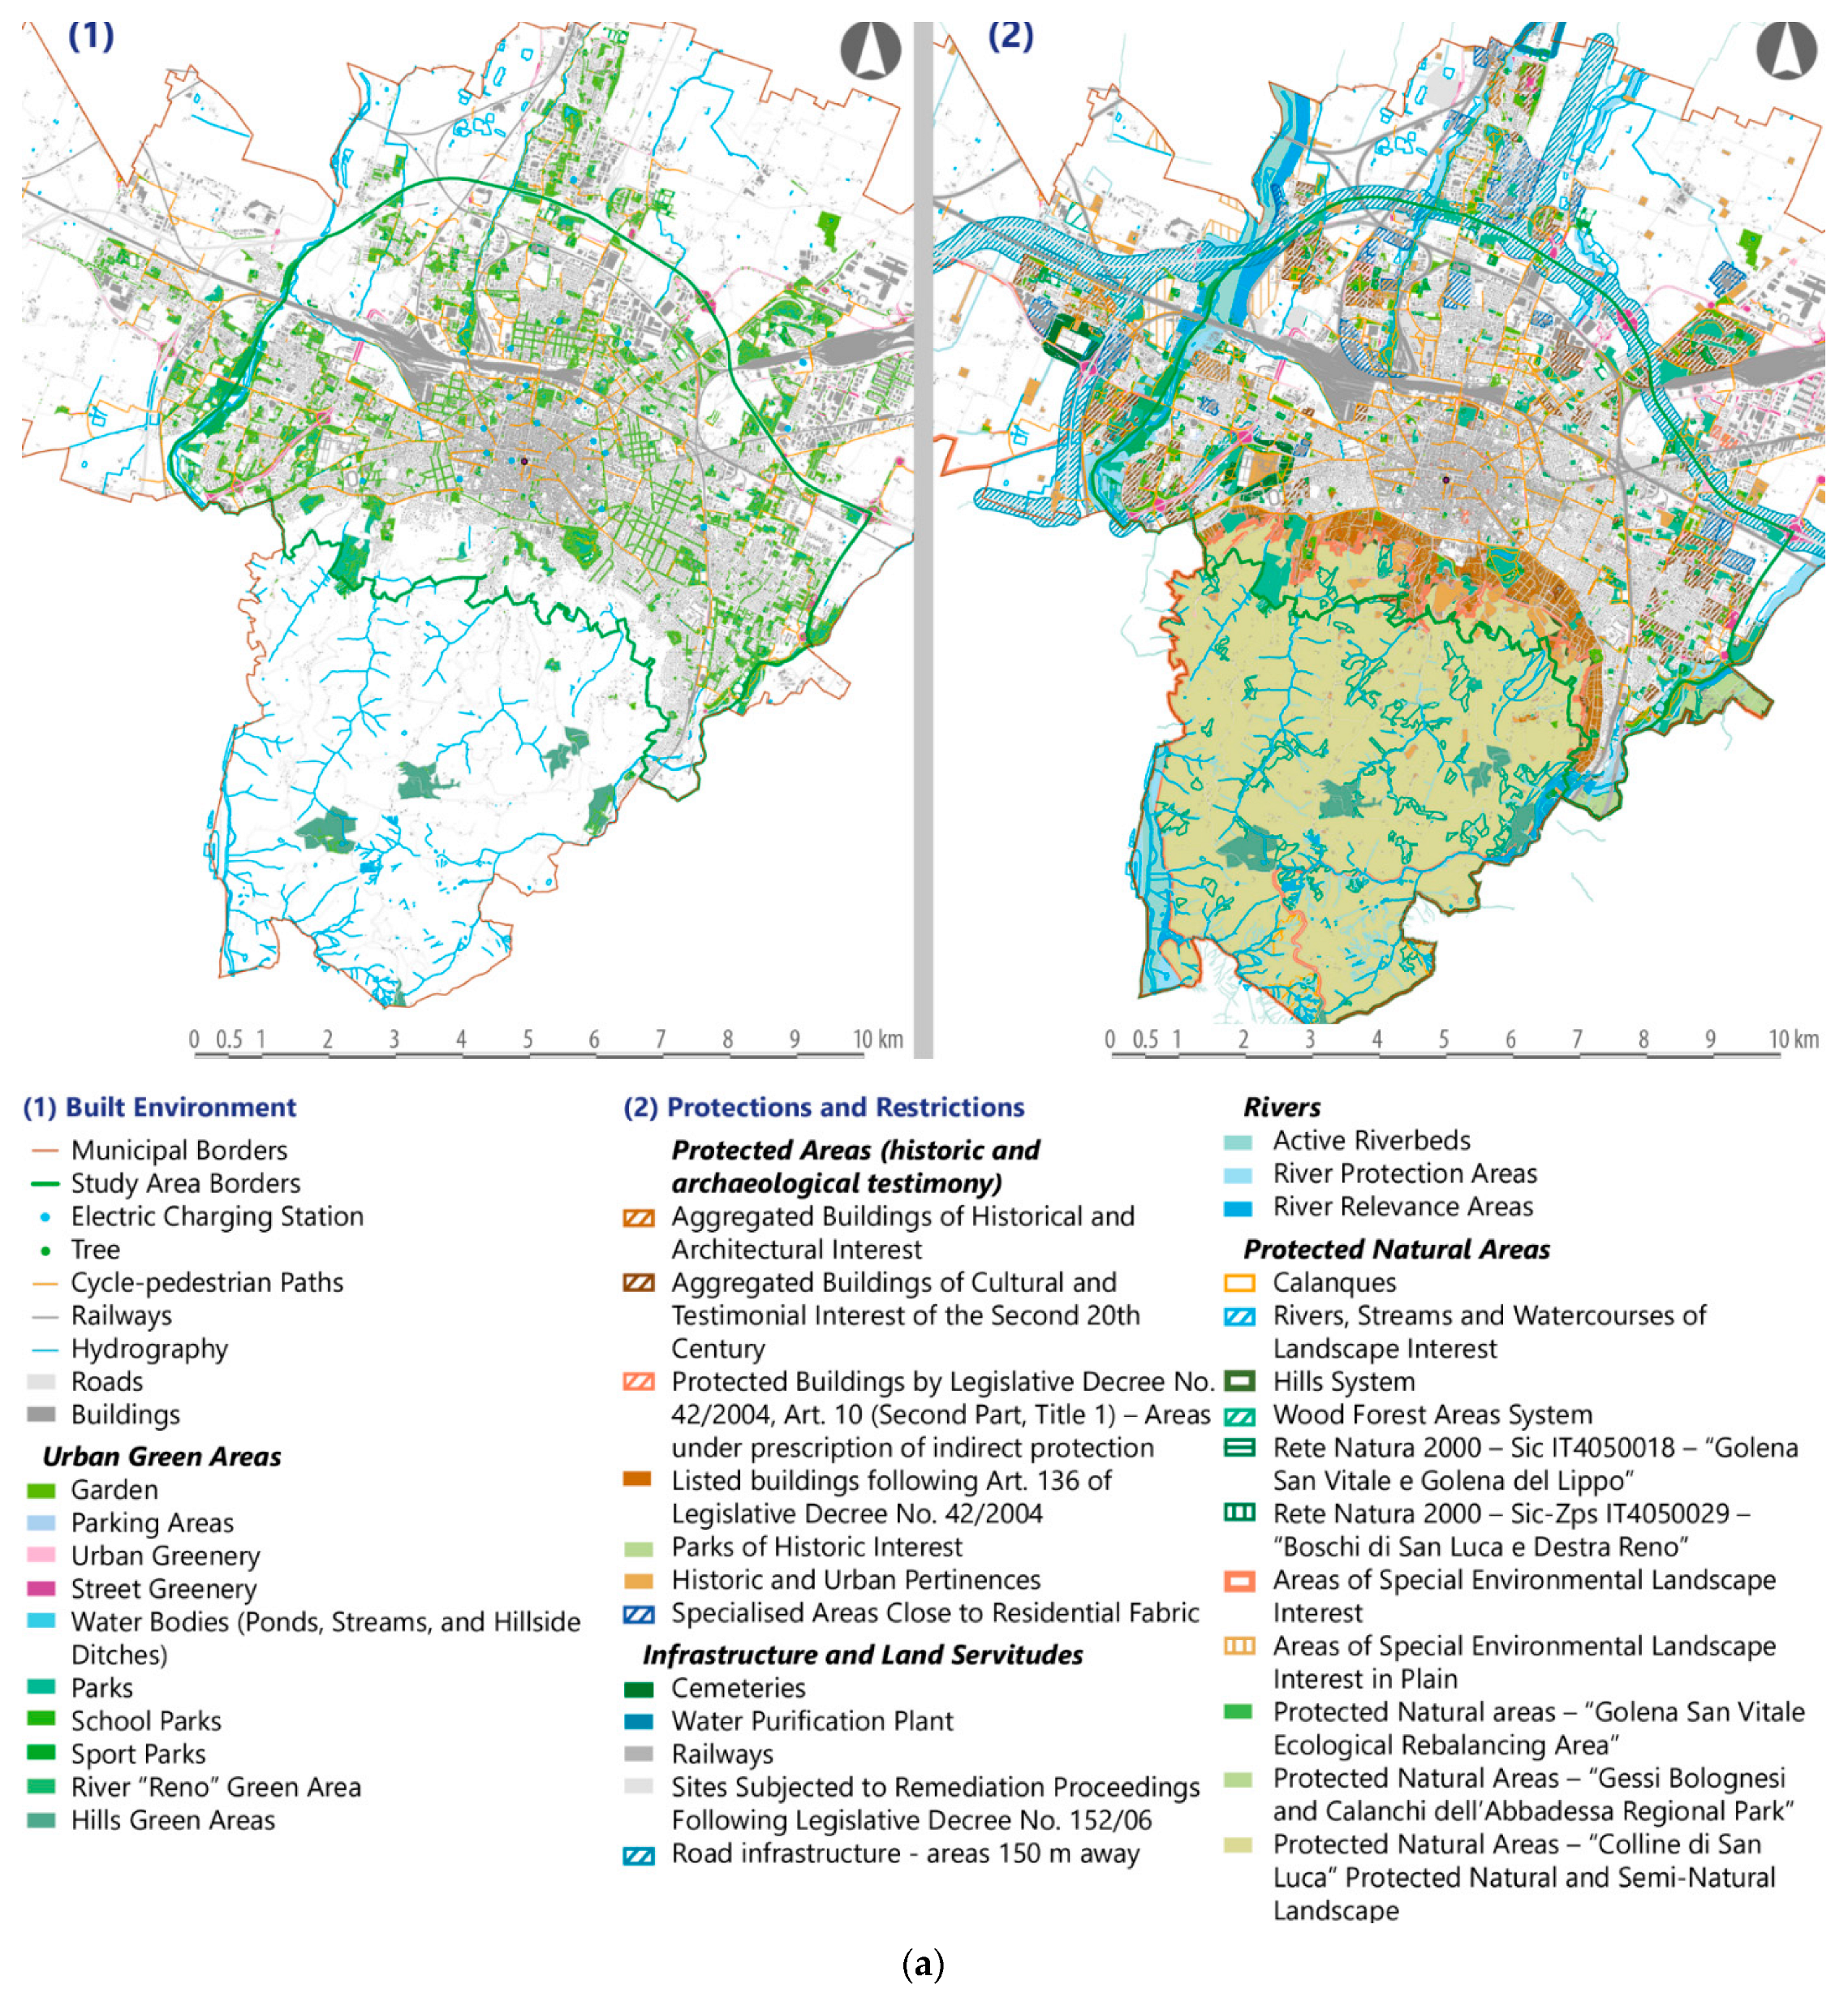
  • Data on the built environment: buildings, roads, pavements, green areas, trees, electric charging stations, cycle and pedestrian paths, public mobility, and cadastral sheets.
  • Data on regulatory and urban planning instruments: restraints and protections on the territory and buildings (water resources and hydro-geological structure, natural and landscape elements, historical and archaeological evidence, infrastructures, soils, and servitudes), historic city fabrics, and parts of the city to be regenerated, completed, and planned.
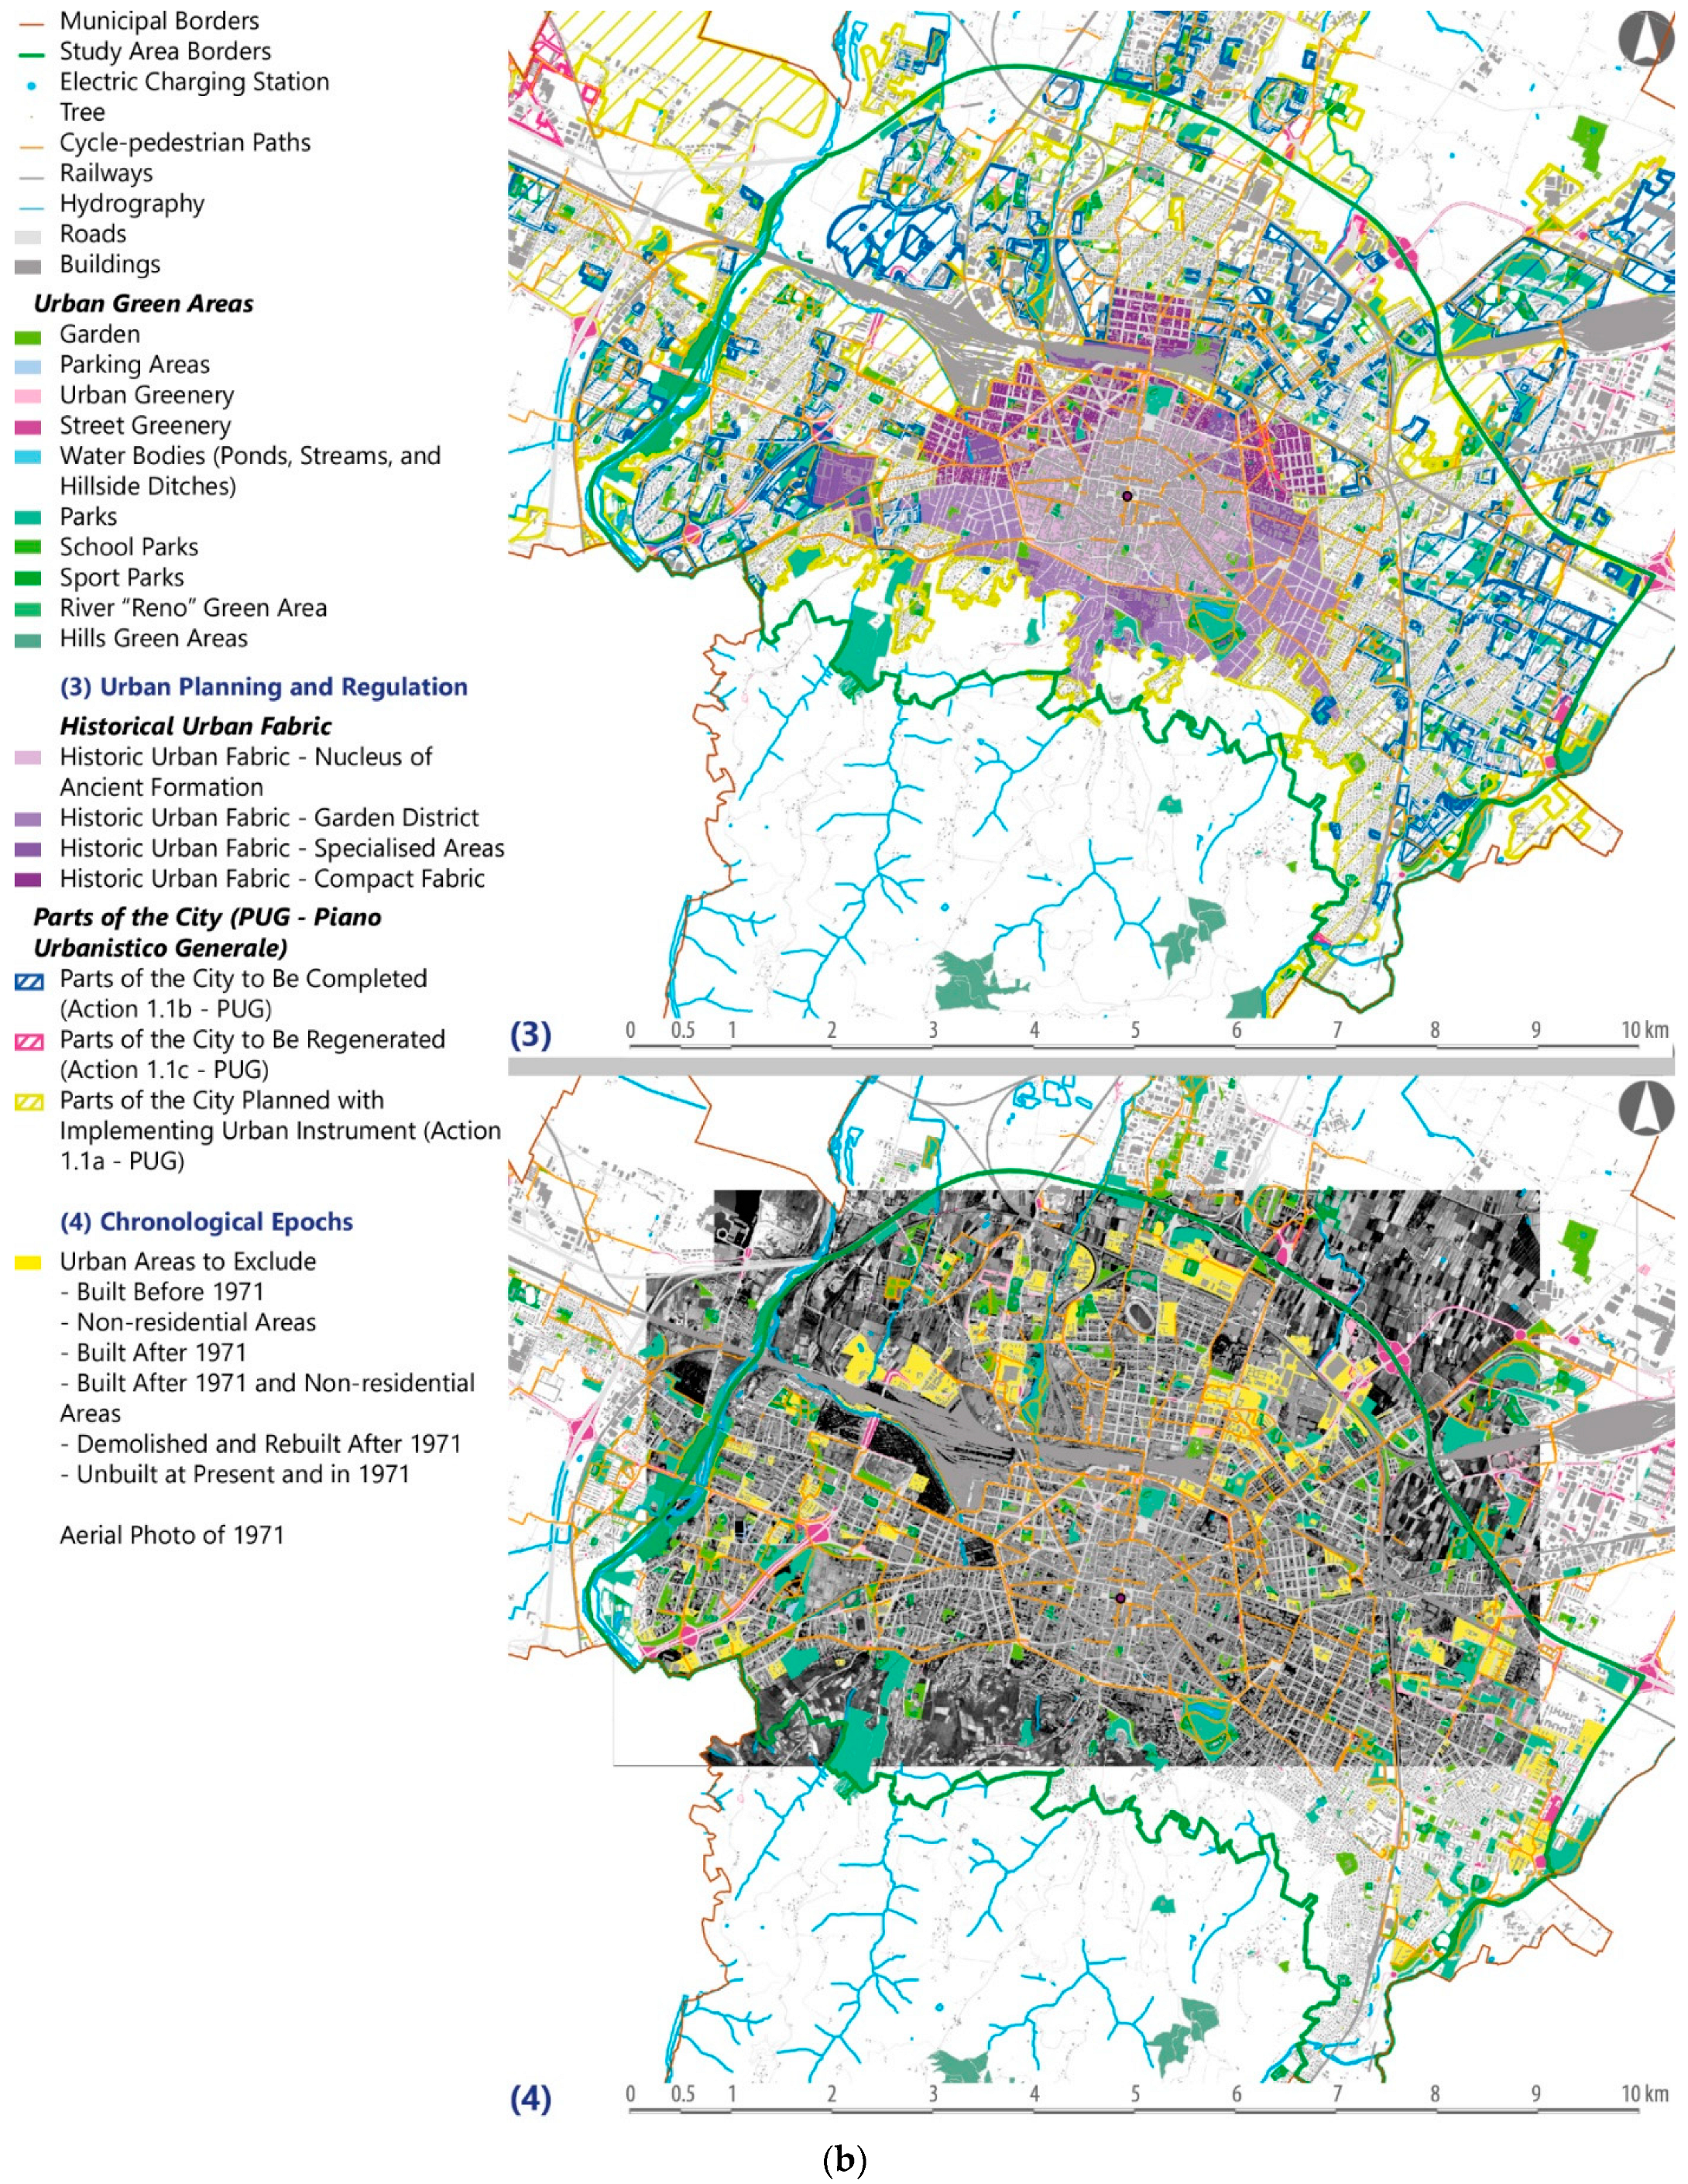
  • Chronological data: the urban territory was divided into construction periods using the data of the last census conducted by ISTAT and orthophotos of Bologna [40]. By georeferencing the 1971 aerial photo [41], the parts of the city built later were clearly identified (the period of interest is 1945–1970) [39].

2.2.1. Urban Fabrics Characterization

In order to “join” the data from archival permit consultation and georeferenced database available online [38], a procedure for urban fabric characterization based on density parameters was tested and developed. An algorithm, here intended as a sequence of operations applied in the georeferenced map with the software ArcGIS by Esri, was defined (Figure 3). More specifically, it includes almost automatic operations whose aim is to identify a set of urban areas representing the building stock to be studied. These operations are based on: (i) restrictions, protections, and in-force planning regulations to exclude both restricted/protected areas and buildings, (ii) on uses/functions to exclude mainly not residential areas, and on (iii) the overlapping of the aerial photo of 1971 and manual check to exclude all the parts of the municipal territory that were built after 1971 or were demolished and reconstructed after that year.
In particular, specific analyses were conducted to define the consistency of listed and industrial buildings [39] as considering only the urban residential blocks without industrial or listed buildings would have reduced the sample of urban areas to study and excluded suitable areas for demolition and reconstruction interventions. The analyses are intended to find the most frequent values in terms of numbers and built surface of industrial and listed buildings in order to define a rule to select mostly residential areas with few listed dwellings constructed between the first and the second half of the 20th century (not after 1971). As such, 210 urban blocks resulted after introducing an arbitrary criterion based on the built surface for industrial buildings and the number—as a percentage of the total number of buildings in each area—for listed buildings (Table 1) [39].
The criterion constitutes a first attempt to outline the context in which to test the application of the R4R paradigm. However, several other rules could be applied following other different research purposes. In fact, identifying and using an arbitrary principle does not jeopardize the following research phase, which aims at finding clusters of urban territory with common features, starting from different value ranges of some parameters describing the concept of density [42,43] of the built environment, also using the “Spacemate” chart [44].
The “Spacemate” is intended to describe urban fabrics from a typological and morphological point of view, highlighting the relations between some density parameters: FSI, Floor Space Index, GSI, Ground Space Index, OSR, Open Space Ratio and L, Layers [44], which are described in Table 2 and Figure 4.
The application of “Spacemate” to 210 urban blocks (Figure 5) can easily recognize different clusters representing the urban territory on the graph. For each urban area, density parameters were calculated automatically in the GIS software and integrated directly into the georeferenced database. Please see the following points for an overview of the values inserted into the database for the existing building stock (these values are collected in Supplementary File S1):
  • No. of Floors for Residential Buildings: the ratio between eave height and 3.5 m (intermediate floor gross average height for residential buildings). The authors applied this formula to obtain an indication of the height of the building in terms of floors and it provides useful data as it can be compared with the values of layers. The value of the gross height of a residential floor (3.5 m) is an estimate based on the average internal height of a residential floor coupled to the thickness of slabs (structural part and finishing one).
NF-Res = (Building Height in m)/(3.5 m)
  • No. of Floors for Industrial Buildings: the ratio between eave height and 3.8 m (intermediate floor gross average height for industrial buildings). The authors applied this formula to obtain an indication of the height of the industrial building in terms of floors and it provides useful data as it can be compared with the values of layers. The value of the gross height of an industrial floor (3.8 m) is an estimate based on the average internal height of an industrial floor coupled to the thickness of slabs (structural part and finishing one). It is supposed to be higher than the residential one.
NF-Ind = (Building Height in m)/(3.8 m)
  • Gross Floor Area (GFA): the total built surface of a building, e.g., the sum of the gross horizontal area of each floor. It is a key value necessary to obtain the Floor Space Index; the GFA was calculated separately for residential and industrial buildings.
GFA   =   ( Building   Footprint   or   Coverage   in   m 2 )   ·   ( No .   of   Floors )   [ m 2 ]   Residential   building :   GFA res   = BF   ·   NF - Res [ m 2 ] Industrial   building :   GFA ind   =   BF   ·   NF - Ind   [ m 2 ]
  • The following formulas lead to the values of density parameters for urban blocks [42,43]:
  Floor   Space   Index   FSI   = ( Σ   GFA i , res   +   Σ   GFA i , ind ) / Territorial   Area   i   =   ith   building   in   the   urban   block
Ground   Space   Index   GSI   =   Σ   BF i / Territorial   Area i   =   ith   building   in   the   urban   block
Open Space Ratio OSR = (1-GSI)/FSI
Layers L = FSI/GSI
  • Average Building Height of an urban block: the arithmetical average between all the values of heights inside a block and it is the ratio between the sum of all buildings’ heights and the number of buildings:
Average   Buildings   Height   =   Σ   BH i   in   m / N [ m ] i   =   ith   building   in   the   urban   block N   =   number   of   both   industrial   and   residential   buildings   in   the   urban   block
  • Average Number of floors in an urban block: the arithmetical average between all the values of the number of floors within a block and it is the ratio between the sum of all buildings’ number of floors and the number of buildings.
  Average   Number   of   Floors   =   ( Σ   NF i , res   +   Σ   NF i , ind ) / ( Σ   N i , res   +   Σ   N i , ind ) i , res   =   ith   residential   building i , ind   =   ith   industrial   building N i , res   =   number   of   residential   buildings   in   the   block N i , ind   =   number   of   industrial   buildings   in   the   block
The urban blocks with similar density parameter values appear in the same zone. When the Bologna “Spacemate” was compared with the original one [44] and the categories proposed by another study applied in Bologna [45], some different clusters were found. These have specific range values in urban intensity, built area and open spaces, and height (e.g., the number of floors). Therefore, the next steps of the research focus on the most representative set included in these clusters in order to deepen the study on a first relevant urban block sample. Through the combination of the value of GSI, layers and the number of floors calculated with Equations (1) and (2), another arbitrary criterion was applied to identify a subset of urban fabrics among the 210 items that are expected to be the most fitting to the present research interests, made of 55 urban blocks.

2.3. Validation and GIS Matching

The validation process is crucial to check the urban clusters and the whole procedure for urban fabric characterization. This stage is complex and very expensive in terms of time, as it relies on the comparison of the same parameters calculated from two sources, i.e., archival permits supported by on-site surveys and satellite images and georeferenced databases, used in order to obtain the “Spacemate” for Bologna. The matching between the building in the GIS map and its permit, collected during the archival research, is based on location data (address) and building ID code “CODEDIF”, included in municipal databases and added to the dataset created during and after the archival research (Section 2.1.2). This association allows for linking all the data accessible by construction drawing consultation (plan, facades, section, technical forms with information about materials) with the territory (a specific location) and municipal georeferenced databases, which include metric/dimensional information, function/use information, and urban planning information, such as zoning, restrictions, and protections. Density parameters (FSI, L, OSR, NF) are also calculated from permit data and measuring the deviation between the two sources’ values offers a synthetic indication of the correctness of urban clusters and outlines the limits of different parameters’ ranges.

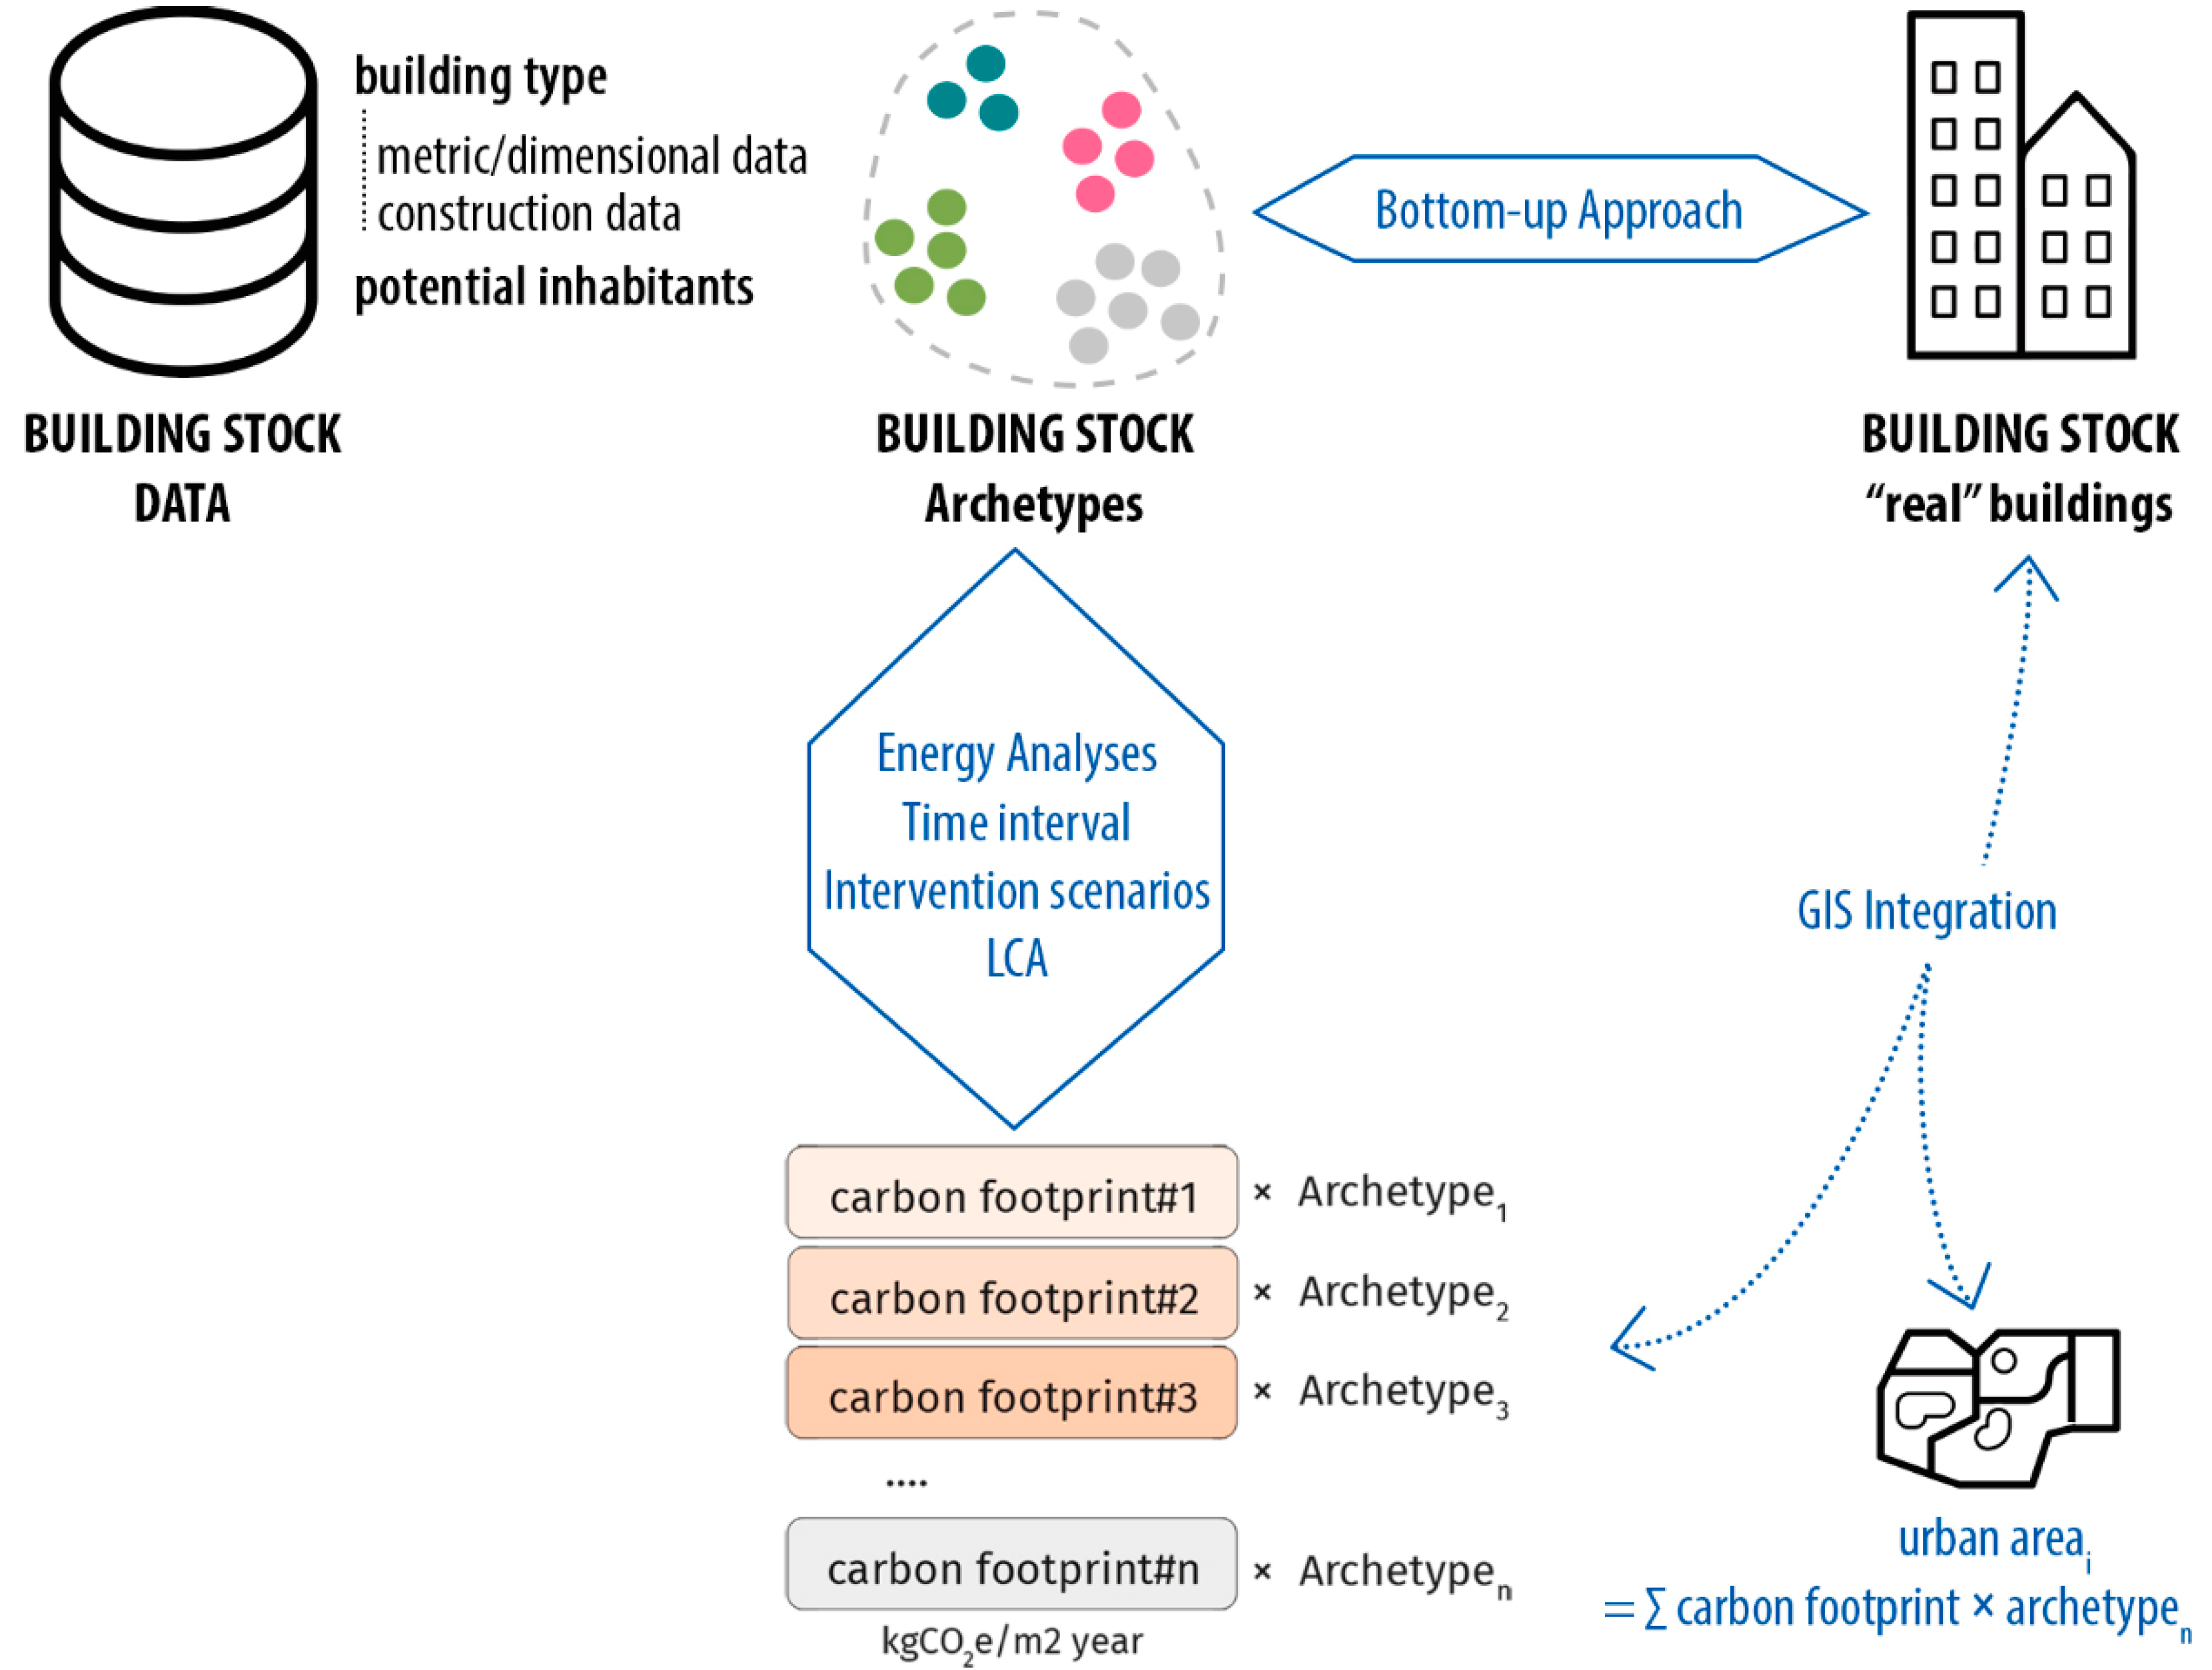
2.4. Decision-Support Tools for Intervention Strategies: GIS Integration of Large-Scale LCA

Two different decision-support tools working at different scales are identified: GIS integration of large-scale LCAs to produce strategic urban maps in an effort to support sustainable intervention in cities and an evaluation matrix for urban blocks, which aims to calculate a synthetic index, a score of the urban block sustainability according to different intervention scenarios. It combines requirements related to 6 relevant areas (urban space layout, mobility, energy, circular metabolism, green, and inclusive and participative society); it identifies some principles describing each area, which correspond to several prerequisites that can be directly assessed/implemented with a set of actions supported by quantitative information, namely indicators.
This matrix, inspired by the Lehmann sustainability matrix [46] and the guide for designing sustainable neighborhoods by UN-Habitat [47], is currently under development and it is intended to give a synthetic index of the sustainability of an urban area.

GIS Integration of Large-Scale LCA

In order to continue the digitization of the existing building stock analyzed in Section 2.2 and to develop a tool to support sustainable city planning, the integration of large-scale life cycle analysis in GIS software was investigated. In accordance with the R4R paradigm and numerous research goals, this methodology allows one to (i) estimate the convenience of replacement rather than recovery-renewal, (ii) identify a set of criteria and actions to be considered in preliminary phases, and (iii) visualize the results of the analyses directly on the territory support city planning.
The life cycle approach and the consequent development of the LCA methodologies for assessing the environmental performance of the building stock on a large scale allow for the identification of objective and measurable criteria, providing support to urban planning policies in order to achieve the target of building sector decarbonization and define climate change mitigation and resilience strategies on a larger scale. Integrating life cycle energy analyses with whole-life carbon assessment (embodied and operational carbon) of new construction and recovery/renovation interventions applied to existing buildings is necessary in order not to overestimate the environmental benefit due to reducing energy demand, without taking into account the impact of products and processes [48], whose share in the whole life cycle is more relevant in the transition to net-zero-energy buildings.
The model for assessing the environmental impact of the building stock generally consists of: a building stock model, an energy model, LCA results, and, sometimes, the representation/visualization in the GIS system [49]. Two main strategies relate data to building stock: top-down or bottom-up [50]. These were defined for estimating building stock energy demand; however, they can be extended to environmental impact assessment with the LCA method [49].
The bottom-up approach aims at calculating the impacts of groups of buildings or individual buildings, using more specific data and, depending on the sample’s representativeness, extends them to the entire estate. In particular, the “archetype technique” is based on defining a limited number of conceptual building models, namely the archetypes, which significantly represent the entire building stock and depend on a different combination of geometric, construction, plants, and use-related (functions) characteristics.
The number of archetypes is variable, depends on the context and research purposes, and properly represents the building stock to be studied. The energy and environmental analyses on the archetypes are then associated with the entire building stock, which was divided into categories identified by these virtual models. A certain level of simplification (in terms of performance analyses’ results at the urban, regional, or even national scale) is included in this technique, but it does not compromise the outcomes of the research.
By studying and reading, with a critical eye, several contributions [22,23,24,31,51,52,53], a methodology based on the large-scale LCA method and the bottom-up approach that can be implemented with GIS software was explored to assess different intervention scenarios (retrofit and demolition with reconstruction) on the building stock. Results can be used to produce predictive simulations and verify the achievement of emission reduction targets [24,26]. This method (Figure 6) consists of (i) definition of a model of the existing building stock according to the bottom-up approach (archetypes) in order to identify several conceptual models that significantly approximate the actual building stock; (ii) definition of intervention scenarios (no interventions, renovation, or demolition with reconstruction); (iv) assessment of the impact in terms of CO2 emissions in a determined time interval; (v) integration of the results in a GIS system to visualize and map the emissions, linked to the different scenarios, on the territory.

3. Results

The methodology presented above is divided into four main phases. The first one is intended to create a solid knowledge base of the residential building stock that can be suitable for demolition with reconstruction interventions according to the R4R strategy. The second one focuses on digital and GIS implementation, aiming at making data accessible from archival research for further analyses and the future definition of a 3D-city model of Bologna. In the third one, the matching process is necessary to validate the clusters and the urban fabric characterization procedure. The last stage aims to use all the data collected and validated in the previous phases to identify archetypes representing the building stock. Future integration of LCA and energy models is needed to evaluate the environmental performance following intervention scenarios. Moreover, the evaluation matrix for urban blocks attempts to compare different intervention scenarios and consider other issues of the building that might have implications on urban sustainability. Since the matrix and the calculation methods for obtaining an index value of the sustainability of an area are still under development, the first results are not included in this section.

3.1. Building Libraries

The first phase is preliminary to the following ones and defines the base, made of “real data” from archival permits, and their structure/organization determines all the subsequent analyses and simulations.
The building libraries (Figure 7) include information about surfaces and volumes, building type features, materials, real-estate data, and people.
The below list provides an overview of each of them:
  • Association key information: building code, GIS polygon ID code.
  • Metric/dimensional data: main building built area, service building built area, perimeter, main building height, service building height, main building built volume, underground level height (from archival building permits), main building total built volume (underground and built volume), service building built volume, compactness (envelope/volume), Gross Floor Area GFA (built area · number of floors), Residential Gross Floor Area RGFA = (built area · number of residential floors), vertical surface VS = (perimeter · height), the average distance between buildings, respect the minimum distance between buildings (YES/NO).
  • Building data: neighborhoods/city districts (01 Historic Centre, 02 Costa-Saragozza, 03 Porto-Tanari, 04 Bolognina, 05 San Donato, 06 Città Giardino-San Ruffillo, 07 Colli), cadastral sheet, urban block ID code, intervention type (NC = New Construction, DR = Demolition and Reconstruction), address at the construction (street name in the building permit), civic number, other civic numbers, General Protocol number, construction year/archival permit year, number of floors (from georeferenced databases), number of floors, number of residential floors, underground floor (YES/NO), roof type (pitched roof PR or Flat Roof FR), ground floor primary use, building type, vertical load-bearing structure, designer/director of works, social economy building (YES/NO).
  • Potential inhabitants: no. of housing units per intermediate floor, no. of housing units per ground floor, total of housing units, average surface per housing unit (GFA, m2), minimum no. of inhabitants per floor (D.M. 1444/1968, 30 m2/inh.), maximum no. of inhabitants per floor (D.M. 1444/1968 25 m2/inh.), no. of single rooms, no. of double rooms, no. of inhabitants per floor from no. of beds (single and double rooms), total no. of inhabitants—minimum value (D.M. 1444/1968 30 m2/inh.), total no. of inhabitants—maximum value (D.M. 1444/1968 25 m2/inh.), total no. of inhabitants from no. of beds (single and double rooms).
  • Construction data: external wall thickness and materials, external finishings, roof thickness and materials, type of roof covering, first-floor thickness and materials, ground floor thickness and materials, intermediate floor thickness and materials, internal wall total length, the ratio between internal wall length and external perimeter, the ratio between internal wall length and built area (coverage),
  • Commercial/real-estate data: no. of two-room apartments per floor, no. of three-room apartments per floor, no. of four-room apartments per floor, and the total of each type of apartments.

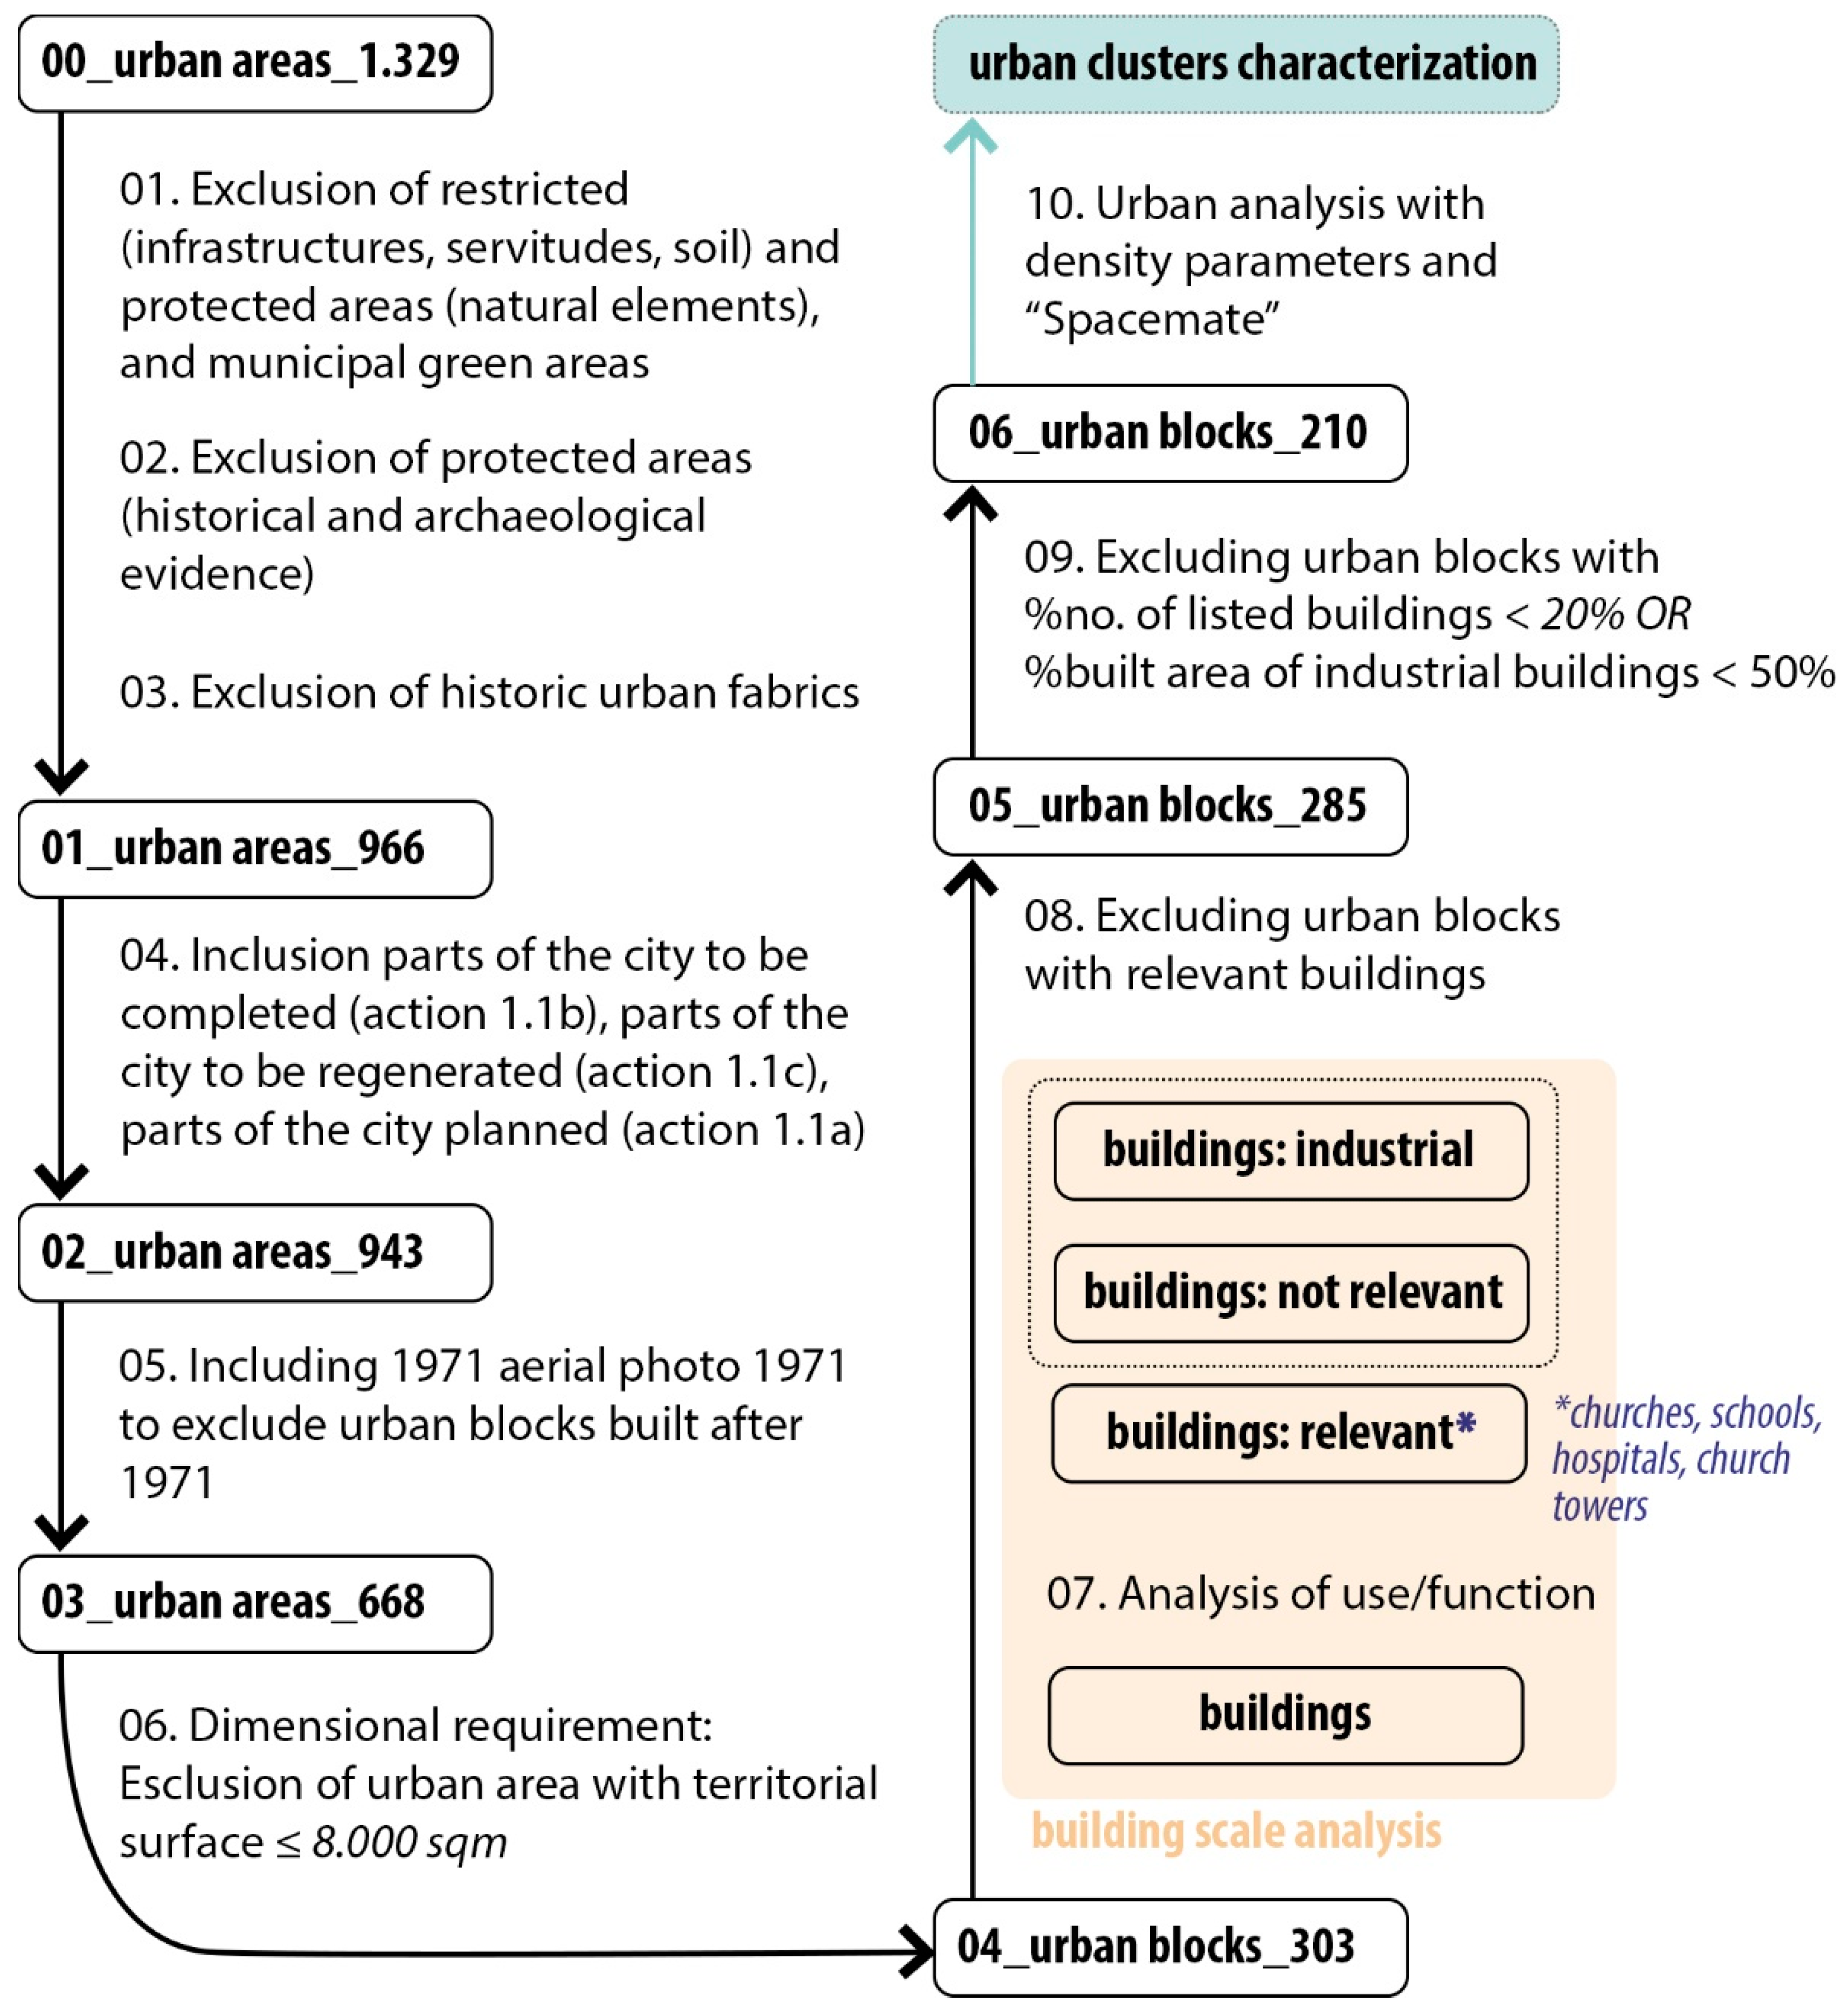
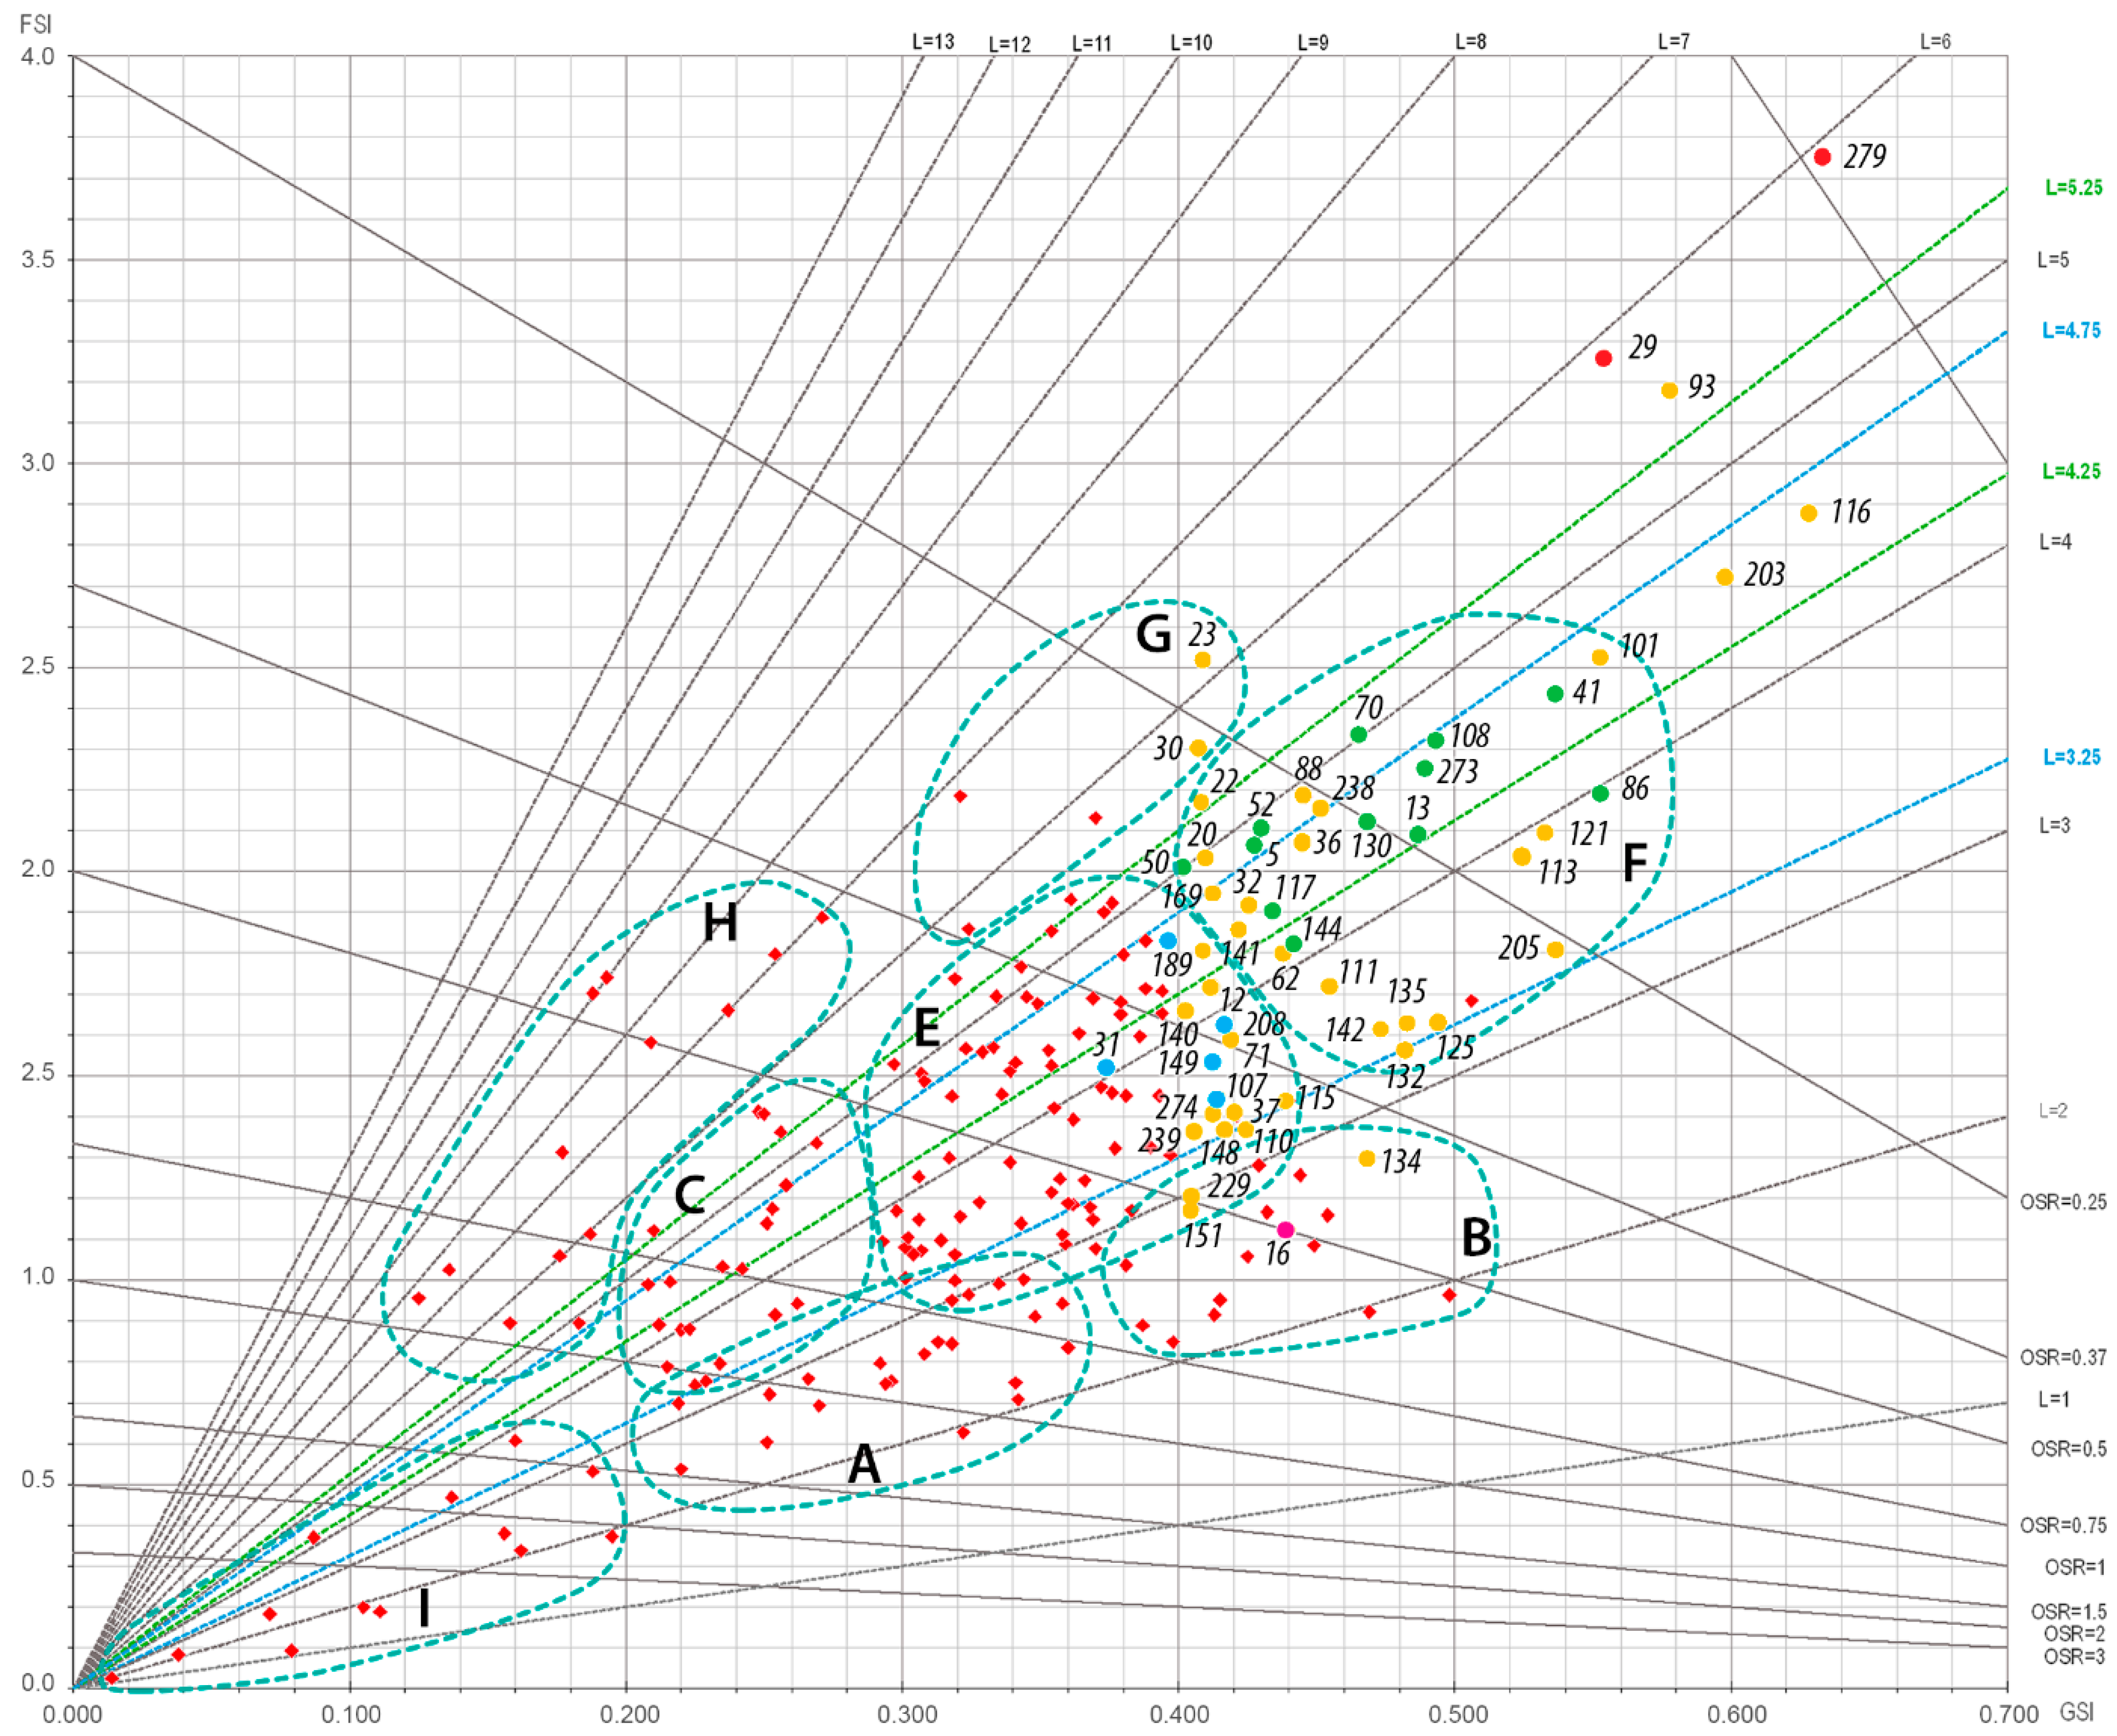
3.2. Urban Block Clusters

The application of “Spacemate” to Bologna’s first periphery and mostly residential urban blocks (210) allows for the identification of eight different clusters with common characteristics in terms of built area (GSI), height (number of floors and L), FSI, and OSR [39].
The eight categories can be easily recognized in the chart (Figure 8).
  • A: Low-rise medium compact buildings (1–3 floors);
  • B: Low-rise compact buildings (1–3 floors);
  • C: Mid-rise medium compact buildings (3–5 floors);
  • E: Mid-rise compact buildings (3–5 floors);
  • F: Mid-rise extremely compact buildings (3–5 floors);
  • G: High-rise compact buildings (more than 6 floors);
  • H: High-rise spacious buildings (more than 6 floors);
  • I: Low-rise isolated buildings (1–3 floors).
The major part of 210 urban blocks is located in the central area of the chart, which corresponds to compact fabric, without open spaces and with medium-high buildings (3–5 floors), i.e. the so-called “mostly residential areas, with few listed buildings, mostly built before 1971, mid-rise and compact (even extremely compact) buildings” [39].
In order to further explore the most representative set according to research interests (high-density areas) and also the urban blocks outside the urban clusters, a criterion that combines the value of GSI, the number of floors NF, and L, is defined and then applied to obtain a subset of 55 urban blocks, that is 26.2% of 210. See criterion below:
GSI ≥ 0.4 ∧ L ≥ 3.25 ∨ NF ≥ 3
The 55 urban blocks belong mainly to urban clusters F and E, with some areas included in groups G and B, which all correspond to compact and highly compact buildings, with some differences in terms of layers/number of floors. Further analyses are intended to check the identified urban clusters and describe, from a typological and morphological point of view, the five areas that lay outside the clusters [39].

3.3. Validation Procedure Results

The validation is applied to the building stock in 20/55 urban blocks, identified by a specific number code (urban block ID code), consisting of 377 buildings, 252 dwellings, and 125 host services (i.e., garages, warehouses, etc.) (Figure 9).
The procedure calculates the same density values from different sources thanks to matching data from archival permits, on-site surveys and satellite images (i.e., Google Maps), and municipal geodatabases in georeferenced maps. Theoretically, this is quite a simple process. However, it is complex and energy expensive and, in a few cases, the association is not possible because of the lack of information.
The primary association key comprises the address and “CODEDIF”. This last code is also included in archival permits, but in many cases, it is not correct as it is linked to another building and, sometimes, also using the address at the construction year to be compared with the current one (with the help of the toponymy archive [54]), the matching fails. This means that it is impossible to have building data, potential inhabitants, and construction data on that building. In this case, the validation procedure succeeds in 75% of the buildings, but only 15% (38/252 of dwellings) results without permits. If we consider the whole number of constructions (252 + 125), the percentage will decrease to 10%. However, this is unreliable as service buildings are always included in the same permit as the main one. FSI, OSR, average building height, and the average number of floors were calculated from two different sources (municipal geodatabases [38] and archival permits). The first ones with Formulas (4), (6), (8), (9), and the second ones with the same but using as input the “real” number of floors, obtained by checking the drawings in the archival permits and distinguishing the main buildings, which host housing units, from the service ones. The charts (Figure 10) facilitate comparison and visualization of the registered deviations. These are presented in the following table (Table 3) as maximum, minimum, and average deviation in the archival permits’ values from the georeferenced databases. A negative value means that the parameter obtained from georeferenced databases (and used in the “Spacemate” chart) is underestimated; a positive variation indicates that it is overestimated.
Furthermore, other charts (Figure 11) emphasize the consistency of main buildings and service buildings (in terms of built surface and volume) and the relation between the number of polygons represented in GIS maps and the number of main buildings and service buildings obtained by archival permits’ consultation. The number of polygons in GIS maps expresses the complexity of the building’s form and aggregation and the more complex the form, the higher the number of polygons. Further, the number of service buildings is sometimes relevant, implying significant errors in estimating the blocks’ average height and the number of floors.
Service buildings are not relevant in terms of built volume and built area and are mostly one-story high (much lower than main buildings), but highly relevant in terms of quantity. These considerations and the variation in the average BH and number of floors (Table 3) result in unreliable values because these do not describe the actual vertical development in the urban blocks. However, these relevant variations do not affect FSI and OSR in the same way and their deviations are much more limited and do not exceed 25.50%. All the values and variations are collected in Supplementary File S2.

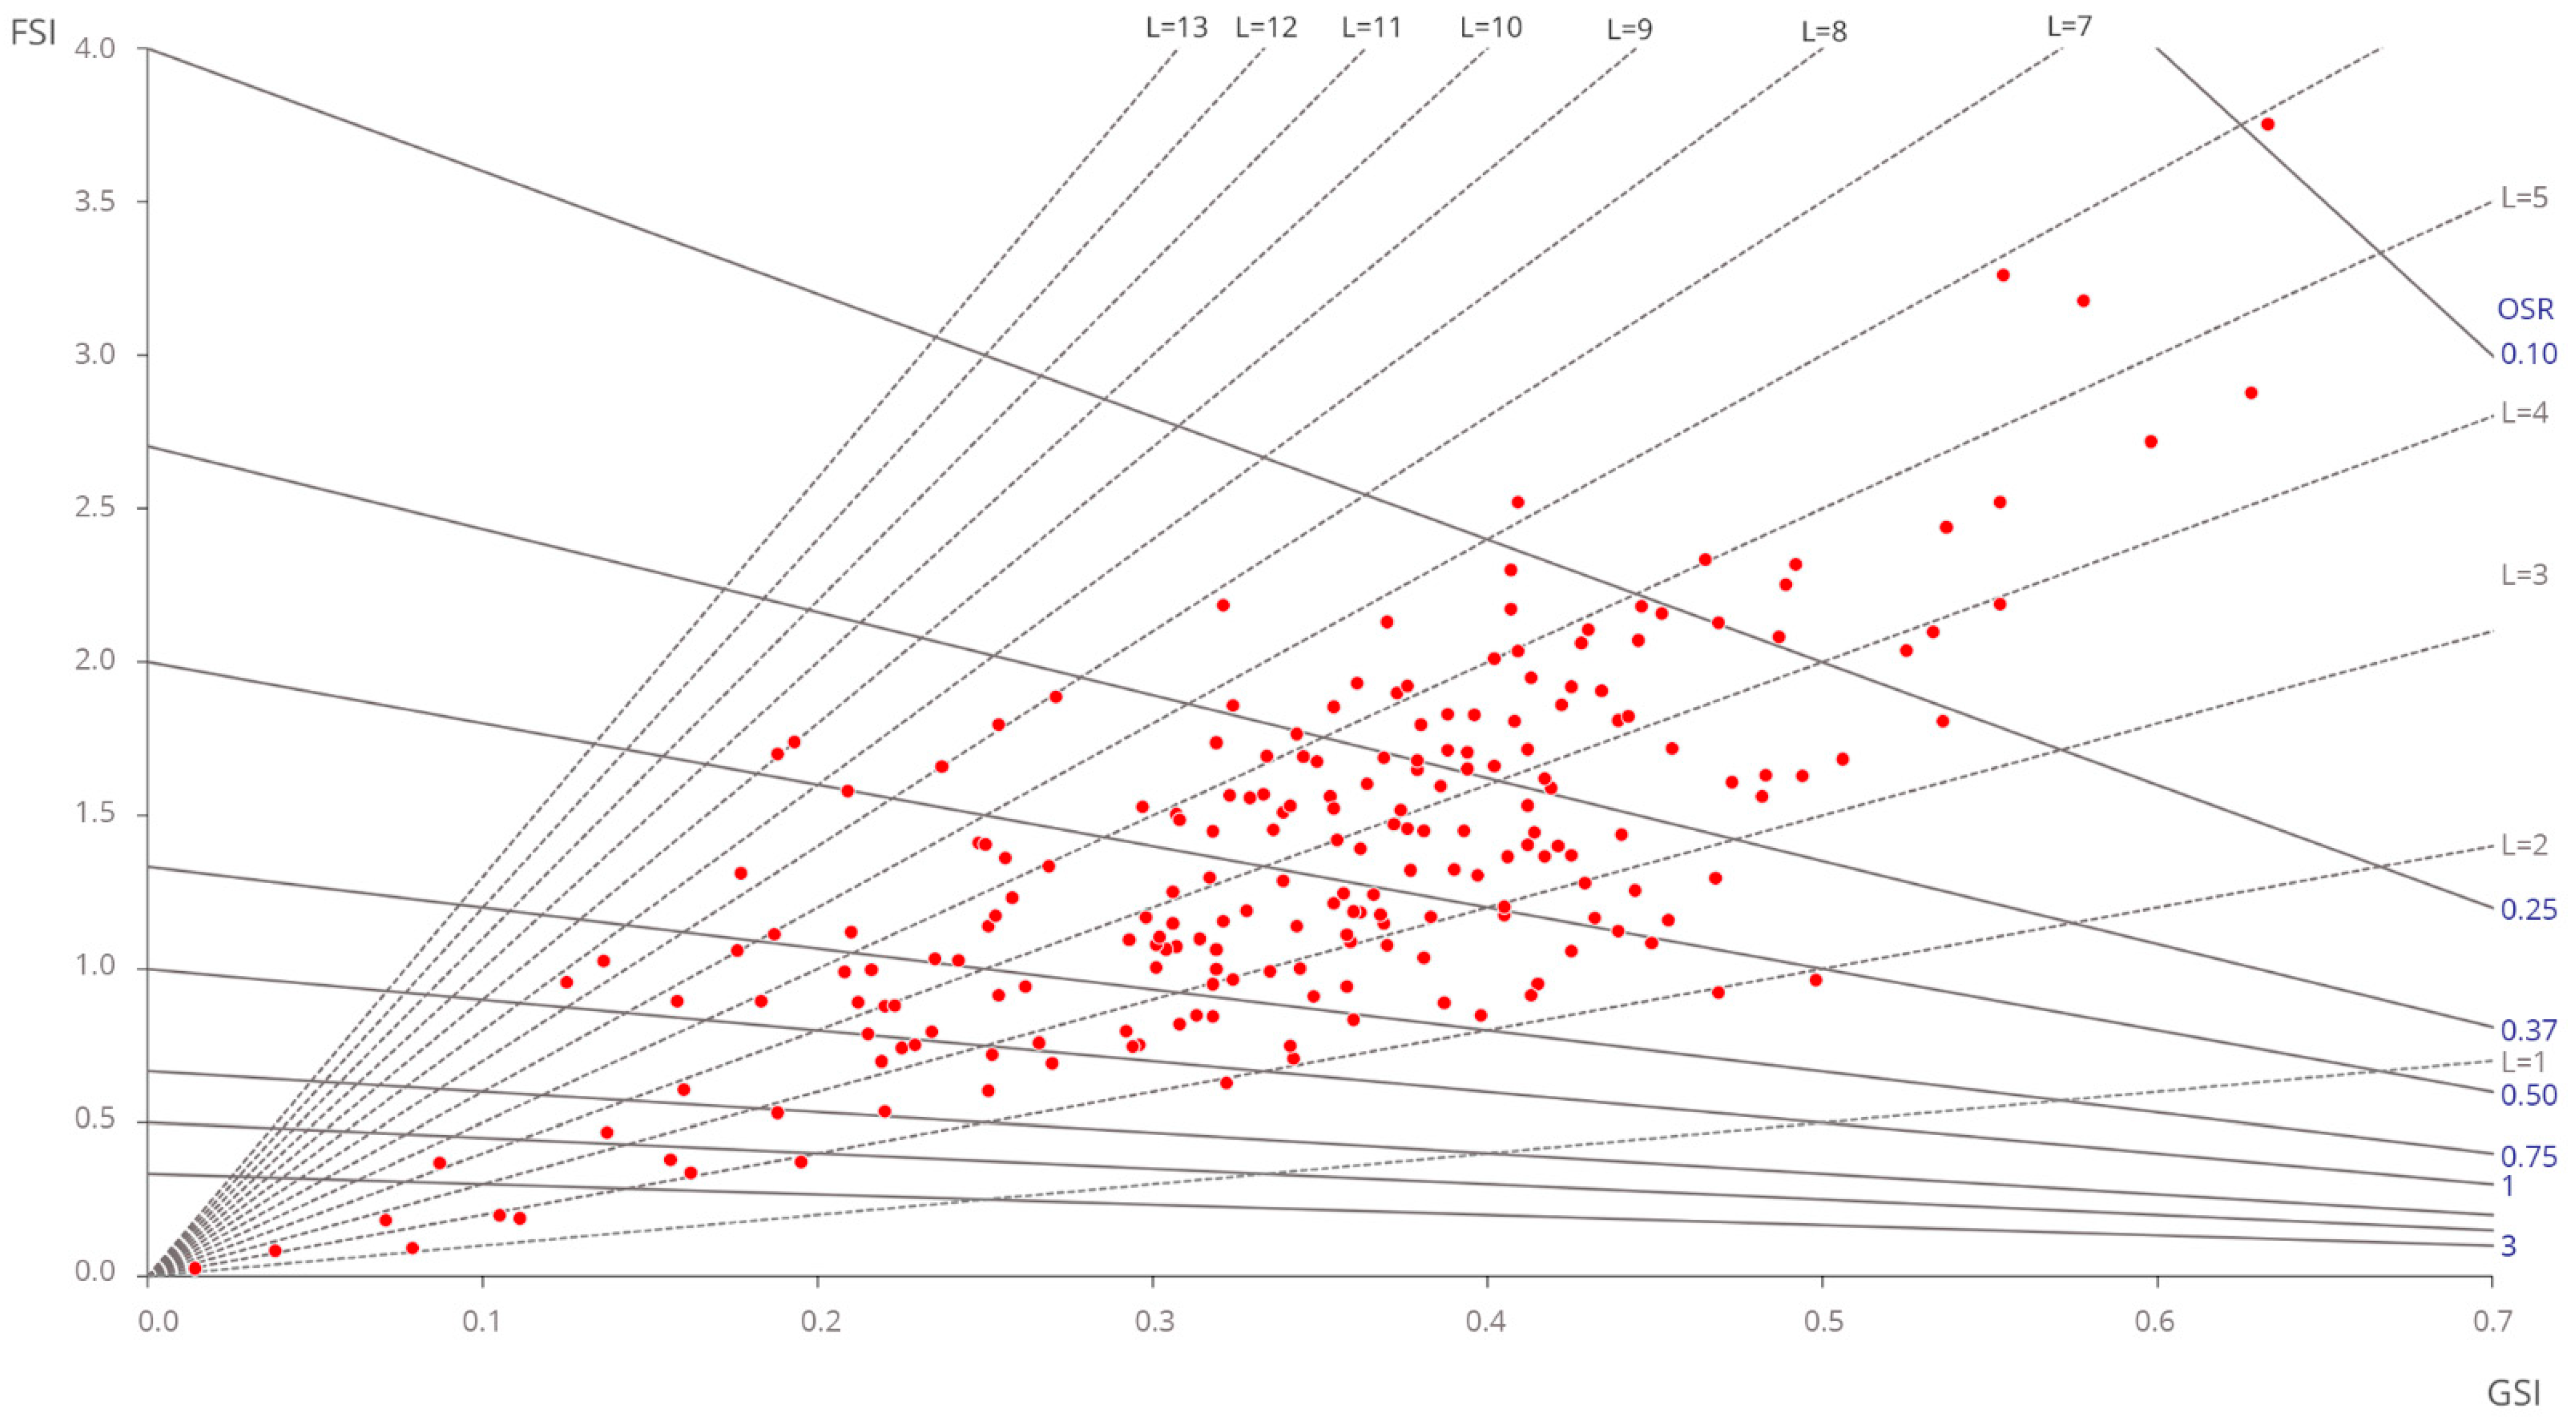
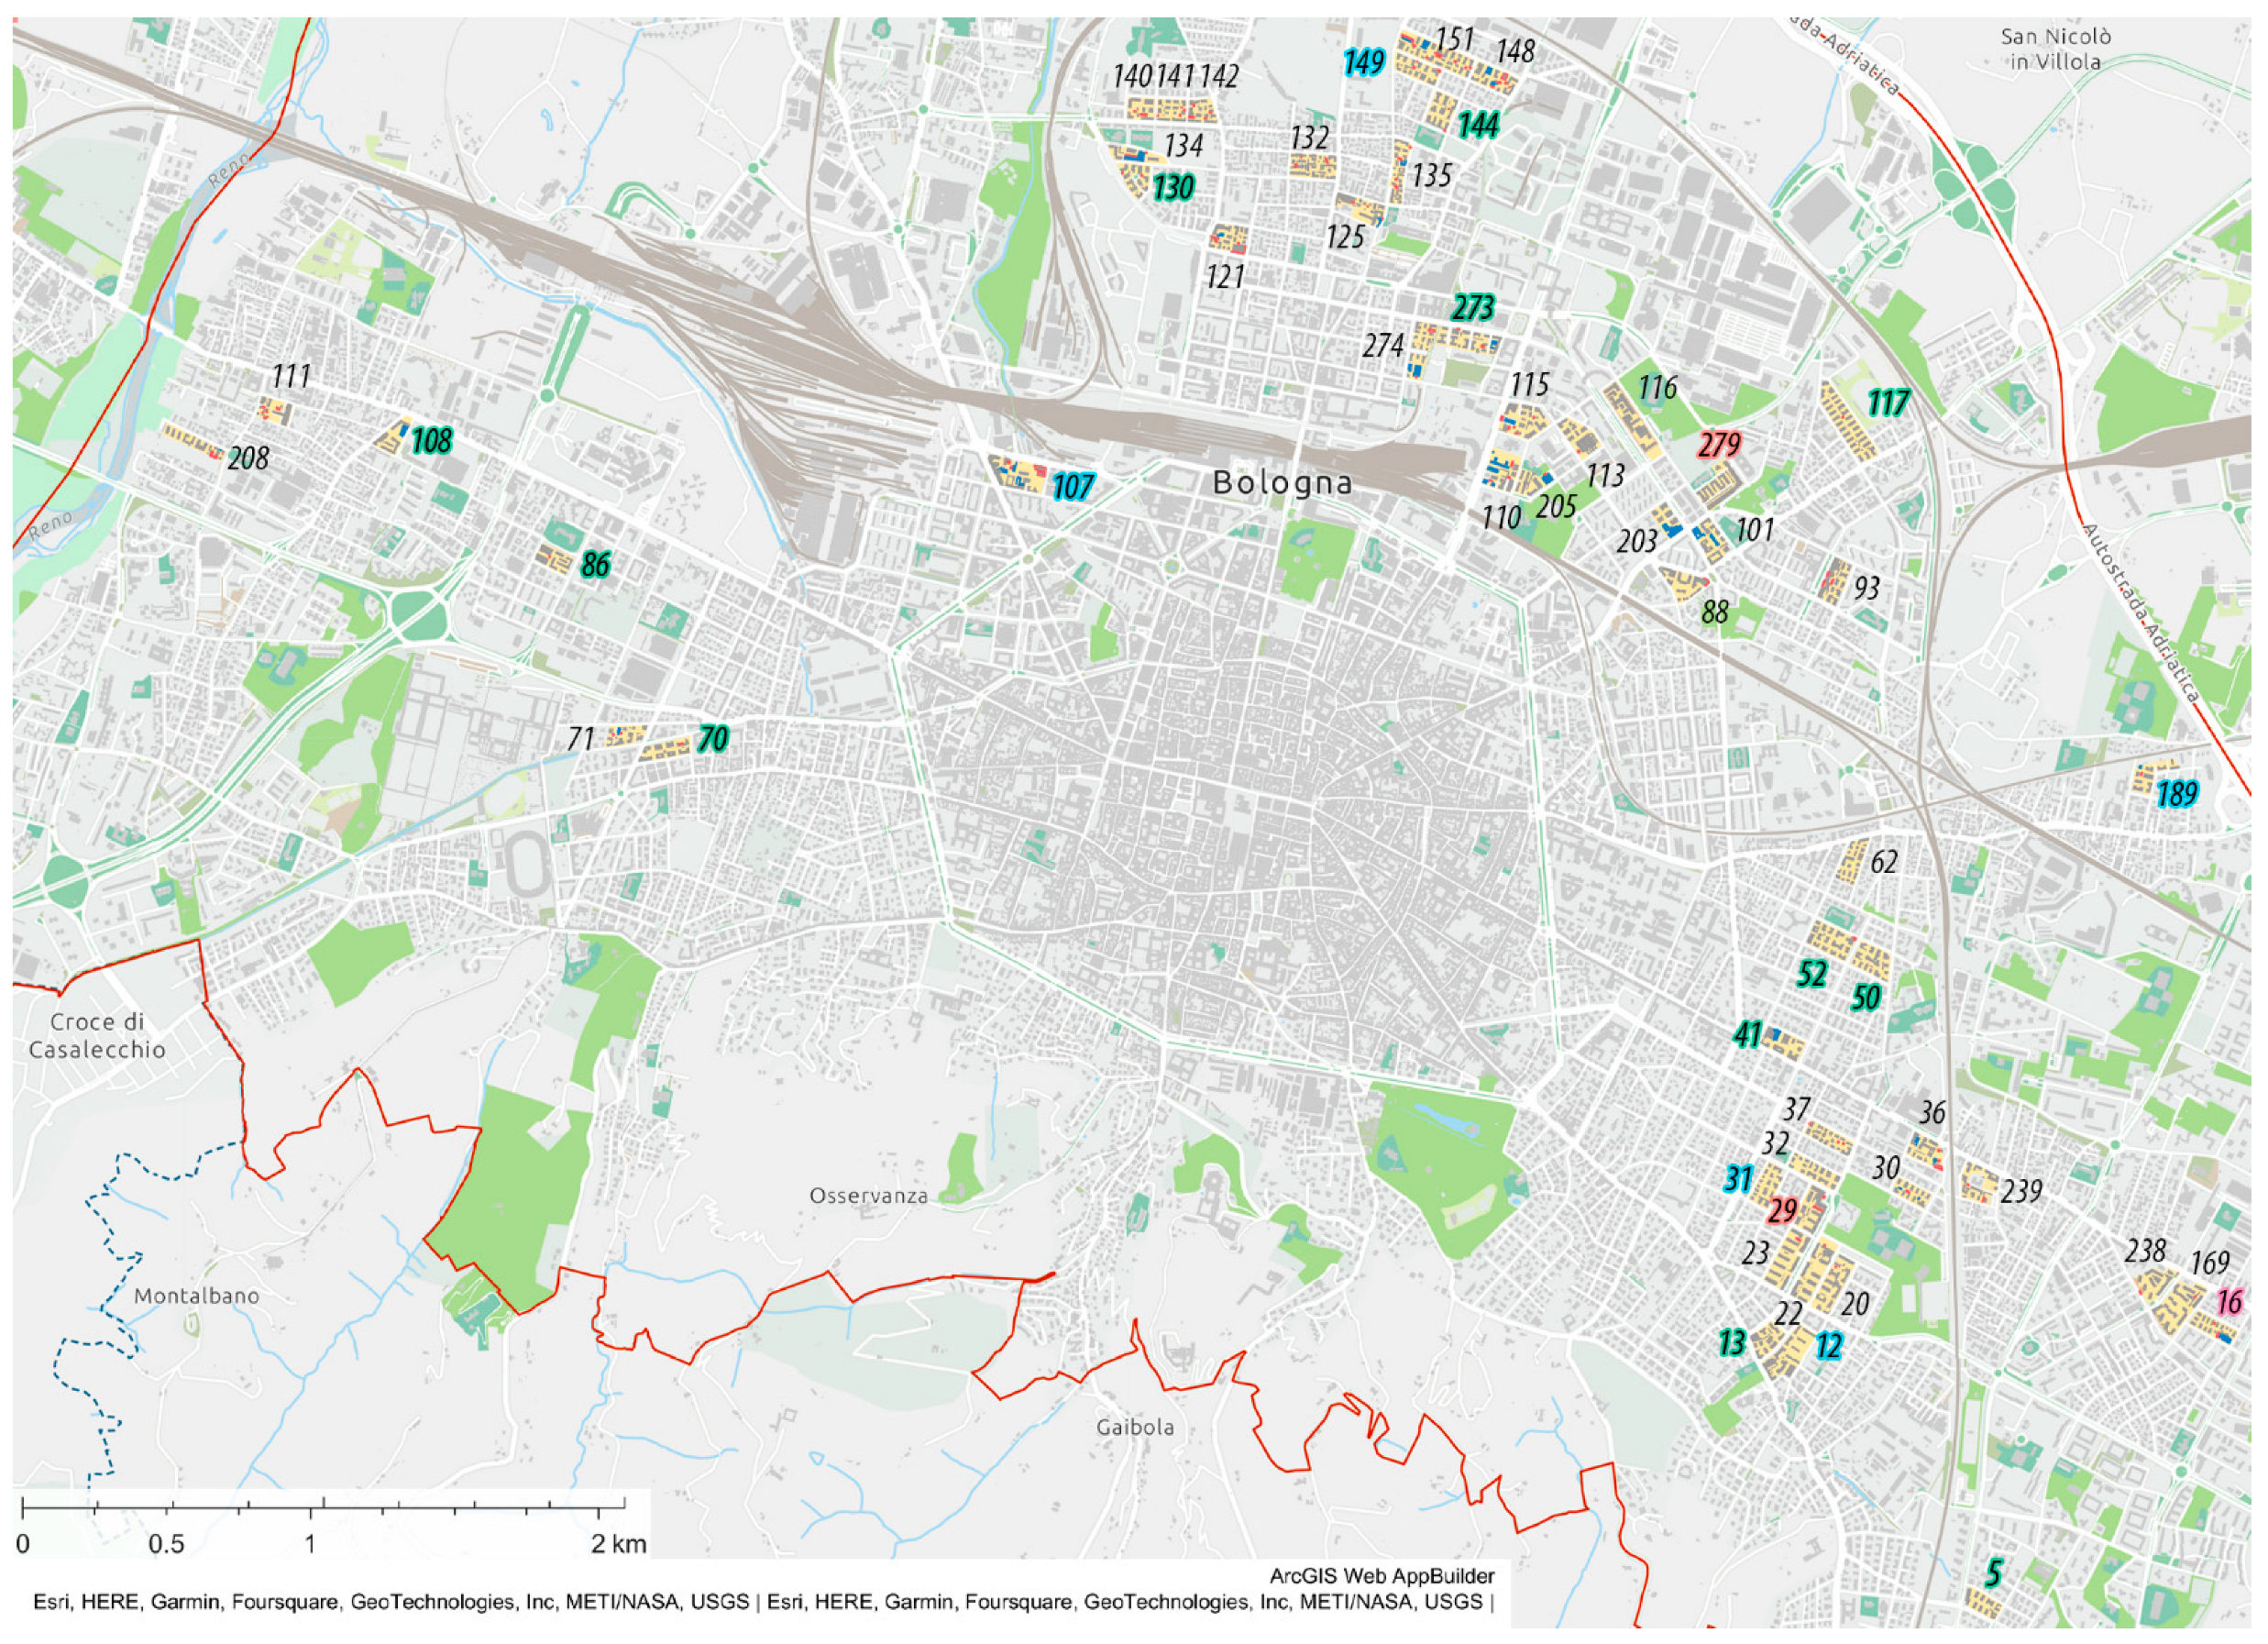
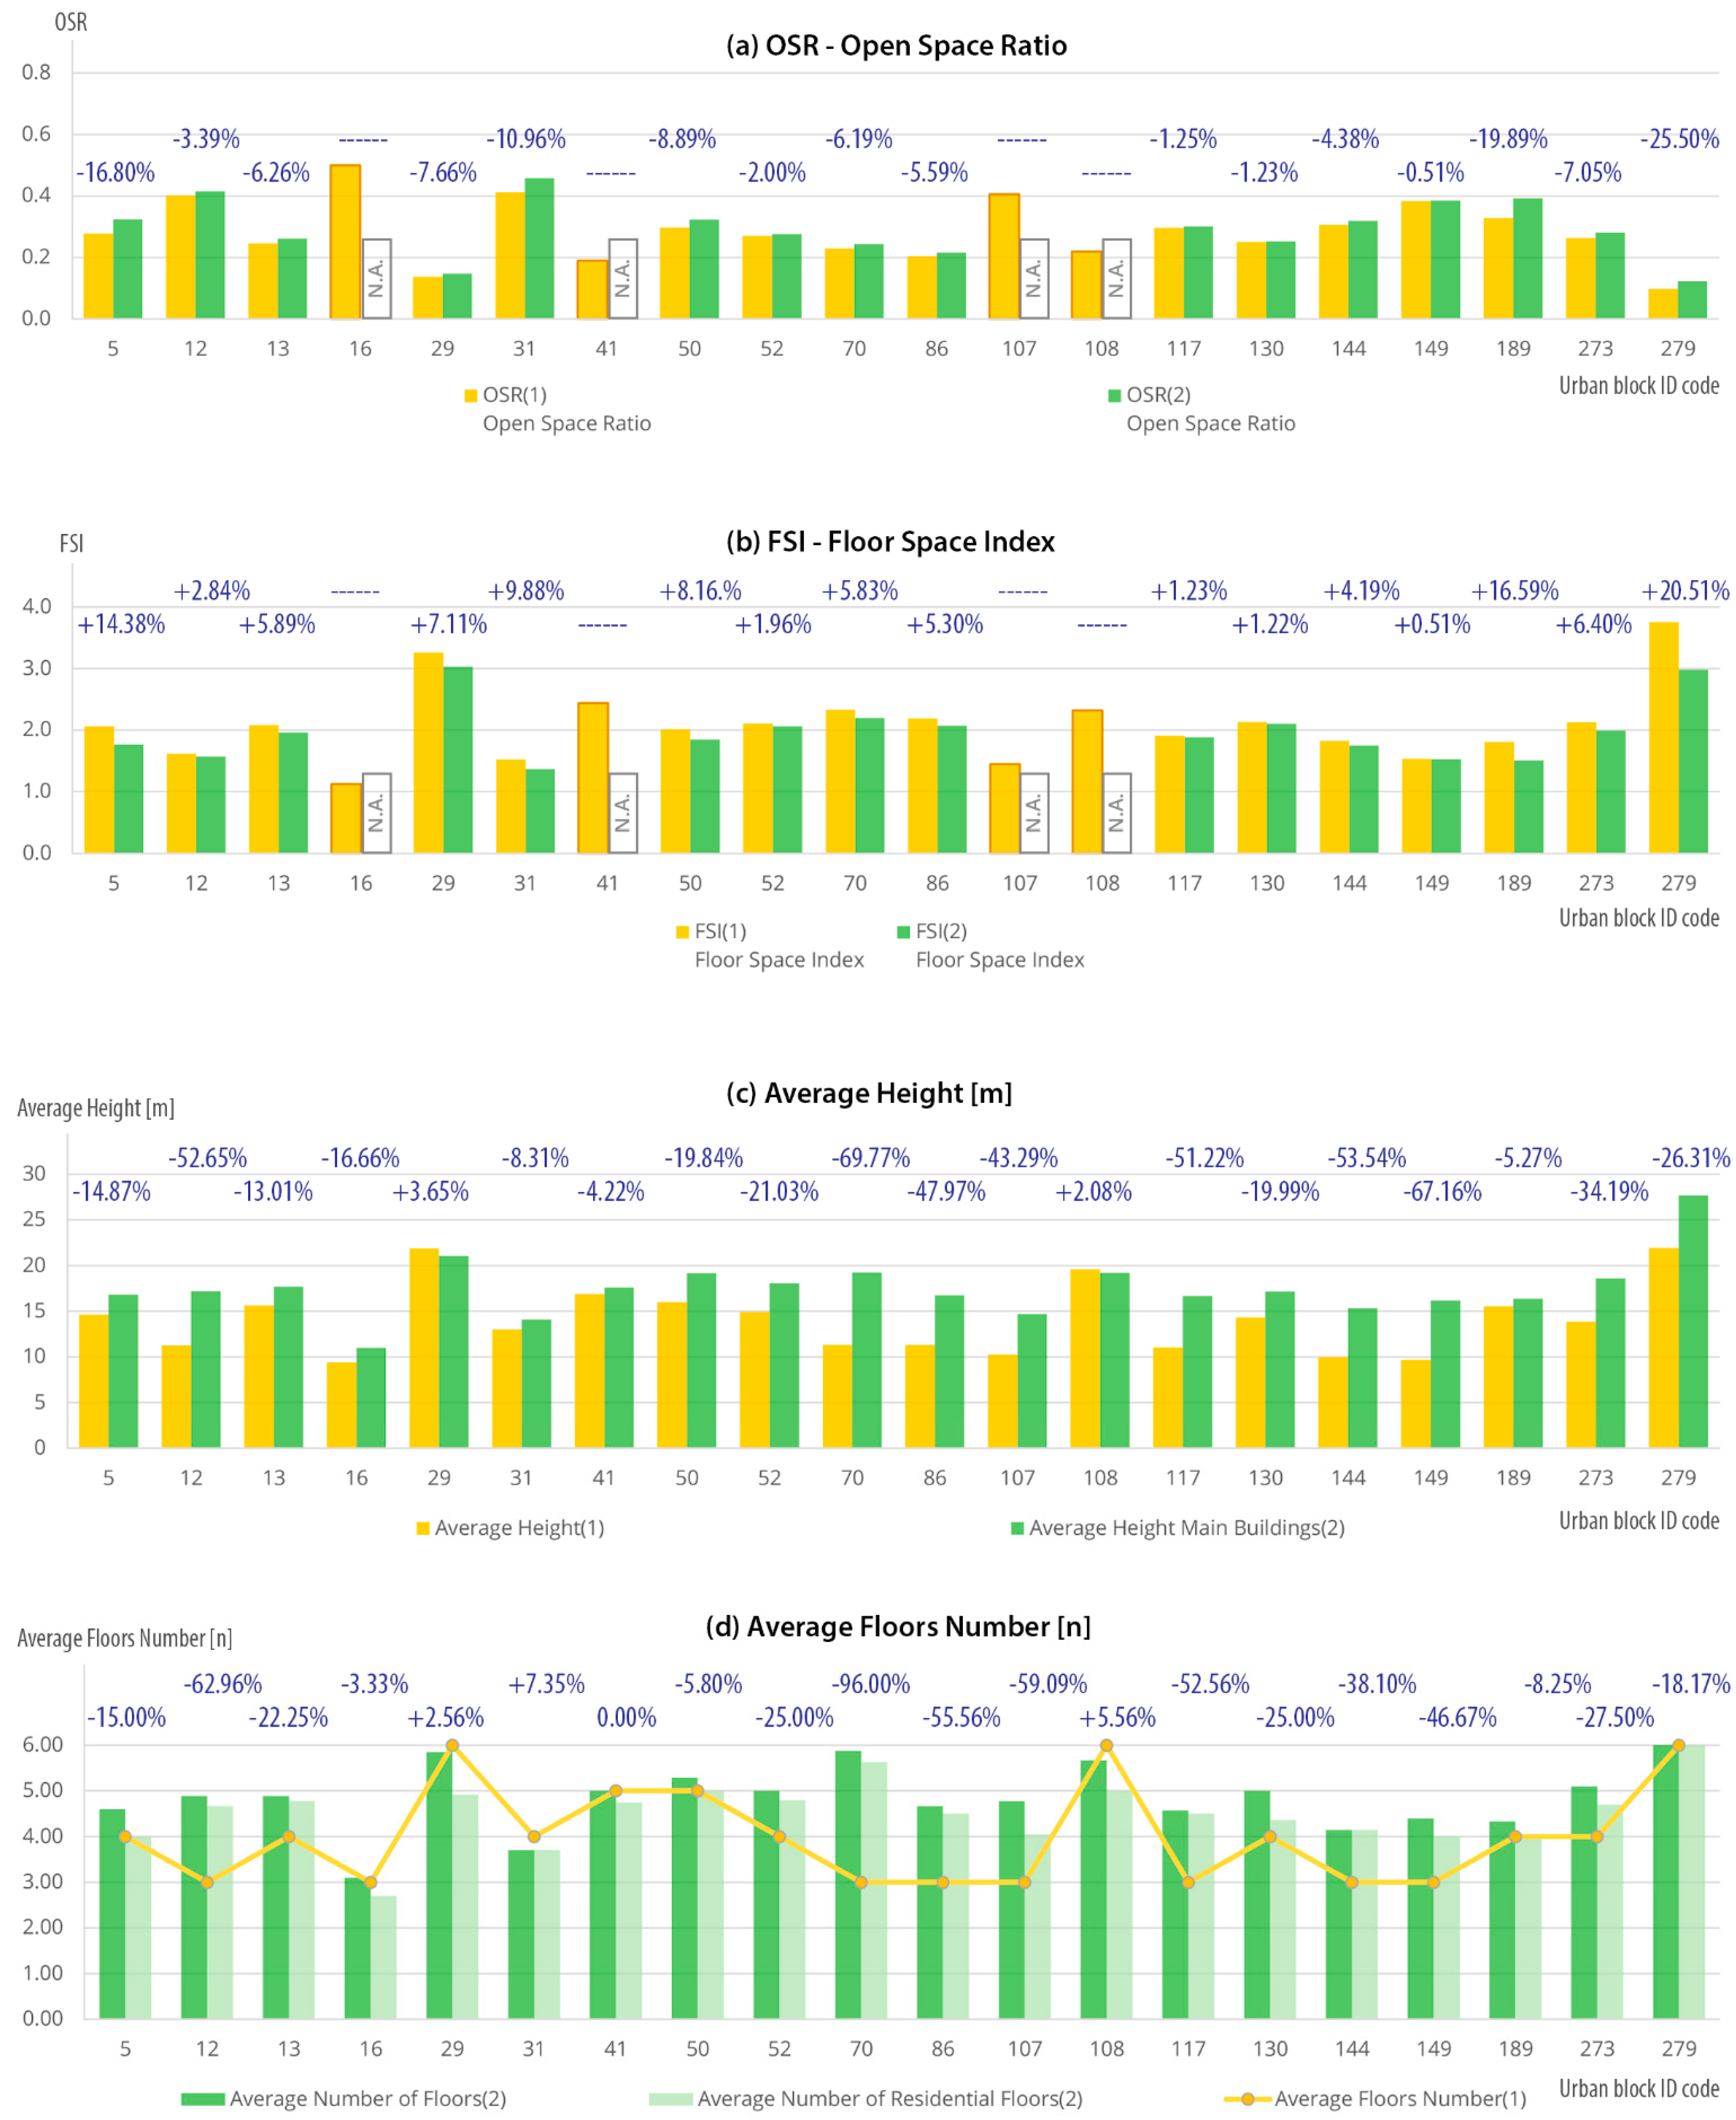
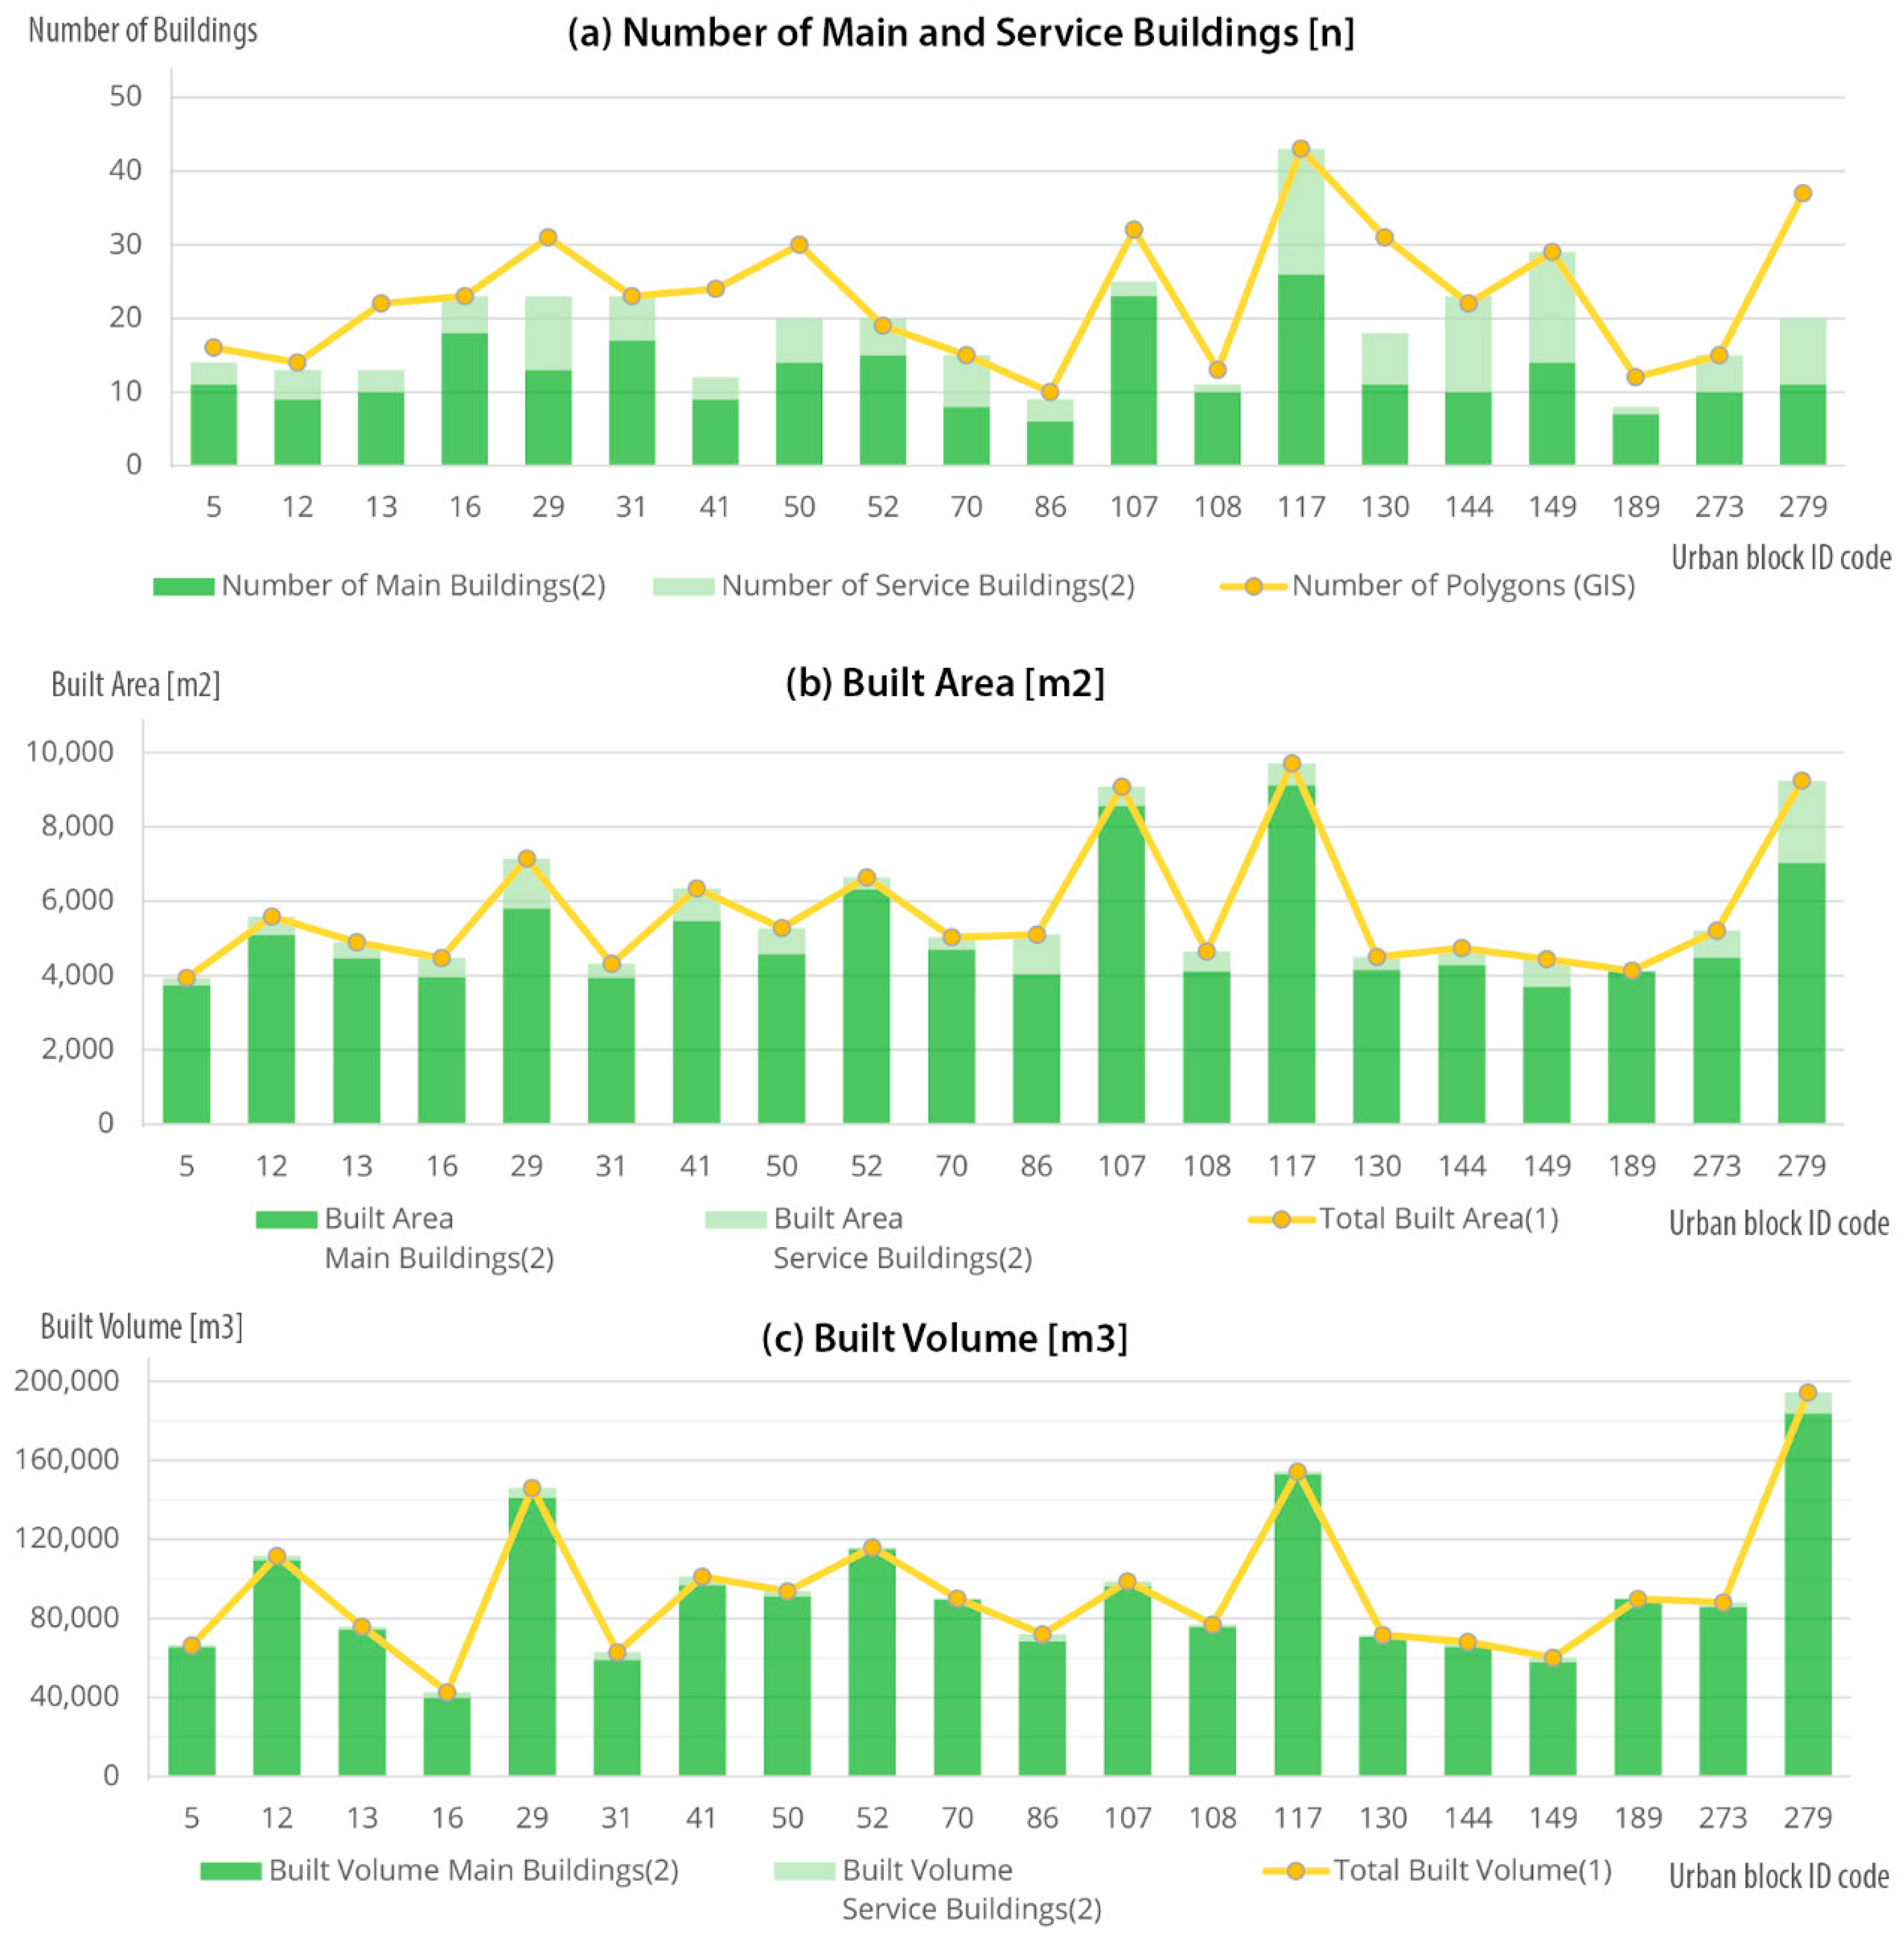
3.4. Typical Urban Blocks

Some of the data included in the dataset from archival permits and municipal georeferenced databases were analyzed for the same 20/55 urban blocks to obtain relevant values for the future definition of the building archetype. This is part of the process aimed at integrating the building stock with LCA and energy models and intervention scenarios in order to produce maps that municipalities and professionals can use as support for planning sustainable urban strategies.
This stage focuses on building type, namely some information belonging to the building data library, but also potential inhabitants’ data and other density parameters [42,43,55], more specifically:
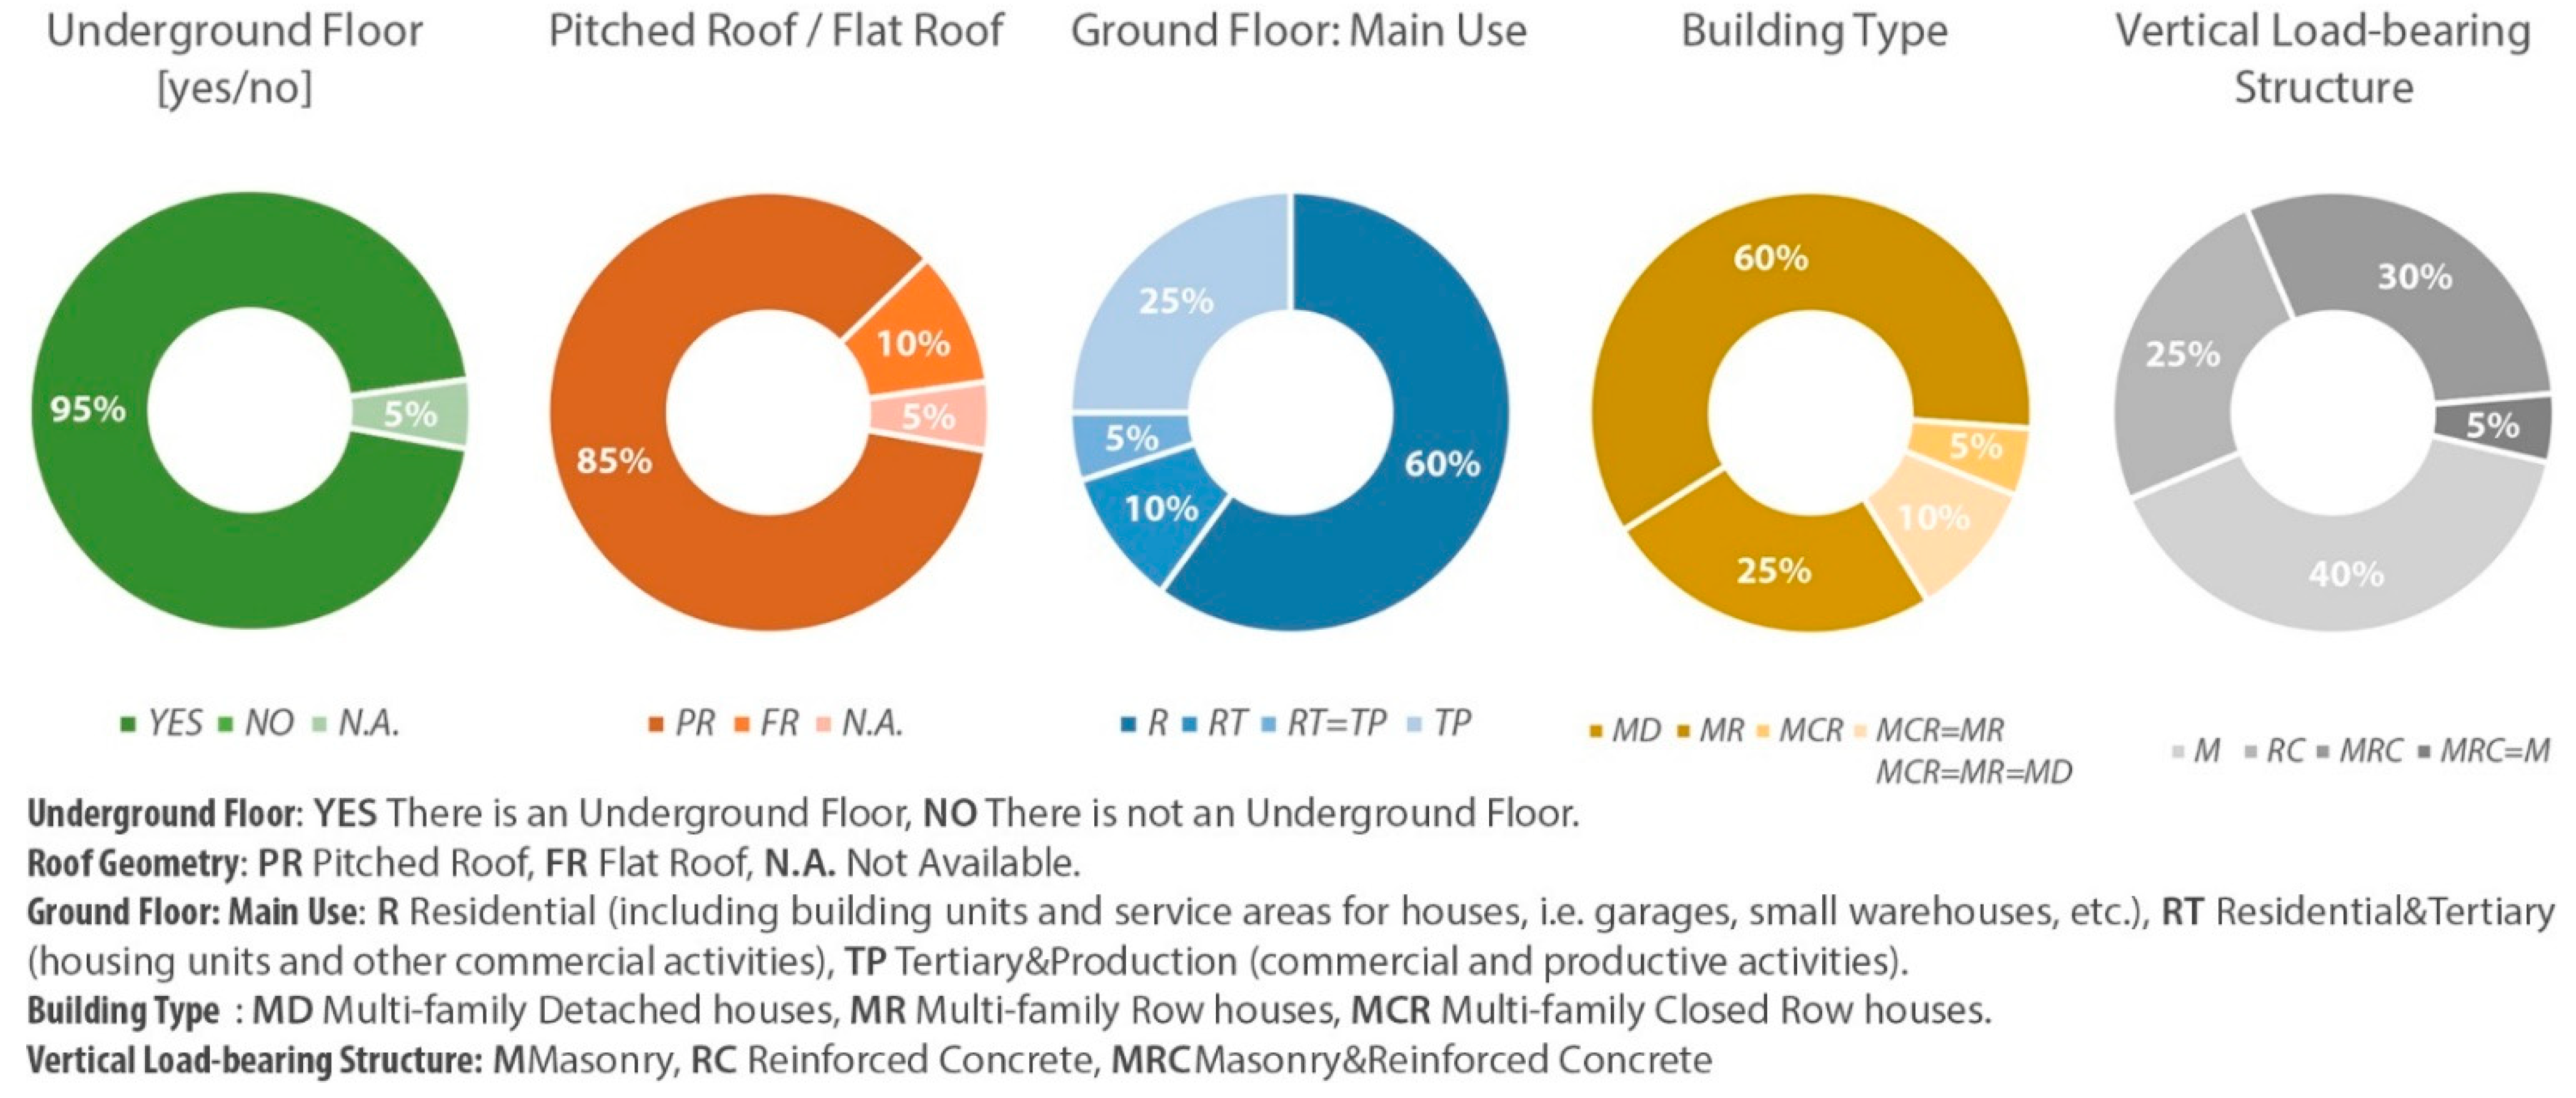
  • Presence of underground floor: YES, there is an underground floor; NO, there is not an underground floor.
  • Type of roof: PR Pitched Roof, FR Flat Roof.
  • Ground floor main use: R Residential (including building units and service areas for houses, i.e., garages, small warehouses, etc.), RT Residential and Tertiary (housing units and other commercial activities), RP Residential and Production (housing units and productive activities), TP Tertiary and Production (commercial and productive activities).
  • Building type [56,57]: S Single-family house, SD Single-family Detached house, M Multi-family houses, MD Multi-family Detached houses, MTe Multi-family Terraced houses, MR Multi-family Row houses, MCR Multi-family Closed Row house, MB Multi-family Balcony houses, MTo Multi-family Tower houses.
  • Vertical load-bearing structure: M Masonry, RC Reinforced Concrete, MRC Masonry and Reinforced Concrete.
  • Population density [42,43]: the total amount of people who are potentially residents and/or inhabited the building units in an urban block and is the ratio between the total number of occupants and the territorial area:
PD = Potential Inhabitants/Territorial Area [No. Inhabitants/m2]
  • Occupancy density: the ratio between the potential occupants of the building units and the total area of all residential floors in an urban block; it offers an indication in terms of surface available for each inhabitant [43]:
OD   =   Potential   Inhabitants / Residential   Gross   Floor   Area [ No .   Inhabitants / m 2 ]
  • Compactness: the ratio between the envelope area and the volume of a building. It expresses the impact of the shape on built volume and is useful for energy demand profile; more compact buildings are usually more energy efficient [58]:
CO = Envelope Area in m2/Volume in m3 [1/m]
  • Vertical density: this parameter is similar to the FSI, but instead of considering the impact of gross horizontal areas on the territorial surface, it studies the impact of vertical envelope surfaces of buildings on the territory. This value is useful to link energy behavior and urban morphology [42,55]:
VD = Envelope Area in m2/Territorial Area in m2 [-]
Analyses of the data for the sample of 20 urban blocks are intended to find the most recurrent values and to characterize them more precisely within their urban cluster.
In every urban block:
  • The underground level is widespread: in 70% of the areas, more than 78% of the buildings have an underground level, with an average value of 92%. Only in two urban blocks, the percentage of buildings with an underground level is lower than 78% (54% and 60%).
  • The pitched roof is extremely frequent: in 90% of the areas, pitched roofs are more frequent than flat roofs and in 50% of the urban block, more than 80% of the buildings have pitched roofs, with an average value of 95%. Only in two urban blocks, the percentage of the buildings with a flat roof exceeds the pitched ones and in the other 40% of urban blocks, the pitched roof is 50–73% diffused, with an average value of 59%.
  • The most frequent use for the ground floor is residential: in 60% of the areas, residential use is more frequent than the others, in 25% of the areas, “tertiary and productive use” is more frequent, and in 10% of the areas, “residential and tertiary use” is more frequent, and 5% has equal “tertiary and productive use” and “residential and tertiary use” as more frequent values for ground floor use.
  • The most frequent building type is multi-family row houses: in 60% of the areas, multi-family row houses are more frequent than the others, in 25% of the areas, multi-family detached houses are more frequent, and in 5% of the areas, multi-family closed-row houses are more frequent.
  • The most frequent vertical load-bearing structures are masonry (40%) and masonry with reinforced concrete (30%) and in 25% of the areas, the reinforced concrete structure is more frequent, while in the remaining 5%, there are equal masonry and reinforced concrete structures.
The most frequent value ranges for compactness, vertical density, population density, and occupancy density are presented in the table below (Table 4).
Finally, the building stock in the 20 urban blocks has an underground level (90%) and pitched roof (90%), more than half have housing units and services for housing on the ground floor (60%), and only a quarter host commercial activity (25%). The same result can be observed in the building type: 60% with multi-family row houses and 25% with multi-family detached houses, while for vertical load-bearing structure, there is not a dominant value: masonry is 30%, masonry with reinforced concrete is 40%, and reinforced concrete is 25% (Figure 12). Please refer to File S2 for a complete overview of all the values and frequency analyses.

4. Discussion

The presented process for defining the decision-support tools for strategic interventions on the building stock is complex and founded on the building stock’s knowledge base. The more precise, reliable, and accurate knowledge, the more effective the ensuing results and simulations are.
The procedure for urban fabrics characterization leads to the identification of eight different urban clusters that are the main reference for all the other analyses. The validation uses “real data” from archival research to evaluate the clusters and, despite the relevant variations in the number of floors, building height, and layers, these do not cause significant variations in FSI and OSR. Considering the implementation scale of this research, the urban clusters are still appropriate, but they can be implemented with:
A new parameter for vertical development, such as the maximum building height and maximum number of floors;
A new relationship between the value of L (layers) and the average number of floors. It can be deepened using data from archival permits and service buildings’ consistency.
However, the matching process—that allows for the validation—is very energy expensive and this is an effective barrier to extend this research’s application. From this perspective, the most feasible future development is to complete the matching within 55 urban blocks and find rules and links through archetypes and other analyses to refine the first results and adopt them in other contexts.
This contribution presents the first results of building data analysis in terms of typology and construction characteristics to identify some recurrent features of a subset of urban blocks towards the definition of the archetypes. Compactness and vertical density combined with the other density parameters can further describe and characterize the urban blocks from a morphological and typological point of view. Moreover, population density and occupancy density can be used as social indicators, giving insights into the quantity of residential surface potentially available for each inhabitant (OD) and the population pressure in the urban block (PD) and setting a baseline for comparing R4R interventions.

5. Conclusions

The most delicate and complex phase of the methodology for GIS integration of large-scale LCA is the identification of archetypes. This process is still ongoing and the following steps of the present research will focus on the points outlined below:
The study of the relation between the building data, other density parameters and dimensional data, and construction ones, so that every archetype has the following typical values: built floor surface, the average number of floors or layers, building type, roof type, underground level, ground floor use, vertical/load-bearing structure, and construction data (walls, slabs, finishings, etc.).
Simplified energy simulations of each archetype, the correlation of energy consumption with building typology, population density, and construction characteristics to evaluate environmental performance in the use stage and potentially prioritize interventions at the urban scale.
LCA analysis on each archetype in different intervention scenarios (renovation/energy refurbishment or R4R). The evaluation of environmental performance following the LCA methodology integrated into GIS maps allows for comparison between the different intervention scenarios.
Design proposals for new constructions, which follow specific requirements so that new archetypes will be defined and potentially replace the existing ones. In this case, the evaluation matrix can be a valuable support for assessing the effects of R4R interventions at the urban block scale.
The final product of the research is a tool that local administrations and professionals can use before the interventions on the existing building stock to easily find out the environmental impacts of different strategies. The methodology herein described consists of a detailed and time-expensive procedure to collect, organize, and use “real data” on buildings that are implemented in a software GIS in order to create georeferenced maps (and also 3D-city models), where you can directly visualize the consequences of different scenarios and rates of interventions. Moreover, the future identification of some building archetypes, based on different building library data, can be extended to the entire existing stock of Bologna and used for other research interests. This GIS-based methodology for urban fabric characterization can be applied to other contexts with other aims by using georeferenced databases and archival documentation.

Supplementary Materials

The following supporting information can be downloaded at: https://www.mdpi.com/article/10.3390/su142113740/s1, File S1 includes all the values of buildings and urban blocks used for density analyses and Bologna “Spacemate”; File S2 includes all the values for buildings, urban blocks, and variations in parameters used for the validation procedure and the data used for frequency analyses to identify typical values for the 20 urban blocks (Section 3.3).

Author Contributions

Conceptualization, A.C.B., C.C., R.G. and G.P.; methodology, A.C.B., C.C., R.G. and G.P.; software, A.C.B. and C.C.; validation, A.C.B., C.C. and R.G.; formal analysis, A.C.B. and C.C.; investigation, A.C.B. and C.C.; resources, A.C.B. and C.C.; data curation, A.C.B. and C.C.; writing—original draft preparation, A.C.B.; writing—review and editing, A.C.B., C.C. and R.G.; visualization, A.C.B.; supervision, R.G. and G.P.; project administration, R.G. and G.P. All authors have read and agreed to the published version of the manuscript.

Funding

This research received no external funding.

Institutional Review Board Statement

Not applicable.

Informed Consent Statement

Not applicable.

Data Availability Statement

All the geodatabases are available online: “Open Data Bologna” https://opendata.comune.bologna.it/pages/home/, and “Comune di Bologna–Mappe Online” http://sitmappe.comune.bologna.it/pugviewer/#!/app/map/default (accessed on 26 August 2022).

Acknowledgments

This paper is part of doctoral research (Department of Architecture, University of Bologna); during the first year, the archival research was carried out at “Archivio Storico Comunale di Bologna” (Historic Archive of the Municipality of Bologna), “SUE-Sportello Unico per l’Edilizia del Comune di Bologna” (One-stop Shop for Construction of the Municipality of Bologna) Digital Archive, and at “SIT-Sistema Informativo Territoriale del Comune di Bologna” (Geographic Information System of the Municipality of Bologna). The authors are grateful to the Municipality of Bologna and its offices for their availability.

Conflicts of Interest

The authors declare no conflict of interest.

References

  1. Masson-Delmotte, V.; Zhai, P.; Pirani, A.; Connors, S.L.; Péan, C.; Berger, S.; Caud, N.; Chen, Y.; Goldfarb, L.; Gomis, M.I.; et al. (Eds.) IPCC, 2021: Summary for Policymakers. In Climate Change 2021: The Physical Science Basis; Contribution of Working Group I to the Sixth Assessment Report of the Intergovernmental Panel on Climate Change; Cambridge University Press: Cambridge, UK; New York, NY, USA, 2021; p. 7. [Google Scholar] [CrossRef]
  2. Rockström, J.; Steffen, W.; Noone, K.; Persson, Å.; Chapin, F.S., III; Lambin, E.; Lenton, T.M.; Scheffer, M.; Folke, C.; Schellnhuber, H.J.; et al. Planetary boundaries: Exploring the safe operating space for humanity. Ecol. Soc. 2020, 14, 32. Available online: http://www.ecologyandsociety.org/vol14/iss2/art32/ (accessed on 14 September 2022). [CrossRef]
  3. Lade, S.J.; Steffen, W.; De Vries, W.; Carpenter, S.R.; Donges, J.F.; Gerten, D.; Hoff, H.; Newbold, T.; Richardson, K.; Rockström, J. Human impacts on planetary boundaries amplified by Earth system interactions. Nat. Sustain. 2020, 3, 119–128. [Google Scholar] [CrossRef]
  4. Core Writing Team; Pachauri, R.K.; Meyer, L.A. (Eds.) IPCC, 2014: Climate Change 2014: Synthesis Report; Contribution of Working Groups I, II and III to the Fifth Assessment Report of the Intergovernmental Panel on Climate Change; Intergovernmental Panel on Climate Change (IPCC): Geneva, Switzerland, 2014; Volume 151, pp. 44–47. [Google Scholar]
  5. Butera, F.M. Affrontare la Complessità. Per Governare la Transizione Ecologica; Edizioni Ambiente: Milano, Italy, 2021; pp. 33–44. [Google Scholar]
  6. Climate Watch. World Resources Institute: Washington, DC, USA. 2022. Available online: https://www.climatewatchdata.org (accessed on 29 September 2022).
  7. World Resources Institute. World Greenhouse Gas Emissions. 2019. Available online: https://www.wri.org/data/world-greenhouse-gas-emissions-2019 (accessed on 29 September 2022).
  8. United Nations, Department of Economic and Social Affairs, Population Division. World Urbanization Prospects: The 2018 Revision (ST/ESA/SER.A/420); United Nations: New York, NY, USA, 2019; pp. 9–11. [Google Scholar]
  9. Ellen MacArthur Foundation. Circular Cities: Thriving, Liveable, Resilient. Available online: https://ellenmacarthurfoundation.org/topics/cities/overview (accessed on 26 August 2022).
  10. Wei, T.; Wu, J.; Chen, S. Keeping Track of Greenhouse Gas Emission Reduction Progress and Targets in 167 Cities Worldwide. Front. Sustain. Cities 2021, 3, 696381. [Google Scholar] [CrossRef]
  11. C40 Cities. Arup. University of Leeds. In The Future of Urban Consumption in a 1.5 °C World; Headline Report; C40 Cities Climate Leadership Group: New York, NY, USA; Arup: London, UK; University of Leeds: Leeds, UK, 2019; Available online: https://www.arup.com/perspectives/publications/research/section/the-future-of-urban-consumption-in-a-1-5c-world (accessed on 14 September 2022).
  12. C40 Cities. Available online: https://www.c40.org/ (accessed on 29 September 2022).
  13. IRP. Resource Efficiency and Climate Change, 2020, and UN. Environment Emissions Gap Report, 2019. In A Renovation Wave for Europe—Greening Our Buildings, Creating Jobs, Improving Lives; COM (2020) 662 Final, European Commission: Brussels, Belgium, 2020. [Google Scholar]
  14. European Commission. A Renovation Wave for Europe—Greening Our Buildings, Creating Jobs, Improving Lives; COM(2020) 662 Final; European Commission: Brussels, Belgium, 2020. [Google Scholar]
  15. European Commission. The European Green Deal; COM(2019) 640 final; European Commission: Brussels, Belgium, 2019. [Google Scholar]
  16. European Commission. A New Circular Economy Action Plan for a Cleaner and More Competitive Europe; COM(2020) 98 Final; European Commission: Brussels, Belgium, 2020. [Google Scholar]
  17. European Parliament. New Circular Economy Action Plan; European Parliament Resolution of 10 February 2021 on the New Circular Economy Action Plan (2020/2077(INI); European Parliament: Strasbourg, France, 2021. [Google Scholar]
  18. European Commission. Circular Economy—Principles for Building Design, 2020. In EDA European Demolition Association. Available online: https://www.europeandemolition.org/library/documents/circular-economy-principles-for-buildings-design (accessed on 26 August 2022).
  19. LETI London Energy Transformation Initiative. LETI Embodied Carbon Primer Supplementary Guidance to the Climate Emergency Design Guide, 2020. Available online: https://www.leti.london/ecp (accessed on 26 August 2022).
  20. ENEA. Rapporto Annuale sull’Efficienza Energetica, Efficienza Energetica negli Edifici. In Rapporto Annuale sull’Efficienza Energetica 2021; Fiorini, A., Viola, C., Eds.; ENEA: Rome, Italy, 2021; pp. 102–125. [Google Scholar]
  21. Ministerial Decree of 11 October 2017, Minimum Environmental Criteria for the Awarding of Design Services and Works for the New Construction, Renovation and Maintenance of Public Buildings. Available online: https://www.gazzettaufficiale.it/eli/gu/2017/11/06/259/sg/pdf (accessed on 14 September 2022).
  22. Ferrari, S.; Zagarella, F.; Caputo, P.; Dall’O’, G. A GIS-Based Procedure for Estimating the Energy Demand Profiles of Buildings towards Urban Energy Policies. Energies 2021, 14, 5445. [Google Scholar] [CrossRef]
  23. Ferrari, S.; Zagarella, F.; Caputo, P.; Dall’O’, G. Mapping Buildings’ Energy-Related Features at Urban Level toward Energy Planning. Buildings 2021, 11, 322. [Google Scholar] [CrossRef]
  24. Mastrucci, A.; Marvuglia, A.; Benetto, E.; Leopold, U. A spatio-temporal life cycle assessment framework for building renovation scenarios at the urban scale. Renew. Sust. Energy Rev. 2020, 126, 109834. [Google Scholar] [CrossRef] [Green Version]
  25. Helsinki, Heating Demand and Climate Atlas. Available online: https://kartta.hel.fi/3d/heating/Apps/Helsinki/view.html (accessed on 29 September 2022).
  26. Rossknecht, M.; Airaksinen, E. Concept and Evaluation of Heating Demand Prediction Based on 3D City Models and the CityGML Energy ADE—Case Study Helsinki. ISPRS Int. J. Geo-Inf. 2020, 9, 602. [Google Scholar] [CrossRef]
  27. CRESME; CNAPPC. Chi Ha Progettato l’Italia? Ruolo Dell’architettura nella Qualità del Paesaggio Edilizio Italiano; Centro Ricerche Economiche Sociologiche e di Mercato nell’Edilizi (CRESME); Consiglio Nazionale degli Architetti, Pianificatori, Paesaggisti e Conservatori (CNAPPC): Rome, Italy, 2017. [Google Scholar]
  28. ISTAT. Annuario Statistico Italiano, Capitolo 18 Costruzioni. In Annuario Statistico Italiano; The Italian National Institute of Statistics (ISTAT): Rome, Italy, 2019. [Google Scholar]
  29. ISTAT. Censimento Popolazione Abitazioni, Edifici Residenziali. Available online: http://dati-censimentopopolazione.istat.it/Index.aspx?DataSetCode=DICA_EDIFICIRES (accessed on 26 August 2022).
  30. Benedetti, A.C.; Costantino, C.; Gulli, R. Digital Georeferenced Archives: Analysis and Mapping of Residential Construction in Bologna in the Second Half of the Twentieth Century. TEMA 2021, 7, 17–27. [Google Scholar] [CrossRef]
  31. Mastrucci, A.; Popovici, E.; Marvuglia, A.; De Sousa, L.; Benetto, E.; Leopold, U. GIS-based Life Cycle Assessment of urban building stocks retrofitting A bottom-up framework applied to Luxembourg. In EnviroInfo and ICT for Sustainability 2015; Atlantis Press: Amsterdam, The Netherlands, 2015; pp. 47–56. [Google Scholar] [CrossRef]
  32. Spirou-Sioula, K.; Ioannidis, C.; Potsiou, C. Technical aspects for 3D hybrid cadastral model. Surv. Rev. 2013, 45, 419–427. [Google Scholar] [CrossRef]
  33. Ketzler, B.; Naserentin, V.; Latino, F.; Zangelidis, C.; Thuvander, L.; Logg, A. Digital Twins for Cities: A State of the Art Review. Built Environ. 2020, 46, 547–573. [Google Scholar] [CrossRef]
  34. Gil, J. City Information Modelling: A Conceptual Framework for Research and Practice in Digital Urban Planning. Built Environ. 2020, 46, 501–527. [Google Scholar] [CrossRef]
  35. Rotterdam 3D. Available online: https://www.3drotterdam.nl/#/ (accessed on 26 August 2022).
  36. Boston 3D Buildings as of August 2021. Available online: https://boston.maps.arcgis.com/apps/webappviewer3d/index.html?id=cf3415dea19d480caa71eb5dbdce185f (accessed on 26 August 2022).
  37. City of Helsinki, Helsinki 3D. Available online: https://www.hel.fi/helsinki/en/administration/information/general/3d/ (accessed on 26 August 2022).
  38. Open Data, Comune di Bologna. Available online: https://opendata.comune.bologna.it/pages/home/ (accessed on 26 August 2022).
  39. Benedetti, A.C.; Costantino, C.; Gulli, R. Towards the definition of decision-support tools for sustainable planning of urban peripheries. The case study of Bologna. In Proceedings of the Colloqui.AT.e 2022 Memoria e Innovazione, Genova, Italy, 7–10 September 2022. [Google Scholar]
  40. Benedetti, A.C.; Costantino, C.; Gulli, R. Archivi digitali georeferenziati: Analisi e rappresentazione dello sviluppo dell’edilizia residenziale a Bologna nella seconda metà del Novecento. In Proceedings of the Colloqui.AT.e 2020 New Horizons for Sustainable Architecture—Nuovi Orizzonti per L’architettura Sostenibile, Catania, Italy, 10 December 2020. [Google Scholar]
  41. Cartografie e Foto Storiche, Consultazione Comparata, Comune di Bologna. Available online: http://sitmappe.comune.bologna.it/fotostoriche/ (accessed on 26 August 2022).
  42. Morganti, M. Ambiente Costruito Mediterraneo. Forma, Densità ed Energia; EdicomEdizioni: Monfalcone, Italy, 2018; pp. 73–96. [Google Scholar]
  43. Boyko, C.; Cooper, R. Clarifying and re-conceptualizing density. Prog. Plan. 2011, 76, 1–61. [Google Scholar] [CrossRef]
  44. Berghauser Pont, M.; Haupt, P. The Spacemate: Density and the typomorphology of the urban fabric. Nord. J. Archit. Res. 2005, 4, 55–68. [Google Scholar]
  45. Bartolini, A. Fenomeni di Transizione degli Organismi Edilizi, Criteri Operativi di Inserimento Ambientale e Procedure di Intervento. Doctoral Thesis, Alma Mater Studiorum Università di Bologna, Bologna, Italy, 2013. [Google Scholar]
  46. Lehmann, S. Green Urbanism: Formulating a Series of Holistic Principles. SAPI EN. S. Surv. Perspect. Integr. Environ. Soc. 2010, 3. Available online: https://journals.openedition.org/sapiens/1057 (accessed on 3 October 2022).
  47. Butera, F.M. Energy and Resource Efficient Urban Neighbourhood Design Principles for Tropical Countries: A Practitioner’s Guidebook; United Nations Human Settlements Programme (UN-Habitat): Nairobi, Kenya, 2018. [Google Scholar]
  48. Wang, Q.; Laurenti, R.; Holmberg, S. A novel hybrid methodology to evaluate sustainable retrofitting in existing Swedish residential buildings. Sustain. Cities Soc. 2015, 16, 24–38. [Google Scholar] [CrossRef]
  49. Mastrucci, A.; Marvuglia, A.; Leopold, U.; Benetto, E. Life Cycle Assessment of building stocks from urban to transnational scales: A review. Renew. Sust. Energy Rev. 2017, 74, 316–332. [Google Scholar] [CrossRef]
  50. Swan, L.G.; Ugursal, V.I. Modeling of end-use energy consumption in the residential sector: A review of modeling techniques. Renew. Sust. Energy Rev. 2009, 13, 1819–1835. [Google Scholar] [CrossRef]
  51. Moschetti, R.; Mazzarella, L.; Nord, N. An overall methodology to define reference values for building sustainability parameters. Energy Build. 2015, 88, 413–427. [Google Scholar] [CrossRef] [Green Version]
  52. Corrado, V.; Ballarini, I.; Corgnati, S.P. Fascicolo sulla Tipologia Edilizia Italiana, Building Typology Brochure—Italy; Politecnico di Torino, Dipartimento Energia; Gruppo di Ricerca TEBE: Torino, Italy, 2014; ISBN 978-88-8202-065-1. [Google Scholar]
  53. Stephan, A.; Crawford, R.H.; de Myttenaere, K. Multi-scale life cycle energy analysis of a low-density suburban neighbourhood in Melbourne, Australia. Build. Environ. 2013, 68, 35–49. [Google Scholar] [CrossRef]
  54. Ricerca Pratiche, Comune di Bologna. Available online: https://sportelloediliziaimprese.comune.bologna.it/conedil/SUE.nsf/0/A1D5A9E4F611EE6BC12588B50043261B?EditDocument&Titolo=Ricerca%20pratiche (accessed on 26 August 2022).
  55. Salvati, A. La Città Compatta in Clima Mediterraneo: Isola di Calore, Morfologia e Sostenibilità. Ph.D. Thesis, Universitat Politècnica de Catalunya, Barcelona, Spain, Sapienza Università di Roma, Roma, Italy, 2016. [Google Scholar]
  56. Caniggia, G.; Maffei, G.L. Lettura dell’Edilizia di Base; Alinea: Firenze, Italy, 2008. [Google Scholar]
  57. Diotallevi, I.; Marescotti, F. Aspetti e problemi della casa popolare, Tipi fondamentali realizzati e progettati. Casabella 1941, 163, 10. [Google Scholar]
  58. Dassori, E.; Morbiducci, R. Ostruire l’Architettura; Tecniche Nuove: Milano, Italy, 2020. [Google Scholar]
Figure 1. Different packages of information and their link to three main application areas, © Author1.
Sustainability 14 13740 g001
Figure 2. (a) Georeferenced map of Bologna with (1) built environment and (2) restrictions and protections, © Author1 (geodatabase source: Open Data, Comune di Bologna, https://opendata.comune.bologna.it/pages/home/, Sit Mappe, Comune di Bologna, http://sitmappe.comune.bologna.it/pugviewer/#!/app/map/default, accessed on 29 September 2022) (b) Georeferenced map of Bologna with (3) urban planning and regulation and (4) construction epochs (chronological data), © Author1, (geodatabase source: Open Data, Comune di Bologna, https://opendata.comune.bologna.it/pages/home/, Sit Mappe, Comune di Bologna, http://sitmappe.comune.bologna.it/pugviewer/#!/app/map/default, accessed on 29 September 2022).
Sustainability 14 13740 g002aSustainability 14 13740 g002b
Figure 3. Workflow of the operation to detect the urban territory of Bologna, which is the primary residential existing building stock and with few listed dwellings, constructed between the first and the second half of the XX century (not after 1971), © Author1.
Sustainability 14 13740 g003
Figure 4. Representative diagram of the different parameters of density used in the “Spacemate”, © Author1.
Sustainability 14 13740 g004
Figure 5. Spacemate for Bologna residential building stock to be studied, consisting of 210 urban blocks, © Author1.
Sustainability 14 13740 g005
Figure 6. Methodology workflow for large-scale LCA GIS integration, © Author1.
Sustainability 14 13740 g006
Figure 7. Different packages of information and structure of the database from archival research to be integrated with municipal georeferenced databases, © Author1.
Sustainability 14 13740 g007
Figure 8. “Spacemate” with urban clusters and in yellow color, the subset of 55. Each urban block is identified by its identification code © Author1.
Sustainability 14 13740 g008
Figure 9. GIS maps with the 20 urban blocks, in green: cluster F, in blue: cluster E, in pink: cluster B, in red: outside the clusters, the numbers represent urban block ID code © Author1.
Sustainability 14 13740 g009
Figure 10. Charts with the values of OSR (a), FSI (b), the average building height (c), and the average number of floors (d) for 20 urban blocks. These parameters are explained in Section 2.2.1. The different colors represent different data sources, e.g., yellow color is for (1) data source: municipal georeferenced databases, and green color is for (2) data source: archival permit consultation. N.A. = Not Available, if many associations with building permits are missing © Author1.
Sustainability 14 13740 g010
Figure 11. Charts with (a) the number of main and service buildings compared with the number of polygons in the GIS map and (b) the consistency of main and service buildings in terms of built area and (c) built volume. The different colors represent different data sources, e.g., yellow color is for (1) data source: municipal georeferenced databases, and green color is for (2) data source: archival permit consultation, © Author1.
Sustainability 14 13740 g011
Figure 12. Charts with some of the most frequent values of the building stock in 20 urban blocks, © Author1.
Sustainability 14 13740 g012
Table 1. Results of the analyses to evaluate the consistency/size of existing listed and industrial buildings.
Industrial Buildings–More Frequent ValuesListed Buildings–More Frequent Values
58.74%Urban blocks without industrial buildings38.81%Urban blocks without listed buildings
13.29%Urban blocks with the built area covered by industrial buildings between [0.01–10%] of the territorial area55.94%Urban blocks with the built area covered by listed buildings between [0.01–10%] of the territorial area
17.83%Urban blocks with percentage number of industrial buildings between [0.01–10%] out of the total number of buildings23.78%Urban blocks with percentage number of listed buildings between [0.01–10%] out of the total number of buildings
20.98%Urban blocks with number of industrial buildings between [1,2,3,4,5]33.22%Urban blocks with number of listed buildings between [1,2,3,4,5,6,7,8,9,10]
Table 2. Description of the density parameters used in the “Spacemate” chart.
NameDescription
FSI Floor Space IndexImpact of horizontal built surfaces on a territorial area, defined as urban intensity, e.g. the pressure of horizontal built surfaces on the territory [42,43];
GSI Ground Space IndexImpact of built coverage on a territory, the ratio between the sum of buildings’ footprint and the territorial surface. Both FSI and GSI were usually used in urban planning regulations as a limit;
OSR Open Space RatioPressure of built horizontal areas on unbuilt surfaces, the ratio between horizontal gross floor areas and the open space ones; it was used in planning regulations to set up a limit on unbuilt surfaces [42];
L Layersbuilding’s height in terms of the number of floors, it is the ratio between FSI and GSI [44]
Table 3. Maximum, minimum, and average building height variations, NF, FSI, and OSR were calculated from two different sources. (+) means that values from GIS are higher than permits (-) means that values from GIS are lower than permits, and the variations are expressed in percentage from values obtained by GIS data.
Average BH 1Average NF 2FSIOSR
Maximum−69.77%−96.00%+20.51%−25.50%
Minimum+3.65%+7.35%+0.51%−0.51%
Average−28.88%−27.93%+7.00%−7.97%
1 BH: Building Height, 2 Number of Floors.
Table 4. The most frequent values range for compactness, vertical density, population density, and occupancy density.
CO 1VD 2PD 3OD 4
Frequent range0.34–0.421.4–20.055–0.0850.037–0.039
1 CO: Compactness, 2 Vertical Density, 3 Population Density, 4 Occupancy Density.
Publisher’s Note: MDPI stays neutral with regard to jurisdictional claims in published maps and institutional affiliations.

