
Good Agricultural Practices Related to Water and Soil as a Means of Adaptation of Mediterranean Olive Growing to Extreme Climate-Water Conditions

 ,
, 
Abstract
:1. Introduction
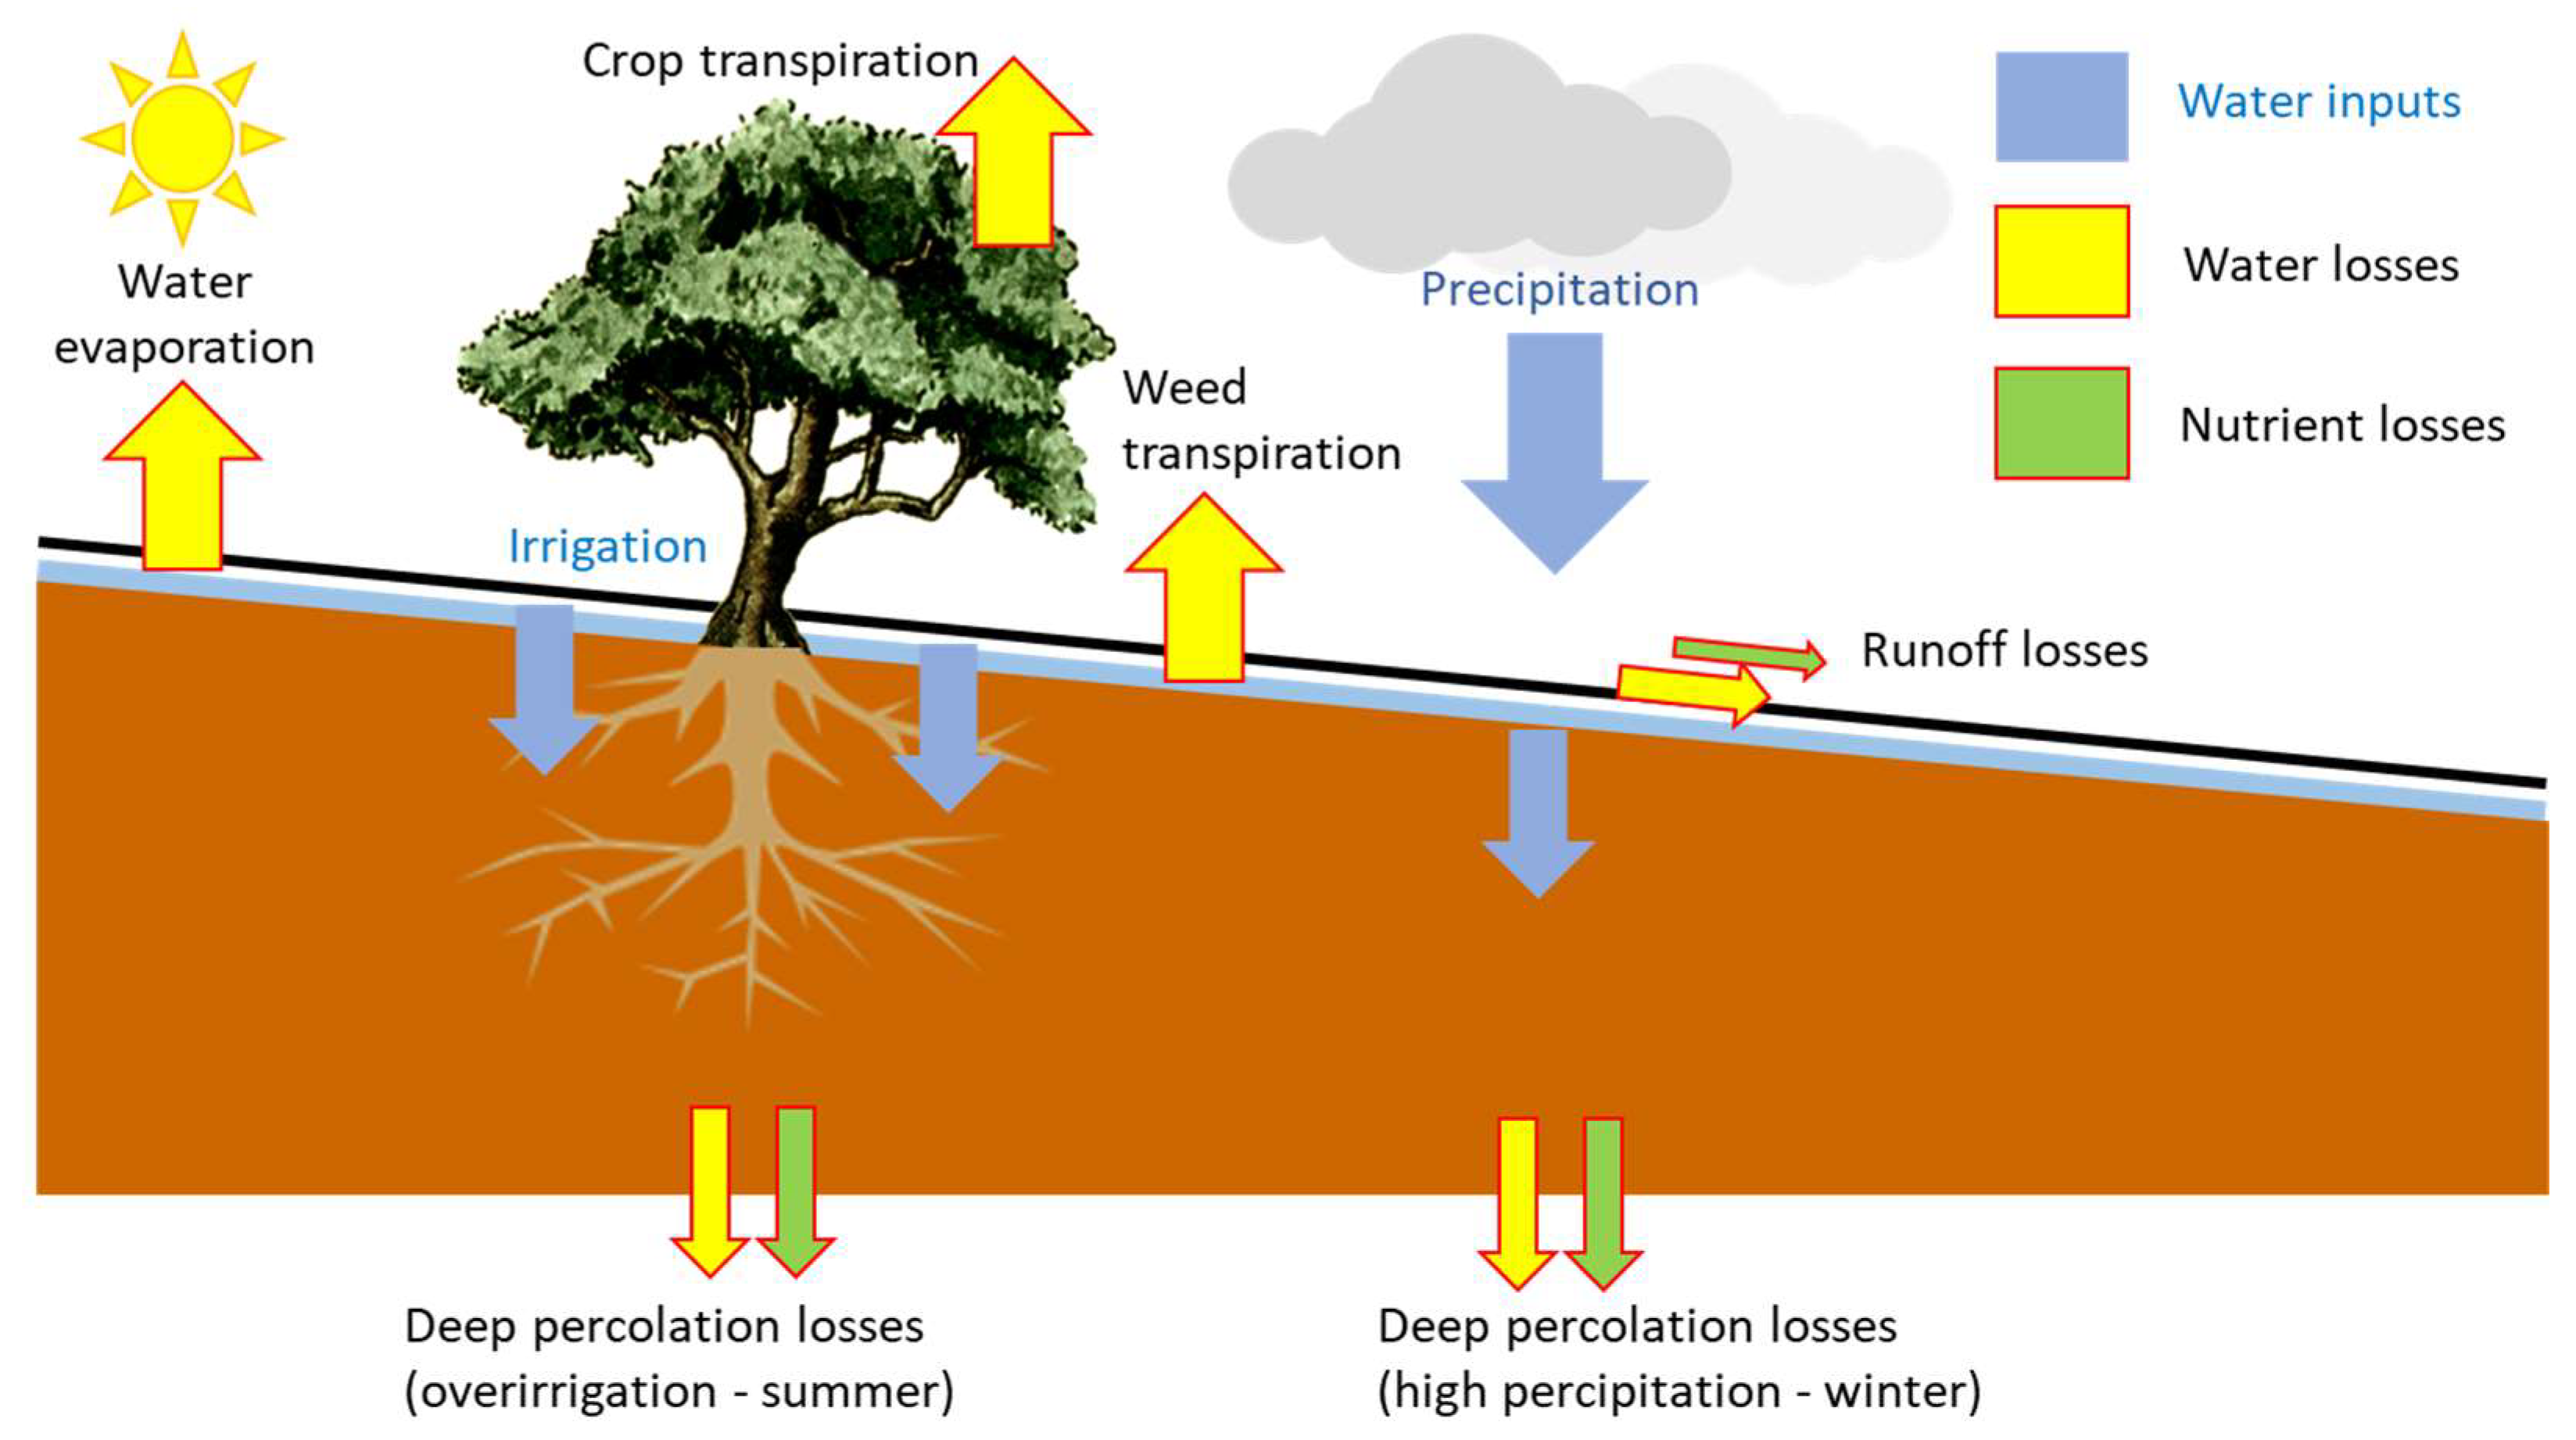
2. Materials and Methods
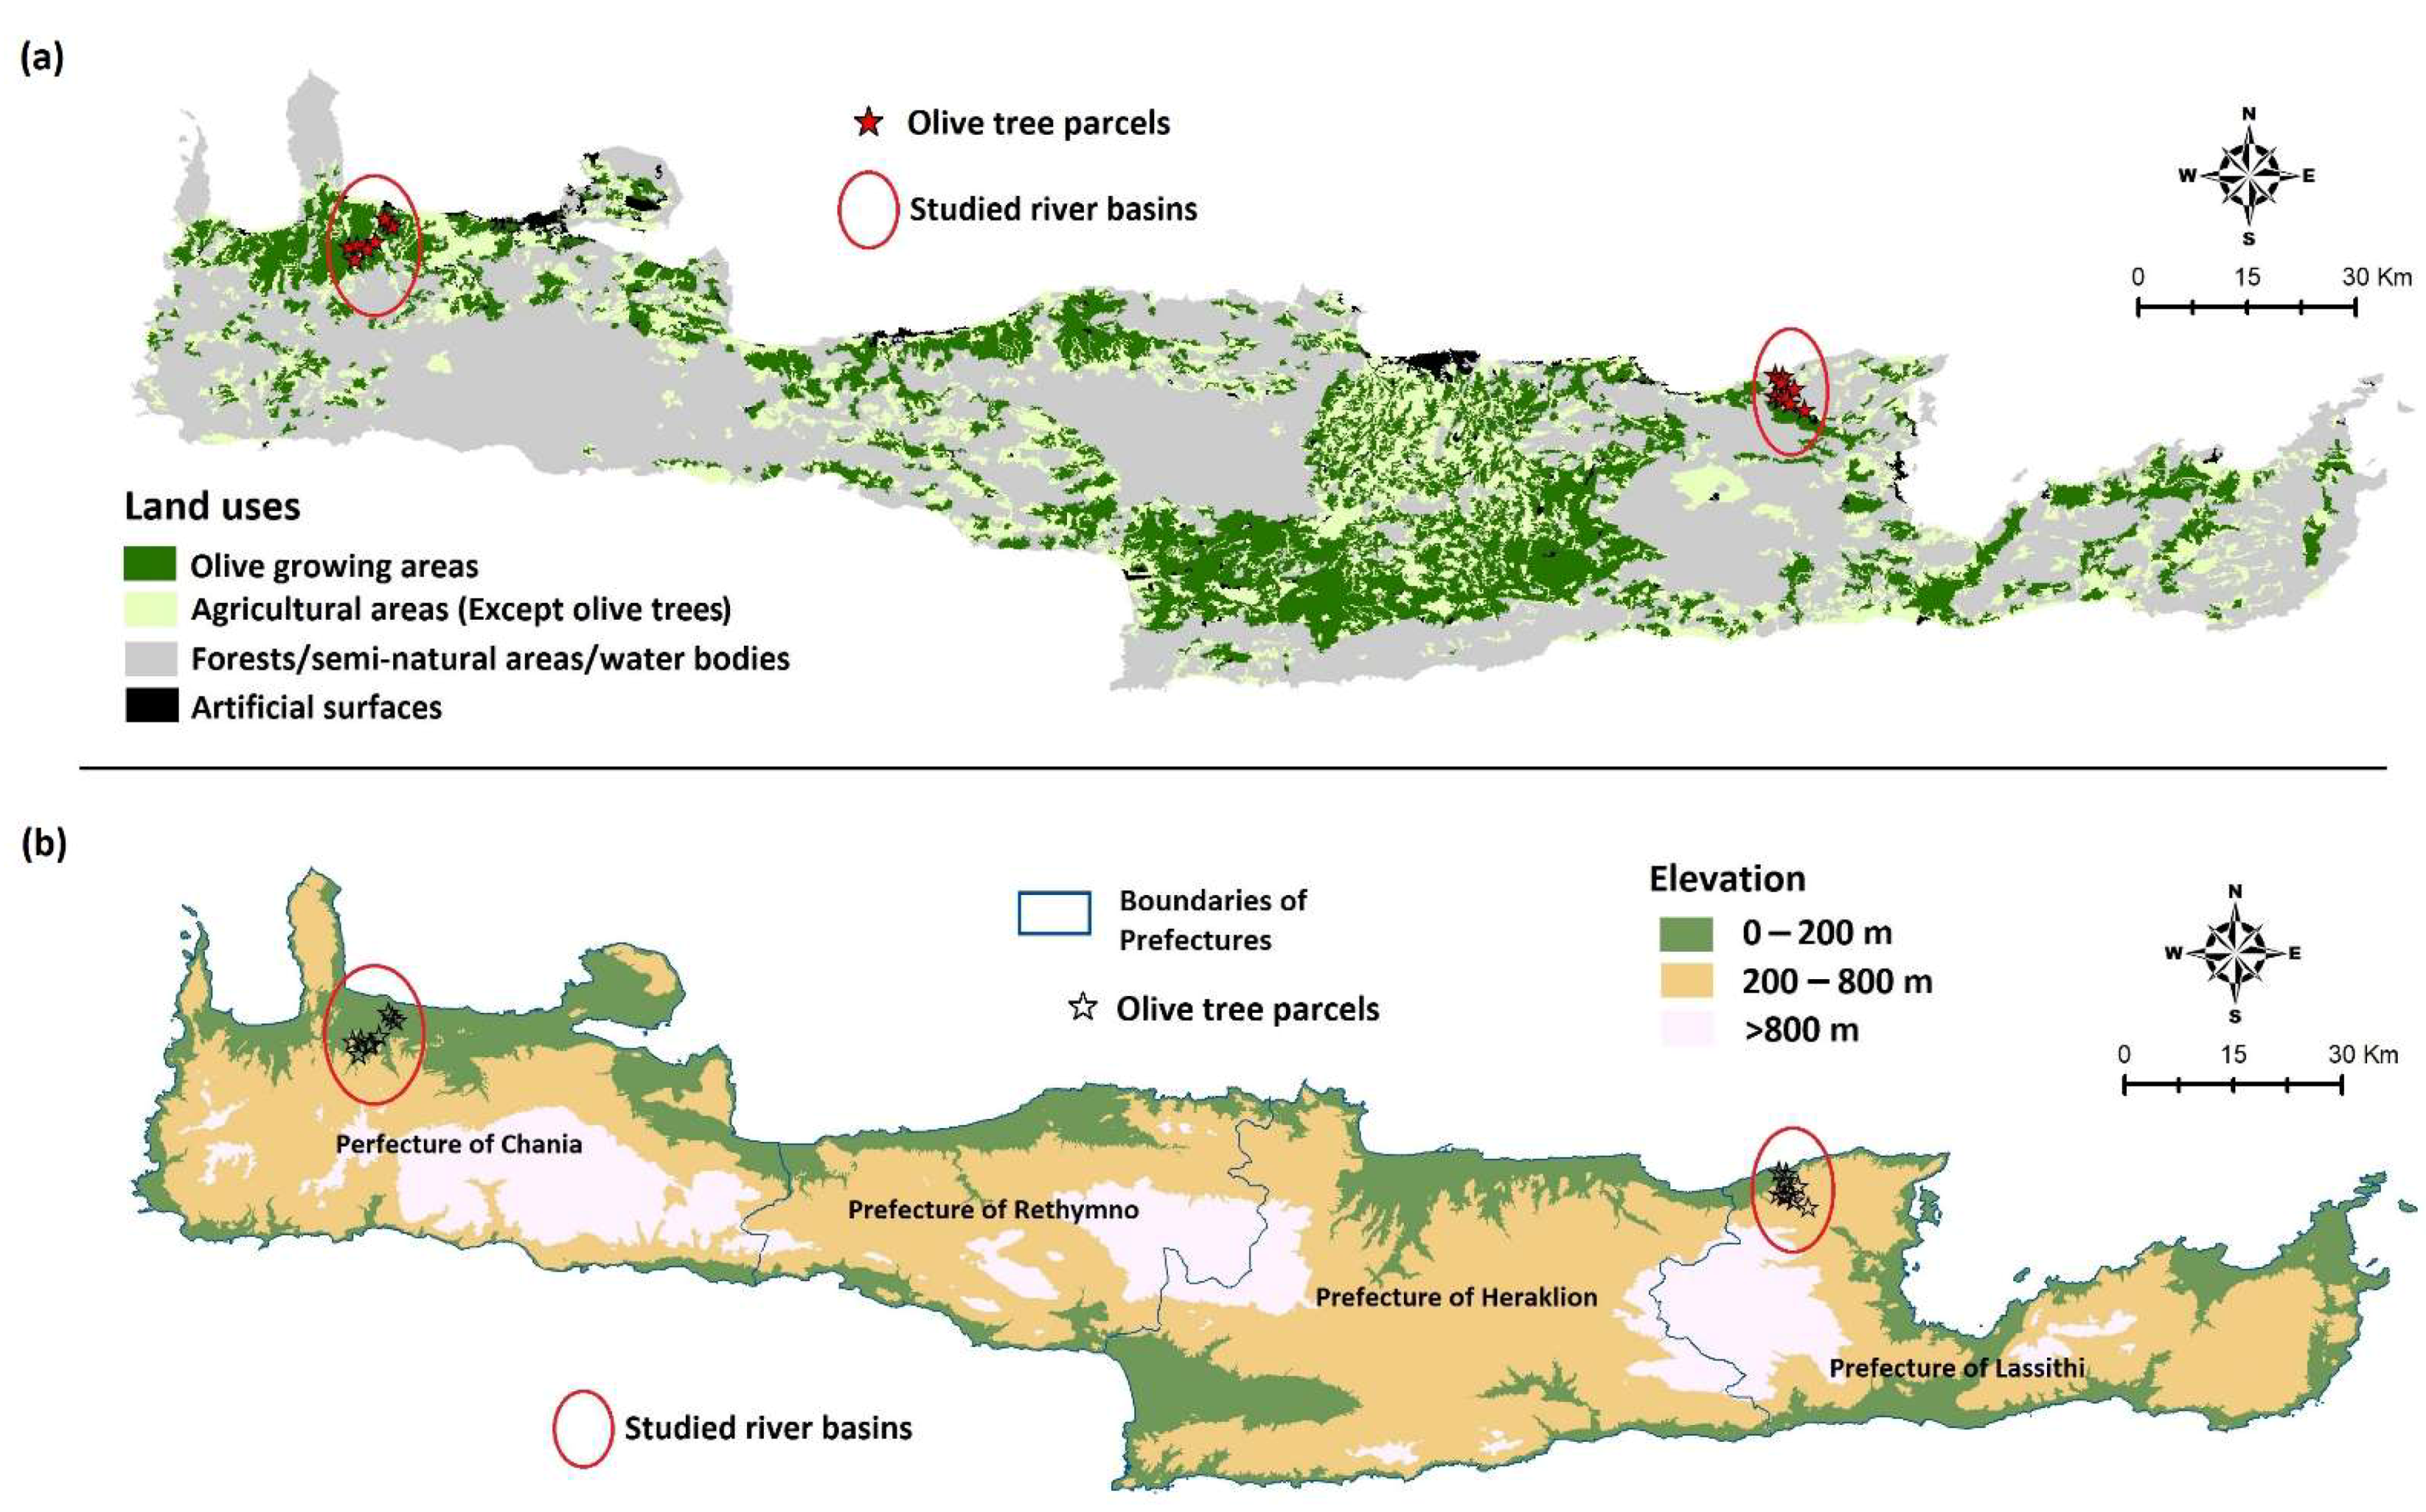
2.1. Study Area
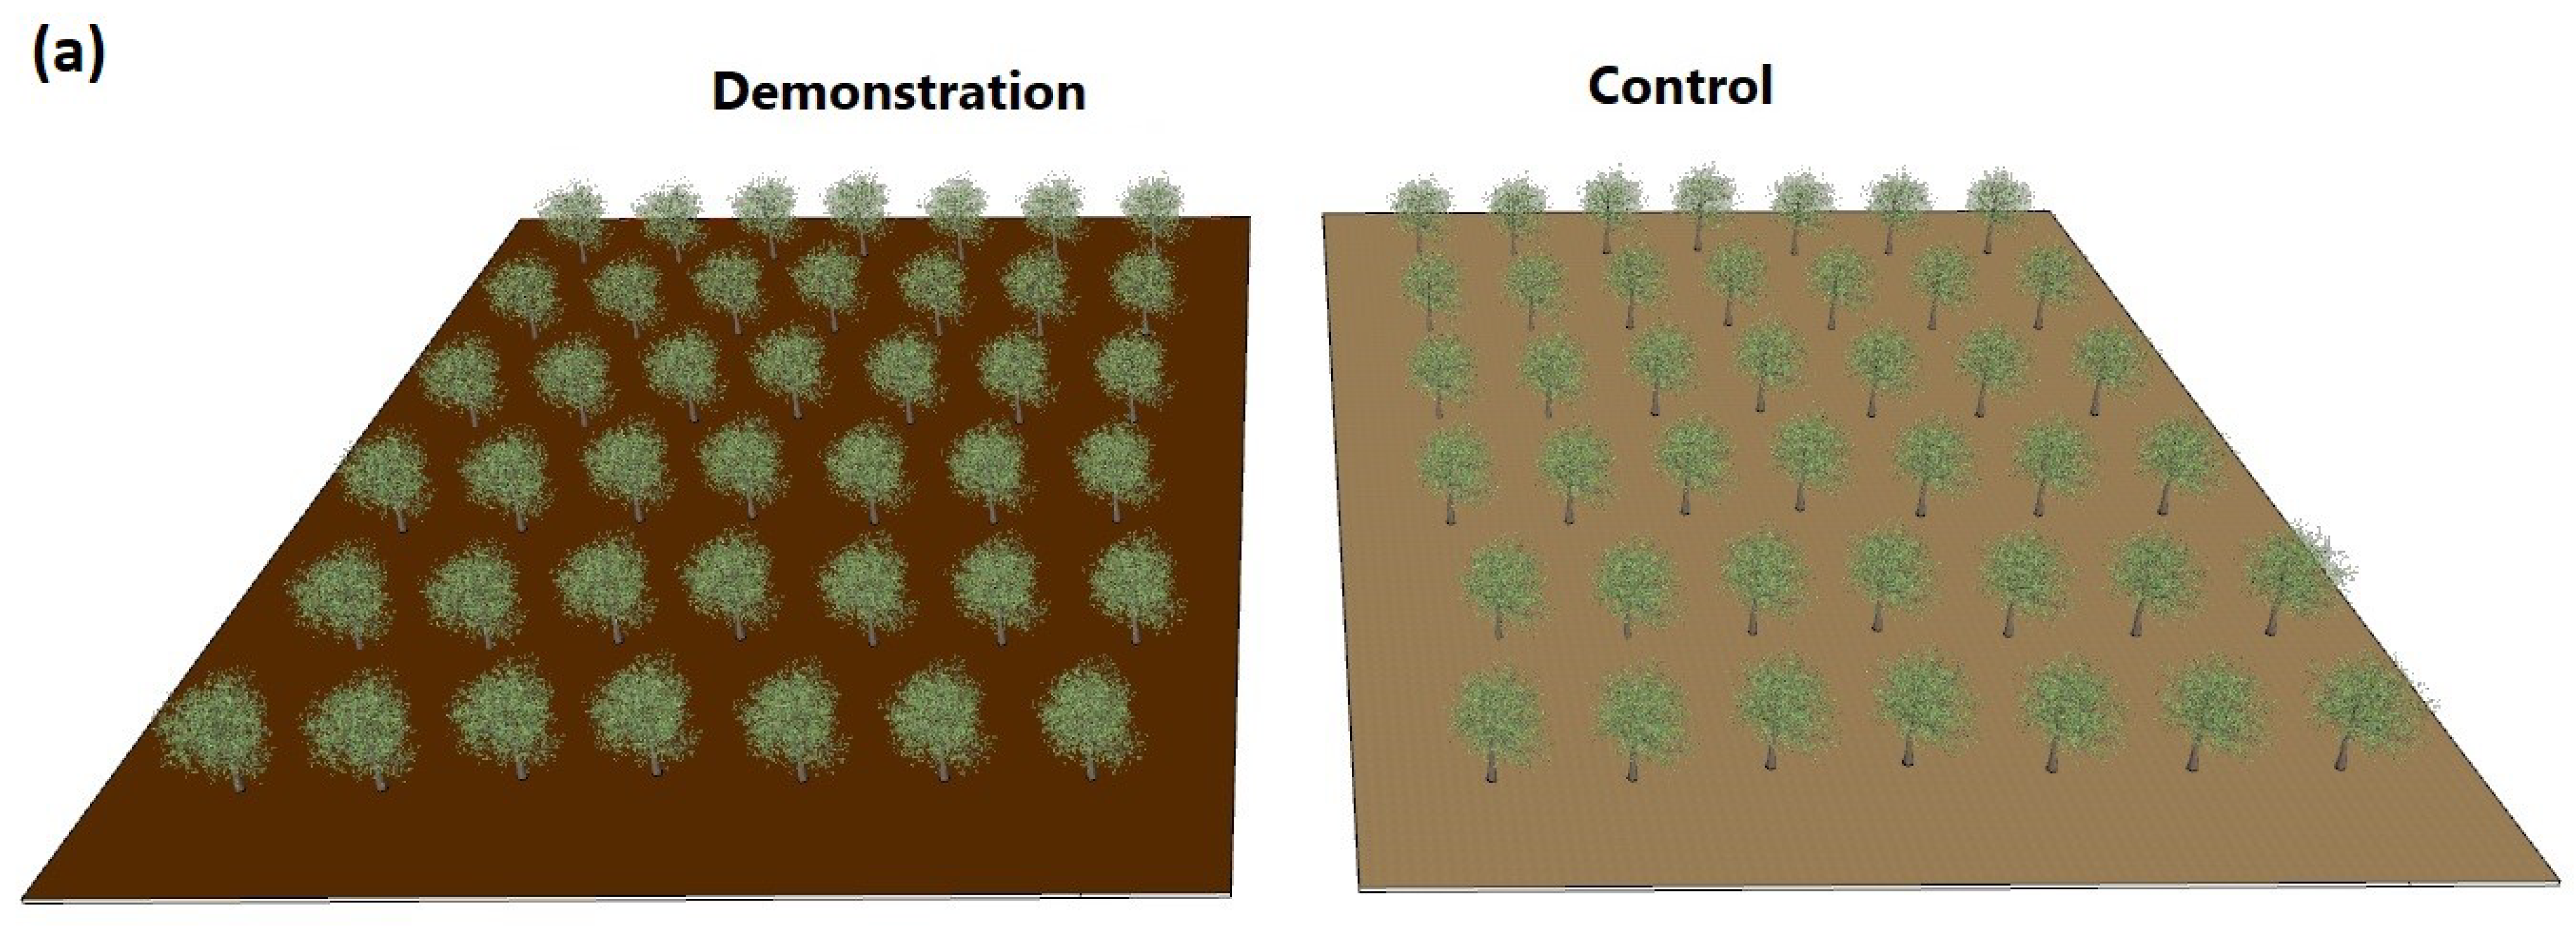
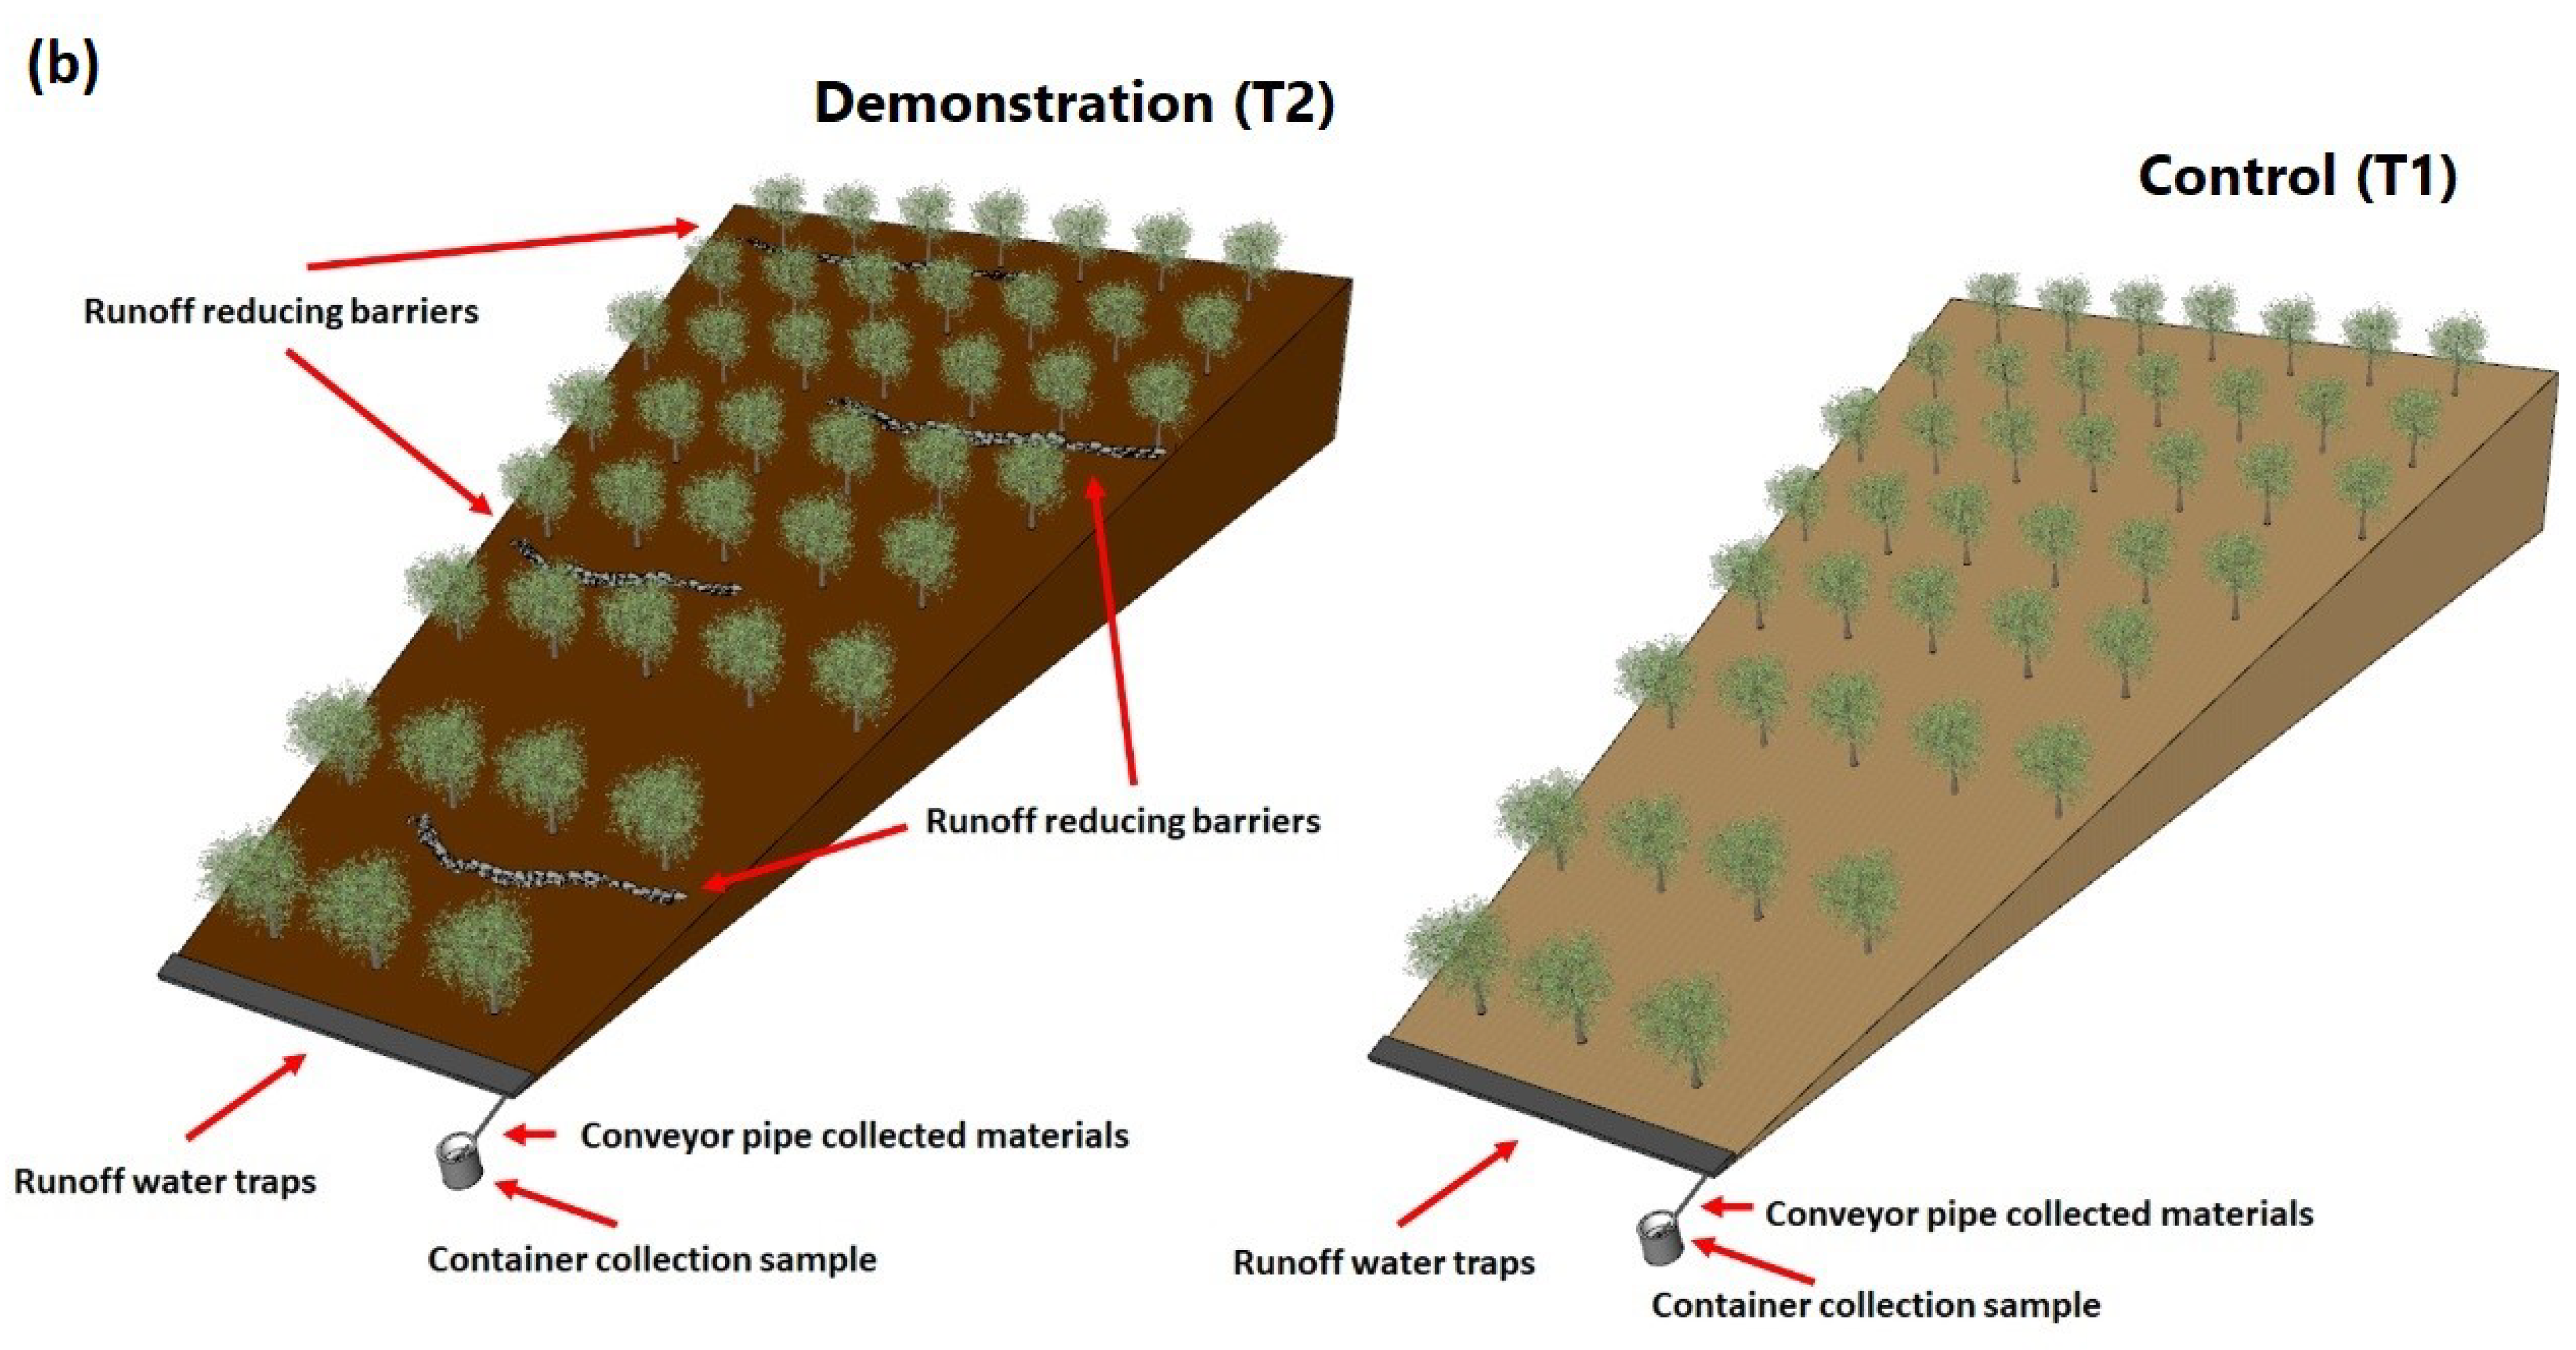
2.2. Experimental Design and Performance Indicators
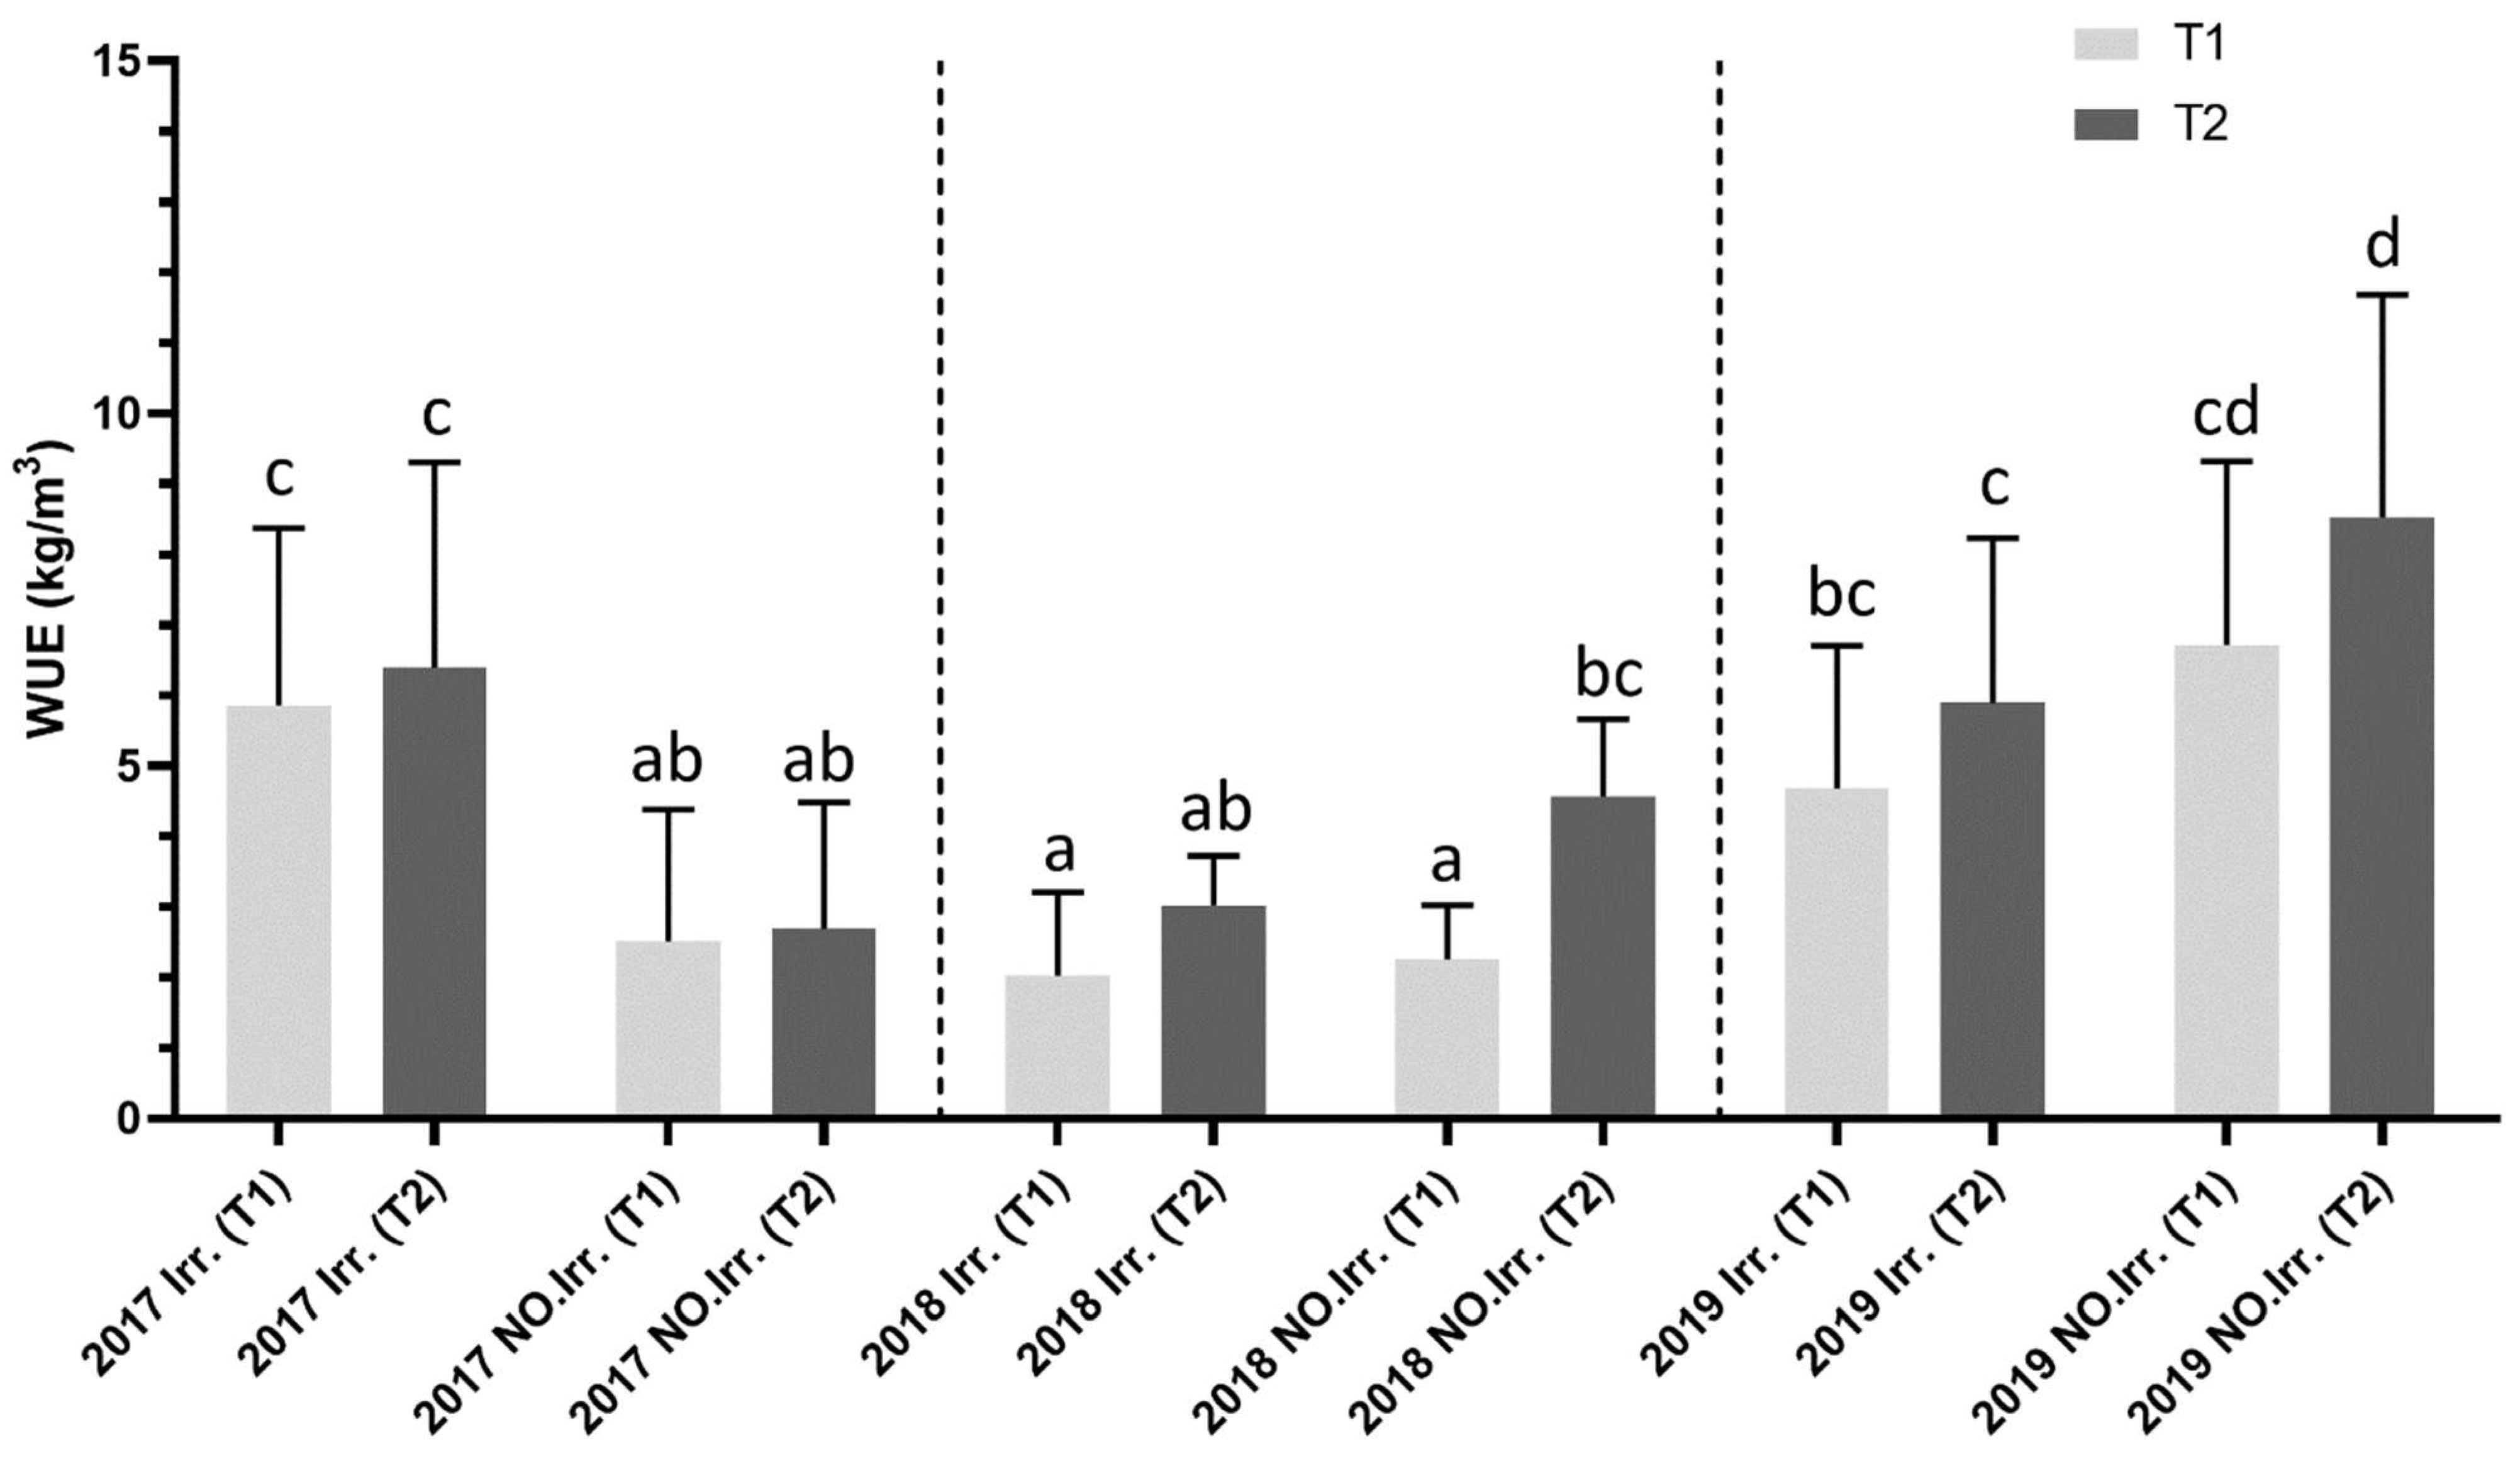
2.2.1. Water Productivity (WP)
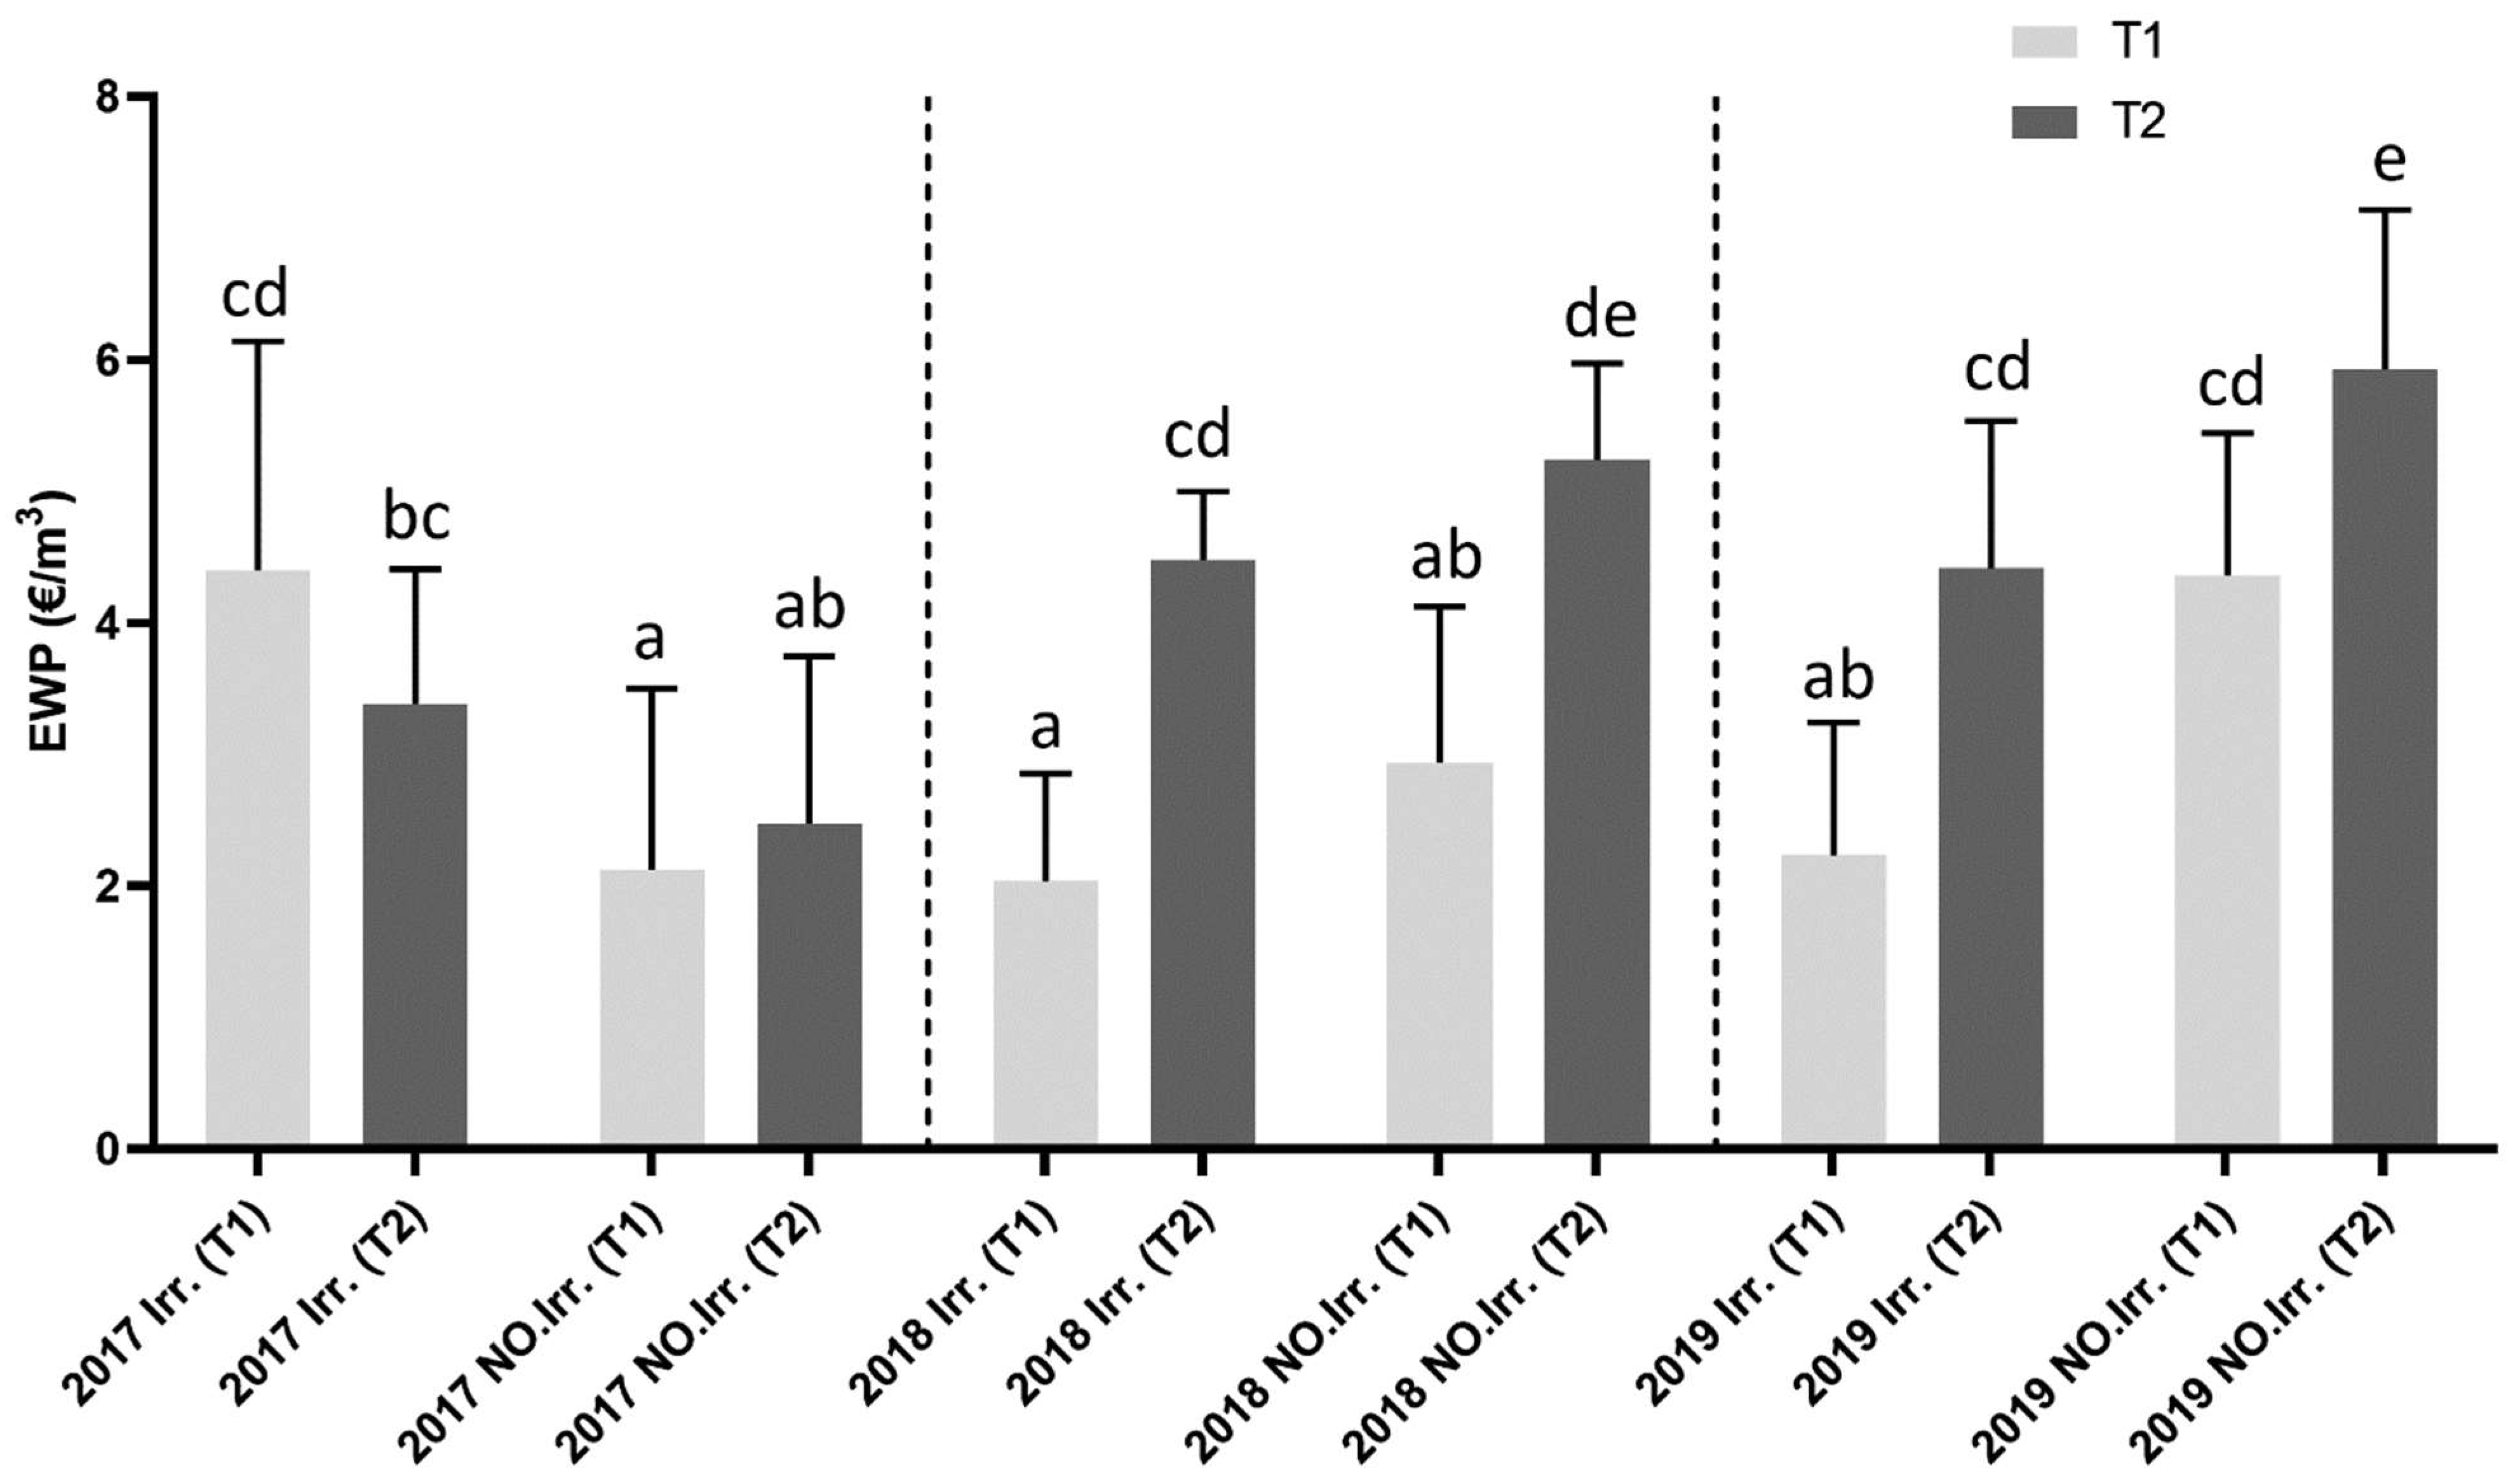
2.2.2. Economic Water Productivity (EWP)
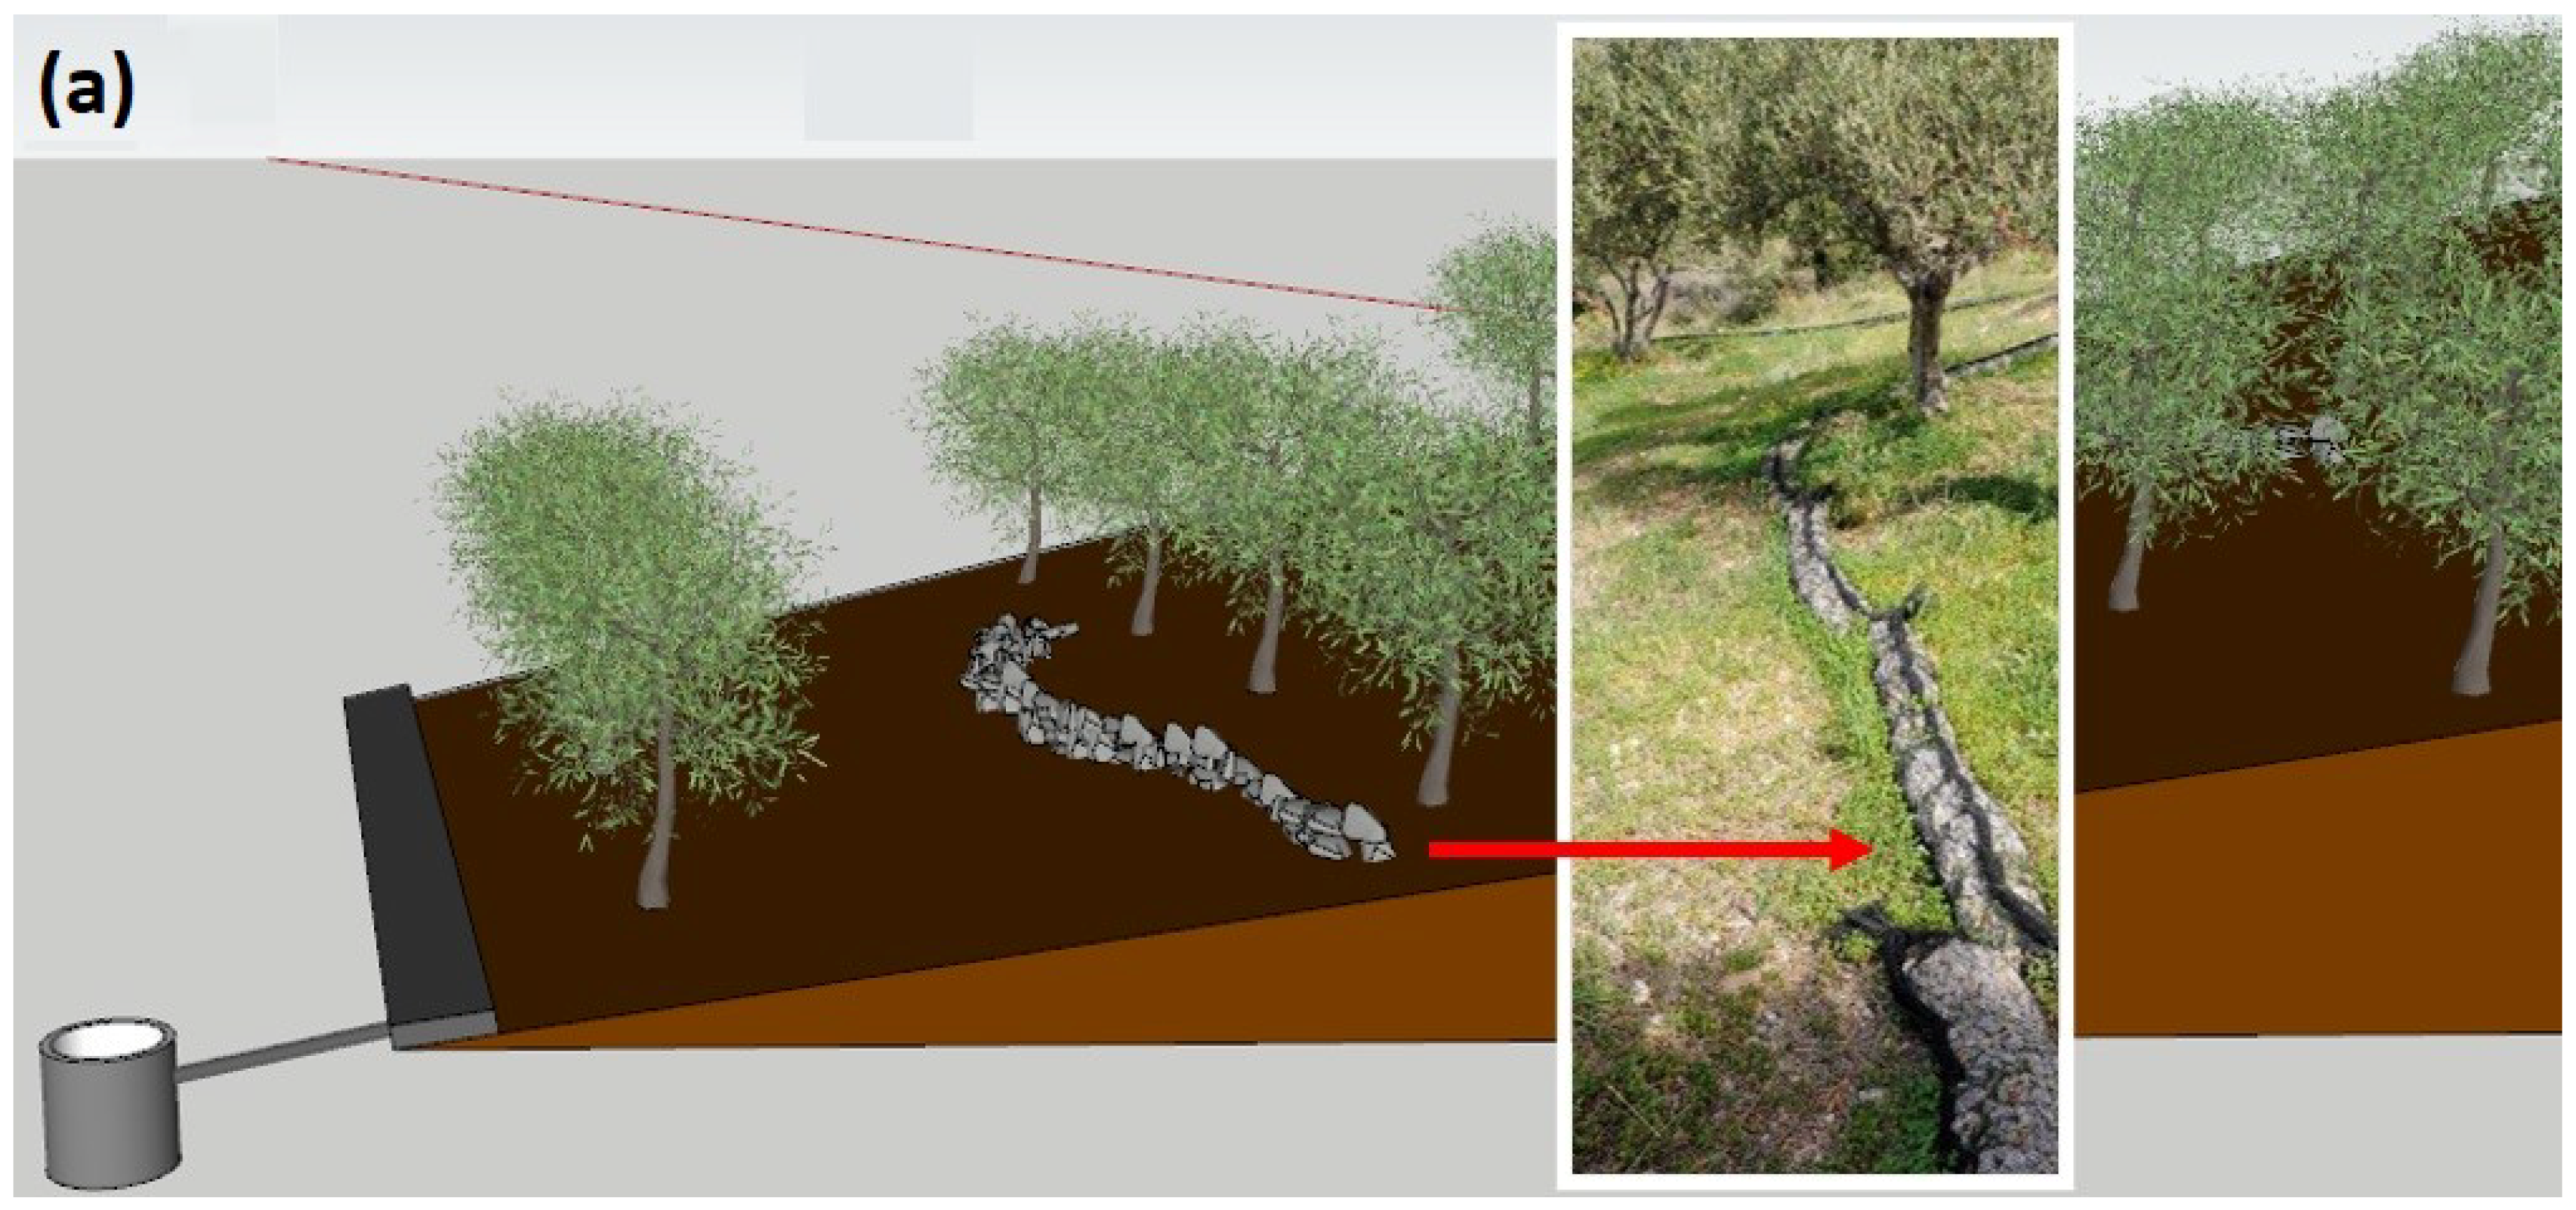
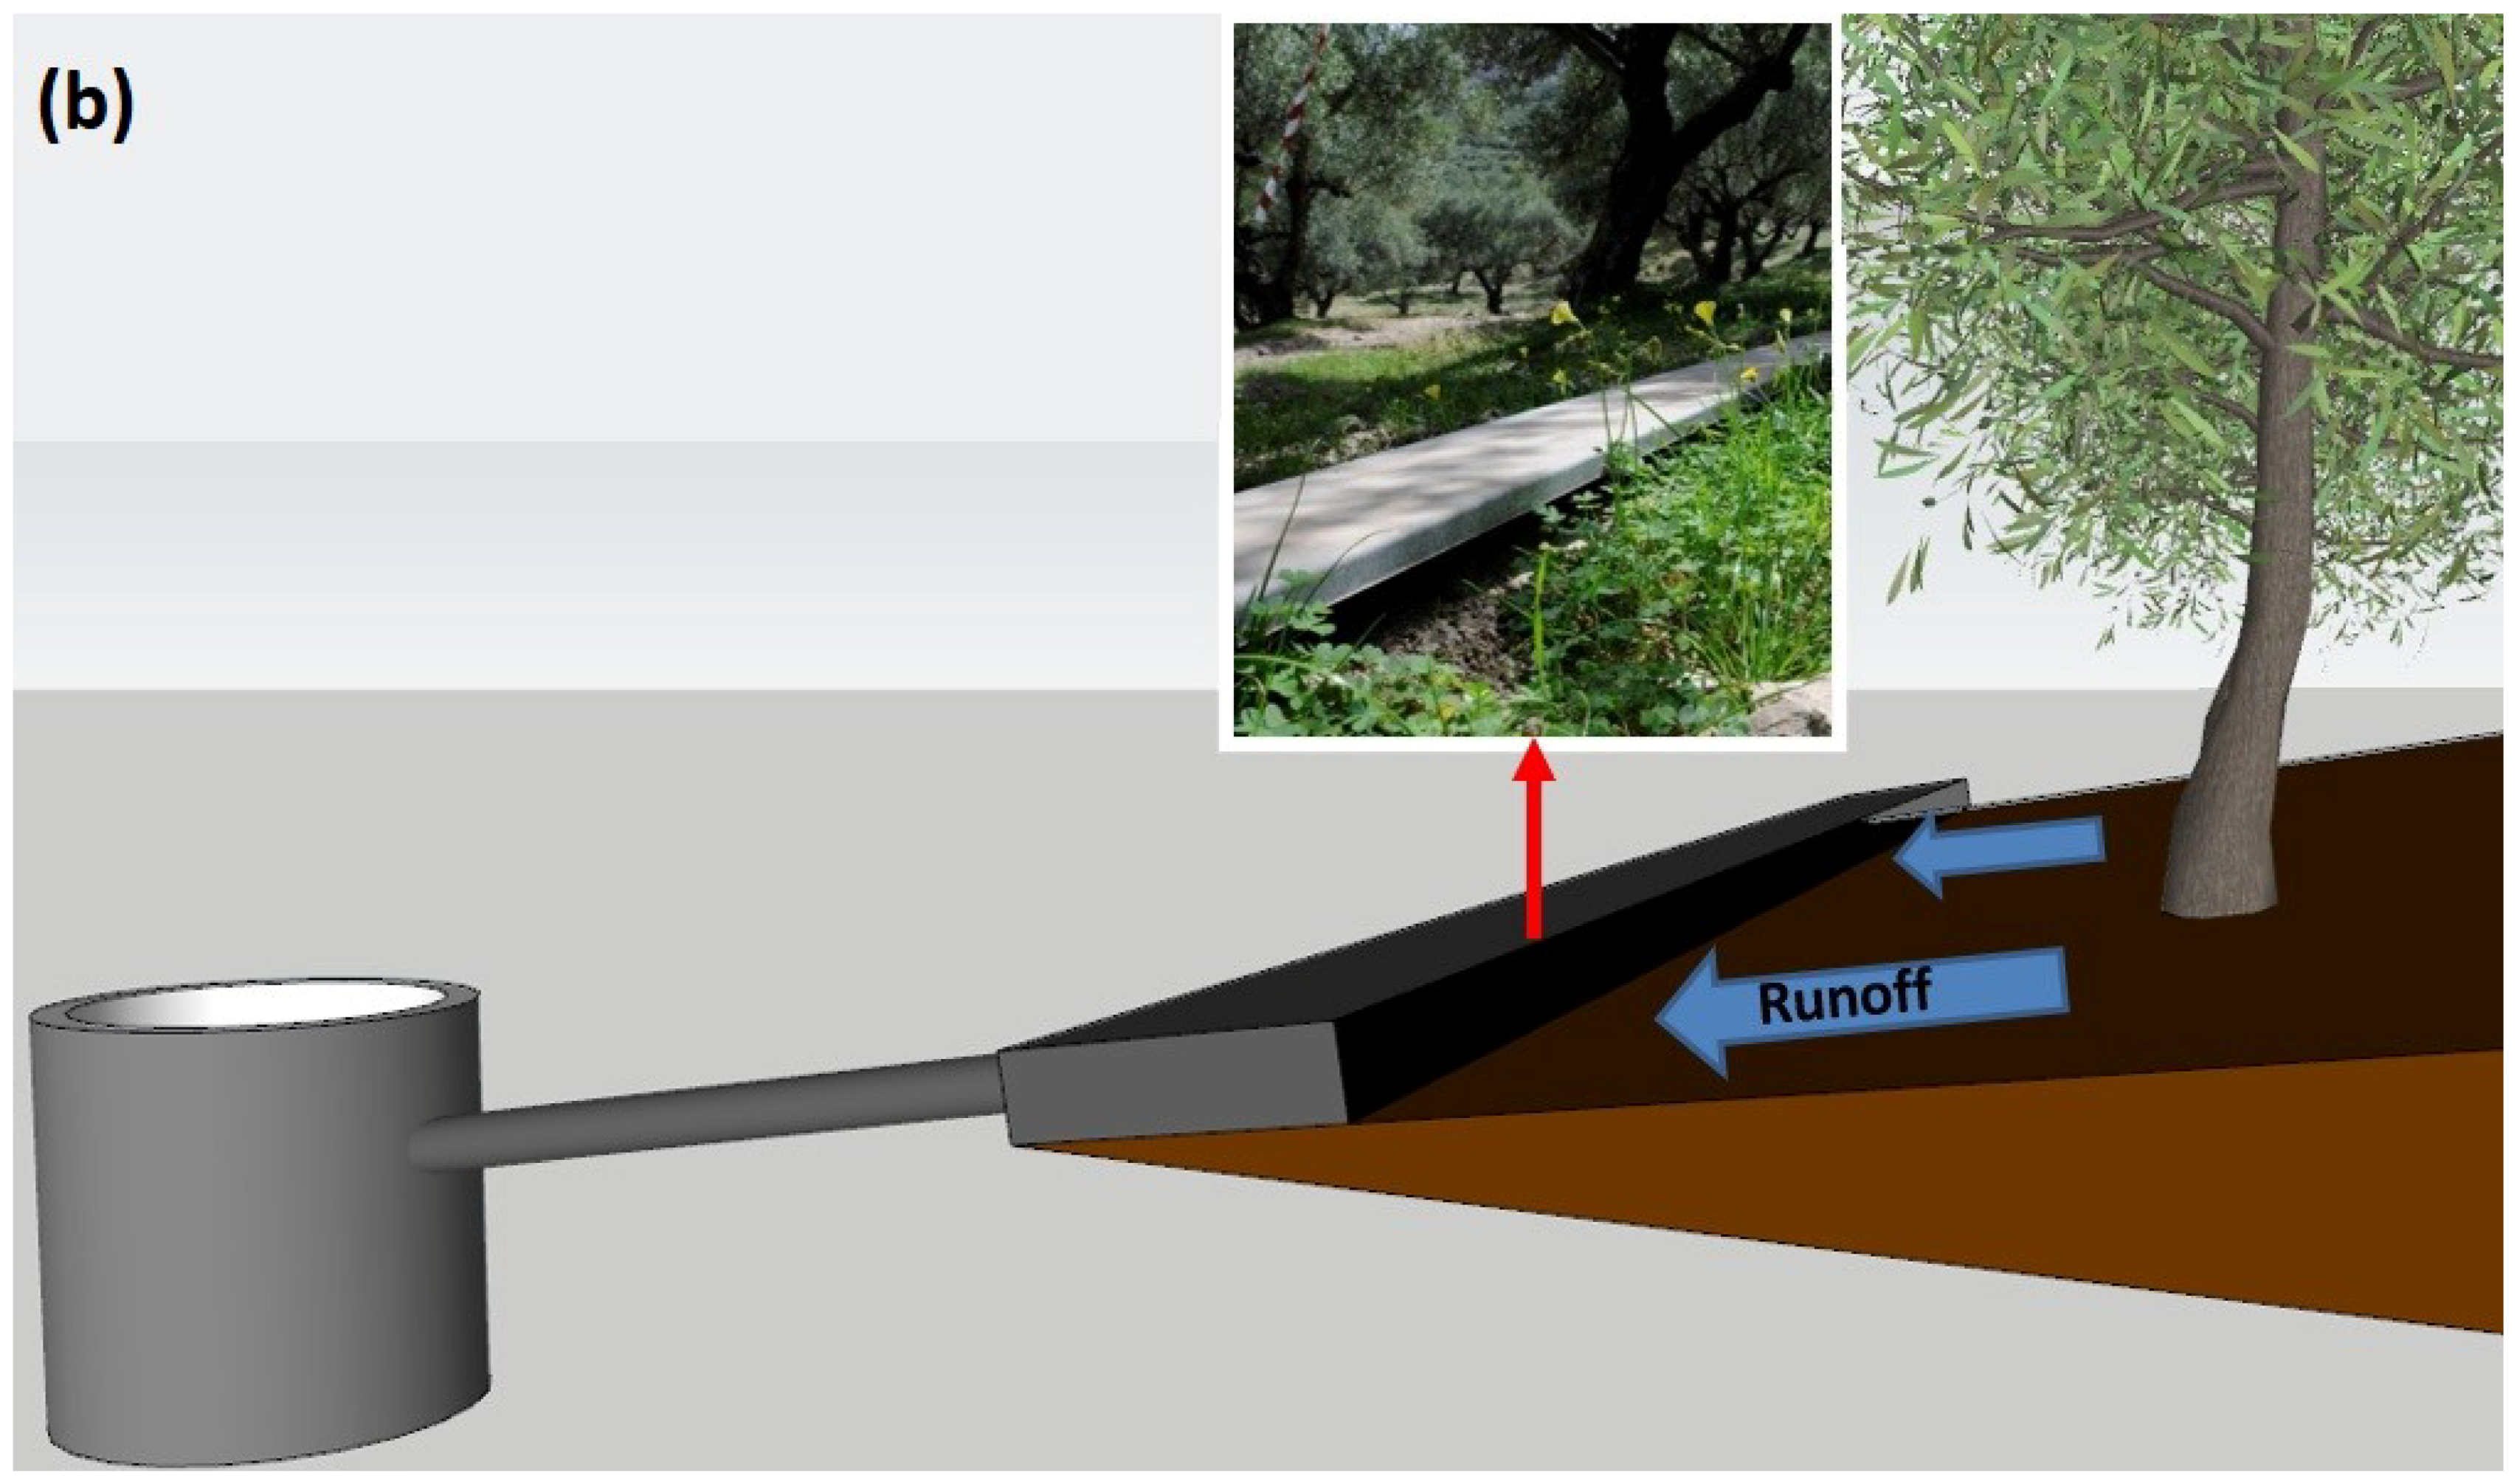
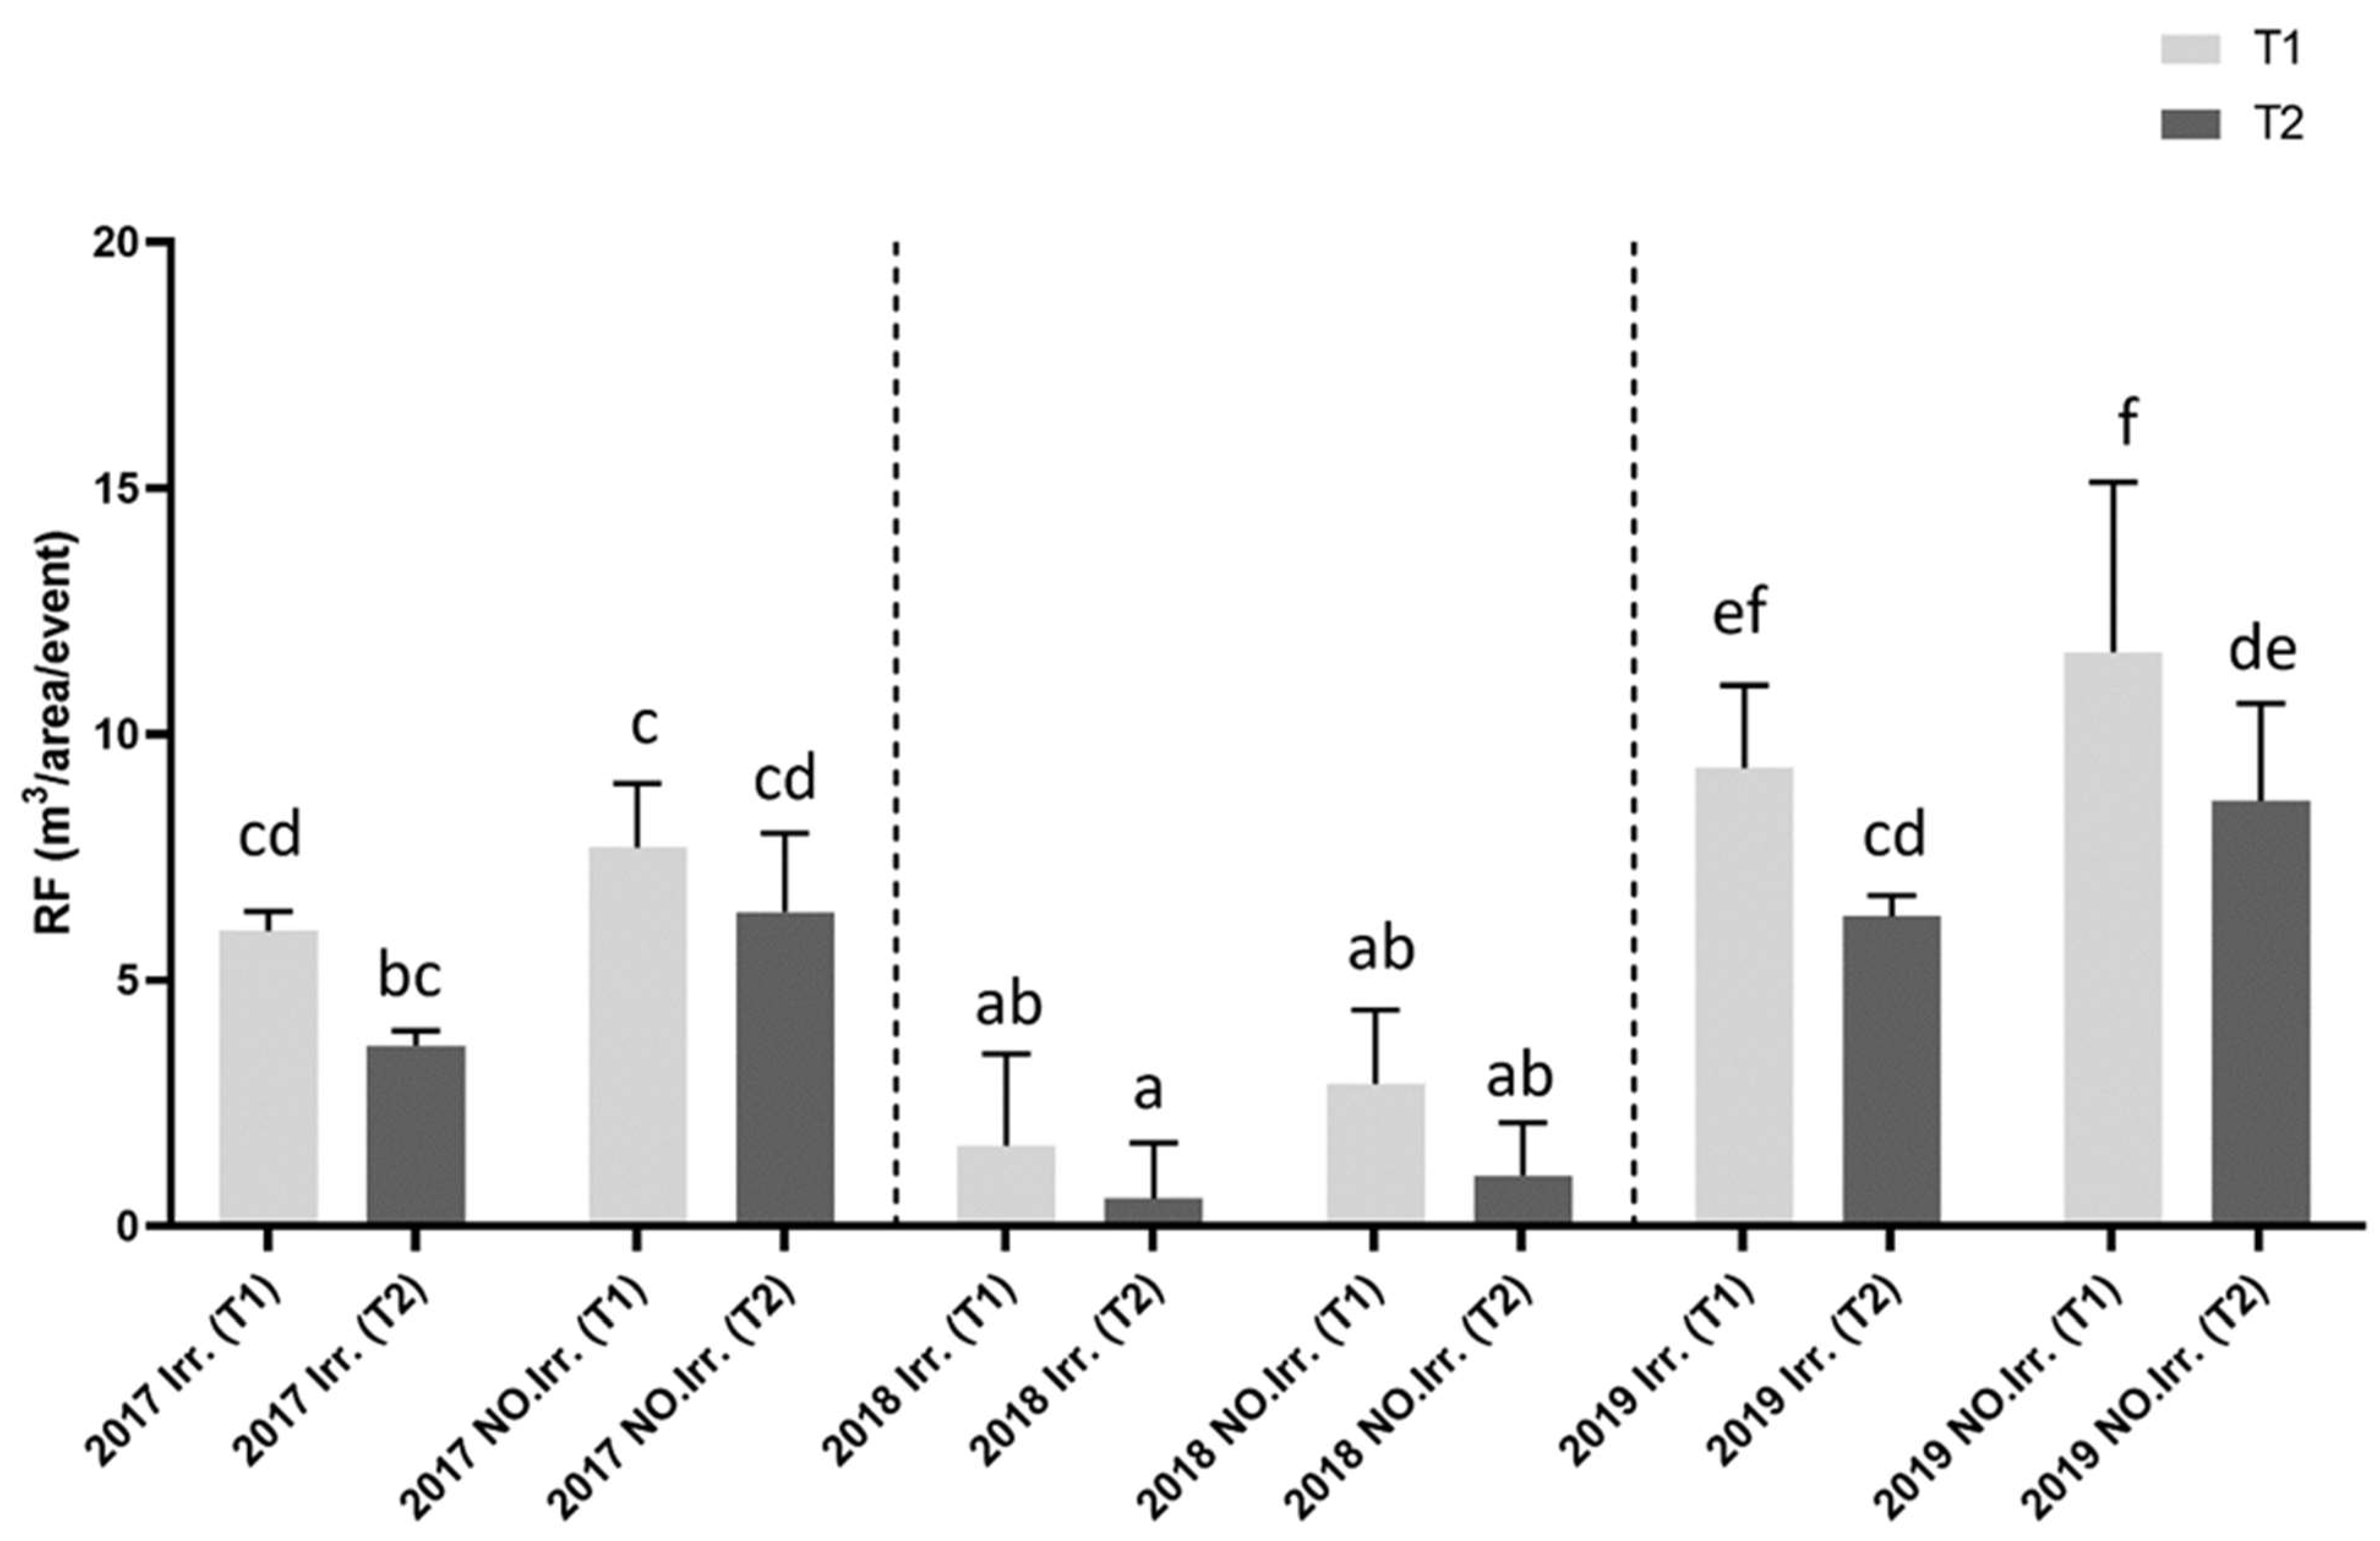
2.2.3. Runoff (RF)
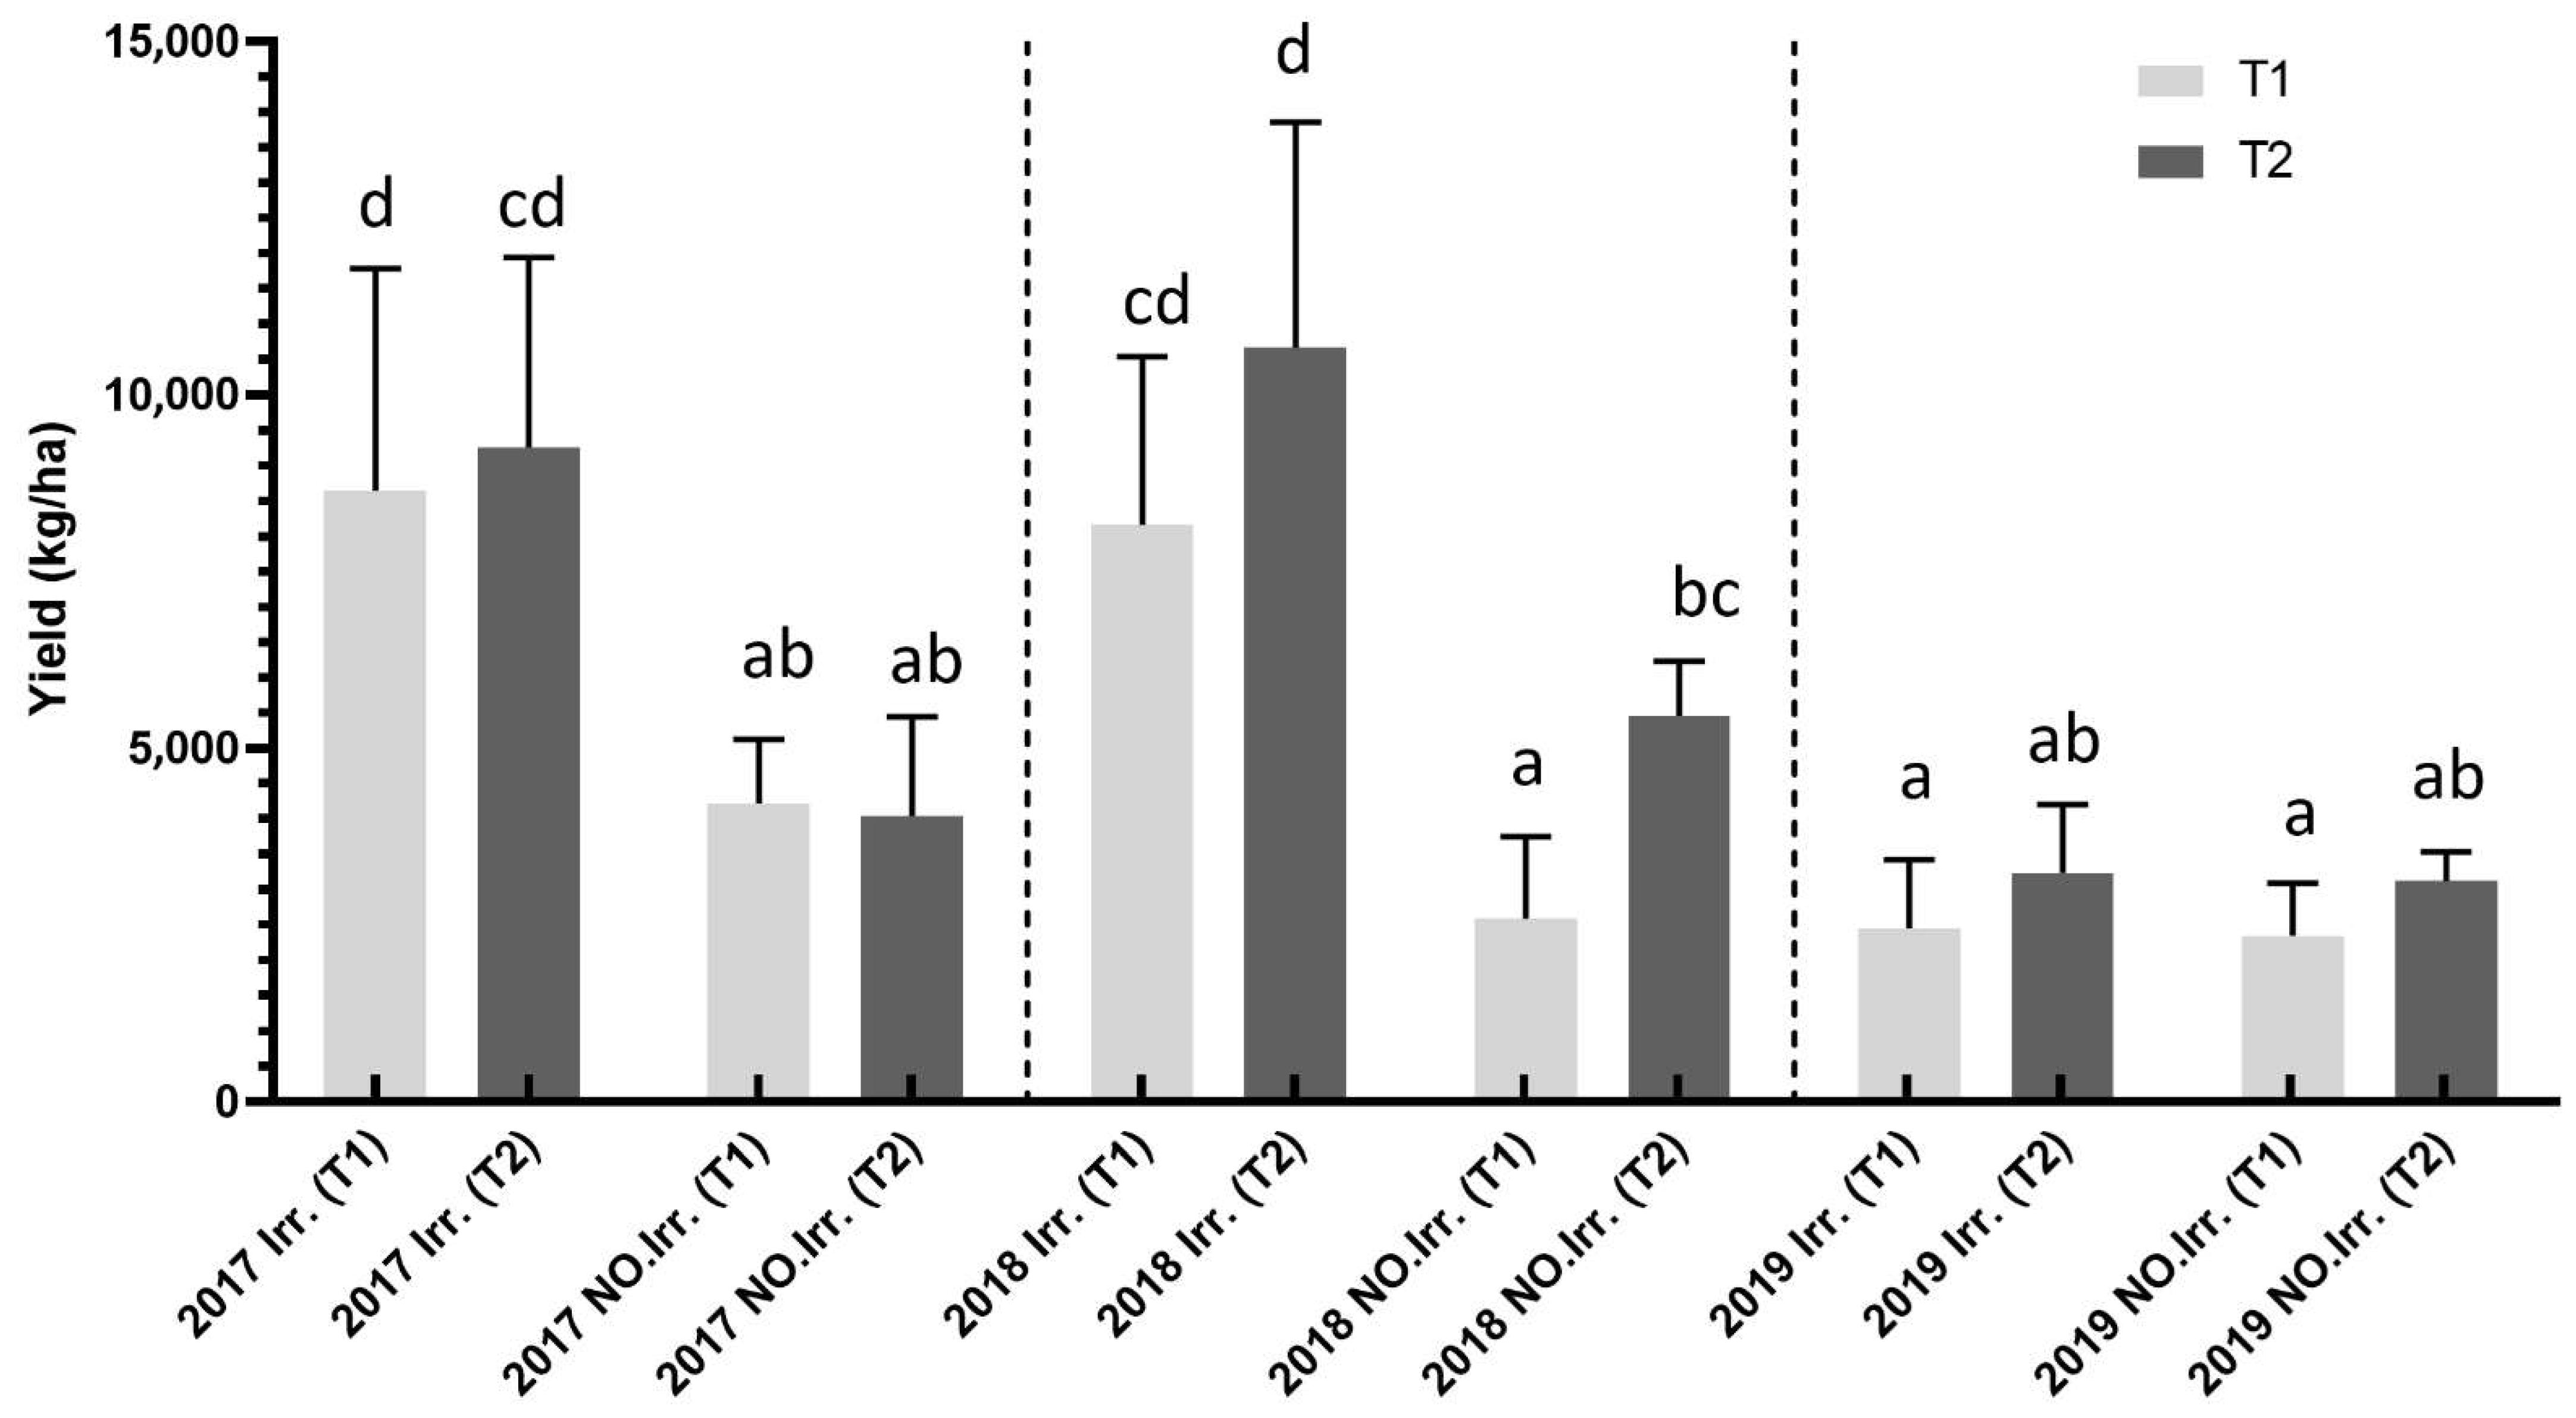
2.2.4. Yield
2.2.5. Statistical Analysis
3. Results and Discussion
Yield and Water Use Performance Indicators
4. Conclusions
Author Contributions
Funding
Acknowledgments
Conflicts of Interest
References
- Langgut, D.; Cheddadi, R.; Carrión, J.S.; Cavanagh, M.; Colombaroli, D.; Eastwood, W.J.; Greenberg, R.; Litt, T.; Mercuri, A.M.; Miebach, A. The origin and spread of olive cultivation in the Mediterranean Basin: The fossil pollen evidence. Holocene 2019, 29, 902–922. [Google Scholar] [CrossRef]
- Kaniewski, D.; Van Campo, E.; Boiy, T.; Terral, J.F.; Khadari, B.; Besnard, G. Primary domestication and early uses of the emblematic olive tree: Palaeobotanical, historical and molecular evidence from the Middle East. Biol. Rev. 2012, 87, 885–899. [Google Scholar] [CrossRef] [PubMed] [Green Version]
- Carrión, Y.; Ntinou, M.; Badal, E. Olea europaea L. in the north Mediterranean Basin during the Pleniglacial and the Early–Middle Holocene. Quat. Sci. Rev. 2010, 29, 952–968. [Google Scholar] [CrossRef] [Green Version]
- Arenas-Castro, S.; Gonçalves, J.F.; Moreno, M.; Villar, R. Projected climate changes are expected to decrease the suitability and production of olive varieties in southern Spain. Sci. Total Environ. 2020, 709, 136161. [Google Scholar] [CrossRef] [PubMed]
- Michalopoulos, G.; Kasapi, K.; Koubouris, G.; Psarras, G.; Arampatzis, G.; Hatzigiannakis, E.; Kavvadias, V.; Xiloyannis, C.; Montanaro, G.; Malliaraki, S. Adaptation of Mediterranean olive groves to climate change through sustainable cultivation practices. Climate 2020, 8, 54. [Google Scholar] [CrossRef] [Green Version]
- Skiada, V.; Tsarouhas, P.; Varzakas, T. Preliminary study and observation of “Kalamata PDO” extra virgin olive oil, in the Messinia region, southwest of Peloponnese (Greece). Foods 2019, 8, 610. [Google Scholar] [CrossRef] [Green Version]
- Fraga, H.; Moriondo, M.; Leolini, L.; Santos, J.A. Mediterranean olive orchards under climate change: A review of future impacts and adaptation strategies. Agronomy 2020, 11, 56. [Google Scholar] [CrossRef]
- Kourgialas, N.N. Hydroclimatic impact on mediterranean tree crops area–Mapping hydrological extremes (drought/flood) prone parcels. J. Hydrol. 2021, 596, 125684. [Google Scholar] [CrossRef]
- Bechara, E.; Papafilippaki, A.; Doupis, G.; Sofo, A.; Koubouris, G. Nutrient dynamics, soil properties and microbiological aspects in an irrigated olive orchard managed with five different management systems involving soil tillage, cover crops and compost. J. Water Clim. Chang. 2018, 9, 736–747. [Google Scholar] [CrossRef]
- Moreno, B.; Garcia-Rodriguez, S.; Cañizares, R.; Castro, J.; Benítez, E. Rainfed olive farming in south-eastern Spain: Long-term effect of soil management on biological indicators of soil quality. Agric. Ecosyst. Environ. 2009, 131, 333–339. [Google Scholar] [CrossRef]
- Palese, A.; Vignozzi, N.; Celano, G.; Agnelli, A.; Pagliai, M.; Xiloyannis, C. Influence of soil management on soil physical characteristics and water storage in a mature rainfed olive orchard. Soil Tillage Res. 2014, 144, 96–109. [Google Scholar] [CrossRef]
- Pascazio, S.; Crecchio, C.; Ricciuti, P.; Palese Assunta, M.; Xiloyannis, C.; Sofo, A. Phyllosphere and carposphere bacterial communities in olive plants subjected to different cultural practices. Int. J. Plant Biol. 2015, 6, 6011. [Google Scholar] [CrossRef] [Green Version]
- Sofo, A.; Ciarfaglia, A.; Scopa, A.; Camele, I.; Curci, M.; Crecchio, C.; Xiloyannis, C.; Palese, A. Soil microbial diversity and activity in a Mediterranean olive orchard using sustainable agricultural practices. Soil Use Manag. 2014, 30, 160–167. [Google Scholar] [CrossRef]
- Repullo-Ruibérriz de Torres, M.A.; Ordóñez-Fernández, R.; Giráldez, J.V.; Márquez-García, J.; Laguna, A.; Carbonell-Bojollo, R. Efficiency of four different seeded plants and native vegetation as cover crops in the control of soil and carbon losses by water erosion in olive orchards. Land Degrad. Dev. 2018, 29, 2278–2290. [Google Scholar] [CrossRef]
- Glenn, D.M.; Prado, E.; Erez, A.; McFerson, J.; Puterka, G.J. A reflective, processed-kaolin particle film affects fruit temperature, radiation reflection, and solar injury in apple. J. Am. Soc. Hortic. Sci. 2002, 127, 188–193. [Google Scholar] [CrossRef] [Green Version]
- Denaxa, N.-K.; Roussos, P.A.; Damvakaris, T.; Stournaras, V. Comparative effects of exogenous glycine betaine, kaolin clay particles and Ambiol on photosynthesis, leaf sclerophylly indexes and heat load of olive cv. Chondrolia Chalkidikis under drought. Sci. Hortic. 2012, 137, 87–94. [Google Scholar] [CrossRef]
- Brito, C.; Dinis, L.-T.; Ferreira, H.; Rocha, L.; Pavia, I.; Moutinho-Pereira, J.; Correia, C.M. Kaolin particle film modulates morphological, physiological and biochemical olive tree responses to drought and rewatering. Plant Physiol. Biochem. 2018, 133, 29–39. [Google Scholar] [CrossRef]
- Saour, G.; Makee, H. A kaolin-based particle film for suppression of the olive fruit fly Bactrocera oleae Gmelin (Dip., Tephritidae) in olive groves. J. Appl. Entomol. 2004, 128, 28–31. [Google Scholar] [CrossRef]
- Pascual, S.; Cobos, G.; Seris, E.; González-Núñez, M. Effects of processed kaolin on pests and non-target arthropods in a Spanish olive grove. J. Pest Sci. 2010, 83, 121–133. [Google Scholar] [CrossRef]
- Molden, D. Accounting for Water Use and Productivity-SWIM Paper 1; Colombo Sri Lanka: International Water Management Institute—IWMI, Alliance Headquarters: Rome, Italy, 1997. [Google Scholar]
- Barker, R.; Dawe, D.; Inocencio, A. Economics of water productivity in managing water for agriculture. In Water Productivity in Agriculture: Limits and Opportunities for Improvement; CABI Publishing: Wallingford, UK, 2003; Volume 1. [Google Scholar]
- Bouman, B. A conceptual framework for the improvement of crop water productivity at different spatial scales. Agric. Syst. 2007, 93, 43–60. [Google Scholar] [CrossRef]
- Sincik, M.; Candogan, B.; Demirtas, C.; Büyükcangaz, H.; Yazgan, S.; Göksoy, A. Deficit irrigation of soya bean [Glycine max (L.) Merr.] in a sub-humid climate. J. Agron. Crop Sci. 2008, 194, 200–205. [Google Scholar] [CrossRef]
- Blatchford, M.L.; Karimi, P.; Bastiaanssen, W.; Nouri, H. From global goals to local gains—A framework for crop water productivity. ISPRS Int. J. Geo-Inf. 2018, 7, 414. [Google Scholar] [CrossRef] [Green Version]
- Rodrigues, G.C.; Pereira, L.S. Assessing economic impacts of deficit irrigation as related to water productivity and water costs. Biosyst. Eng. 2009, 103, 536–551. [Google Scholar] [CrossRef] [Green Version]
- Pereira, L.S.; Cordery, I.; Iacovides, I. Improved indicators of water use performance and productivity for sustainable water conservation and saving. Agric. Water Manag. 2012, 108, 39–51. [Google Scholar] [CrossRef]
- Fernández, J.; Alcon, F.; Diaz-Espejo, A.; Hernandez-Santana, V.; Cuevas, M. Water use indicators and economic analysis for on-farm irrigation decision: A case study of a super high density olive tree orchard. Agric. Water Manag. 2020, 237, 106074. [Google Scholar] [CrossRef]
- OPEKEPE. Greek Payment Authority of Common Agricultural Policy (C.A.P.) Aid Schemes. Available online: http://www.opekepe.gr/2017 (accessed on 10 March 2022).
- Eurostat. Agriculture, Forestry and Fishery Statistics, 2020 edition. Available online: https://ec.europa.eu/eurostat/en/web/products-statistical-books/-/ks-fk-20-00 (accessed on 10 June 2022).
- Kourgialas, N.N.; Koubouris, G.C.; Dokou, Z. Optimal irrigation planning for addressing current or future water scarcity in Mediterranean tree crops. Sci. Total Environ. 2019, 654, 616–632. [Google Scholar] [CrossRef] [PubMed]
- Kourgialas, N.N.; Hliaoutakis, A.; Argyriou, A.V.; Morianou, G.; Voulgarakis, A.E.; Kokinou, E.; Daliakopoulos, I.N.; Kalderis, D.; Tzerakis, K.; Psarras, G. A web-based GIS platform supporting innovative irrigation management techniques at farm-scale for the Mediterranean island of Crete. Sci. Total Environ. 2022, 842, 156918. [Google Scholar] [CrossRef]
- Kourgialas, N.N. A critical review of water resources in Greece: The key role of agricultural adaptation to climate-water effects. Sci. Total Environ. 2021, 775, 145857. [Google Scholar] [CrossRef]
- Singh, R.; van Dam, J.C.; Feddes, R.A. Water productivity analysis of irrigated crops in Sirsa district, India. Agric. Water Manag. 2006, 82, 253–278. [Google Scholar] [CrossRef]
- Kourgialas, N.N.; Anyfanti, I.; Karatzas, G.P.; Dokou, Z. An integrated method for assessing drought prone areas-Water efficiency practices for a climate resilient Mediterranean agriculture. Sci. Total Environ. 2018, 625, 1290–1300. [Google Scholar] [CrossRef]
- Markakis, E.A.; Roditakis, E.N.; Kalantzakis, G.S.; Chatzaki, A.; Soultatos, S.K.; Stavrakaki, M.; Tavlaki, G.I.; Koubouris, G.C.; Bagkis, N.; Goumas, D.E. Characterization of Fungi Associated with Olive Fruit Rot and Olive Oil Degradation in Crete, Southern Greece. Plant Dis. 2021, 105, 3623–3635. [Google Scholar] [CrossRef] [PubMed]
- González-Núñez, M.; Pascual, S.; Cobo, A.; Seris, E.; Cobos, G.; Fernández, C.E.; Sánchez-Ramos, I. Copper and kaolin sprays as tools for controlling the olive fruit fly. Entomol. Gen. 2021, 41, 97–110. [Google Scholar] [CrossRef]
- Gertsis, A.; Zoukidis, K.; Mavridis, A. Evaluation of the water footprint and water use efficiency in a high density olive (Olea europea L.) grove system. Eur. Water 2017, 59, 357–363. [Google Scholar]
- Arampatzis, G.; Hatzigiannakis, E.; Pisinaras, V.; Kourgialas, N.; Psarras, G.; Kinigopoulou, V.; Panagopoulos, A.; Koubouris, G. Soil water content and olive tree yield responses to soil management, irrigation, and precipitation in a hilly Mediterranean area. J. Water Clim. Chang. 2018, 9, 672–678. [Google Scholar] [CrossRef]
- Mairech, H.; Lopez-Bernal, A.; Moriondo, M.; Dibari, C.; Regni, L.; Proietti, P.; Villalobos, F.J.; Testi, L. Is new olive farming sustainable? A spatial comparison of productive and environmental performances between traditional and new olive orchards with the model OliveCan. Agric. Syst. 2020, 181, 102816. [Google Scholar] [CrossRef]
- Ben Hassine, M.; Boussadia, O.; Moula, I.; El Hafi, M.; Braham, M. Methods to Estimate Water Use Efficiency (WUE) of Two Olive Tree Cultivars (Olea europaea L. cv Koroneiki and Chemlali) Under Water Restriction Conditions. In Proceedings of the Euro-Mediterranean Conference for Environmental Integration, Sousse, Tunisia, 20–25 November 2017; pp. 1181–1182. [Google Scholar]
- Fernandes-Silva, A.A.; Ferreira, T.C.; Correia, C.M.; Malheiro, A.C.; Villalobos, F.J. Influence of different irrigation regimes on crop yield and water use efficiency of olive. Plant Soil 2010, 333, 35–47. [Google Scholar] [CrossRef] [Green Version]
- Aïachi Mezghani, M.; Mguidiche, A.; Allouche Khebour, F.; Zouari, I.; Attia, F.; Provenzano, G. Water status and yield response to deficit irrigation and fertilization of three olive oil cultivars under the semi-arid conditions of Tunisia. Sustainability 2019, 11, 4812. [Google Scholar] [CrossRef] [Green Version]
- Naoum, S.; Albalawneh, A.; Ayoub, S.; Diab, M.; Amayreh, I.; Ammoush, M.; Kawaleet, B.; Daoud, L. Productivity of water, growth and yield of olive trees under deficit irrigation. In Proceedings of the VIII International Olive Symposium, Split, Croatia, 30 April 2018; pp. 261–266. [Google Scholar]
- Espejo-Pérez, A.J.; Rodríguez-Lizana, A.; Ordóñez, R.; Giráldez, J.V. Soil loss and runoff reduction in olive-tree dry-farming with cover crops. Soil Sci. Soc. Am. J. 2013, 77, 2140–2148. [Google Scholar] [CrossRef] [Green Version]
- Bombino, G.; Denisi, P.; Gómez, J.A.; Zema, D.A. Water infiltration and surface runoff in steep clayey soils of olive groves under different management practices. Water 2019, 11, 240. [Google Scholar] [CrossRef] [Green Version]
- Kourgialas, N.; Karatzas, G. A hydro-sedimentary modeling system for flash flood propagation and hazard estimation under different agricultural practices. Nat. Hazards Earth Syst. Sci. 2014, 14, 625–634. [Google Scholar] [CrossRef] [Green Version]
- EU. Scientific Council for an EU Common Agricultural Policy Serving the Public Good after 2020. In Scientific Advisory Council Agricultural Policy at the Federal Ministry for Food and Agriculture; EU: Luxembourg, 2018; p. 2018. [Google Scholar]
- Kourgialas, N.N.; Karatzas, G.P.; Nikolaidis, N.P. Development of a thresholds approach for real-time flash flood prediction in complex geomorphological river basins. Hydrol. Process. 2012, 26, 1478–1494. [Google Scholar] [CrossRef]
- Carmi, G.; Berliner, P. The effect of soil crust on the generation of runoff on small plots in an arid environment. Catena 2008, 74, 37–42. [Google Scholar] [CrossRef]


| Soil Texture Class | Number of Parcels | Mean Organic Matter (%) | Mean Bulk Density (g/cm3) | Mean Ph |
|---|---|---|---|---|
| Fine | 2 | 4.36 (SD: 0.28) | 1.33 (SD: 0.003) | 7.70 (SD: 0.57) |
| Medium | 13 | 3.86 (SD: 1.29) | 1.41 (SD: 0.026) | 7.55 (SD: 0.38) |
| Coarse | 3 | 4.36 (SD: 0.84) | 1.47 (SD: 0.040) | 7.70 (SD: 0.44) |
| Practice | Remarks |
|---|---|
| No weed mowing during winter | Reduce water losses from Runoff/Increase water infiltration into the soil/Reduce water erosion |
| No soil tillage | Reduce water erosion |
| Weed mowing during spring and summer | Reduce water losses by transpiration of weeds/reduce water losses by evaporation due to soil mulching |
| Introduction of cover crops–grass and legume mix | Reduce runoff water losses/Increase water infiltration into the soil/Reduce erosion |
| Winter pruning | Reduce water losses by transpiration |
| Summer pruning | Reduce water losses by transpiration |
| Shredding of pruning | Reduce water losses by evaporation (mulching) |
| Application of organic material (compost) | Increase water holding capacity/Reduce water losses through deep percolation |
| Application of aluminum silicate (kaolin–Surround® WP, Phoenix, AZ, USA) | Reduce heat stress/improve leaf functioning and water use efficiency |
| Application of fertilizers based on leaf and soil analyses (winter application) | Reduce mineral nutrient leaching/reduce groundwater pollution |
| Application of fertigation & foliar application of fertilizers | Increase the efficiency of fertilizing/reduce mineral nutrient leaching |
| Drip irrigation according to meteorological data and soil moisture data | Rational use of irrigation water/increase water use efficiency |
| Construction of runoff-reducing barriers | Reduce runoff water losses/Increase water infiltration into the soil/ Reduce water erosion |
| Indicators | Treatment | (2017) Irr. | (2017) NO Irr. | (2018) Irr. | (2018) NO Irr. | (2019) Irr. | (2019) NO Irr. |
|---|---|---|---|---|---|---|---|
| WP | T1 | 5.85 c | 2.50 ab | 2.02 a | 2.26 a | 4.68 bc | 6.71 cd |
| T2 | 6.39 c | 2.69 ab | 3.02 ab | 4.56 bc | 5.89 c | 8.53 d | |
| nsd | nsd | nsd | sd | nsd | nsd | ||
| EWP | T1 | 4.40 cd | 2.13 a | 2.03 a | 2.94 ab | 2.23 ab | 4.36 cd |
| T2 | 3.39 bc | 2.47 ab | 4.48 cd | 5.24 de | 4.48 cd | 5.93 e | |
| nsd | nsd | sd | sd | sd | sd | ||
| RF | T1 | 6.0 cd | 5.8 c | 1.6 ab | 2.9 ab | 9.3 ef | 11.7 f |
| T2 | 3.7 bc | 6.4 cd | 0.7 a | 1.0 ab | 6.3 cd | 8.7 de | |
| nsd | nsd | nsd | nsd | sd | sd | ||
| Y | T1 | 9694.4 d | 4406.3 ab | 8156.1 cd | 2628.6 a | 2445.5 a | 2348.4 a |
| T2 | 8303.0 cd | 3585.0 ab | 9969.4 d | 5748.8 bc | 3236.0 ab | 3123.8 ab | |
| nsd | nsd | nsd | sd | nsd | nsd |
Publisher’s Note: MDPI stays neutral with regard to jurisdictional claims in published maps and institutional affiliations. |
© 2022 by the authors. Licensee MDPI, Basel, Switzerland. This article is an open access article distributed under the terms and conditions of the Creative Commons Attribution (CC BY) license (https://creativecommons.org/licenses/by/4.0/).
Share and Cite
Kourgialas, N.N.; Psarras, G.; Morianou, G.; Pisinaras, V.; Koubouris, G.; Digalaki, N.; Malliaraki, S.; Aggelaki, K.; Motakis, G.; Arampatzis, G. Good Agricultural Practices Related to Water and Soil as a Means of Adaptation of Mediterranean Olive Growing to Extreme Climate-Water Conditions. Sustainability 2022, 14, 13673. https://doi.org/10.3390/su142013673
Kourgialas NN, Psarras G, Morianou G, Pisinaras V, Koubouris G, Digalaki N, Malliaraki S, Aggelaki K, Motakis G, Arampatzis G. Good Agricultural Practices Related to Water and Soil as a Means of Adaptation of Mediterranean Olive Growing to Extreme Climate-Water Conditions. Sustainability. 2022; 14(20):13673. https://doi.org/10.3390/su142013673
Chicago/Turabian StyleKourgialas, Nektarios N., Georgios Psarras, Giasemi Morianou, Vassilios Pisinaras, Georgios Koubouris, Nektaria Digalaki, Stella Malliaraki, Katerina Aggelaki, Georgios Motakis, and George Arampatzis. 2022. "Good Agricultural Practices Related to Water and Soil as a Means of Adaptation of Mediterranean Olive Growing to Extreme Climate-Water Conditions" Sustainability 14, no. 20: 13673. https://doi.org/10.3390/su142013673