
Optimizing the Mechanical Performance and Microstructure of Alkali-Activated Soda Residue-Slag Composite Cementing Materials by Various Curing Methods
Abstract
:1. Introduction
2. Experimental Section
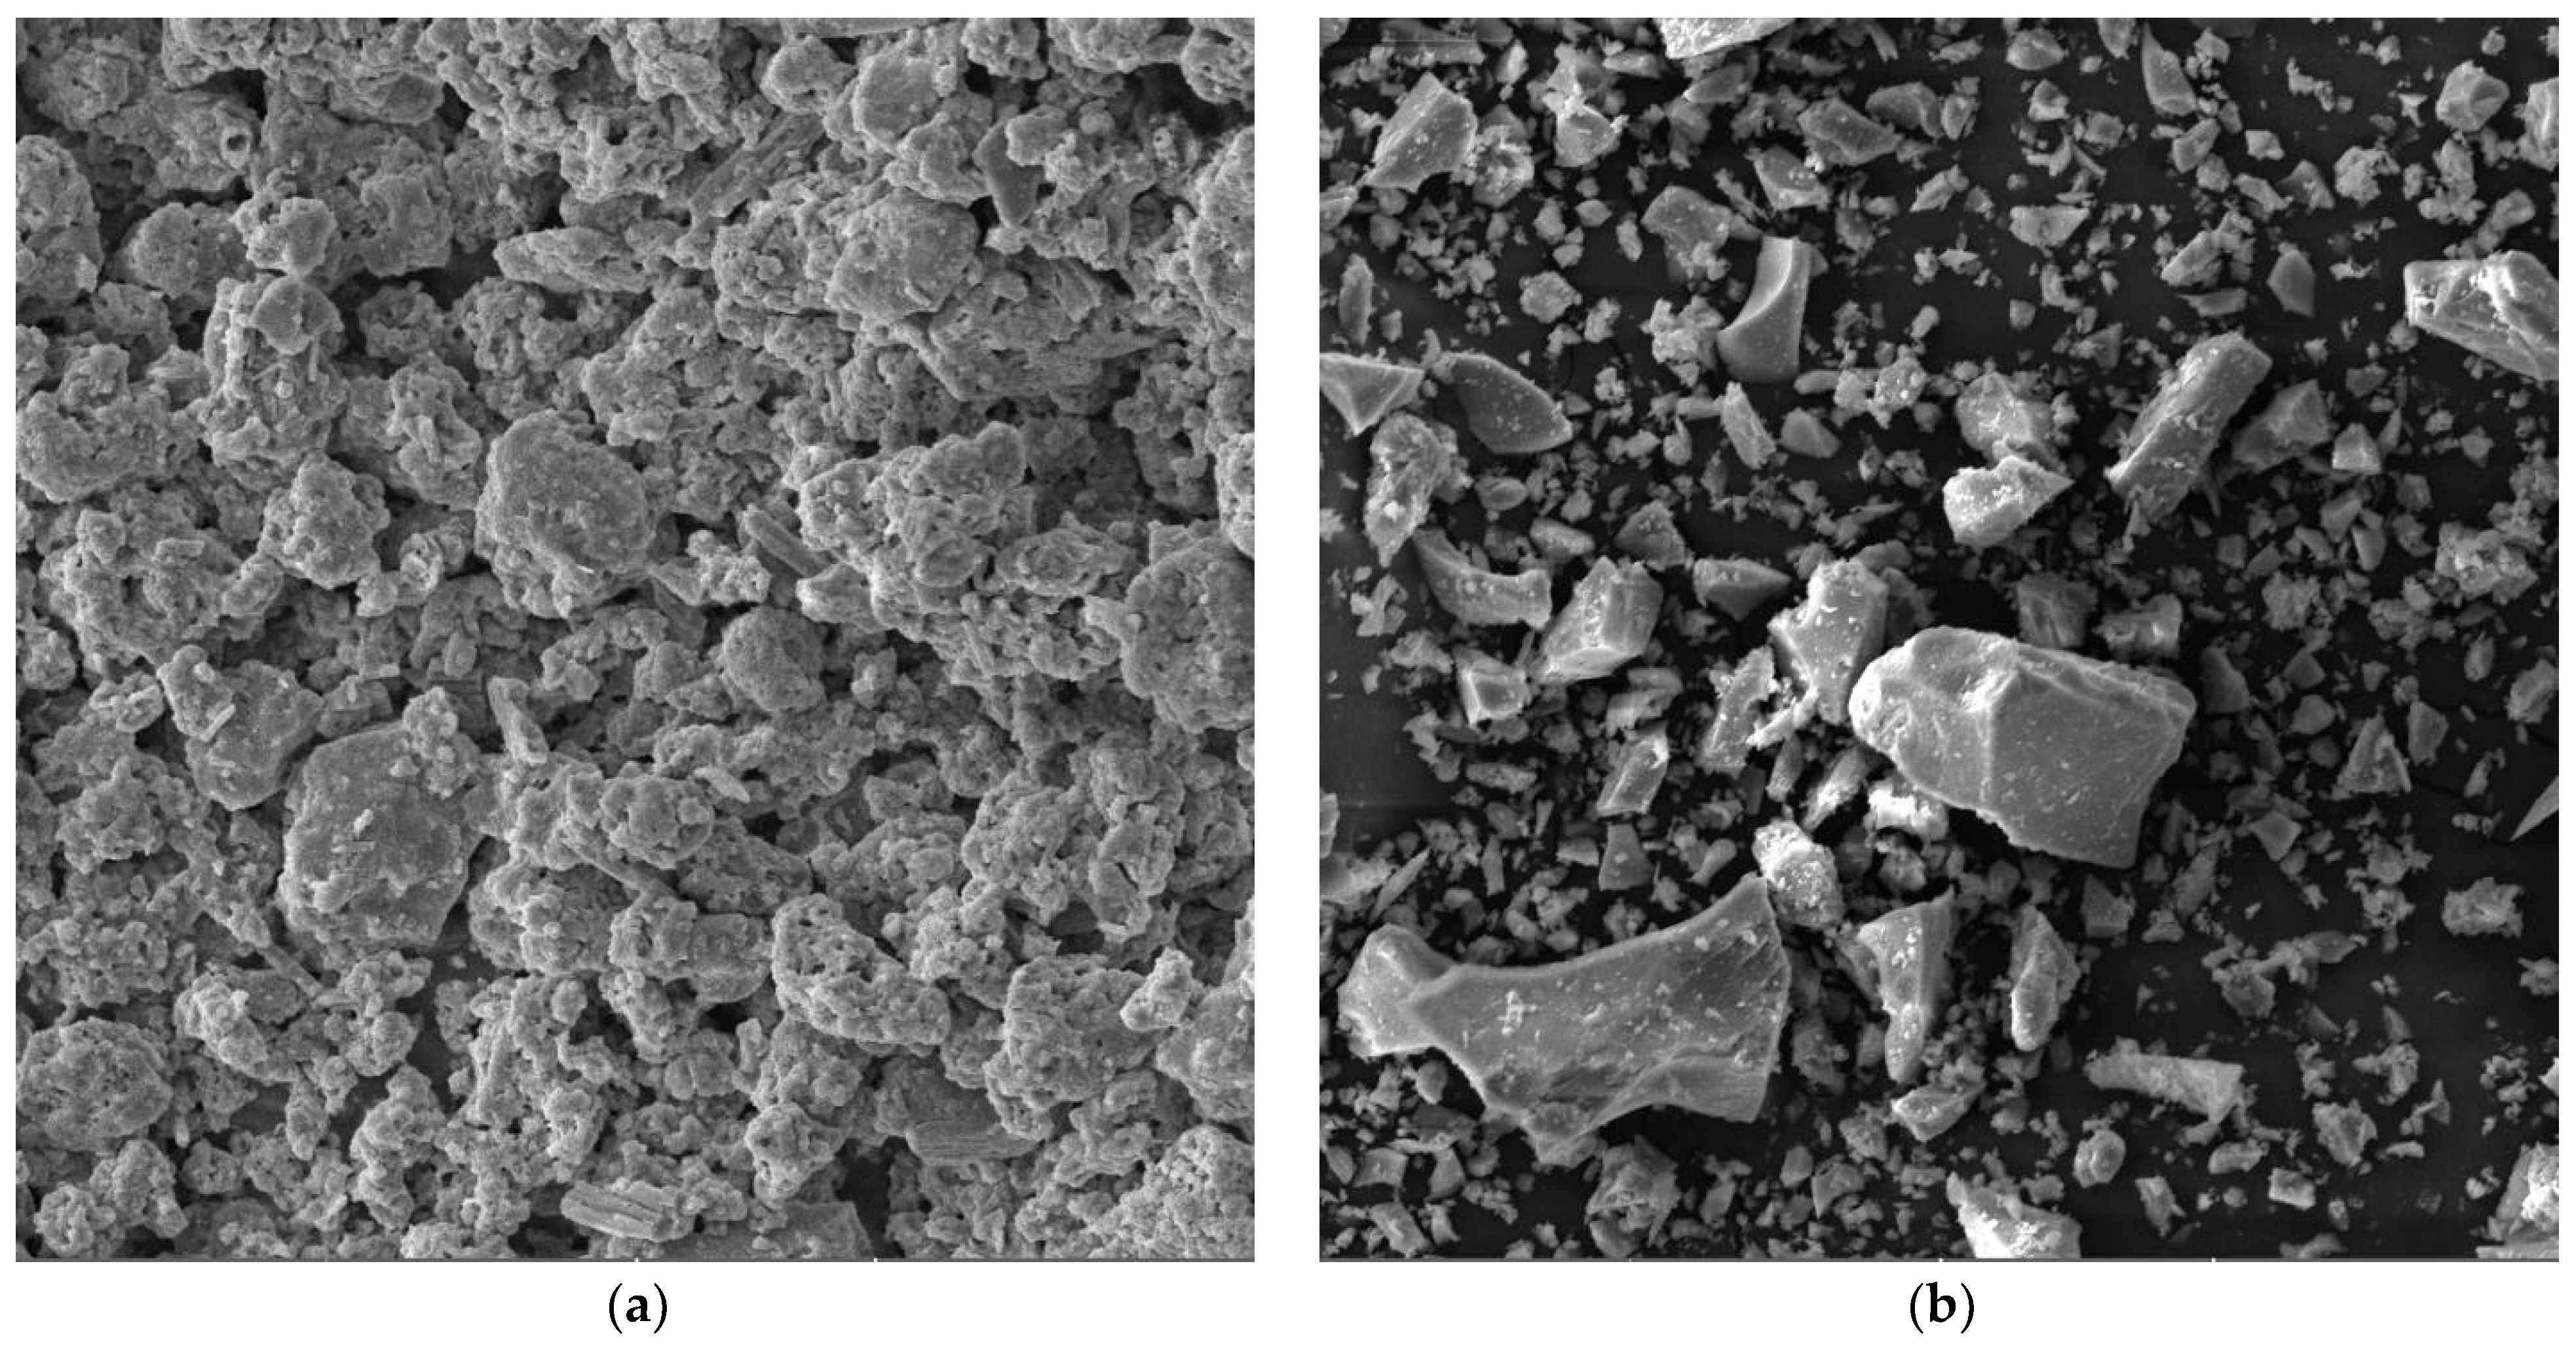
2.1. Materials
2.2. Mixing Ratios
2.3. Sample Preparation
2.4. Curing Procedures
2.5. Testing Procedure
3. Results and Discussion
3.1. Compressive Strength
3.1.1. Effect of the Curing Method on the Compressive Strength
3.1.2. Effects of High-Temperature Curing Temperature on Compressive Strength
3.1.3. Effect of High-Temperature Curing Time on Compressive Strength
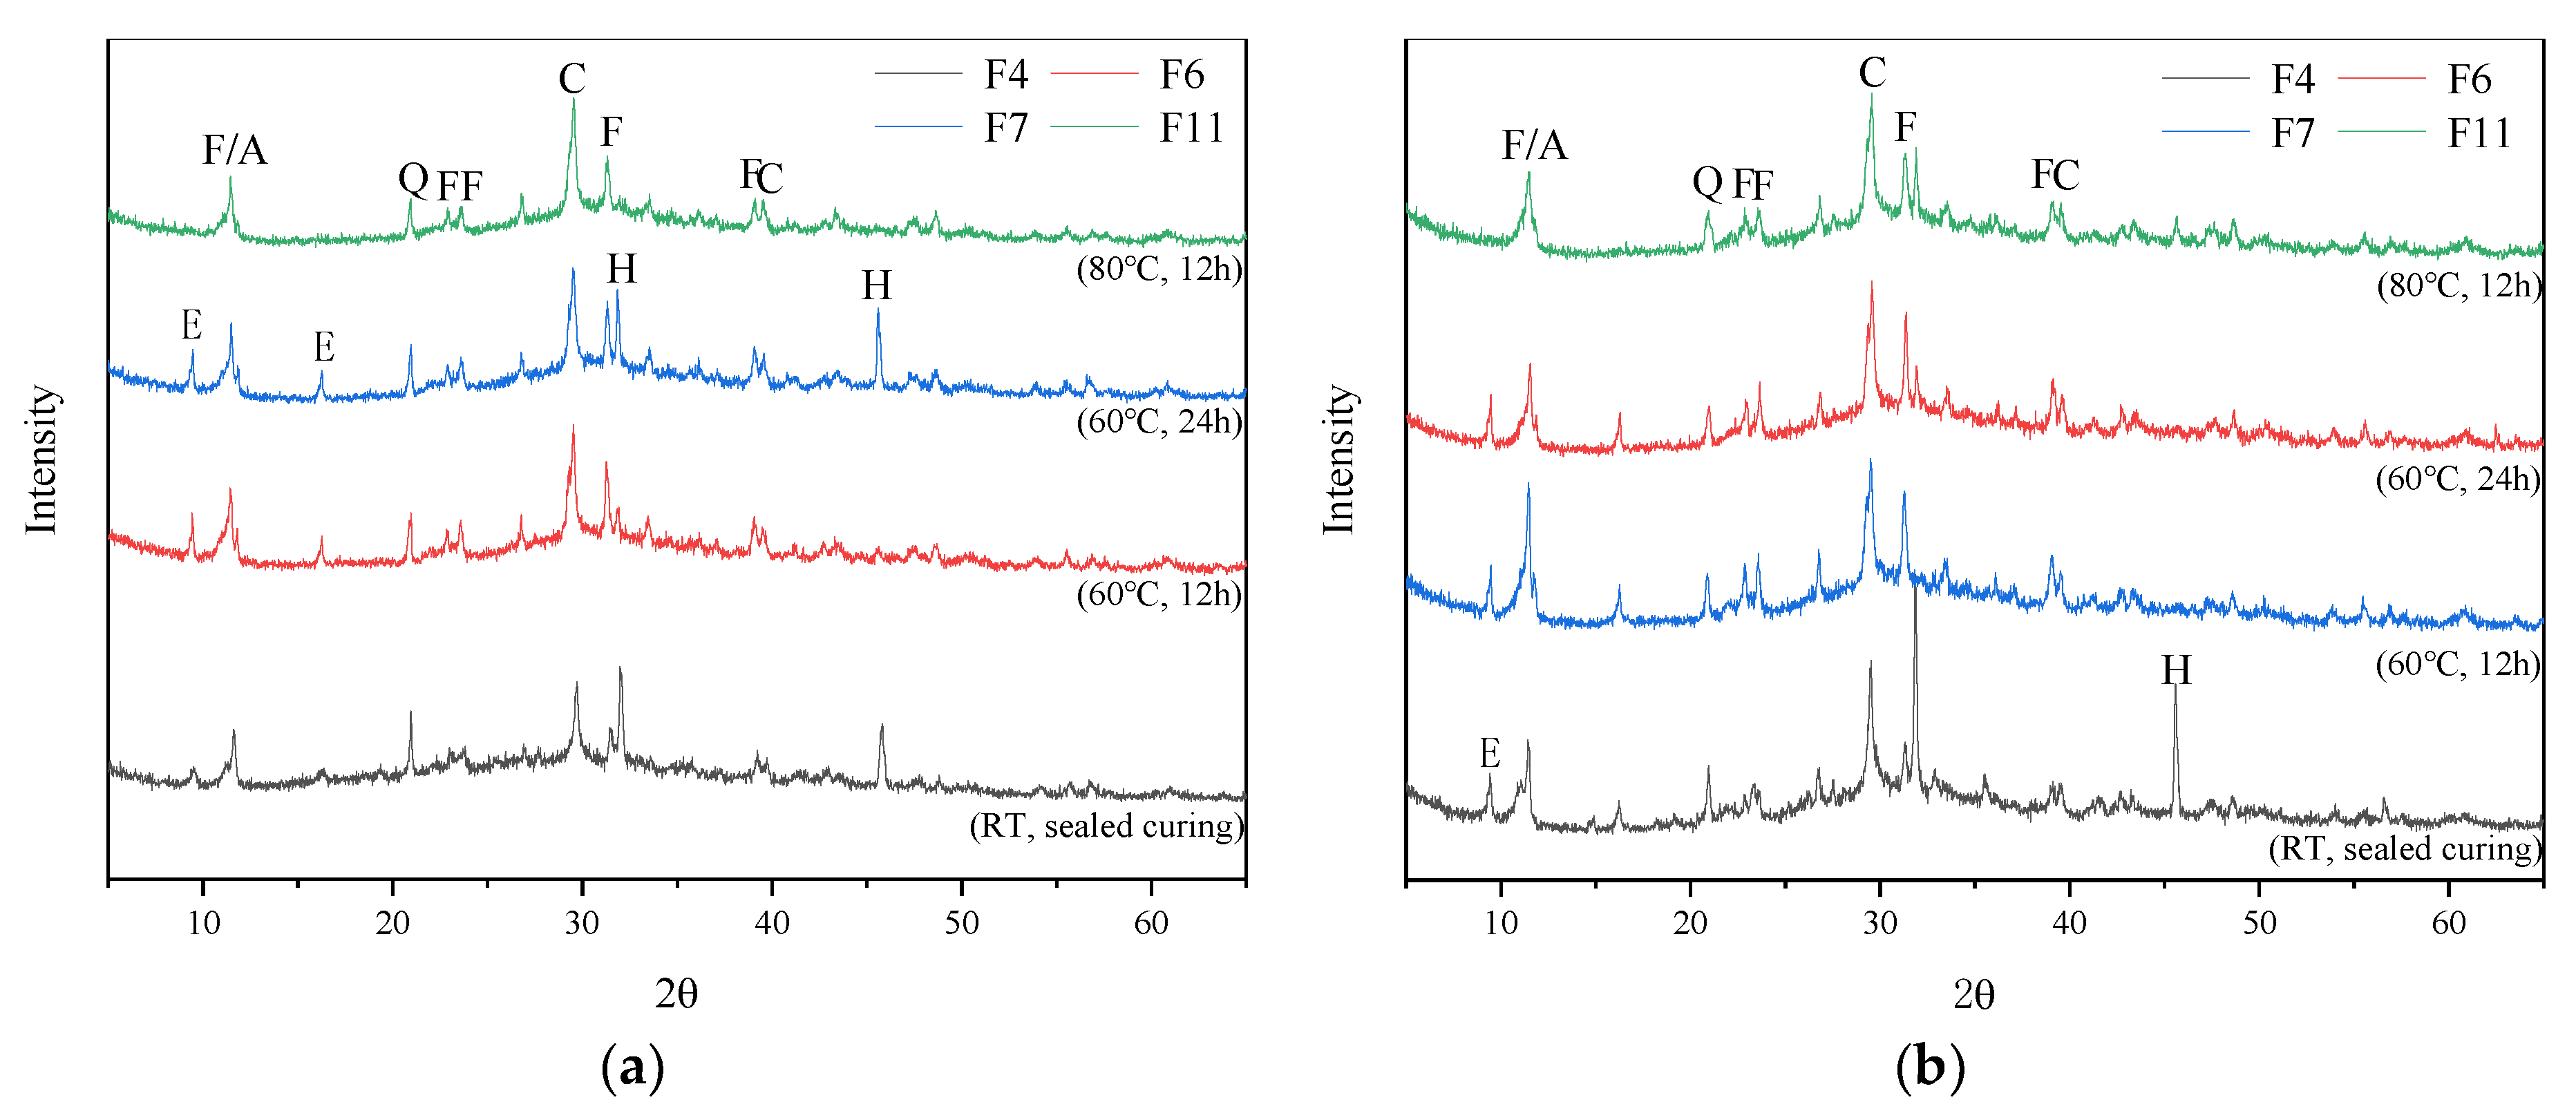
3.2. X-ray Diffraction (XRD) Analysis
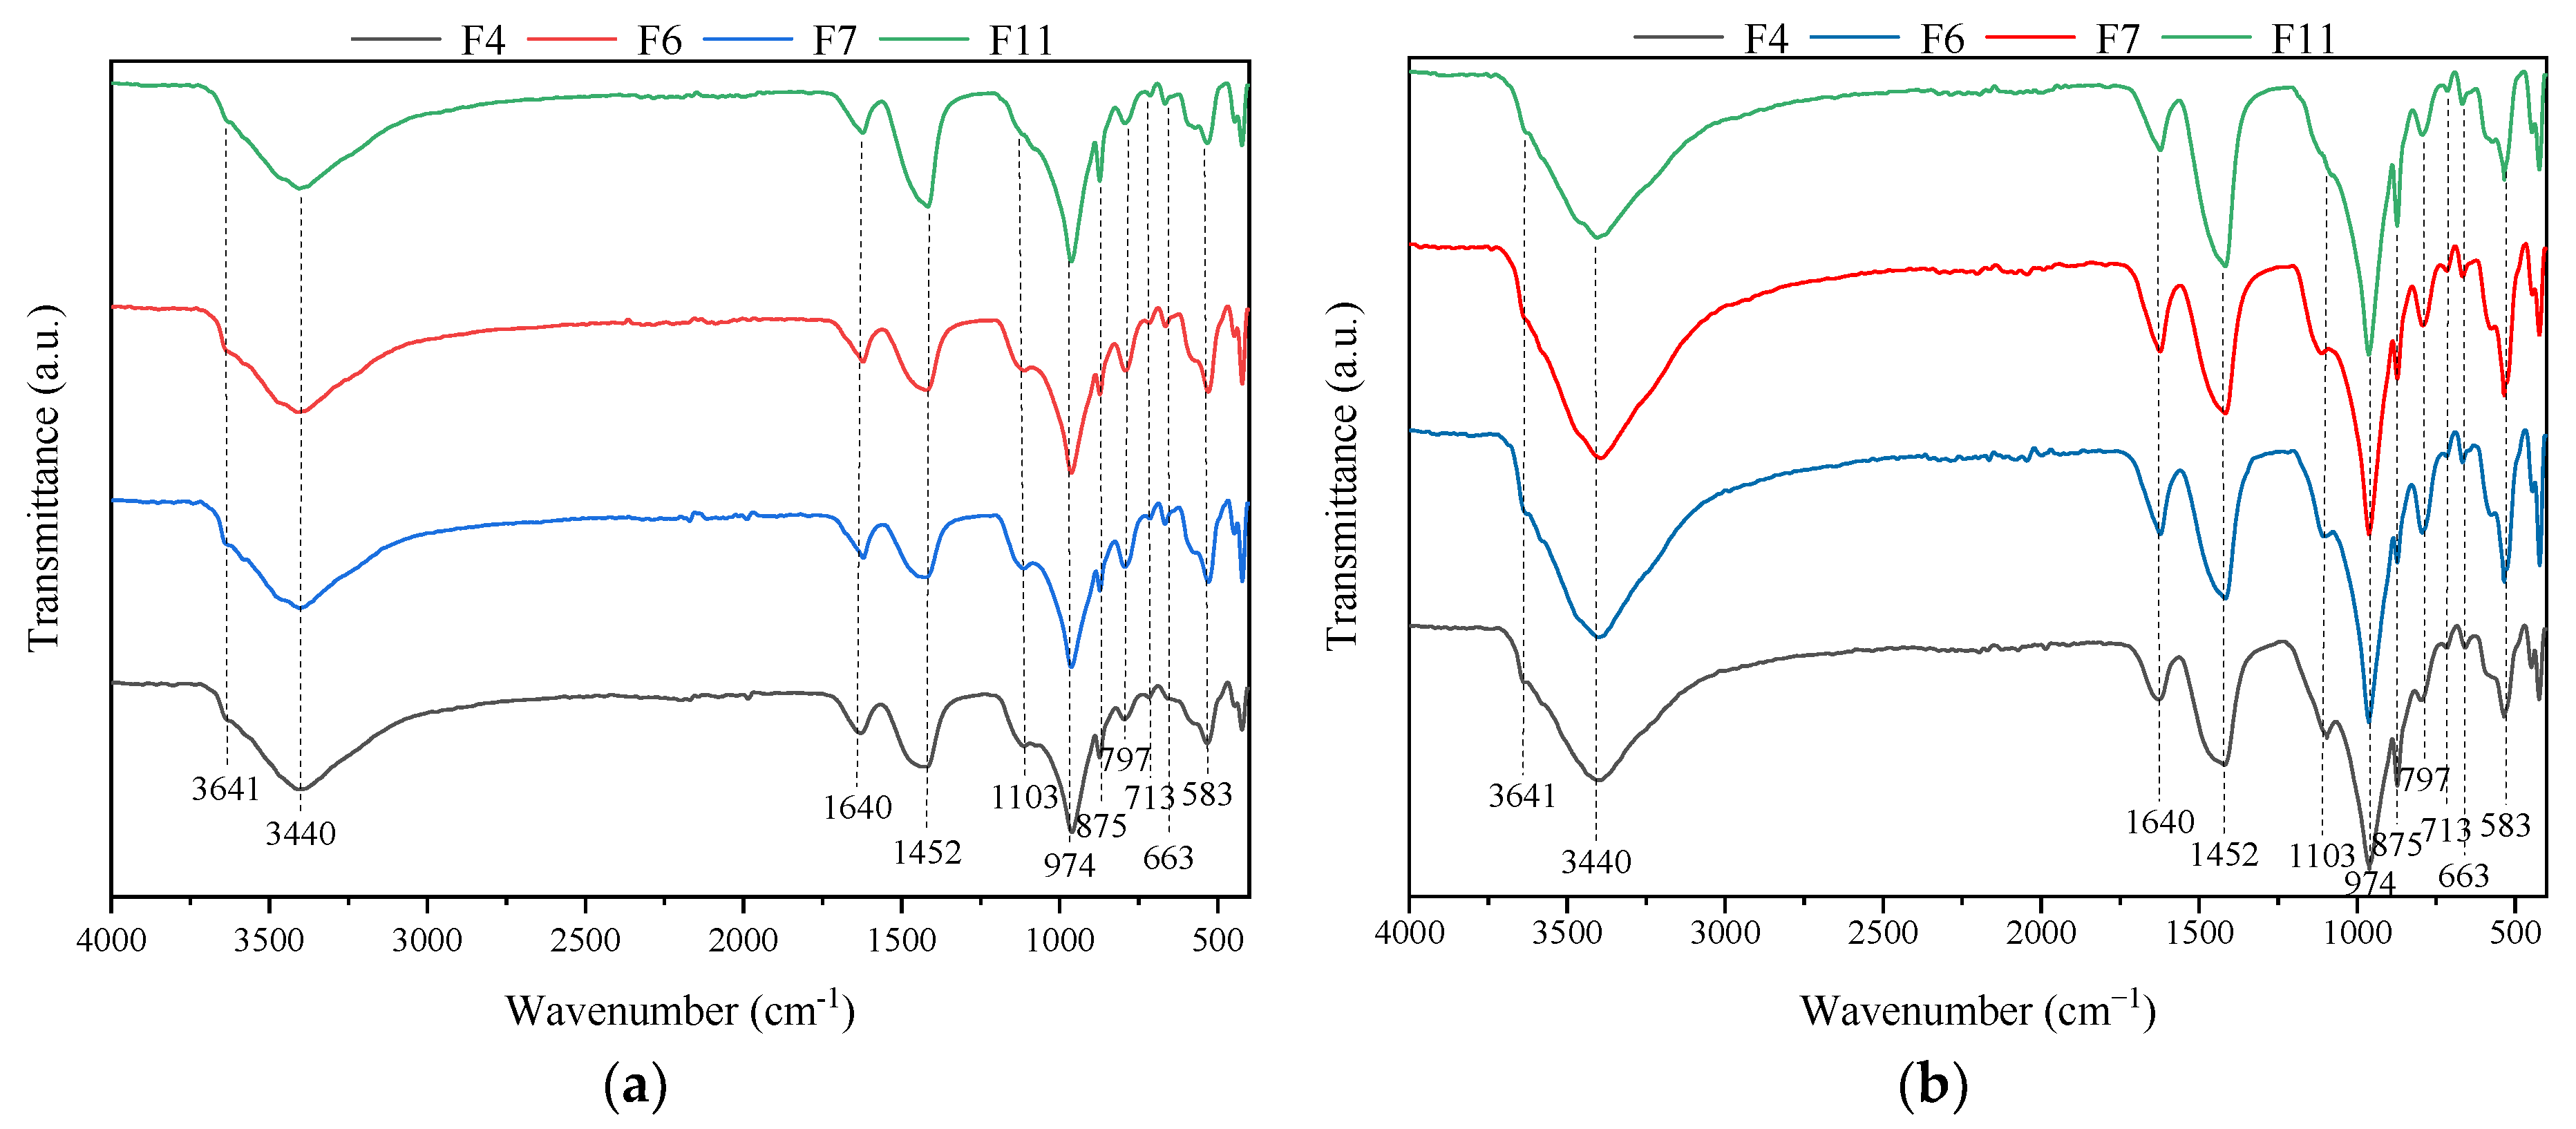
3.3. FTIR Analysis
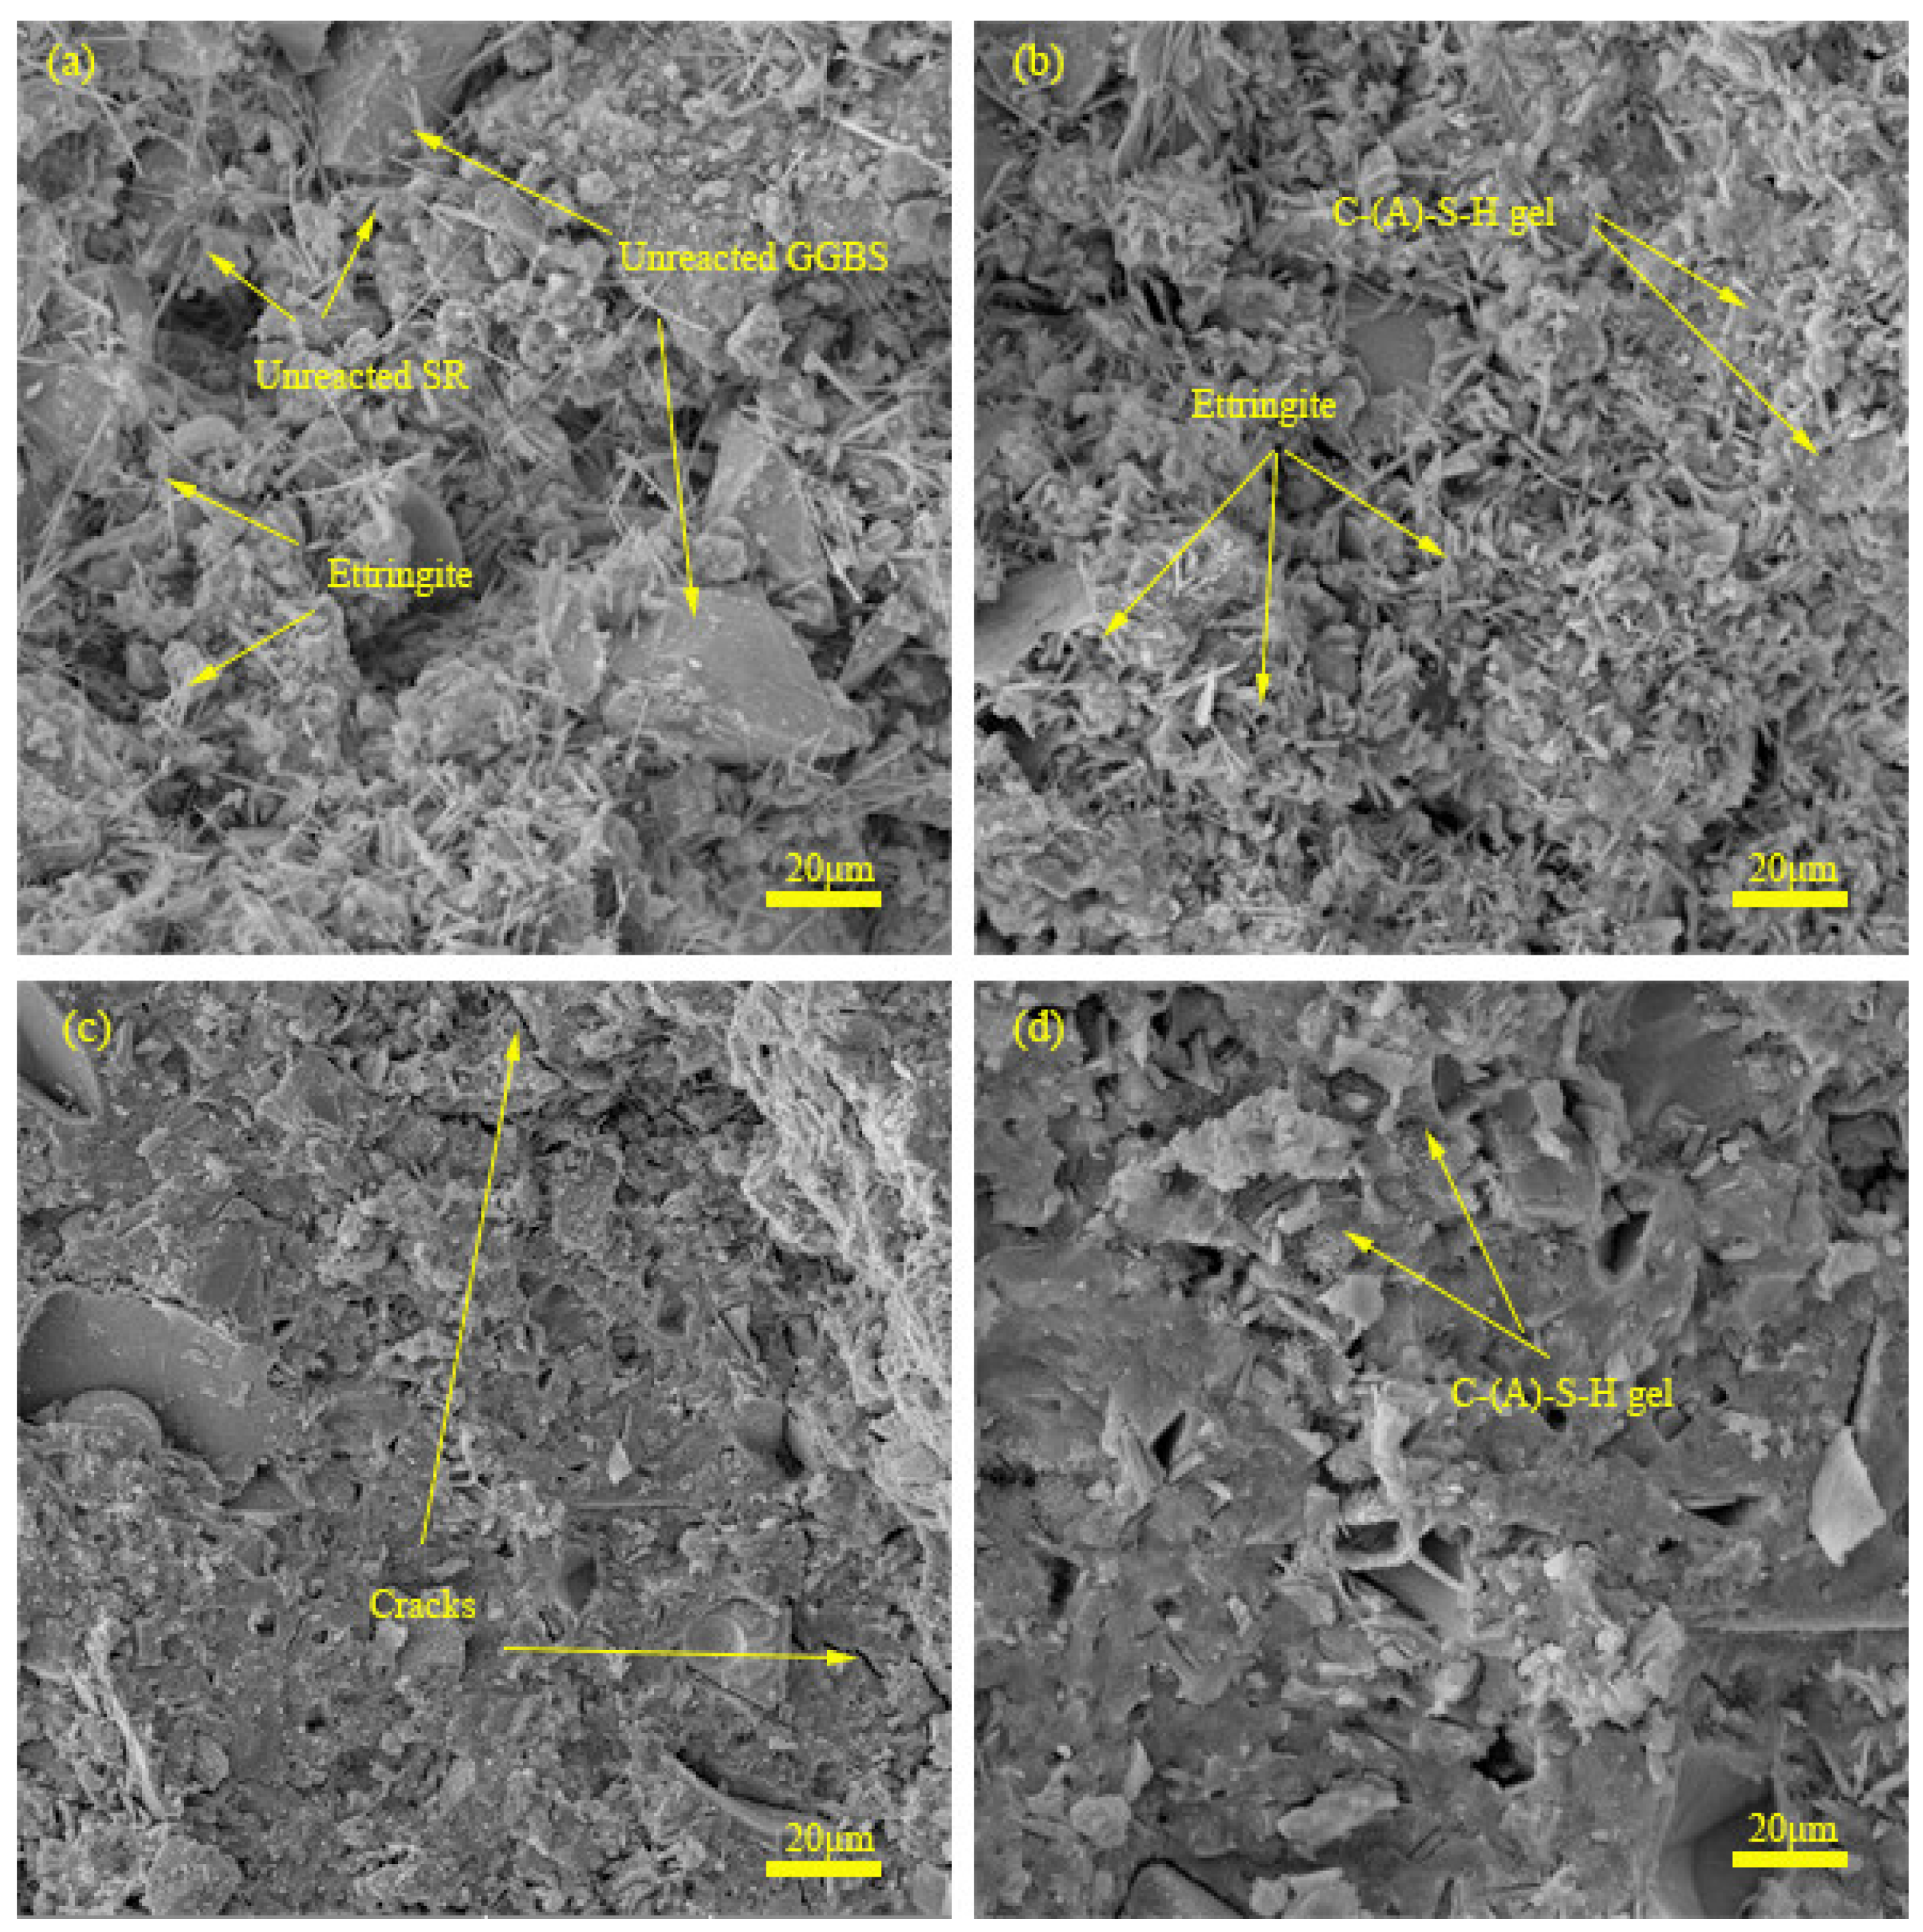
3.4. SEM Analysis
3.5. Thermogravimetry/Derivative Thermogravimetry Analysis (TG-DTG)
4. Conclusions
- (1)
- For alkali-activated SR-GGBS cementing samples under different curing conditions, the sample after RT sealed curing showed optimal mechanical performance. The compressive strength increased from 9.83 MPa at 3d to 28.96 MPa at 28d. However, under all curing conditions under study, samples exhibited low early strength and developed early in terms of long-term strength.
- (2)
- In contrast to the above four curing methods, HT curing at an appropriate temperature can remarkably enhance the early strength of the prepared alkali-activated SR-GGBS cementing materials without harming their long-term strength. This is because the hydration of GGBS is promoted at HT, generating more C-A-S-H gel and crystal hydration products, which fill the internal pores and improve the material integrity.
- (3)
- HT curing at 60 °C for 12 h proved to be the optimal method among the investigated ones. Noteworthy is that excessive HT curing deteriorates long-term strength, producing shrinkage cracks and hindering further strength development.
- (4)
- HT curing at 60 °C for 12 h is the most appropriate for preparing samples with high early strength in rapid construction. For the samples with a low requirement on early strength, RT sealed curing is suitable for reduced energy consumption and convenient operation advantages.
Author Contributions
Funding
Acknowledgments
Conflicts of Interest
References
- Guo, W.; Bai, Y.; Xu, Z.; Zhang, J.; Zhao, Q.; Wang, D. Stress-strain behavior of low-carbon concrete activated by soda residue-calcium carbide slag under uniaxial and triaxial compression. J. Build. Eng. 2022, 55, 104678. [Google Scholar] [CrossRef]
- Guo, W.; Zhang, Z.; Xu, Z.; Zhang, J.; Bai, Y.; Zhao, Q.; Qiu, Y. Mechanical properties and compressive constitutive relation of solid waste-based concrete activated by soda residue-carbide slag. Constr. Build. Mater. 2022, 333, 127352. [Google Scholar] [CrossRef]
- Zhang, Z.; Xie, C.; Sang, Z.; Li, D. Mechanical Properties and Microstructure of Alkali-Activated Soda Residue-Blast Furnace Slag Composite Binder. Sustainability 2022, 14, 11751. [Google Scholar] [CrossRef]
- Athira, V.; Bahurudeen, A.; Saljas, M.; Jayachandran, K. Influence of different curing methods on mechanical and durability properties of alkali activated binders. Constr. Build. Mater. 2021, 299, 123963. [Google Scholar] [CrossRef]
- Celikten, S.; Saridemir, M.; Deneme, I.O. Mechanical and microstructural properties of alkali-activated slag and slag plus fly ash mortars exposed to high temperature. Constr. Build. Mater. 2019, 217, 50–61. [Google Scholar] [CrossRef]
- Liu, Z.; Zhang, D.-W.; Li, L.; Wang, J.-X.; Shao, N.-N.; Wang, D.-M. Microstructure and phase evolution of alkali-activated steel slag during early age. Constr. Build. Mater. 2019, 204, 158–165. [Google Scholar] [CrossRef]
- Siddique, S.; Jang, J.G. Acid and sulfate resistance of seawater based alkali activated fly ash: A sustainable and durable approach. Constr. Build. Mater. 2021, 281, 122601. [Google Scholar] [CrossRef]
- Nedunuri, A.S.S.S.; Muhammad, S. Fundamental understanding of the setting behaviour of the alkali activated binders based on ground granulated blast furnace slag and fly ash. Constr. Build. Mater. 2021, 291, 123243. [Google Scholar] [CrossRef]
- Lv, W.; Sun, Z.; Su, Z. Study of seawater mixed one-part alkali activated GGBFS-fly ash. Cem. Concr. Compos. 2020, 106, 103484. [Google Scholar] [CrossRef]
- Adesanya, E.; Ohenoja, K.; Di Maria, A.; Kinnunen, P.; Illikainen, M. Alternative alkali-activator from steel-making waste for one-part alkali-activated slag. J. Clean. Prod. 2020, 274, 123020. [Google Scholar] [CrossRef]
- Jiao, Z.; Wang, Y.; Zheng, W.; Huang, W. Effect of the activator on the performance of alkali-activated slag mortars with pottery sand as fine aggregate. Constr. Build. Mater. 2019, 197, 83–90. [Google Scholar] [CrossRef]
- Bernal, S.A.; DE Gutierrez, R.M.; Provis, J. Engineering and durability properties of concretes based on alkali-activated granulated blast furnace slag/metakaolin blends. Constr. Build. Mater. 2012, 33, 99–108. [Google Scholar] [CrossRef]
- Kou, R.; Guo, M.-Z.; Han, L.; Li, J.-S.; Li, B.; Chu, H.; Jiang, L.; Wang, L.; Jin, W.; Poon, C.S. Recycling sediment, calcium carbide slag and ground granulated blast-furnace slag into novel and sustainable cementitious binder for production of eco-friendly mortar. Constr. Build. Mater. 2021, 305, 124772. [Google Scholar] [CrossRef]
- Gao, D.; Zhang, Z.; Meng, Y.; Tang, J.; Yang, L. Effect of Flue Gas Desulfurization Gypsum on the Properties of Calcium Sulfoaluminate Cement Blended with Ground Granulated Blast Furnace Slag. Materials 2021, 14, 382. [Google Scholar] [CrossRef]
- Guo, W.; Wang, S.; Xu, Z.; Zhang, Z.; Zhang, C.; Bai, Y.; Zhao, Q. Mechanical performance and microstructure improvement of soda residue–carbide slag–ground granulated blast furnace slag binder by optimizing its preparation process and curing method. Constr. Build. Mater. 2021, 302, 124403. [Google Scholar] [CrossRef]
- Nasir, M.; Johari, M.A.M.; Maslehuddin, M.; Yusuf, M.O.; Al-Harthi, M.A. Influence of heat curing period and temperature on the strength of silico-manganese fume-blast furnace slag-based alkali-activated mortar. Constr. Build. Mater. 2020, 251, 118961. [Google Scholar] [CrossRef]
- Zhao, X.; Liu, C.; Wang, L.; Zuo, L.; Zhu, Q.; Ma, W. Physical and mechanical properties and micro characteristics of fly ash-based geopolymers incorporating soda residue. Cem. Concr. Compos. 2019, 98, 125–136. [Google Scholar] [CrossRef]
- Song, R.; Zhao, Q.; Zhang, J.; Liu, J. Microstructure and Composition of Hardened Paste of Soda Residue-Slag-Cement Binding Material System. Front. Mater. 2019, 6, 211. [Google Scholar] [CrossRef]
- Guo, W.; Zhang, Z.; Bai, Y.; Zhao, G.; Sang, Z.; Zhao, Q. Development and characterization of a new multi-strength level binder system using soda residue-carbide slag as composite activator. Constr. Build. Mater. 2021, 291, 123367. [Google Scholar] [CrossRef]
- Zhao, X.; Liu, C.; Zuo, L.; Wang, L.; Zhu, Q.; Liu, Y.; Zhou, B. Synthesis and characterization of fly ash geopolymer paste for goaf backfill: Reuse of soda residue. J. Clean. Prod. 2020, 260, 121045. [Google Scholar] [CrossRef]
- Wang, Q.; Li, J.; Yao, G.; Zhu, X.; Hu, S.; Qiu, J.; Chen, P.; Lyu, X. Characterization of the mechanical properties and microcosmic mechanism of Portland cement prepared with soda residue. Constr. Build. Mater. 2020, 241, 117994. [Google Scholar] [CrossRef]
- An, Q.; Pan, H.; Zhao, Q.; Du, S.; Wang, D. Strength development and microstructure of recycled gypsum-soda residue-GGBS based geopolymer. Constr. Build. Mater. 2022, 331, 127312. [Google Scholar] [CrossRef]
- Lin, Y.; Xu, D.; Ji, W.; Zhao, X. Experiment on the Properties of Soda Residue-Activated Ground Granulated Blast Furnace Slag Mortars with Different Activators. Materials 2022, 15, 3578. [Google Scholar] [CrossRef]
- Christensen, A.N.; Jensen, T.R.; Hanson, J.C. Formation of ettringite, Ca6Al2(SO4)3(OH)12 center dot 26H2O, AFt, and monosulfate, Ca4Al2O6(SO4) center dot 14H2O, AFm-14, in hydrothermal hydration of Portland cement and of calcium aluminum oxide-calcium sulfate dihydrate mixtures studied by in situ synchrotron X-ray powder diffraction. J. Solid State Chem. 2004, 177, 1944–1951. [Google Scholar]
- Li, W.; Yi, Y. Use of carbide slag from acetylene industry for activation of ground granulated blast-furnace slag. Constr. Build. Mater. 2020, 238, 117713. [Google Scholar] [CrossRef]
- Yu, P.; Kirkpatrick, R.J.; Poe, B.; McMillan, P.F.; Cong, X. Structure of Calcium Silicate Hydrate (C-S-H): Near-, Mid-, and Far-Infrared Spectroscopy. J. Am. Ceram. Soc. 1999, 82, 742–748. [Google Scholar] [CrossRef]
- Mollah, M.Y.A.; Yu, W.; Schennach, R.; Cocke, D.L. A Fourier transform infrared spectroscopic investigation of the early hydration of Portland cement and the influence of sodium lignosulfonate. Cem. Concr. Res. 2000, 30, 267–273. [Google Scholar] [CrossRef]
- Ghosh, S.N.; Handoo, S.K. Infrared and Raman spectral studies in cement and concrete (review). Cem. Concr. Res. 1980, 10, 771–782. [Google Scholar] [CrossRef]
- Lodeiro, I.G.; Macphee, D.E.; Palomo, A.; Fernandez-Jimenez, A. Effect of alkalis on fresh C-S-H gels. FTIR Anal. Cem. Concr. Res. 2009, 39, 147–153. [Google Scholar] [CrossRef]
- Fernández, L.; Alonso, C.; Hidalgo, A.; Andrade, C. The role of magnesium during the hydration of C3S and C-S-H formation. Scanning electron microscopy and mid-infrared studies. Adv. Cem. Res. 2005, 17, 9–21. [Google Scholar] [CrossRef]
- Zhang, Y.; Sun, W.; Jia, Y.; Jin, Z. Composition and structure of hardened geopolymer products using infrared ray analysis methods. J. Wuhan Univ. Technol. 2005, 27, 31–34. [Google Scholar]
- Liu, X.; Zhao, X.; Yin, H.; Chen, J.; Zhang, N. Intermediate-calcium based cementitious materials prepared by MSWI fly ash and other solid wastes: Hydration characteristics and heavy metals solidification behavior. J. Hazard. Mater. 2018, 349, 262–271. [Google Scholar] [CrossRef]
- Rovnaník, P. Effect of curing temperature on the development of hard structure of metakaolin-based geopolymer. Constr. Build. Mater. 2010, 24, 1176–1183. [Google Scholar] [CrossRef]
- Abdalqader, A.F.; Jin, F.; Al-Tabbaa, A. Development of greener alkali-activated cement: Utilisation of sodium carbonate for activating slag and fly ash mixtures. J. Clean. Prod. 2016, 113, 66–75. [Google Scholar] [CrossRef]
- Schöler, A.; Lothenbach, B.; Winnefeld, F.; Zajac, M. Hydration of quaternary Portland cement blends containing blast-furnace slag, siliceous fly ash and limestone powder. Cem. Concr. Compos. 2015, 55, 374–382. [Google Scholar] [CrossRef]
- Bai, Y.; Guo, W.; Wang, J.; Xu, Z.; Wang, S.; Zhao, Q.; Zhou, J. Geopolymer bricks prepared by MSWI fly ash and other solid wastes: Moulding pressure and curing method optimisation. Chemosphere 2022, 307, 135987. [Google Scholar] [CrossRef]
- Zhang, J.; Tan, H.; He, X.; Yang, W.; Deng, X. Utilization of carbide slag-granulated blast furnace slag system by wet grinding as low carbon cementitious materials. Constr. Build. Mater. 2020, 249, 118763. [Google Scholar] [CrossRef]


| Material | Chemical Composition (wt/%)/% | |||||||||||
|---|---|---|---|---|---|---|---|---|---|---|---|---|
| CaO | SiO2 | Al2O3 | Fe2O3 | MgO | TiO2 | K2O | SO3 | MnO | Na2O | Cl− | LOI * | |
| GGBS | 33.70 | 32.60 | 17.10 | 1.18 | 7.96 | 2.54 | 0.57 | 3.21 | 0.31 | 0.56 | - | 2.14 |
| SR | 43.20 | 9.87 | 3.25 | 0.91 | 9.77 | 0.12 | 0.29 | 5.57 | - | 3.93 | 23.00 | 2.86 |
| Material | Physical Properties | |
|---|---|---|
| Specific Gravity (g/cm2) | Specific Surface Area (m2/kg) | |
| GGBS | 2.742 | 419.5 |
| SR | 2.351 | 261.2 |
| Sample ID | Dosage of Dry Basis/g | Sand/g | Water-to-Binder Ratio | Curing Method | |
|---|---|---|---|---|---|
| SR | GGBS | ||||
| F1 | 180 | 270 | 1350 | 0.5 | RT *, Water curing |
| F2 | RT *, Dry curing | ||||
| F3 | Standard curing | ||||
| F4 | RT *, Sealed curing | ||||
| F5 | 60 °C @ 6 h | ||||
| F6 | 60 °C @ 12 h | ||||
| F7 | 60 °C @ 24 h | ||||
| F8 | 40 °C @ 12 h | ||||
| F9 | 50 °C @ 12 h | ||||
| F10 | 70 °C @ 12 h | ||||
| F11 | 80 °C @12 h | ||||
Publisher’s Note: MDPI stays neutral with regard to jurisdictional claims in published maps and institutional affiliations. |
© 2022 by the authors. Licensee MDPI, Basel, Switzerland. This article is an open access article distributed under the terms and conditions of the Creative Commons Attribution (CC BY) license (https://creativecommons.org/licenses/by/4.0/).
Share and Cite
Zhang, Z.; Xie, C.; Sang, Z.; Li, D. Optimizing the Mechanical Performance and Microstructure of Alkali-Activated Soda Residue-Slag Composite Cementing Materials by Various Curing Methods. Sustainability 2022, 14, 13661. https://doi.org/10.3390/su142013661
Zhang Z, Xie C, Sang Z, Li D. Optimizing the Mechanical Performance and Microstructure of Alkali-Activated Soda Residue-Slag Composite Cementing Materials by Various Curing Methods. Sustainability. 2022; 14(20):13661. https://doi.org/10.3390/su142013661
Chicago/Turabian StyleZhang, Zhaoyun, Chuang Xie, Zhaohu Sang, and Dejun Li. 2022. "Optimizing the Mechanical Performance and Microstructure of Alkali-Activated Soda Residue-Slag Composite Cementing Materials by Various Curing Methods" Sustainability 14, no. 20: 13661. https://doi.org/10.3390/su142013661