1. Introduction
As China’s economy moves onto the “fast track”, some industries that were once committed to pursuing stable development are now wavering between gaining excessive profits and maintaining stability. Financial risks have also emerged alongside with the unregulated growth of big tech in the financial sector, bringing shocks one after another to the sector [
1]. In the face of current developments at home and abroad, where opportunities and challenges coexist, just like light and darkness, frequent financial risk events are constantly testing the stability of the financial ecosystem [
2], which has also entailed new and higher requirements for China’s financial risk prevention and control capability. On 17 August 2021, Chinese President Xi Jinping led a discussion on issues such as forestalling and defusing major financial risks at the 10th meeting of the Central Committee for Financial and Economic Affairs, and he stressed that the financial sector is a critical component of the modern economy that matters in terms of both development and security, calling for efforts to ensure the country’s financial stability based on market-oriented and law-based principles [
3].
As stated in The Commentary of Zuo—The Eleventh Year of the Duke Xiang of Lu, “Staying alert in times of peace to be well prepared for danger, hence no danger”. Nowadays, Black Swan, Gray Rhino, Golden Monkey, and White Elephant risks occur from time to time, so the prevention of financial risks should not slacken off at any moment. In a digital age featuring information technology (IT) and artificial intelligence (AI), solely relying on traditional regulatory models and analytical methods can no longer achieve efficient risk management [
4], and the integration of technology and innovation is once again of the upmost importance. The real estate industry is closely related to China’s social and economic development and living standards [
5]. With a long industrial chain, extensive coverage, and a huge impact, the real estate market has long been hit the hardest by financial risks. Although the efforts to cut off inventories in China’s real estate market paid off, it remains a top priority to continue to strengthen the capability to manage real estate financial risks, unleash the potential of the “primary productive force”, and promote the stable and sound performance of the real estate market [
6].
In recent years, real estate enterprises and regulatory departments have paid more attention to risk prevention, and with the help of technology, this has, to a certain extent, improved the sector’s anti-risk capability in specific fields (such as real estate investment and financing, project operation, financial supervision, etc.). This shows that technological progress can not only raise productivity, but also effectively prevent and defuse major financial risks. To deeply explore the interrelation between China’s real estate financial RMC and TC, this paper does not discuss the impact of a single specific technology on risk prevention, but, from the perspective of the technology support system (TSS), investigates the impact of the progress on the comprehensive strength of TC’s on improving financial risk management and carries out relevant analysis on the input to TC.
To strengthen the RMC of real estate finance, promote the sound development of the real estate market, and provide reference ideas, this paper adopts the following framework for analysis: First, we conduct a literature review to sort the research methods and findings in this area on the basis of clarified relevant concepts and describe the specific application of technology in the field of real estate; then, according to the modeling steps, we use system dynamics (SD) to model the TSS for real estate financial risk management, and the setting up of scenarios and a simulation are carried out; finally, we draw conclusions and make relevant policy recommendations based on simulation results.
2. Literature Review
Since ancient times, people have often taken real estate (housing) as a means to preserve value, making the financial attribute an inherent part of real estate [
7,
8]. When real estate and finance were on their “honeymoon”, the real estate industry gradually entered a “Gilded” Era. There is not yet a well-recognized official definition of real estate finance, but the understanding of it in academia is more or less consistent. David et al. argues that real estate finance is a monetary credit system for the construction, purchase, improvement, rental, maintenance, and repair of residential properties [
9]. According to Hua [
10] and Zhang and Yin [
11], real estate finance refers to the sum of all funding, financing, and other related financial services activities through currency circulation and credit channels for the development, construction, consumption, and other aspects of buildings (or land). According to Aalbers [
12], in the context of social and economic development, the definition of “real estate finance” can neither be limited to “housing finance”, nor should it be interpreted as “the sum of all activities for providing money and credit to real estate”. The definition should be based on its financial attribute and evolve with the times.
Science and technology is a primary productive force, and it is an important force in the promotion of the development of human society [
13]. When technology and finance work together, they can achieve the goal of optimizing resource allocation and promoting economic development [
14]. Revilla and Fernández [
15] argue that innovation in financial business is largely dependent on advancements in ICT, and it has been proven that ICT promote the deepening of capital through the restructuring of production and technological progress. Zhang and Zhao [
16] found that investment in fintech has different effects on technological innovation in different regions to some degree, but, in the short term, the two show a significant positive correlation. Blockchain technology can continuously improve the protection system of the financial sector and provide support for financial business innovation [
17,
18]. Furthermore, it can overcome the inherent obstacles in the real estate investment market, effectively simplify intermediate links, reduce transaction costs, and reduce the risk of fraud [
19]. The organic integration of AI and finance can effectively solve problems in the financial sector and unlock the potential of intelligent systems in the financial market [
20]. The application of technology in traditional financial regulation can help to provide early warning signs of potential financial risks in the market [
21], solve the problem of the insufficient correlation of financial data characteristics [
22], and better deal with the relevant risks in the financial sector and challenges thereby incurred to regulation [
23,
24]. These documents prove that technology can provide effective support for the development of the real estate industry.
With the high levels of integration in terms of technology and economy, the application of technology in the real estate market has become increasingly extensive, with this running through the whole process of real estate related business. The specific application of technology in the real estate field has been described in the literature. Azhar [
25] states that building information modeling (BIM) can achieve the objectives pursued by the architecture, engineering, and construction (AEC) industry, such as decreasing project costs, improving productivity and quality, and reducing project delivery time technologies. BIM technology can effectively help engineers and builders to identify potential design, procurement, construction, or operational issues using digital building information models that contain accurate geometry and related data. According to Jeong and Ahn [
26], the real estate contract system realizes online contract management and contract forgery identification through the blockchain, which can simultaneously ensure the reliability and scalability of the system and effectively prevent fraud. Industry 4.0 recognizes a broad set of technologies that rapidly redefine industries, including the real estate industry. These broad technologies include the Internet of things (IoT), cloud computing, decision automation, machine learning, and artificial intelligence. Nowadays, applying the technology of Industry 4.0 to the real estate framework (a concept that encompasses fintech and proptech) has an important impact on maintaining the value of real estate investment and enhancing the experience of real estate users [
27]. Knowing the exact real-time value of any property is critical to making smart purchases and selling, so the online real estate database company Zillow has combined technology with real estate to develop a machine learning system to predict real estate sales prices in real time [
28]. Cheng et al. [
29] found that although the use of AI technology has spread to all walks of life, it has not been fully applied in the real estate industry. If the tacit knowledge used by experts to estimate property values is extracted, it will help to serve ordinary users and is expected to solve various problems relating to real estate price prediction, customer reception, floor plan identification, and real estate search support.
Currently, the system dynamic method is applied in relevant research in fields such as technology, finance, and management, and it plays an important role in exploring causality, path analysis, and simulation, etc. System dynamics (SD) is a system simulation method introduced by Professor J.W. Forrester at the Massachusetts Institute of Technology (MIT) in 1958 [
30]. It reveals the intricate relationships between factors [
31]. In this method, based on the actual observations of the system, a goodness of fit is tested by computer software, and a further prediction is made [
32]. This method can solve long-term or periodic problems and explore the common characteristics of complex social problems in the case of insufficient data [
33]. Therefore, it is suitable for the subject of study in this paper. Chen et al. [
34] explored the relationships between desired technologies and the dynamic business environment to help corporate decision-makers to better implement their plans. Li et al. [
35] found that fintech can support the development of high-tech industries, and that market-based fintech is more effective in this regard than public fintech. Xiao et al. [
36] analyzed the influence of technology, investment, and policy factors on the natural gas industry. Wen and Zhang [
37] established an SD model of fintech-supported sci-tech development and found that fintech plays a positive role in promoting sci-tech development. Oleghe [
38] constructed a simulation model and studied the mechanism of how an aquaculture company should implement its gradual capacity expansion plan without damaging its financial performance or affecting the performance of the value chain. Pasqualino et al. [
39] constructed a novel integrated global food and energy security systems dynamics model for addressing systemic risks to food security. Dabirian et al. [
40] analyzed the effects of financial policies on a cash flow system to meet project performance goals and improve profitability. Trevillion [
41] used system dynamics to study the dynamics of the British commercial real estate market and simulate the impact of various market variables on rent growth.
To sum up, academics have used a combination of qualitative and quantitative analysis in their studies. Most studies focus on the influence of technology on innovation, the dynamics between technology and risk, and the links between technology and the economy, but very few focus on the relationships between real estate financial risk and TC. Therefore, the study of the interaction between the TSS and real estate financial risk management is of great practical significance, as it can not only make clear their interconnection but also provide a reference for forestalling and defusing major financial risks and promoting stable social and economic development.
3. Simulation Model
This paper adopts SD to build, operate, and analyze simulation models, as it studies the dynamics between RMC (specifically financial risk) and TC in China’s real estate sector. The rationale behind constructing the simulation model is as follows: first, identify the core factors affecting real estate financial risk and TC; second, explore the linkages between the variables of the systems and their influence paths; then, assign parameter values and set equations based on the stock and flow diagrams for relevant variables; finally, construct an SD model of the technology support system for real estate financial risk management.
3.1. Variables Selection
The core variables of the simulation model are real estate financial RMC and TC, so selecting reasonable and reliable quantitative data to measure the two is the priority in terms of the modeling.
For the measurement of real estate financial risk, we adopt the “three red lines” (The “three red lines” represent the first time that the Chinese government clarified the debt standards for real estate companies. It aims to implement a prudent management system for real estate finance and enhance the marketization, regulation, and transparency of real estate enterprise financing. The “three red lines” originate from: (1)
http://www.gov.cn/xinwen/2020-08/23/content_5536753.htm (accessed on 17 September 2022); (2)
https://baike.fang.com/item/%E4%B8%89%E6%9D%A1%E7%BA%A2%E7%BA%BF/6781094 (accessed on 17 September 2022)) metrics (i.e., total liabilities/total assets, excluding customer deposits or advances, not exceeding 70%, net debt/total equity not exceeding 100%, and total cash/short term debt greater than one) proposed by the People’s Bank of China (PBoC) and the China Banking and Insurance Regulatory Commission (CBIRC), among others, in August 2020. Specifically, we obtained the “three red lines” data of 116 listed real estate companies from 2010 to 2020 from the iFinD database. These financial indicators in the “three red lines” can measure risks and play an important role in monitoring, early warning and risk control [
42,
43,
44]. Due to the unavailability of data, we could not obtain relevant data on unlisted real estate companies, so we had to select data from 116 listed real estate companies (most of the well-known Chinese real estate companies are among them) to approximate the entire industry. As the “red” (three red lines crossed), “orange” (two crossed), and “yellow” (one crossed) companies are all at varying degrees of risk, all the three types should be included in the calculation. The formula for the calculation of the annual real estate market risk is as follows.
After the real estate financial risk was quantified, we needed to consider its correlation with RMC. Real estate financial risk and RMC are closely and negatively correlated in general, i.e., a lower real estate financial risk indicates a stronger RMC.
For the measurement of real estate TC, the paper referred to Li et al. [
35] and Wen and Zhang [
37], that is, we described the capability, which is based on the major S&T metrics and related classifications established by the Ministry of Science and Technology of the People’s Republic of China for each region, in two parts: S&T resources and S&T achievements. S&T resources mainly consist of R&D personnel and funding, while S&T achievements are measured by the number of papers and patents. For the number of R&D personnel, the data were from the iFinD database, i.e., the number of people employed in research and technology, with this being surveyed over the years, and it should be noted that we had to use the overall economy R&D headcount to approximate the R&D headcount of a real estate company (because of data unavailability, general technology will also have an impact on real estate markets). The data on research funding were obtained from China’s annual Communique on National Expenditures on Science and Technology, with the number of papers equaling the number of papers found in the Web of Science (WoS) by searching with the keywords “China”, “real estate”, and others and the number of patents being the sum of patents obtained from the Derwent World Patents Index (DWPI) by searching with keywords such as “China”, “real estate”, and others related to real estate. Through the search keywords, the content was focused on the relevant technologies applied in the Chinese real estate market, which met the requirements of our research.
In addition, after making clear the linkages between real estate financial RMC and TC and the characteristics thereof, this study, using relevant statistics, selected a total of 22 indicator variables, i.e., four level variables, four rate variables, and fourteen auxiliary variables, for subsequent simulation and analysis. The main variables of the model are shown in
Table 1 below.
3.2. Stock and Flow Diagram Analysis
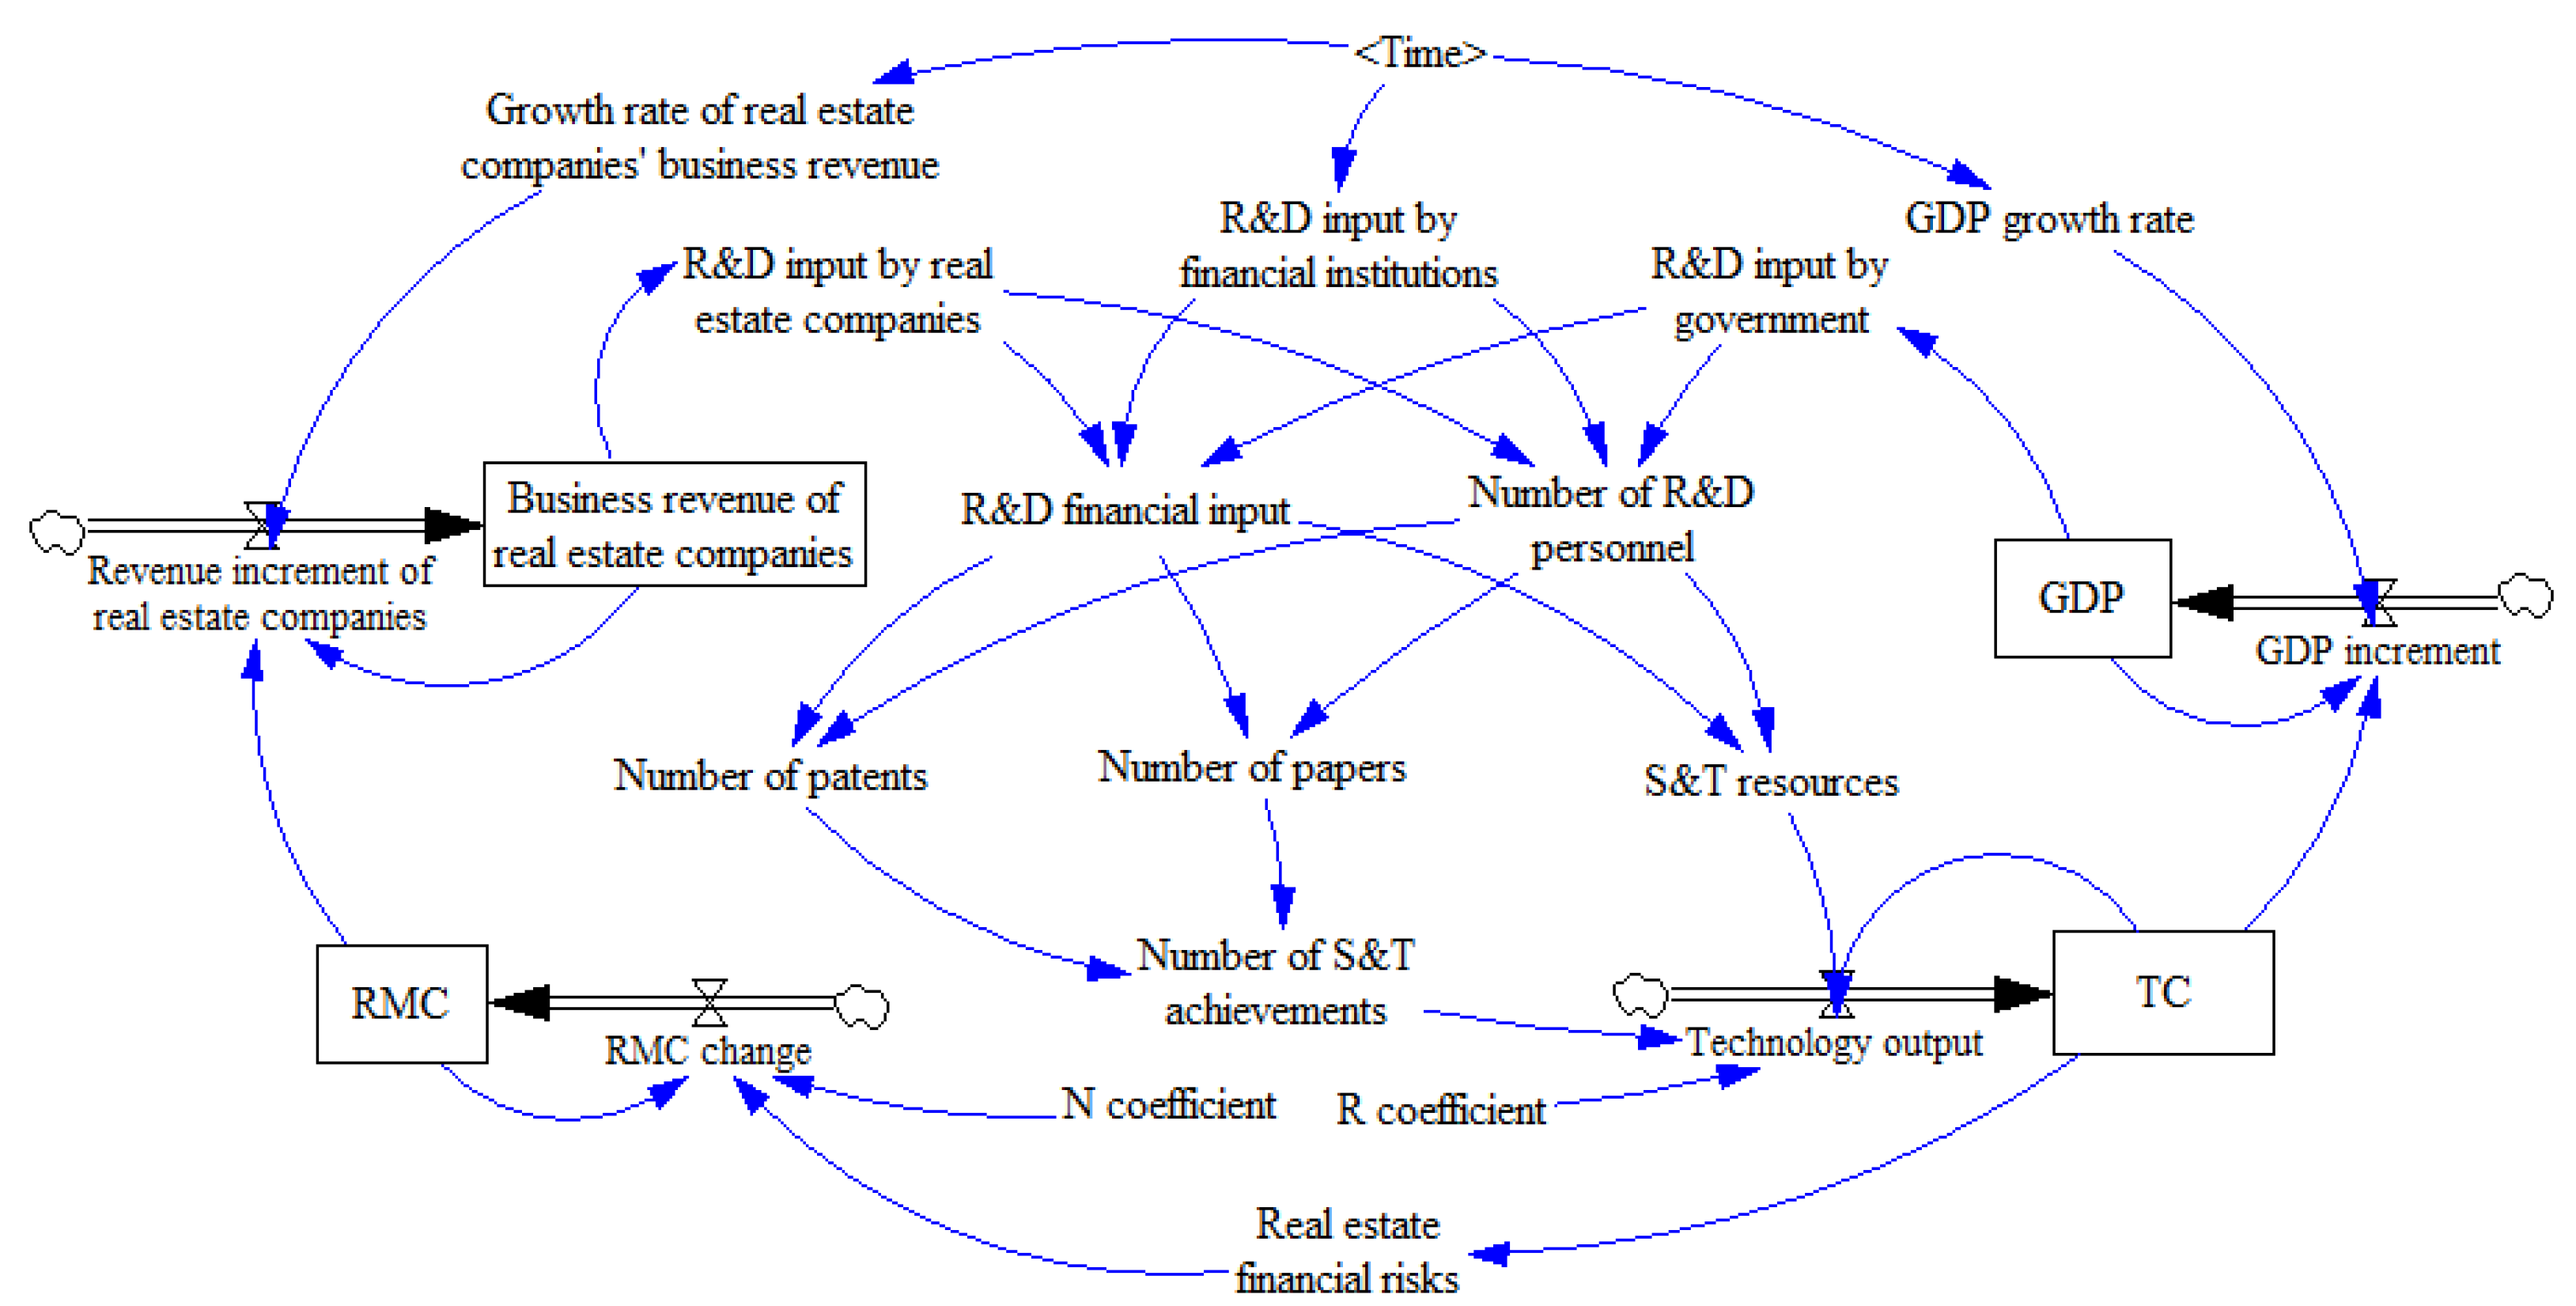
There are two core feedback loops in the TSS model for real estate financial risk management: the loop of RMC improvement and the loop of TC support. In the loops, the symbol (+/−) before a variable represents the positive/negative influence of the variable before the symbol has on the one after the symbol. The following is a brief analysis of the above feedback loops.
(1) The loop of RMC enhancement: RMC → +revenue increment of real estate companies → +business revenue of real estate companies → +R&D input by real estate companies → +R&D financial input/the number of R&D personnel → +the number of patents/the number of papers/S&T resources → +the number of S&T achievements → +S&T output → +TC → −real estate financial risk → +change in RMC → +RMC.
(2) The loop of TC support: TC → +GDP increment → +GDP → +R&D input by government → +R&D financial input/the number of R&D personnel → +the number of patents/the number of papers/S&T resources → +the number of S&T achievements → +S&T output → +TC.
The loops above show that loop (1) indicates that the improvement of real estate RMC can effectively increase the business revenue of real estate enterprises, which in turn boosts their investment in R&D, allowing them to make better scientific judgments on risks, hence resulting in a stronger RMC. Loop (2), meanwhile, indicates that GDP increases with the improvement in TC, which provides solid evidence for countries to increase their R&D financial input, resulting in an ever-stronger TC.
The stock and flow diagram of the TSS mode for real estate financial risk management is shown in
Figure 1. In this paper, 2010 is marked as the initial year for the simulation study of the model, and the initial values of the variables are equivalent to the data of this year. The model parameters are determined based on the 2010–2020 data.
3.3. Parametric Equations
The data used to construct the SD model in this paper are from China’s National Bureau of Statistics (NBS), iFinD database, DWPI, WoS, and the Communique on National Expenditures on Science and Technology in previous years. As there are many variables and equations involved in the model, only the major equations are listed as follows:
(1) Setting table functions.
Due to the complex non-linear relationships between some variables in the model, variables in the stock and flow diagram such as GDP growth rate, the growth rate of real estate companies’ business revenue, and financial institutions’ R&D input are directly taken from the National Bureau of Statistics and iFinD.
(2) Description of mathematical equations.
The mathematical equations in this paper mainly include basic formulae and regression equations, with all the regression equations using the OLS method. Some of the formulae and equations are as follows.
In addition to the two methods above, linear fitting and literature summaries are used to establish the functional relations of the model.
3.4. Model Error Analysis
This paper explores the dynamics between RMC and TC in China’s real estate sector by simulating the core variables with Vensim DSS software; the data are based on China’s historical data from 2010 to 2020. Due to space limitations, only the process of comparing the errors in terms of GDP and real estate business revenue is elaborated on in this paper, as shown in
Table 2. The average relative errors (REs) for GDP and real estate business revenue are 4.28% and 8.42%, respectively, and they are within the acceptable limits, which indicates that the model as a whole performs relatively well in terms of linear fitting and the data are reliable.
4. Simulation Analysis
4.1. Scenario Setting
In order to explore the interconnection between RMC and TC in China’s real estate sector in depth and to examine whether an improvement in TC can effectively improve RMC, this study designed six policy simulation scenarios and carried out simulation and comparative analysis by moderating the policy variables of the model. The scenarios are set out as follows.
Scenario 1: Observe the dynamics between RMC and TC, ceteris paribus, to simulate the changes in each variable over the baseline period.
Scenario 2: Observe the changes in TC and RMC under the condition of increased R&D personnel (up by 50%), ceteris paribus, and simulate the impact of the personnel-focused R&D development stage on TC and RMC.
Scenario 3: Explore the developmental dynamics of TC and RMC when R&D input is increased (by 50%), ceteris paribus, and simulate the influence of the input-focused R&D development stage on TC and RMC.
Scenario 4: Observe the changes in TC and RMC under the condition of increased R&D personnel (up by 50%) and R&D input (up by 25%), ceteris paribus, and simulate the scenario of the “more personnel, less input” development stage.
Scenario 5: Explore the developmental dynamics of TC and RMC when R&D input is increased (by 50%) and R&D personnel is increased (by 25%), ceteris paribus, and simulate the scenario of the “more input, less personnel” development stage.
Scenario 6: Explore how technology supports risk management in the “dual increase” (both personnel and financial input are up by 50%) model, ceteris paribus, and simulate the scenario of the rapid-growing R&D development stage.
The simulated stages in all the scenarios above were set between 2010 and 2030, with a 2-year simulation step size for each.
4.2. Simulation Results
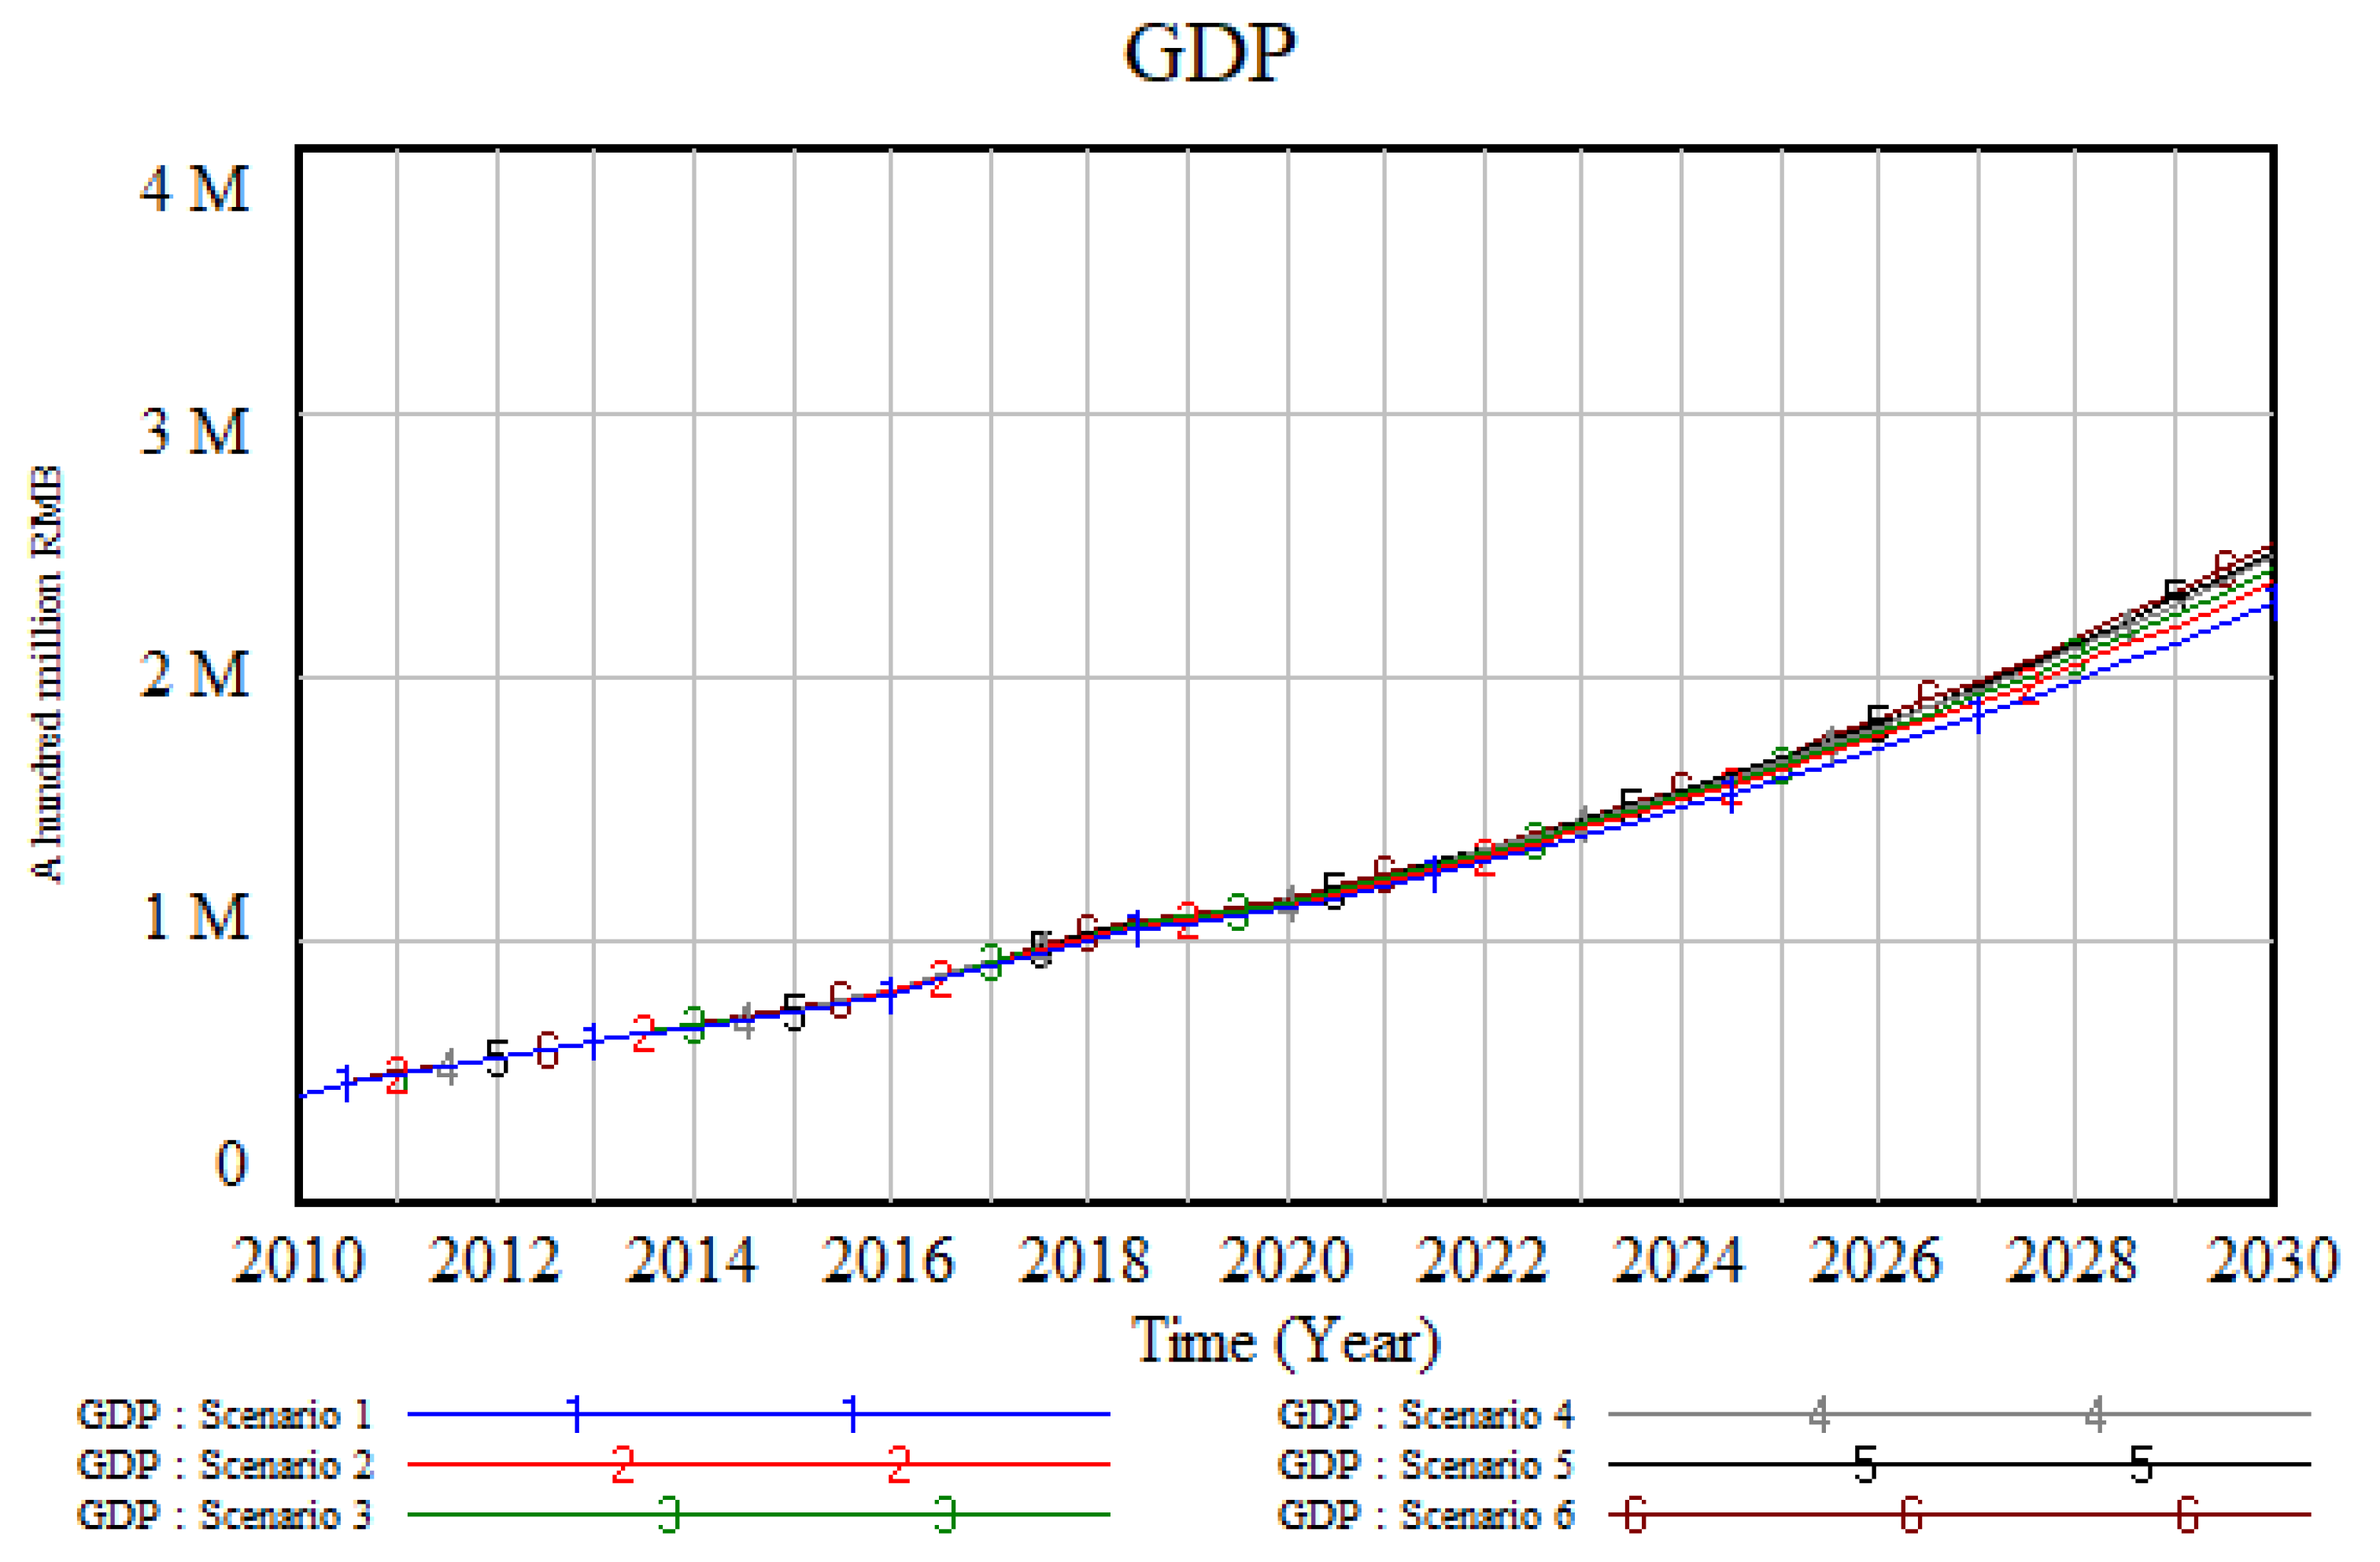
As can be seen from
Figure 2, when policy scenario changes, China’s GDP keeps increasing as the R&D input increases; this indicator shows a similar trend for all scenarios between 2020 and 2030, which shows that science and technology is the primary productive force. By 2030, China’s GDP is expected to reach the range between 2.2 and 2.6 trillion RMB. The GDP over the baseline period will be 2.271 trillion RMB, and the GDP in the R&D personnel-focused R&D development stage will be 2.350 trillion RMB. The GDP in the R&D input-focused R&D development stage will be 2.401 trillion RMB. The GDP in the “more personnel, less input” stage will be 2.444 trillion RMB, the GDP in the “more input, less personnel” stage will be 2.469 trillion RMB, and the GDP in the rapid-growing R&D development stage may be as high as 2.502 trillion RMB.
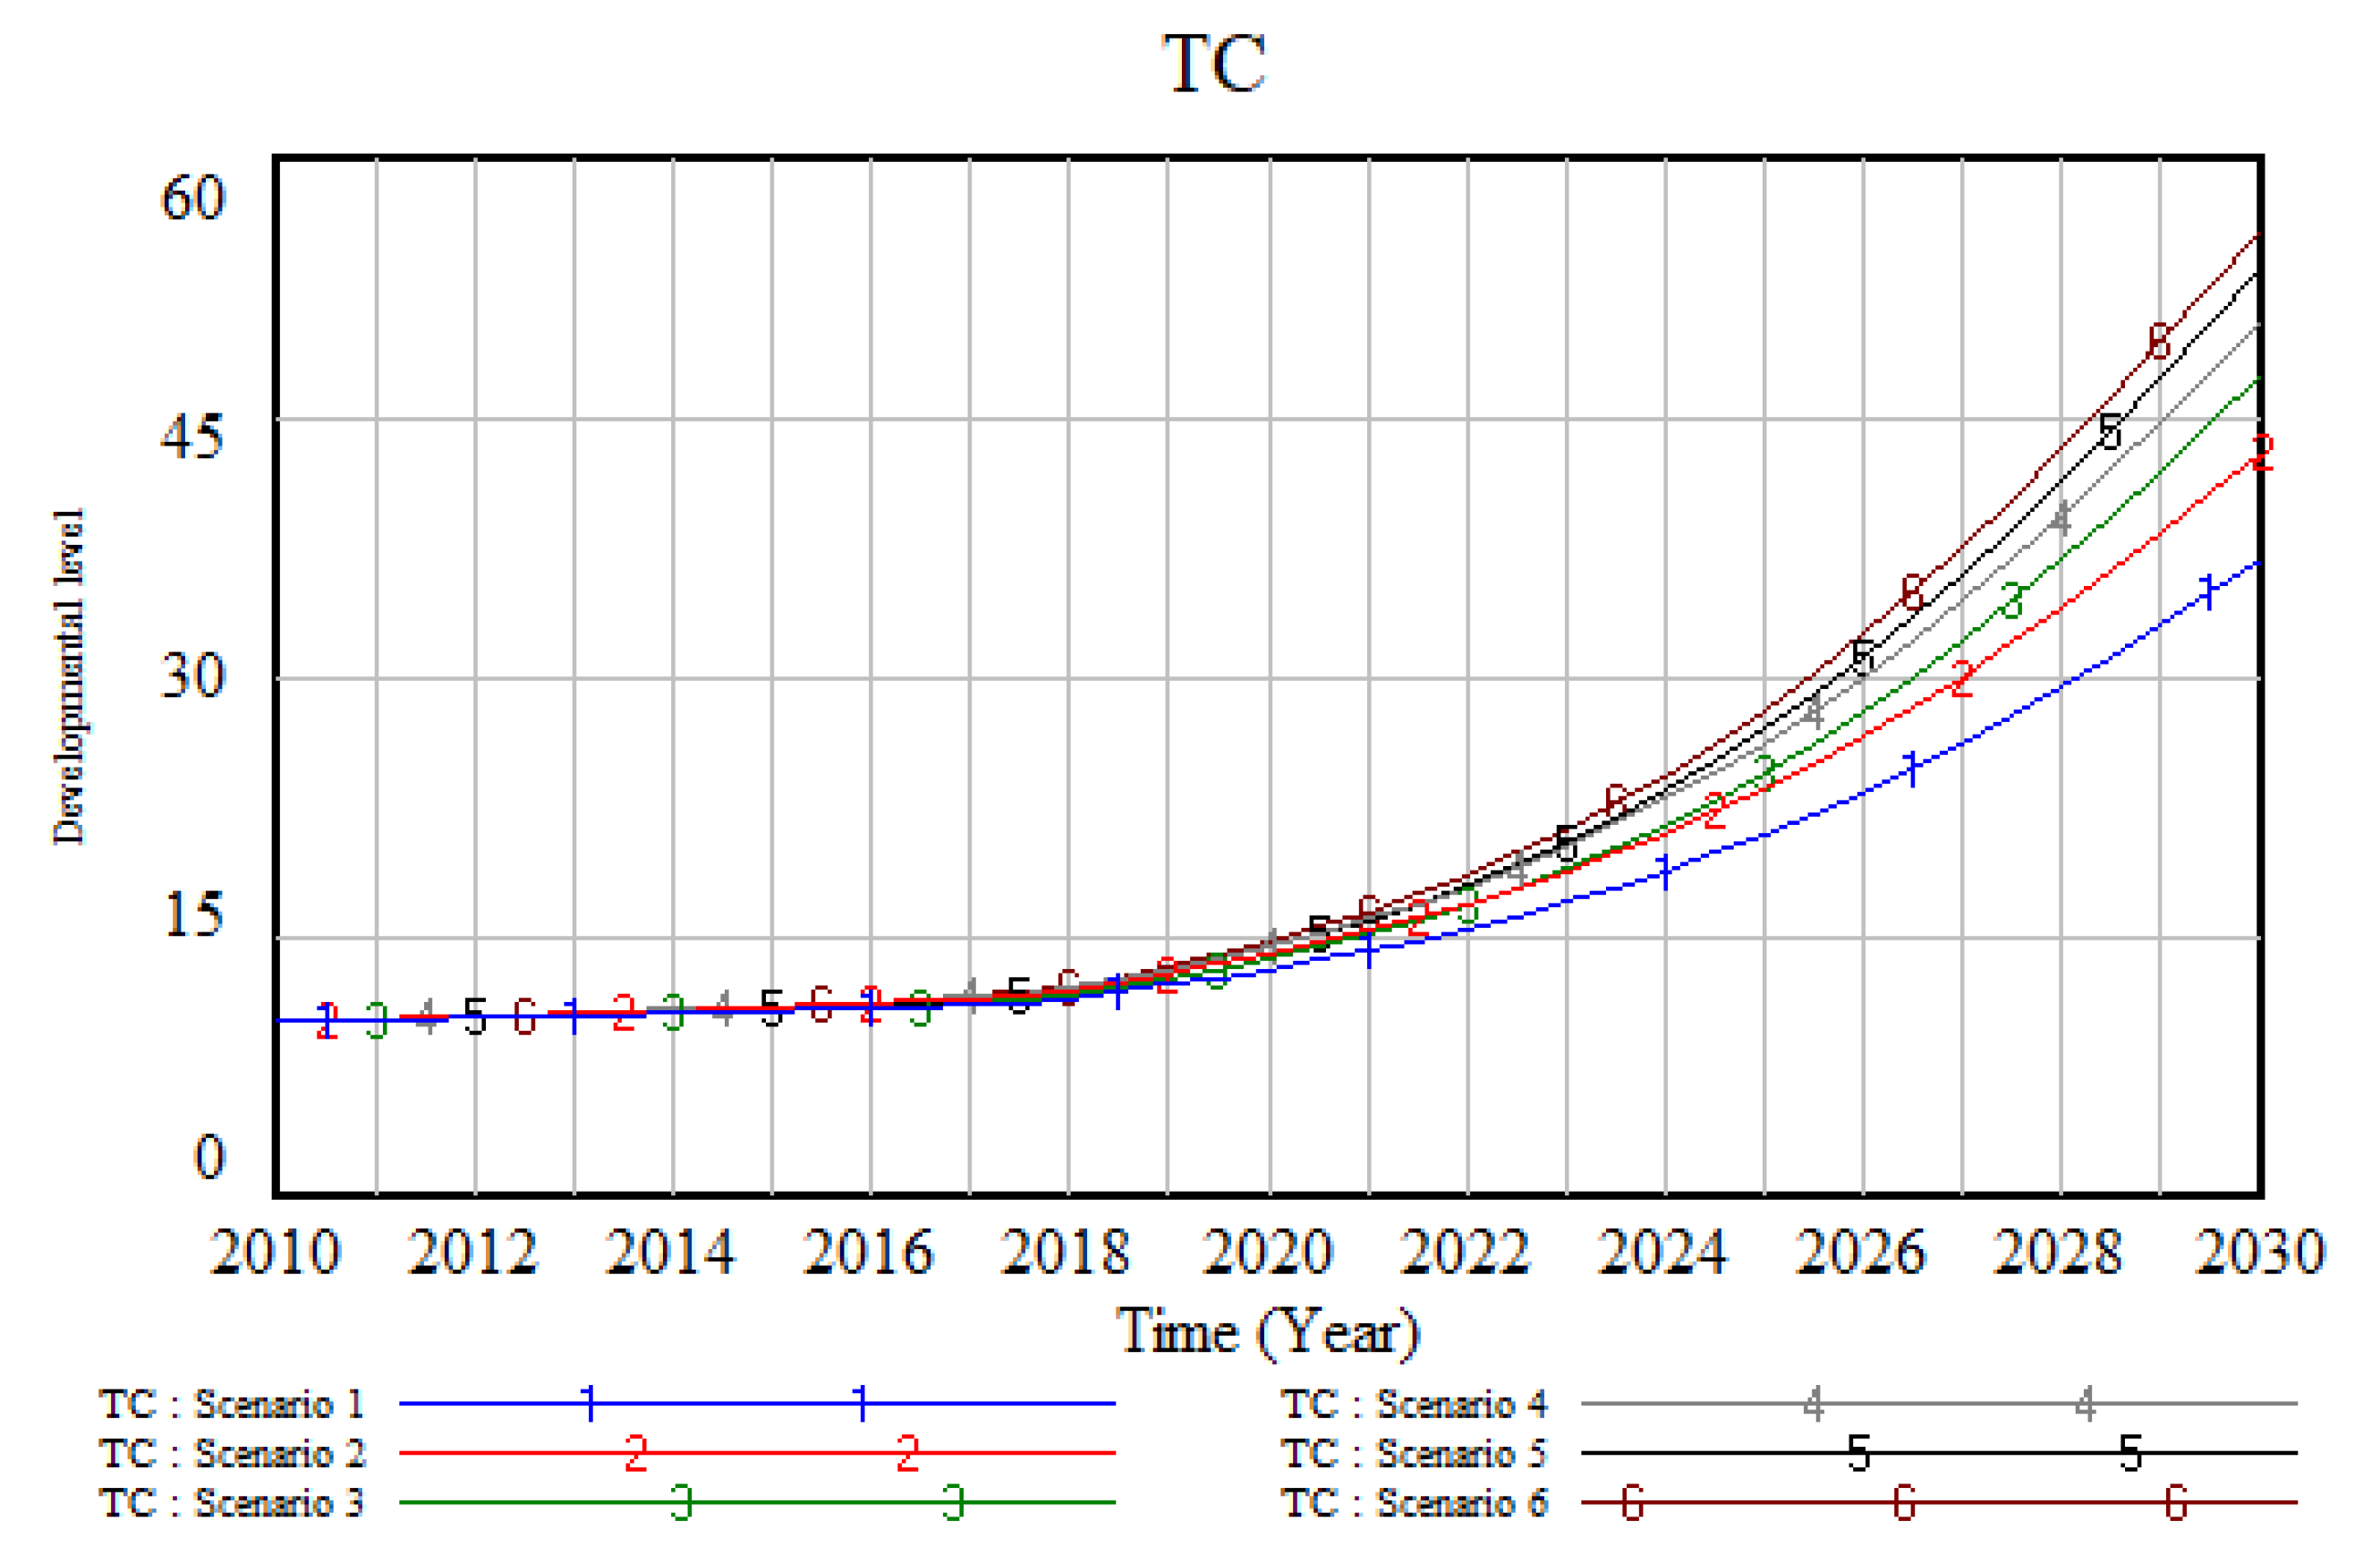
Figure 3 shows the changes in TC under different scenarios, which visually illustrates the contribution of R&D input to TC. As shown in
Figure 3, under the “dual increase” model (Scenario 6), the increase in TC is the most pronounced, rising from 16.39 in 2021 to 55.78, an increase of 240.33%. Increasing the inputs separately, we found that an increase in R&D input has a greater promoting effect on TC than that an increase in the number of R&D personnel, which indicates that TC is more dependent on R&D input (when comparing curves 2 and 3). When adding multiple inputs, we found that the development model of “more input, less personnel” has a more obvious effects than the development model of “more personnel, less input”, but both of these two stages have lower effects than the “double growth” stage. This also confirms that, whether it is a single input or multiple inputs, the benefits brought about by increasing R&D input are higher than those brought by increasing R&D personnel under the same conditions.
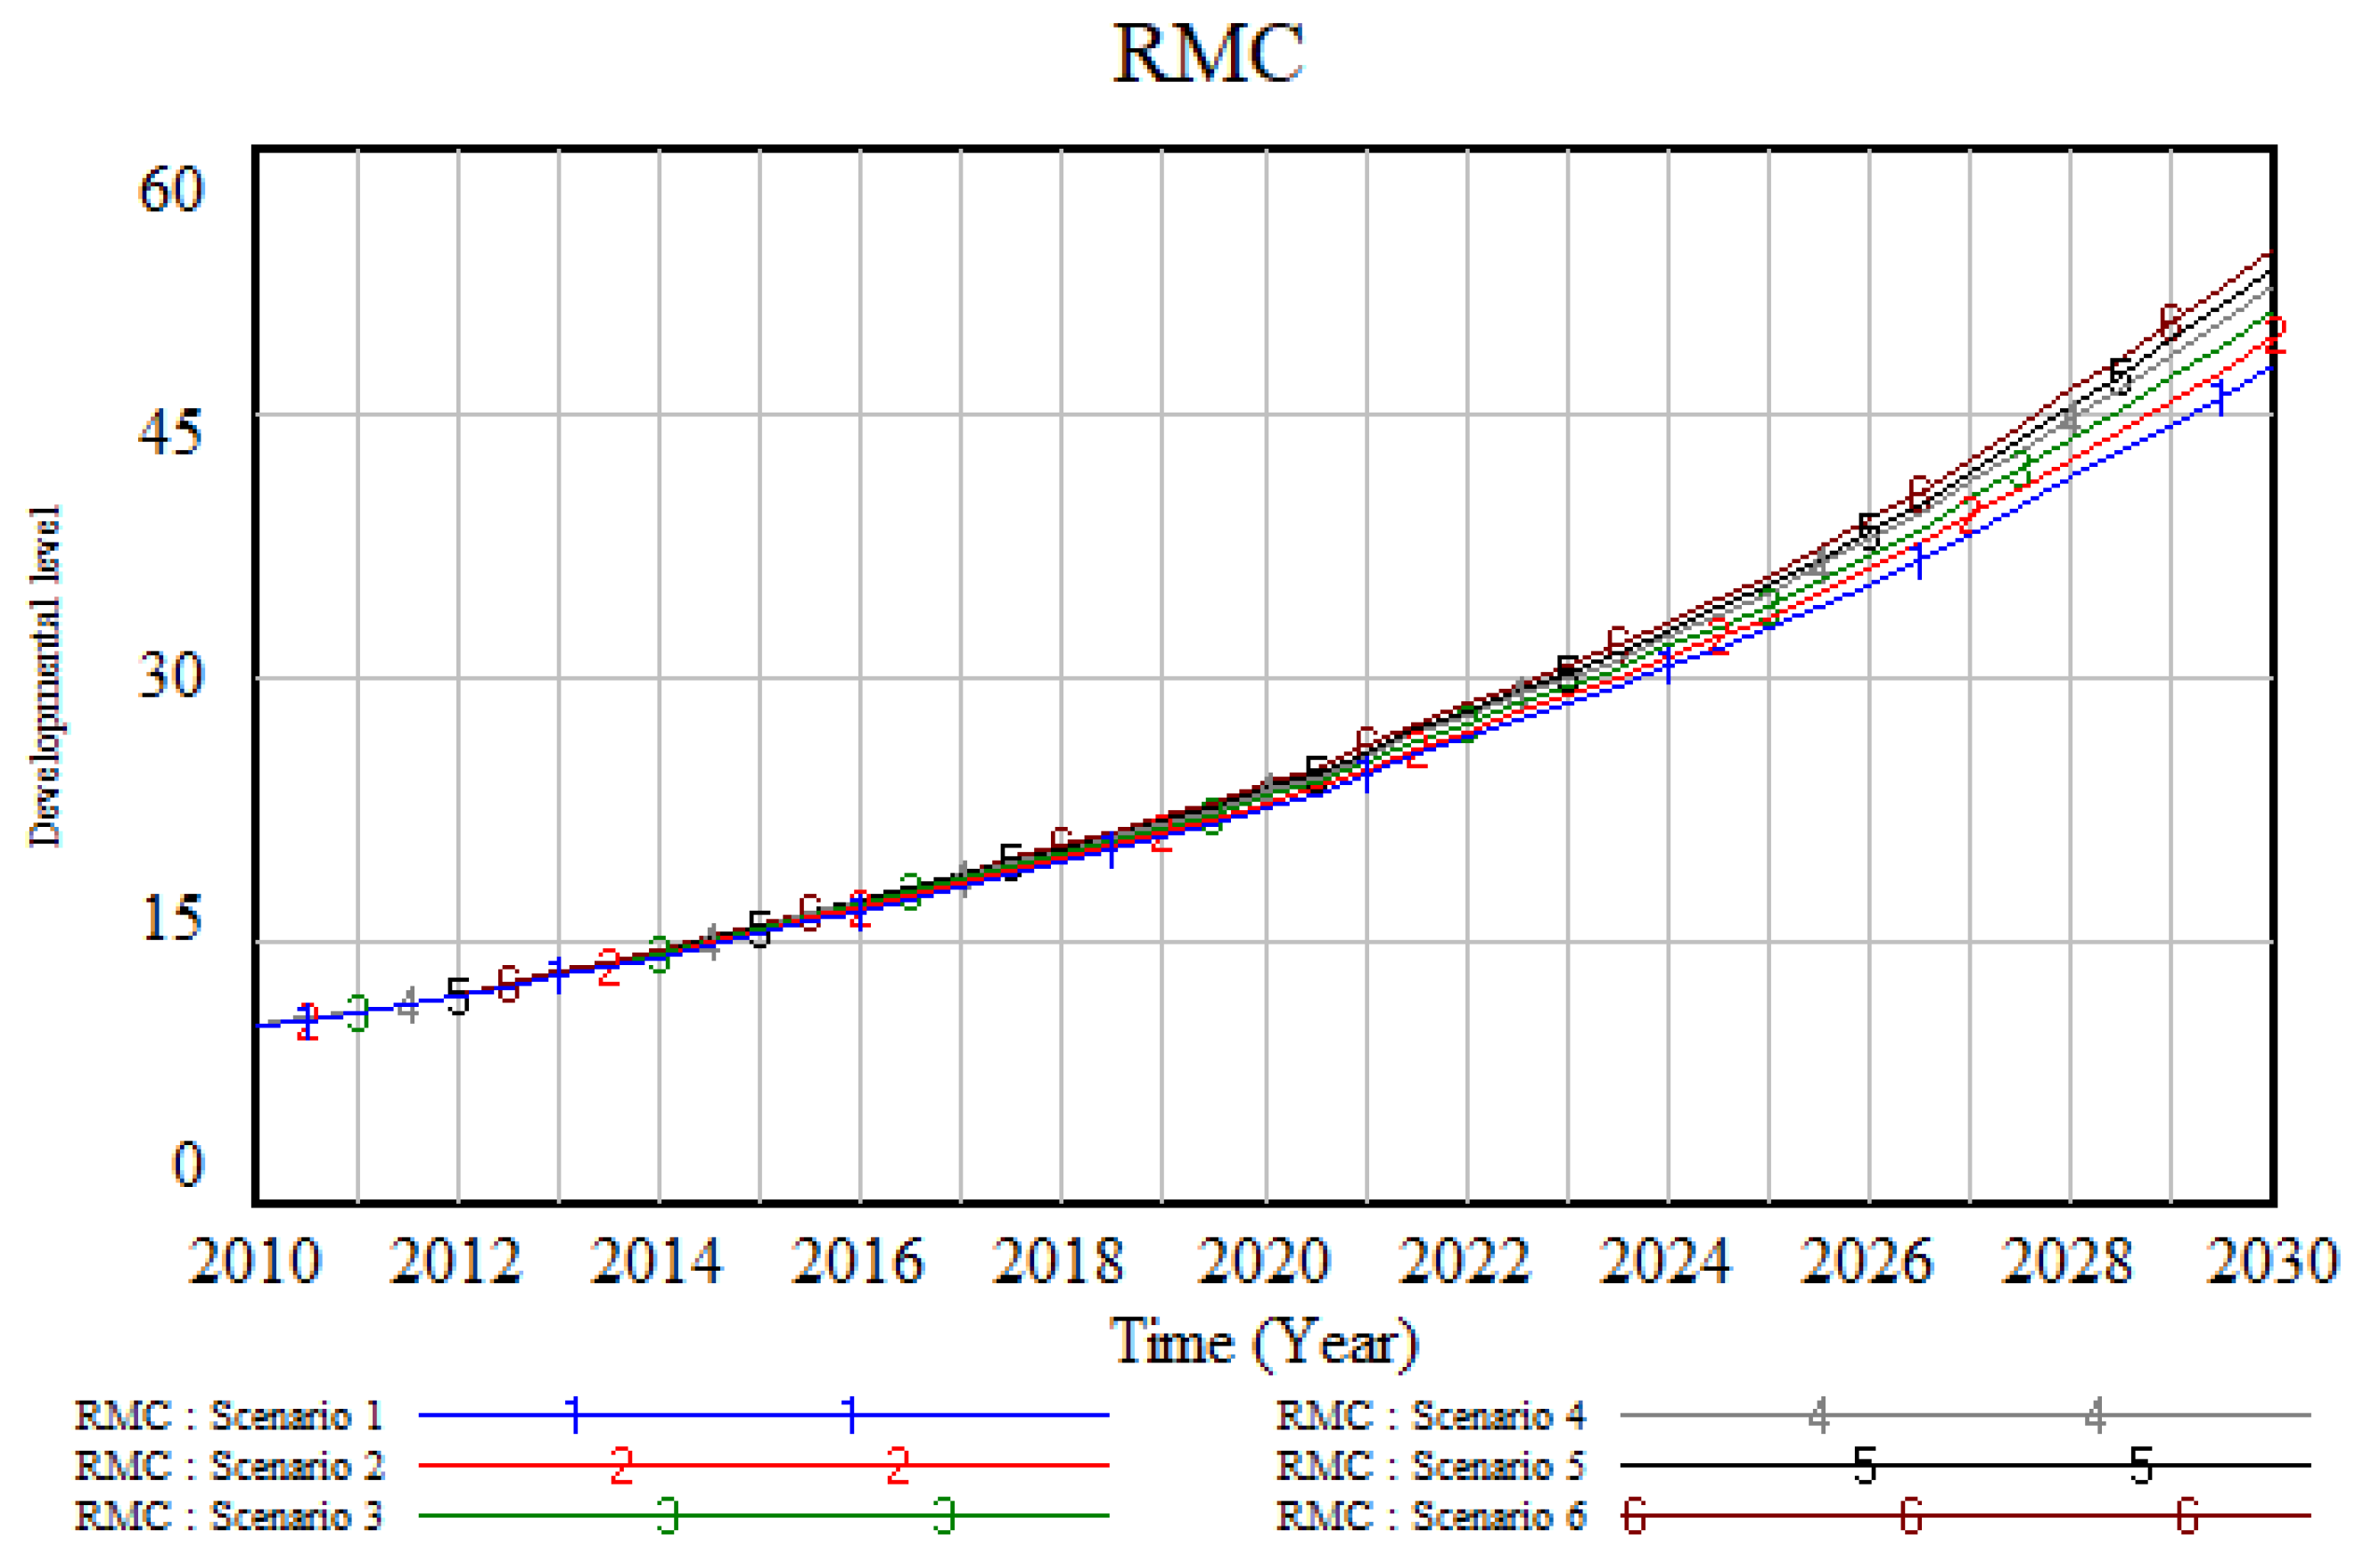
RMC, another core indicator in the model, shows a steady growth. As can be seen in
Figure 4, the four scenarios can be ranked as follows in terms of the RMC growth speed: Scenario 6 > Scenario 5 > Scenario 4 > Scenario 3 > Scenario 2 > Scenario 1. In addition, the RMC grows fastest under the “dual increase” model, and the financial input can be seen as more important to the RMC than personnel (see curves 4–6 for details). Comparing
Figure 3 and
Figure 4, it is clear that a stronger TC improves RMC in the real estate sector and that they are positively correlated.
Based on the above analysis, it can be concluded that there is an obvious correlation between TC and RMC in China’s real estate sector. The correlation is as follows: first, continuous improvement in terms of TC can effectively drive the growth of GDP, which makes the country increase its financial and personnel input and strengthen policy support in terms of R&D. Second, strengthening the TC of financial risk management in the real estate sector can improve RMC, thus reducing the probability of financial risks and nipping them in the bud as much as possible, which is beneficial to the real estate sector and social and economic development as a whole.
5. Conclusions and Outlook
From the perspective of the TSS, this study adopted SD to construct a simulation model of the TSS for financial risk management in China’s real estate sector, explored the interplay between TC and RMC, carried out a correlation analysis in relation to technology input, and achieved its purpose under six policy scenarios. This has important theoretical and practical significance for promoting the healthy and stable operation of the real estate market, preventing and resolving major financial risks, ensuring national financial security, and helping government departments to further improve scientific decision-making and strengthen risk management. It not only clarifies the overall relationship between the core research variables but also enriches the research content in this field, which is innovative to some extent.
The main findings of this paper are as follows: (1) TC can provide effective support in the improvement of RMC, and RMC improves with the continuous improvement of TC; (2) TC is more dependent on R&D financial input, and increasing R&D financial input is significantly more beneficial to TC than simply increasing R&D personnel; (3) ceteris paribus, R&D financial input is also more important than R&D personnel in terms of improving RMC; (4) strengthening the “primary productive force” and RMC can boost social and economic progress, i.e., the stronger the TC and RMC, the higher the GDP.
The state should create a benign atmosphere for R&D while ensuring smooth and healthy social and economic operation. Specifically, it can deepen the reform of the R&D system, increase financial and personnel input in R&D, provide stronger policy support, and attach great importance to building and nurturing R&D talent. At the same time, the state needs to further make sure R&D personnel are well respected and paid to stimulate their motivation and enthusiasm for innovation so that they can make major breakthroughs. Technology should be leveraged to bring financial risk management in the real estate sector to a higher level, accelerate efficiency with respect to the transformation of the “primary productive force”, and promote China’s high-quality economic development.
Due to limitations and availability in terms of technology and finance-related data in China, this paper simplified the data analysis of variables, and the research only focused on the trend of TC supporting RMC. When more detailed data are available and relevant indicator variables are improved, research perspectives can be expanded, cross-country comparative studies can also be attempted, and the study will be of more practical significance. In addition, the method used in this paper focused on the core variables and their composed loops. There may be other factors or loops that are not taken into account which can be further optimized in the future.


