
Safety Assessment and Crash Compatibility of Heavy Quadricycle under Frontal Impact Collisions

 , ,
, ,  and
and
Abstract
:1. Introduction
2. Materials and Methods
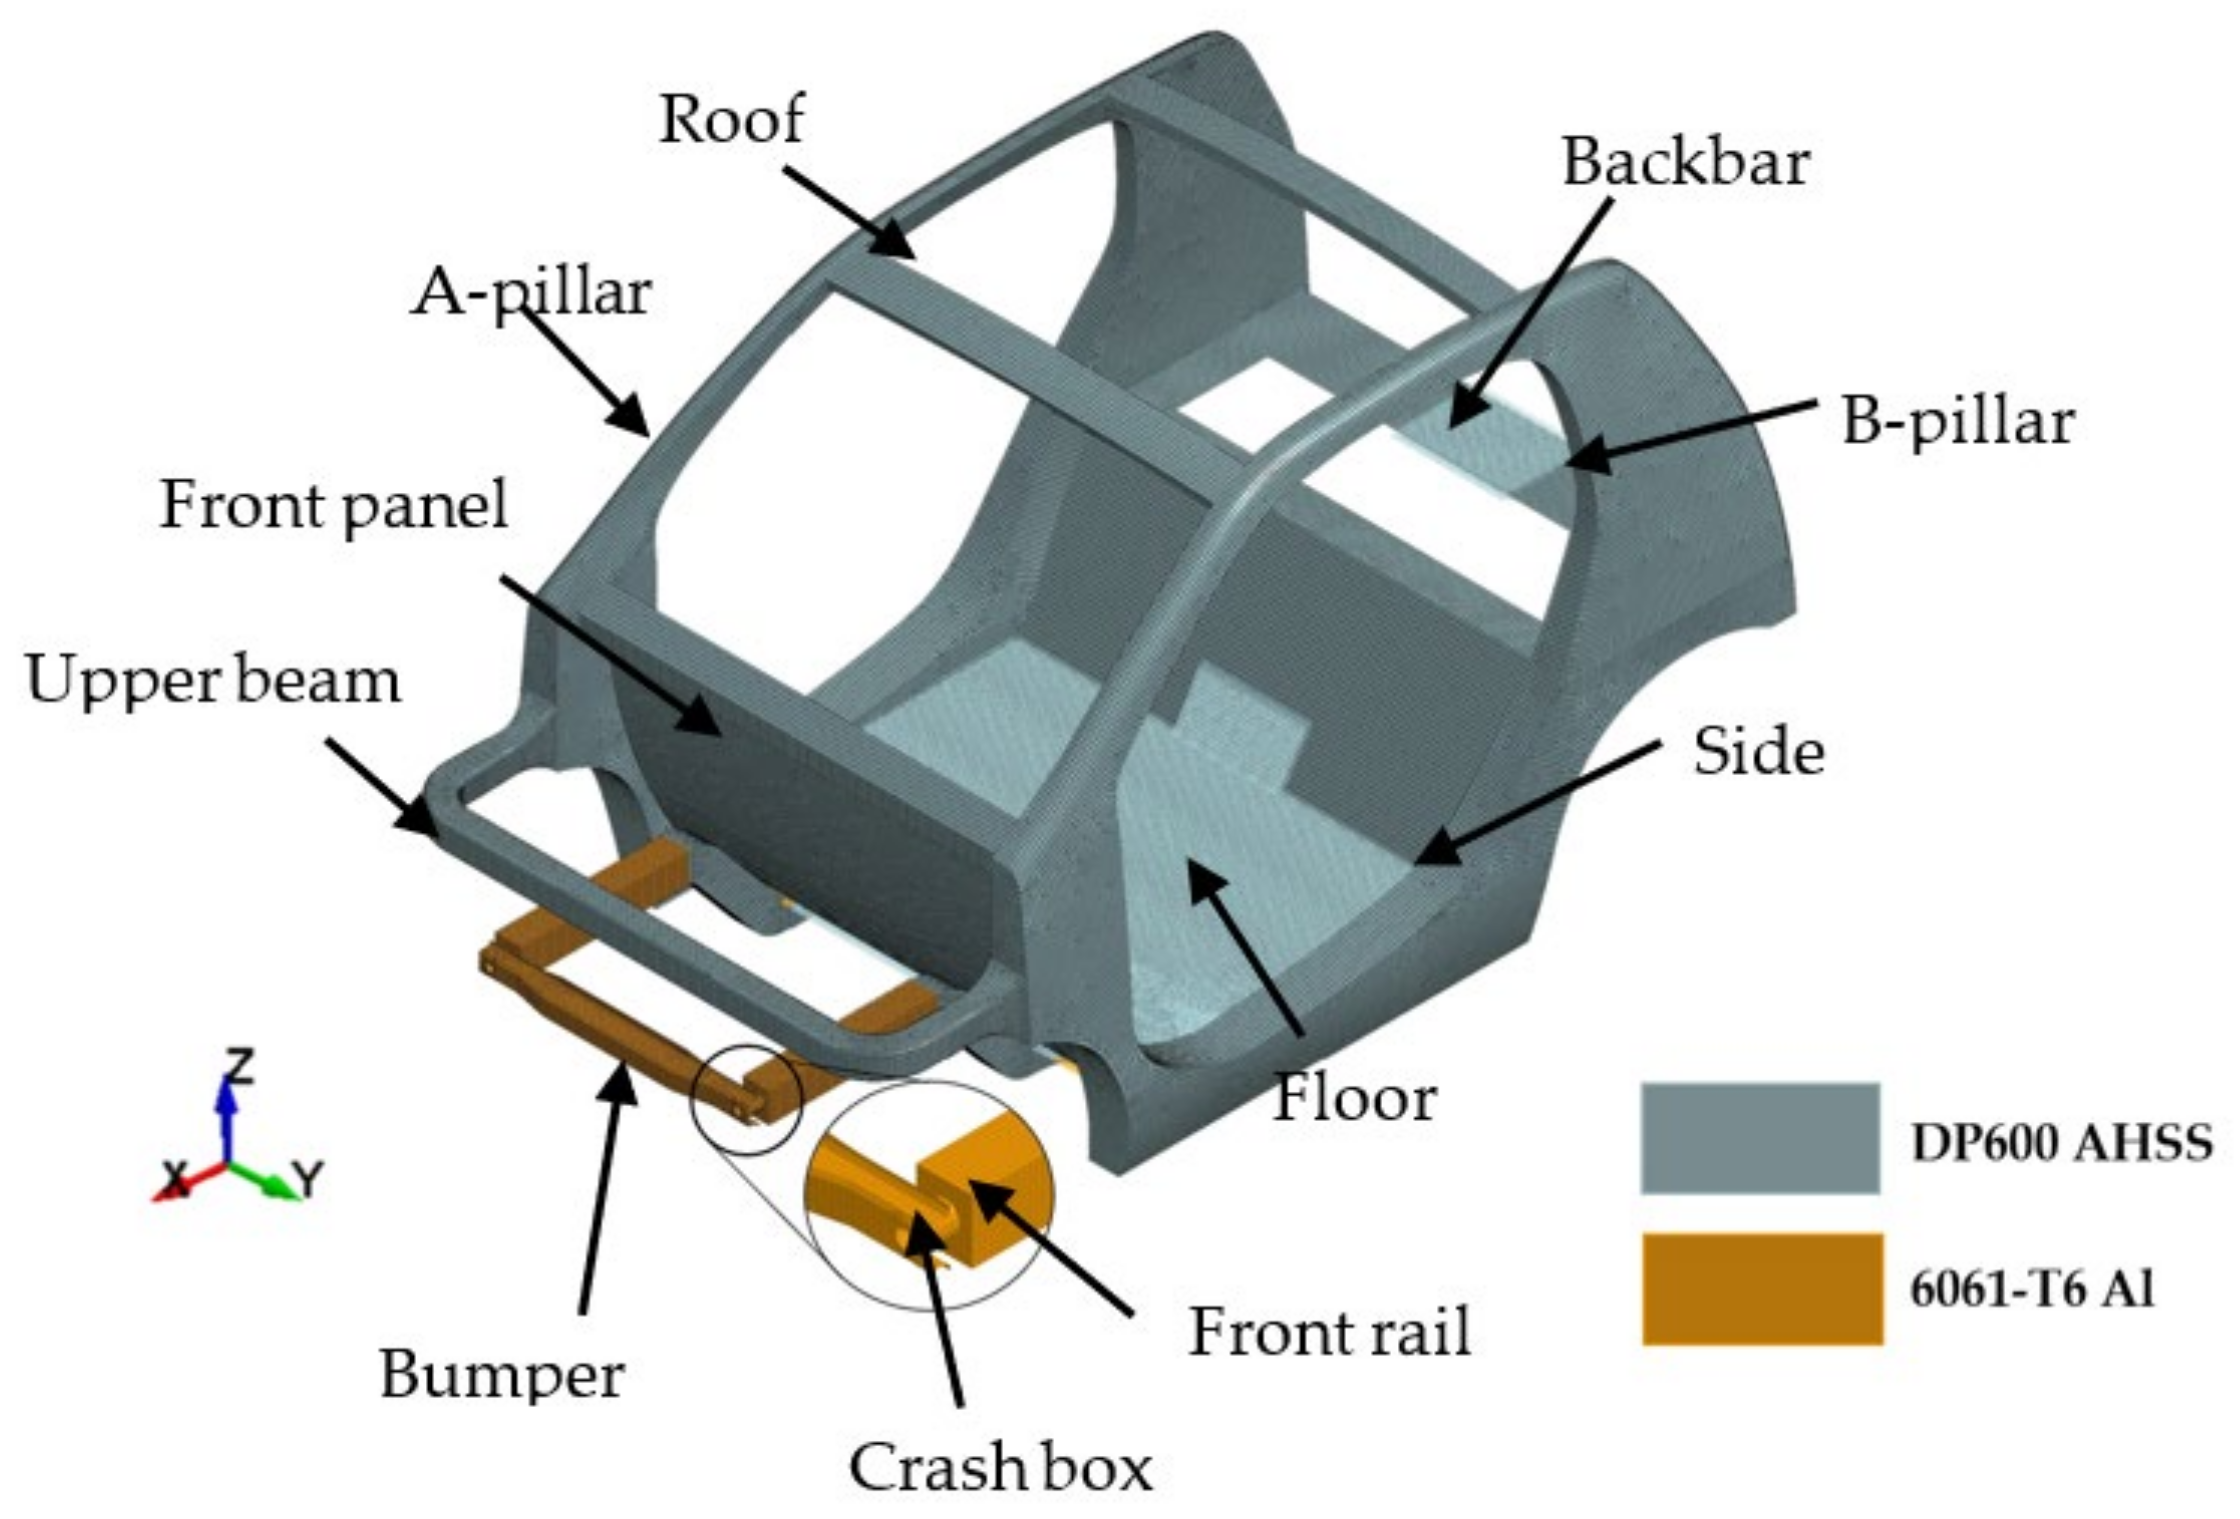
2.1. Electric Heavy Quadricycle Finite Element Model
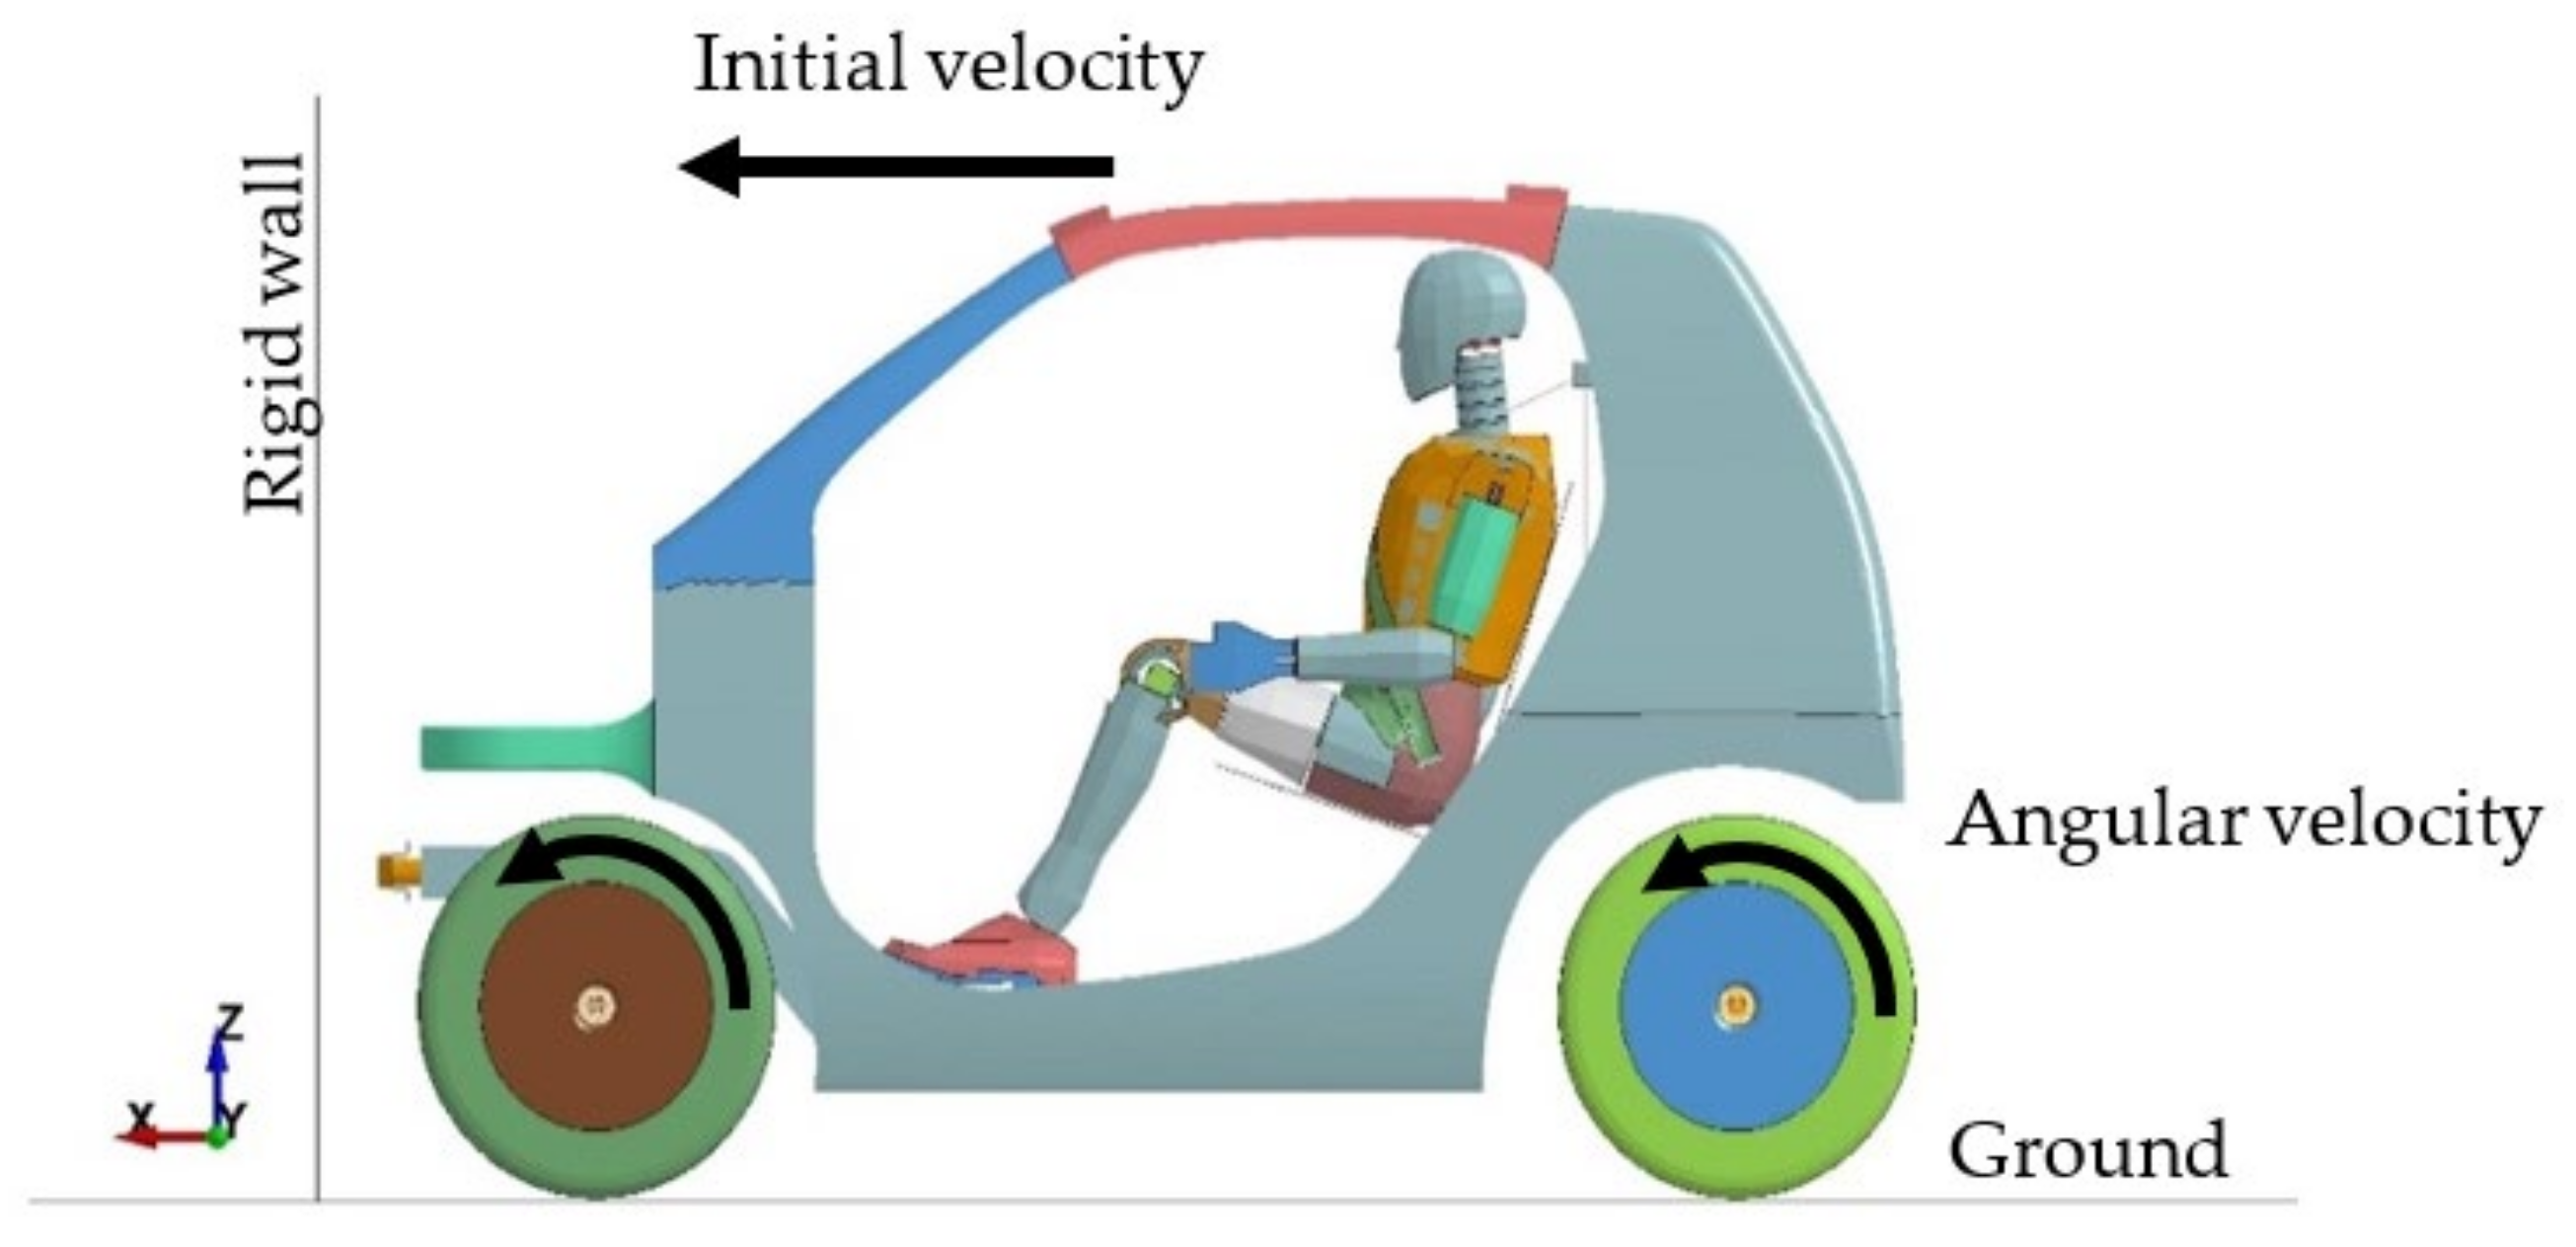
2.2. Crash Scenarios
3. Structural Performance Evaluation from Crash Analysis
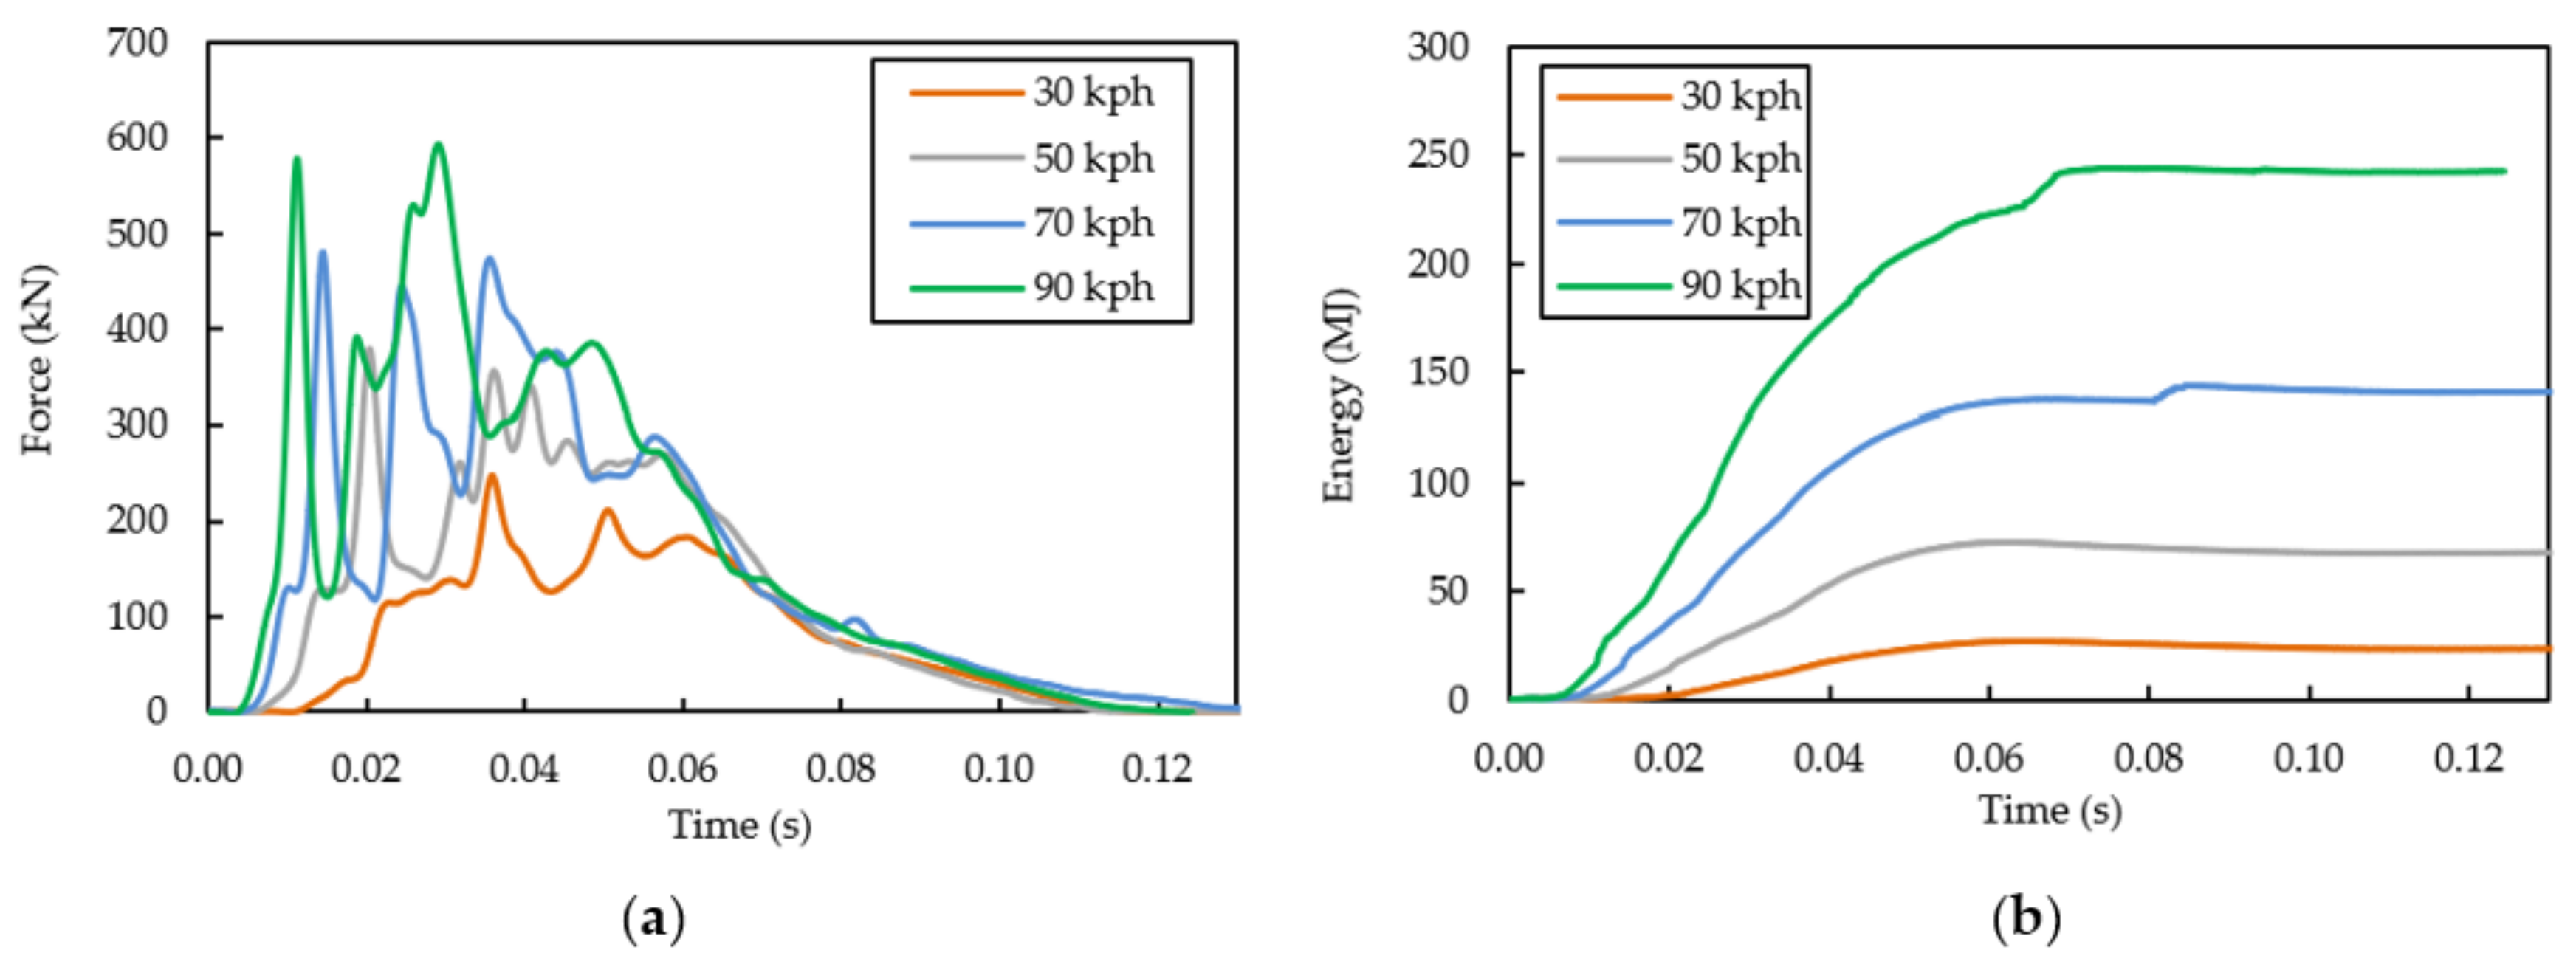
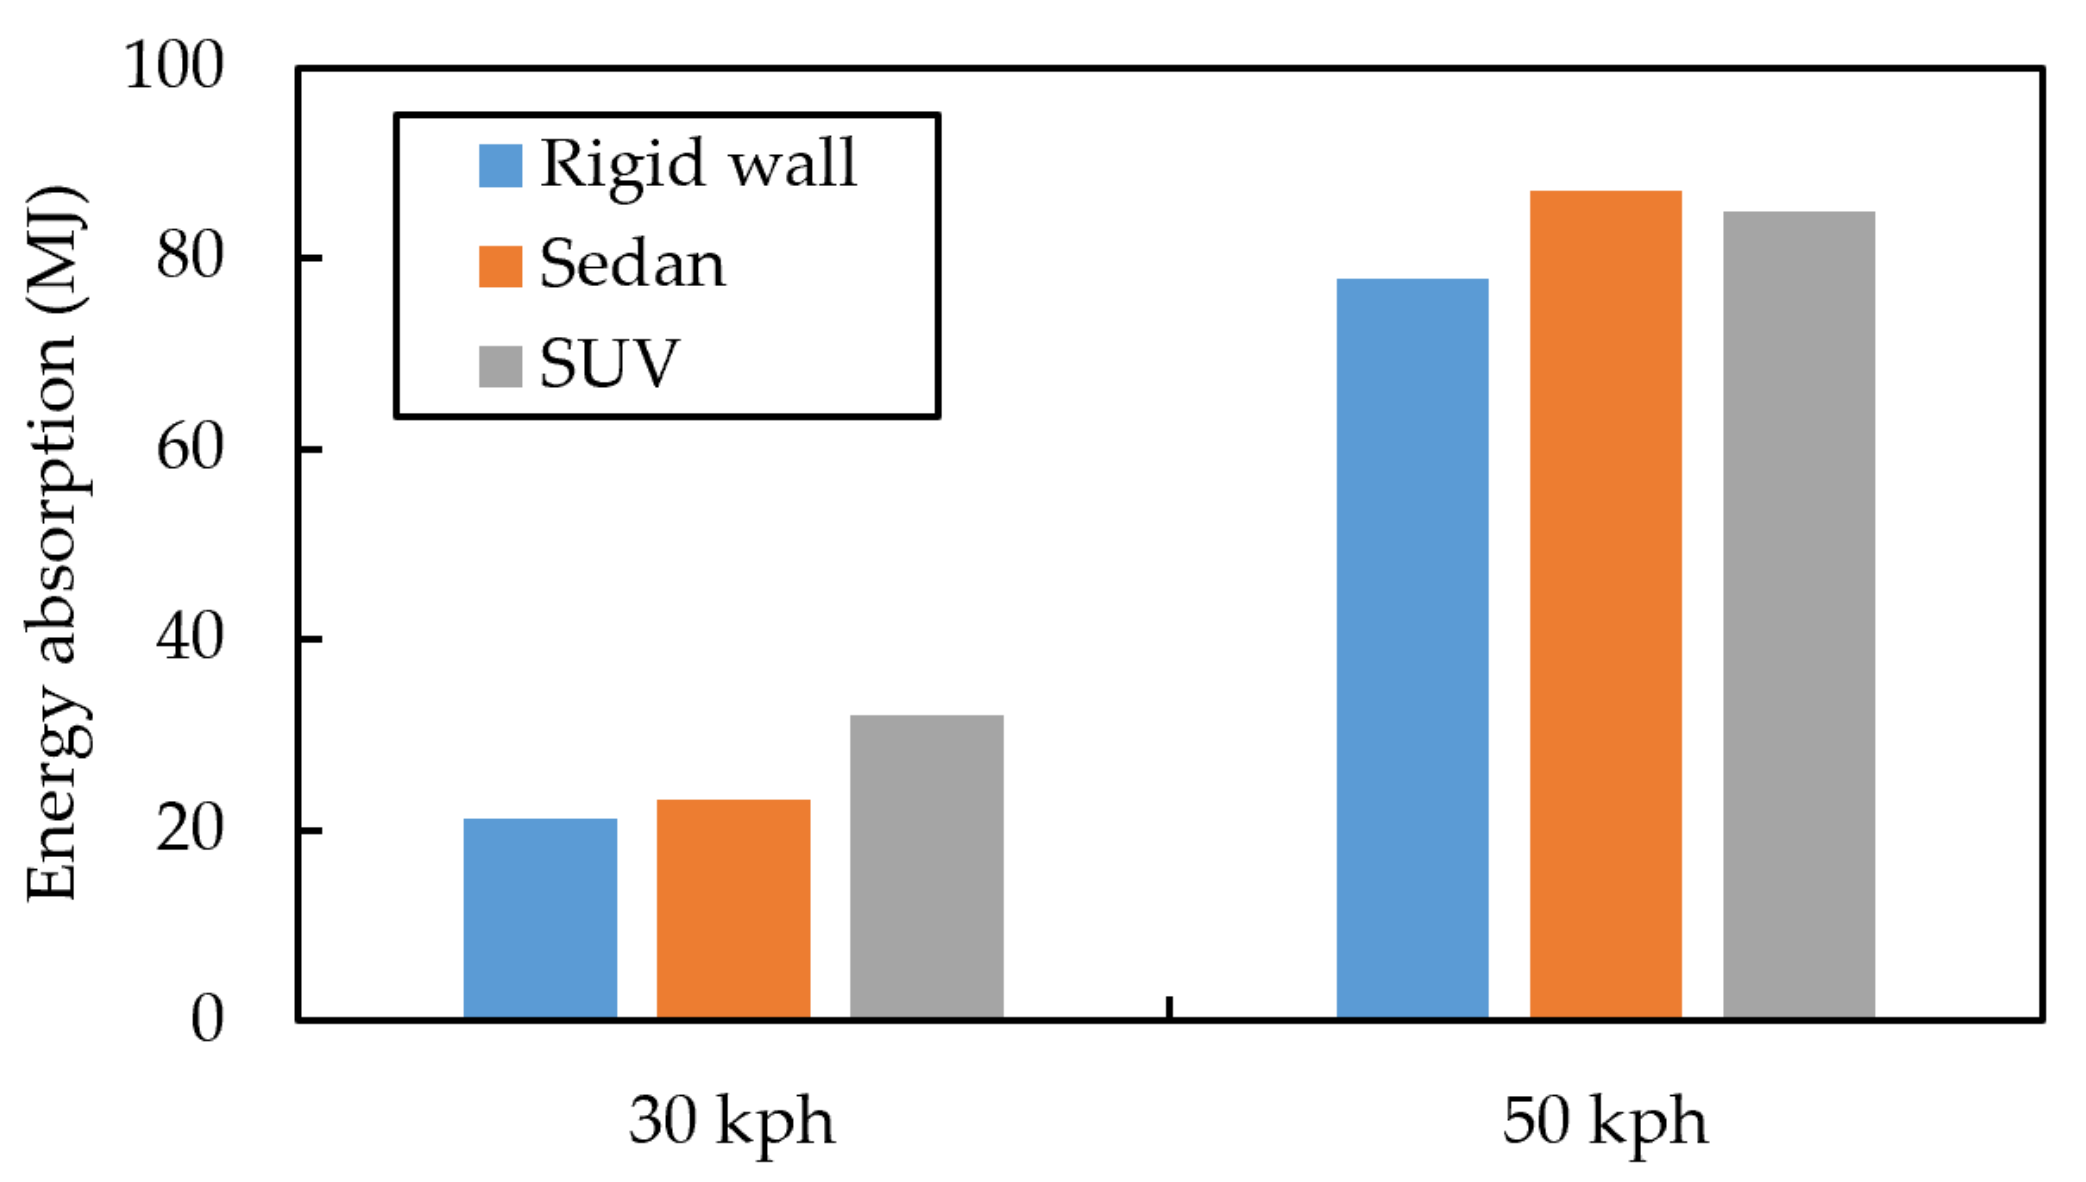
3.1. Frontal Impact of L7e Vehicle with Rigid Wall
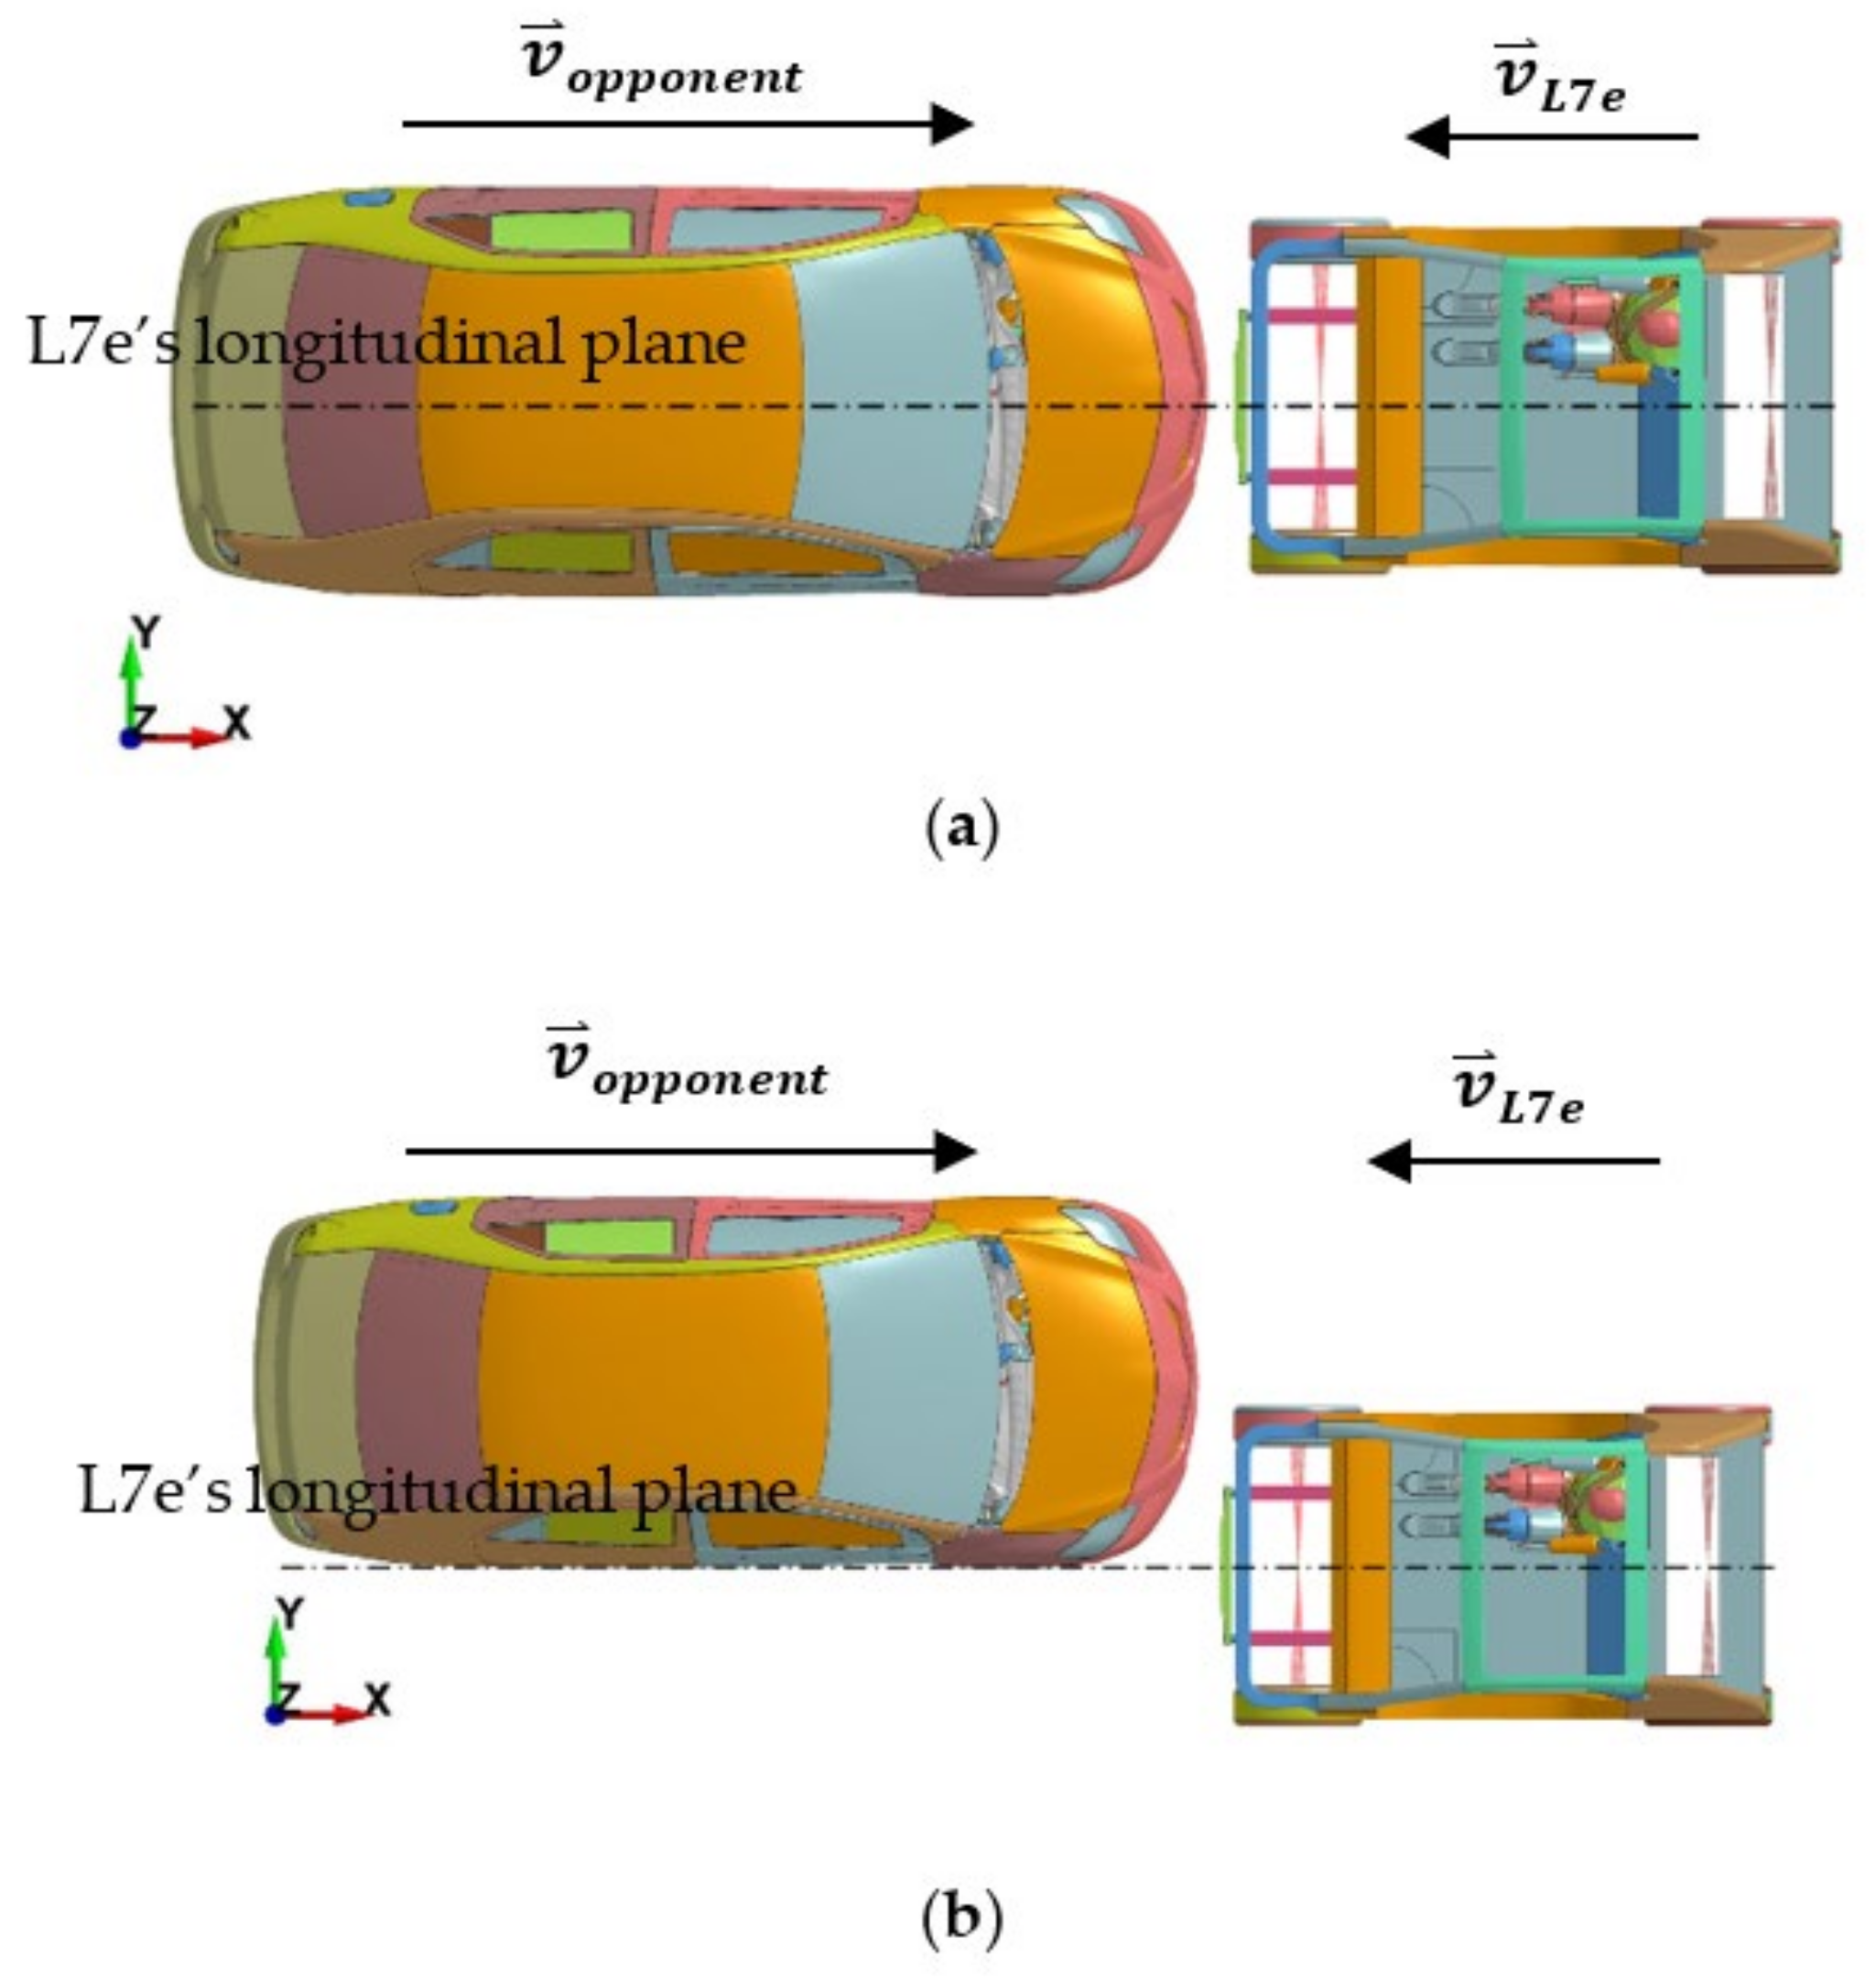
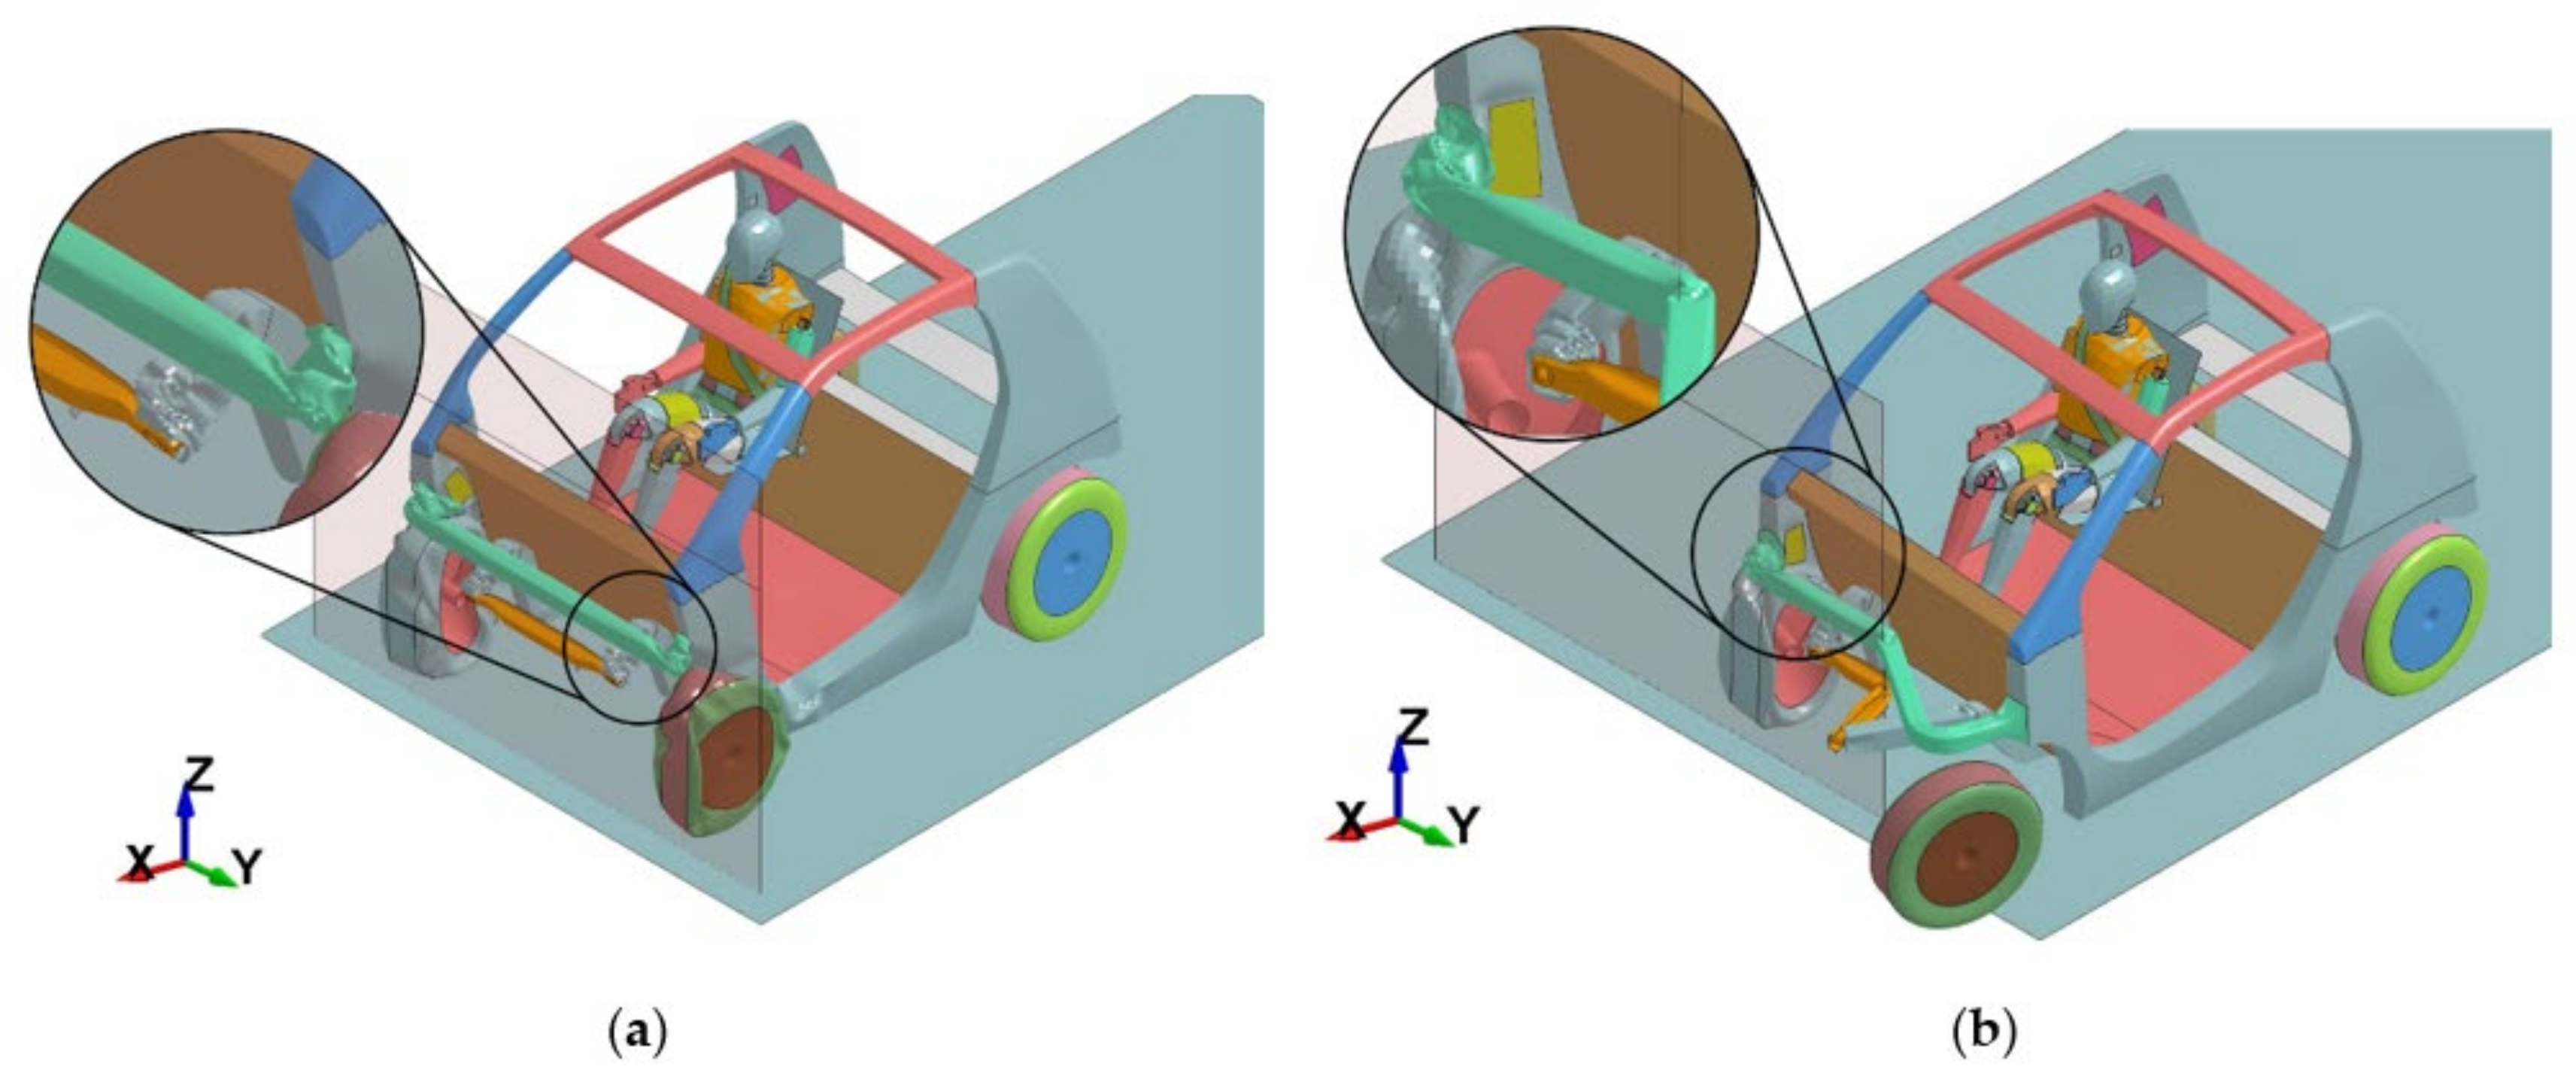
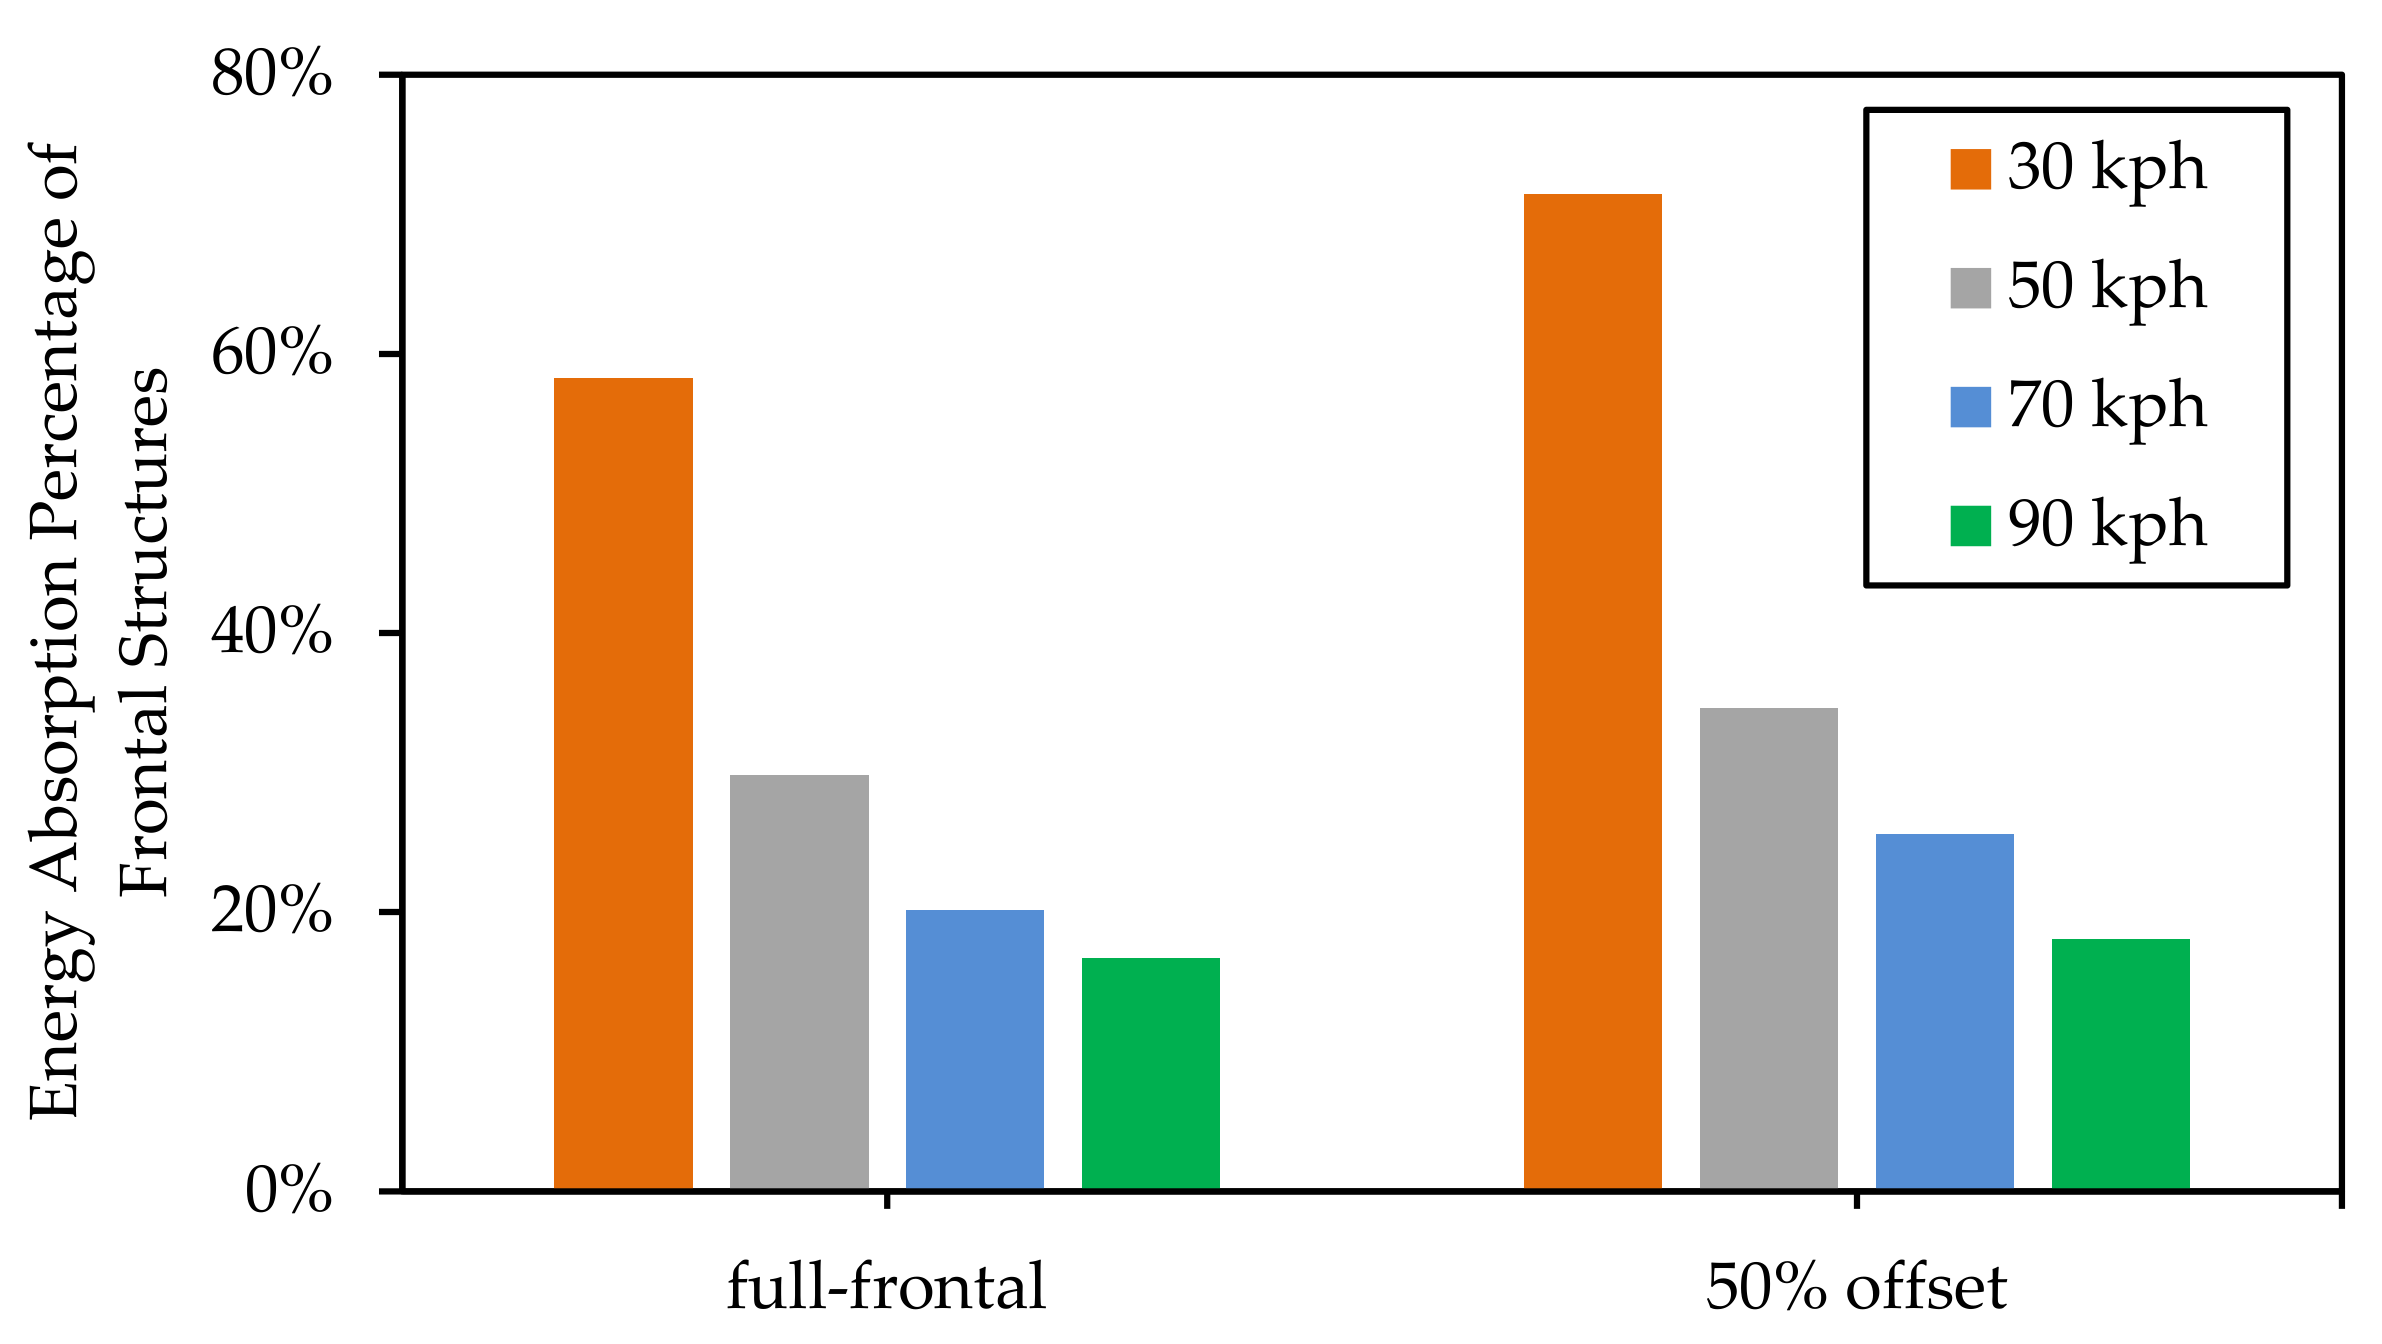
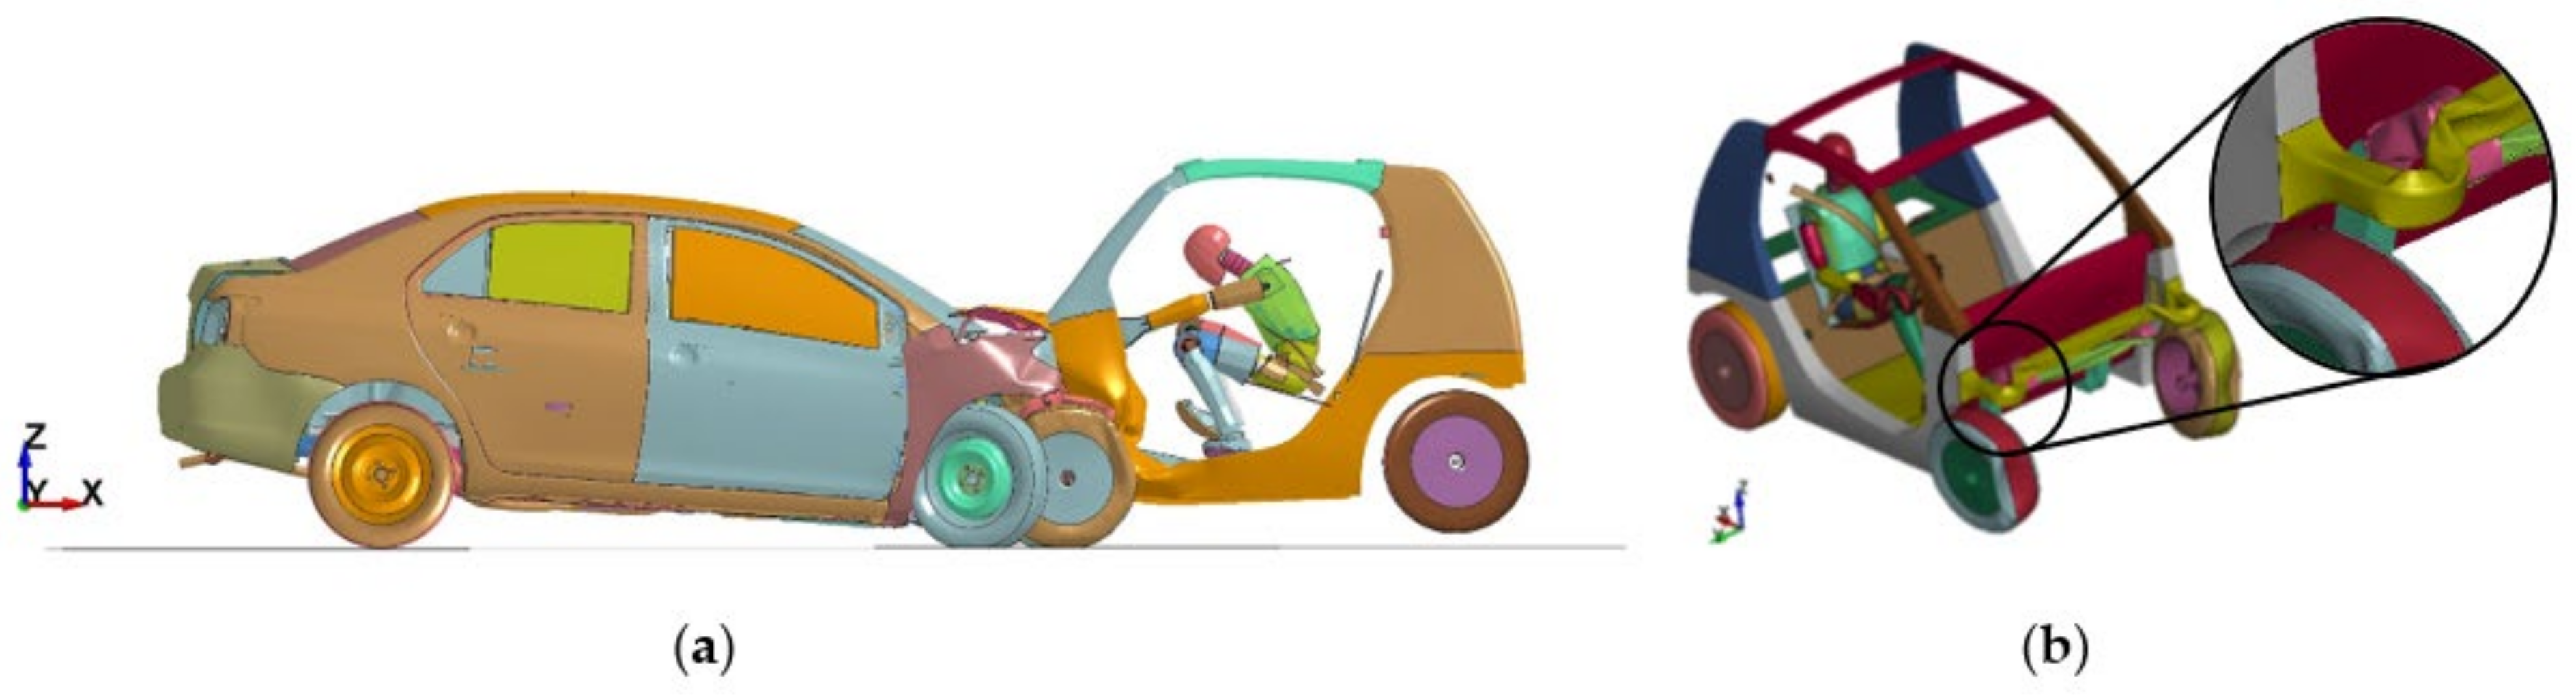
3.2. Full-Frontal Car-to-Car Collision
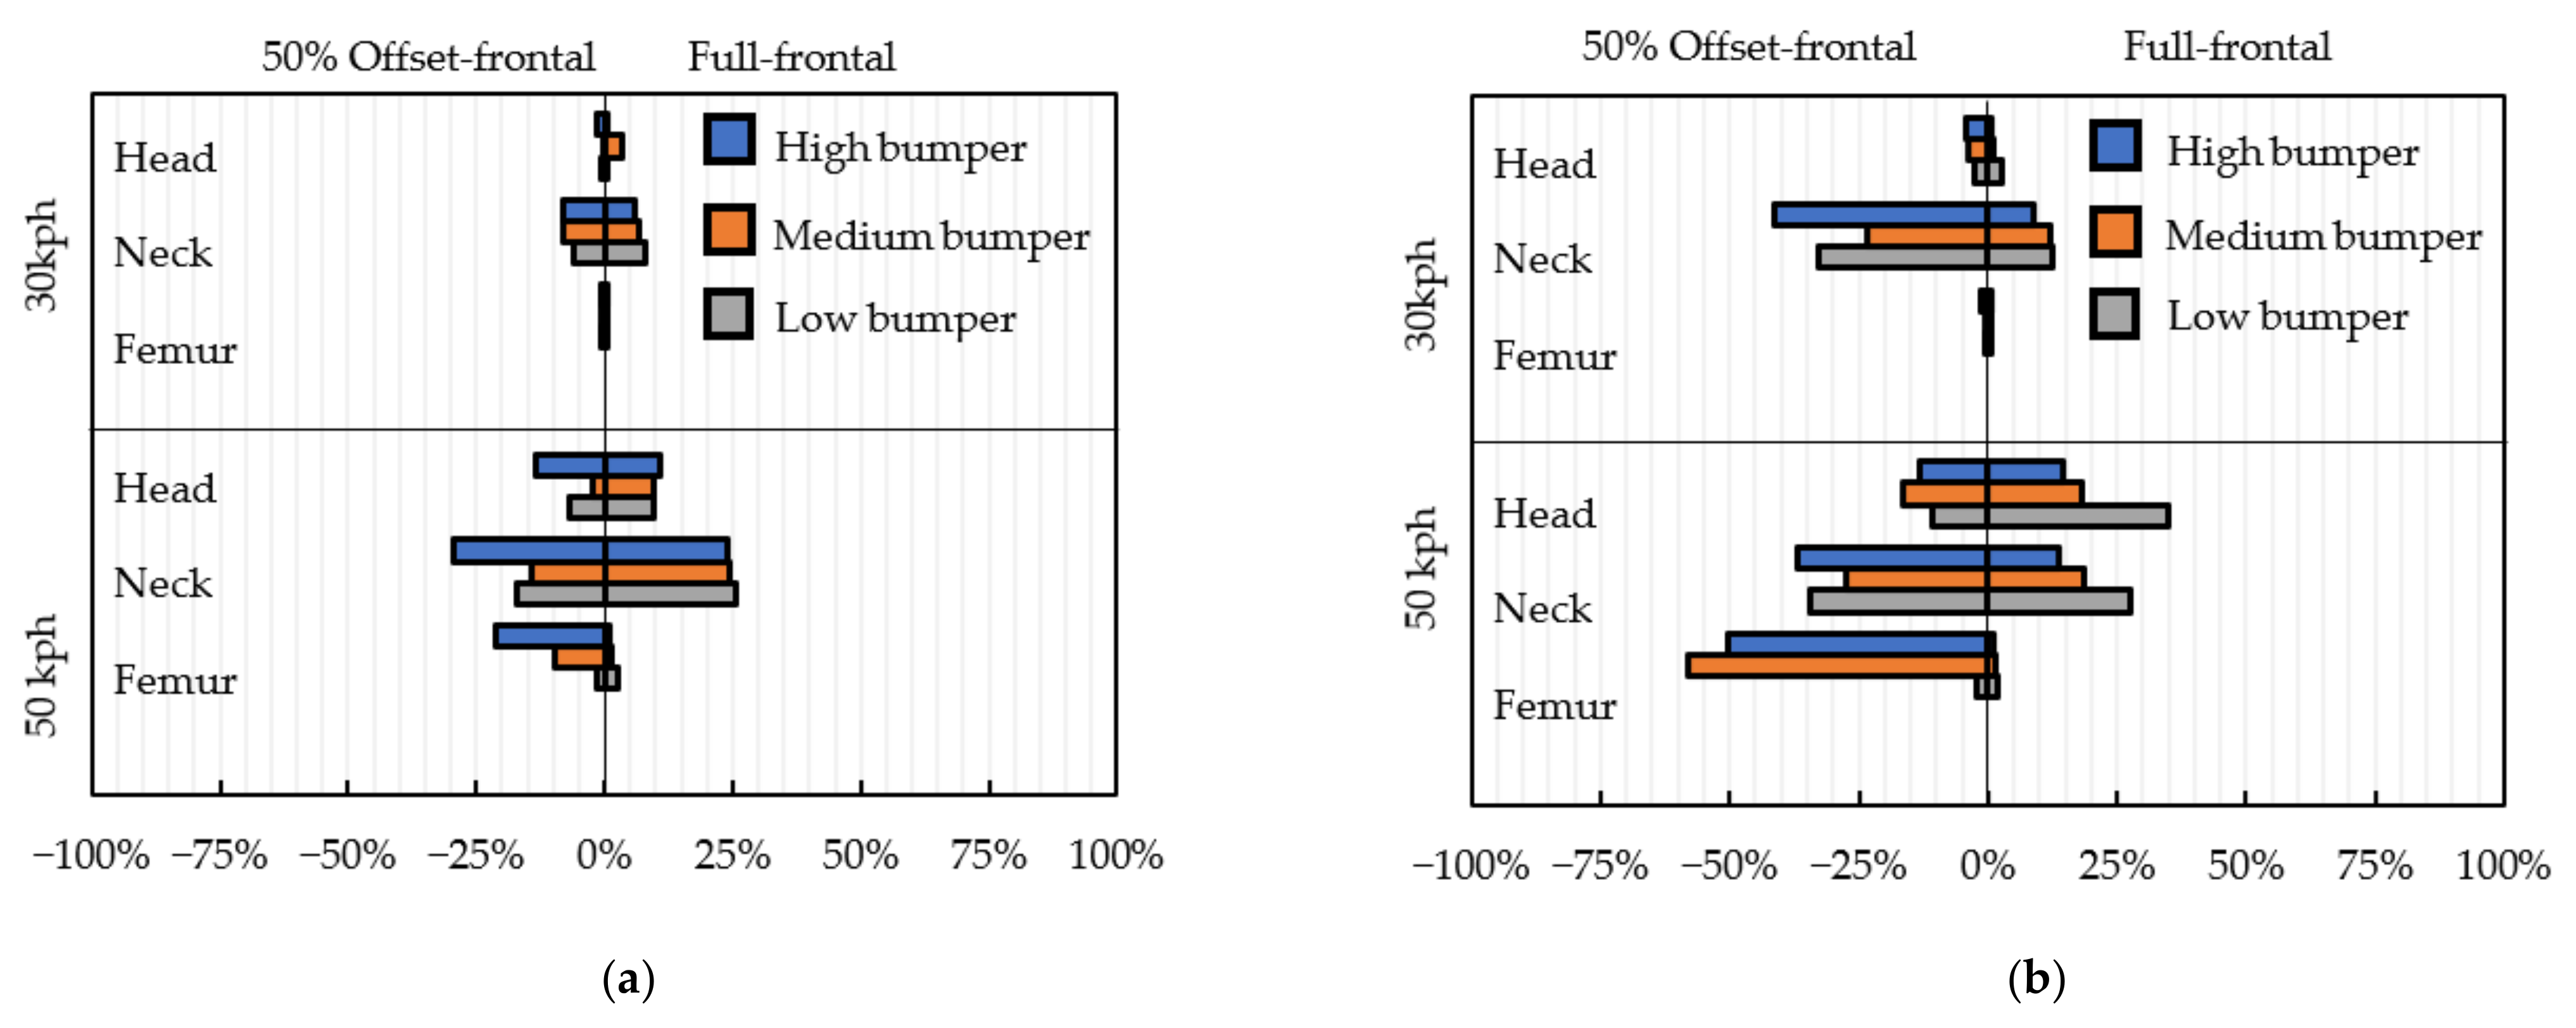
3.3. 50% Offset-Frontal Car-to-Car Collision
4. Occupant Injury Assessment from Crash Analyses
4.1. Occupant Injury Assessment
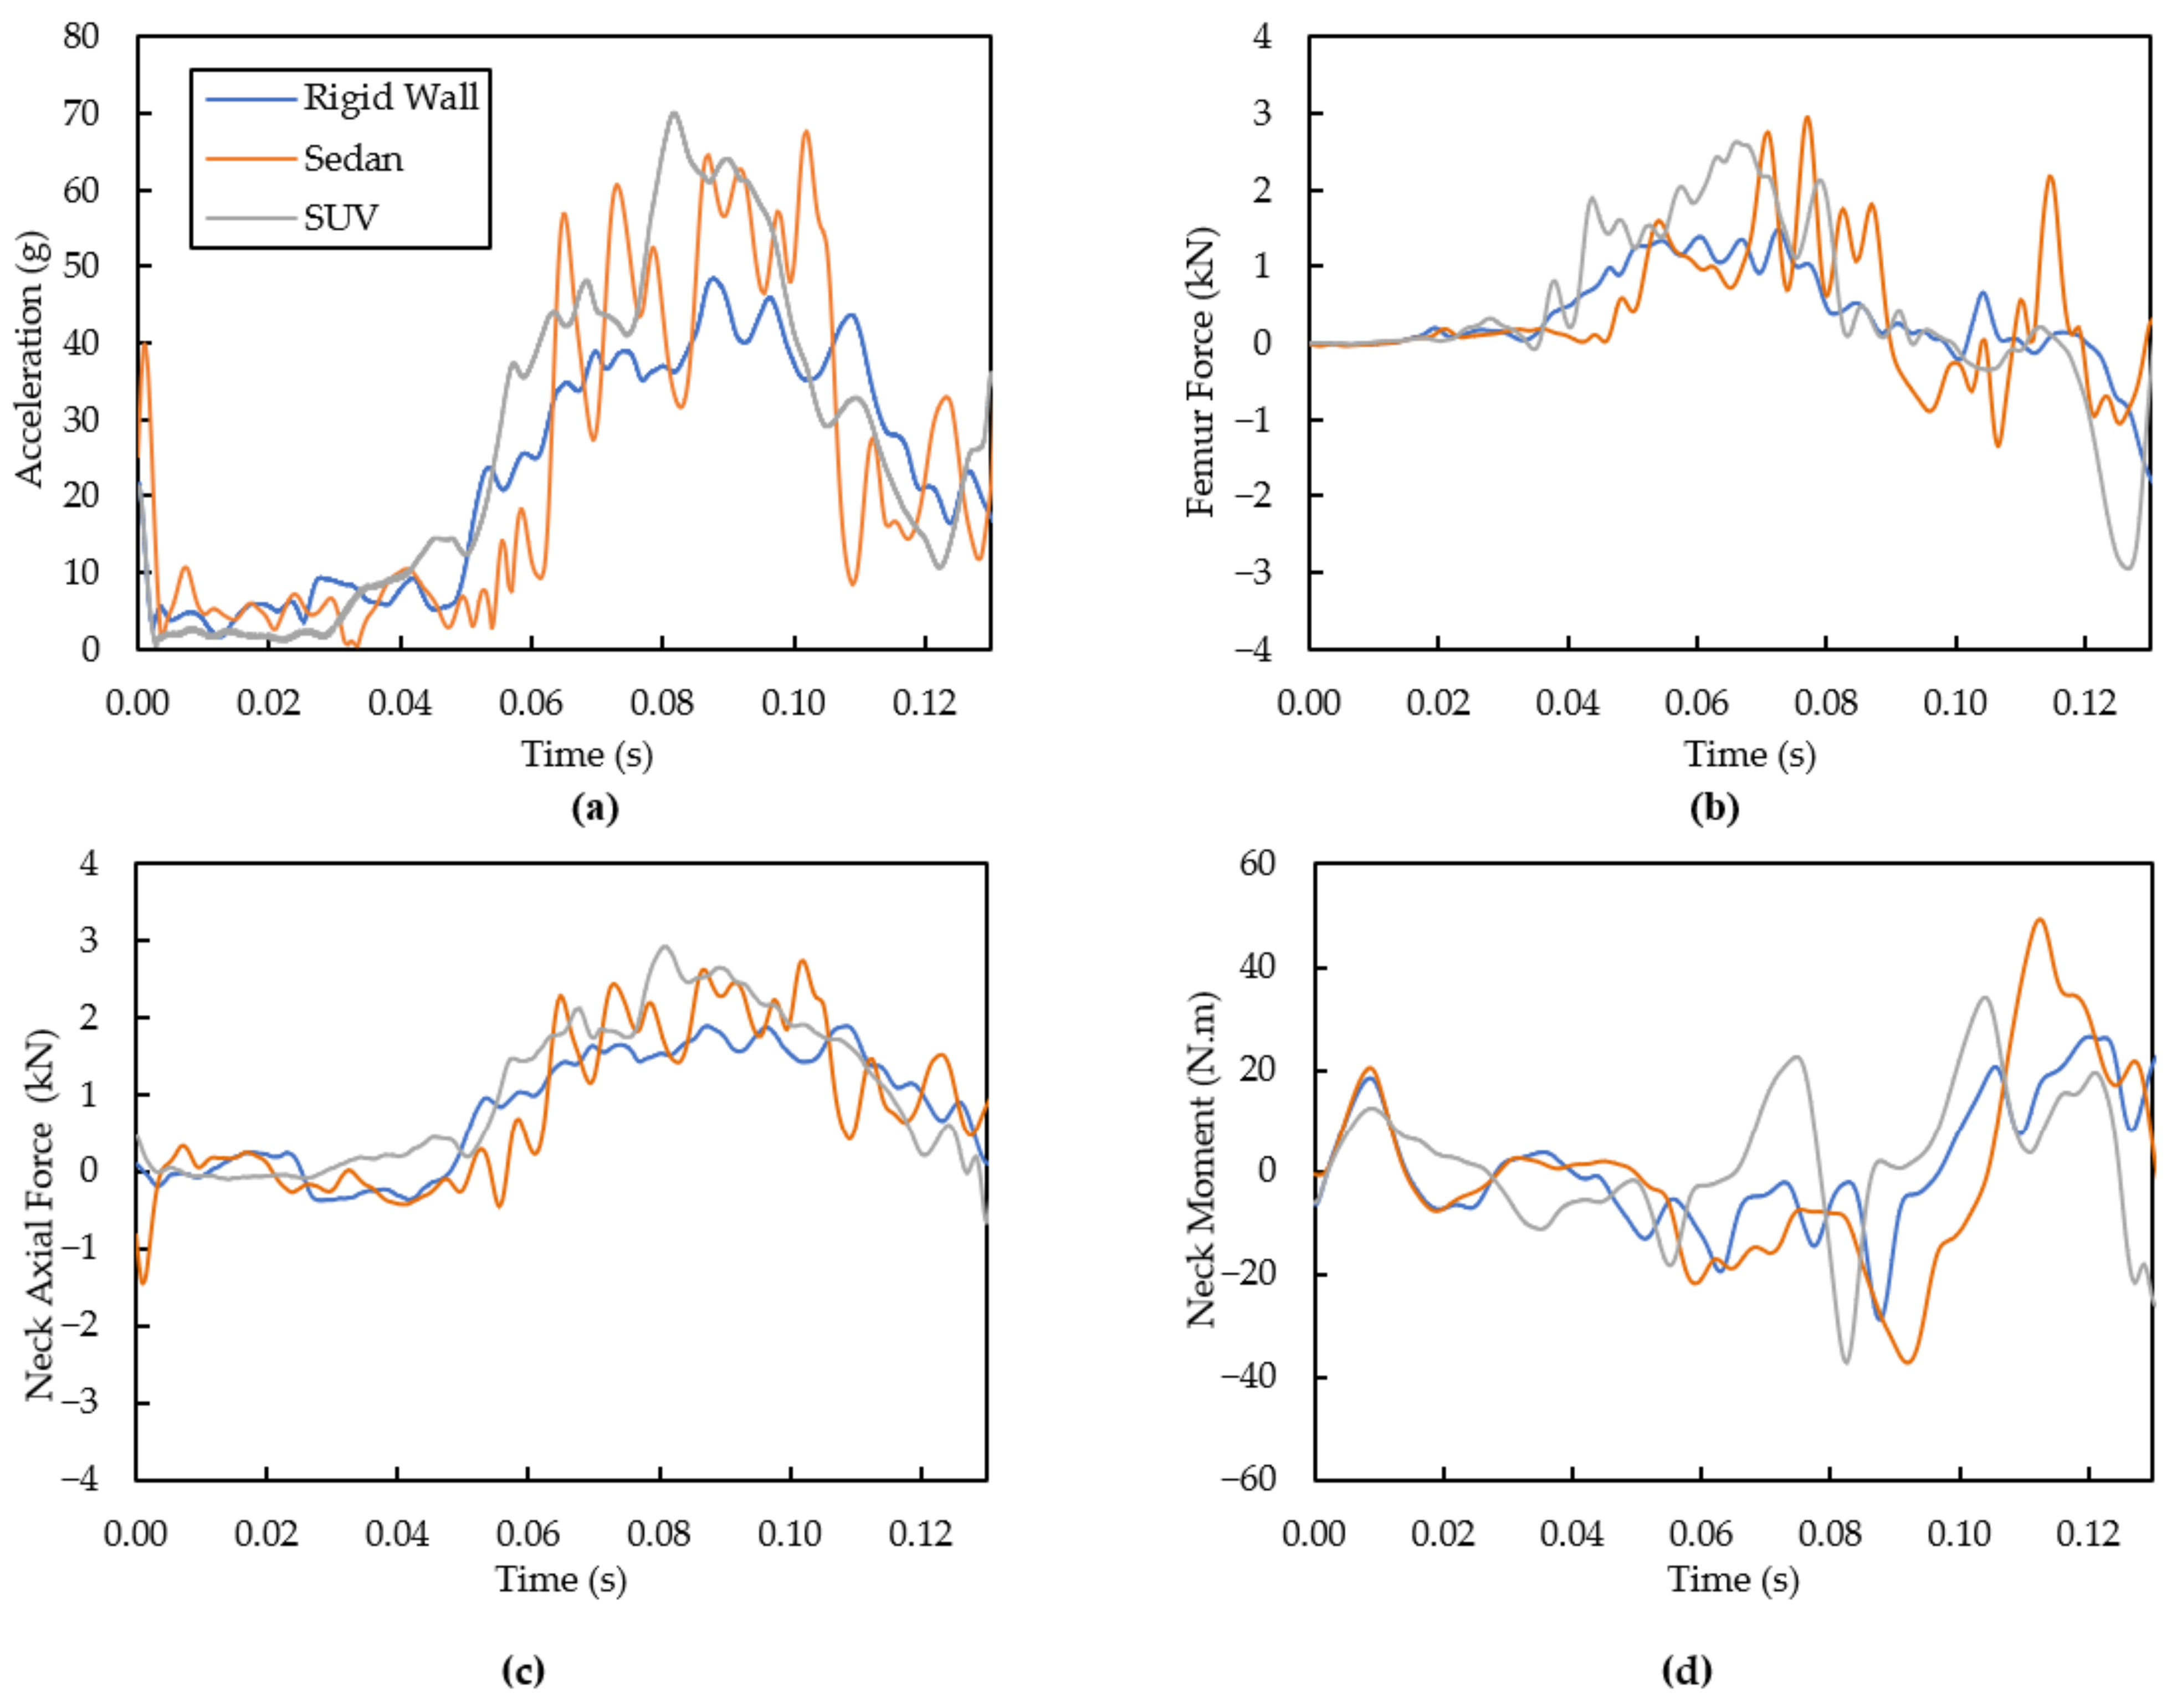
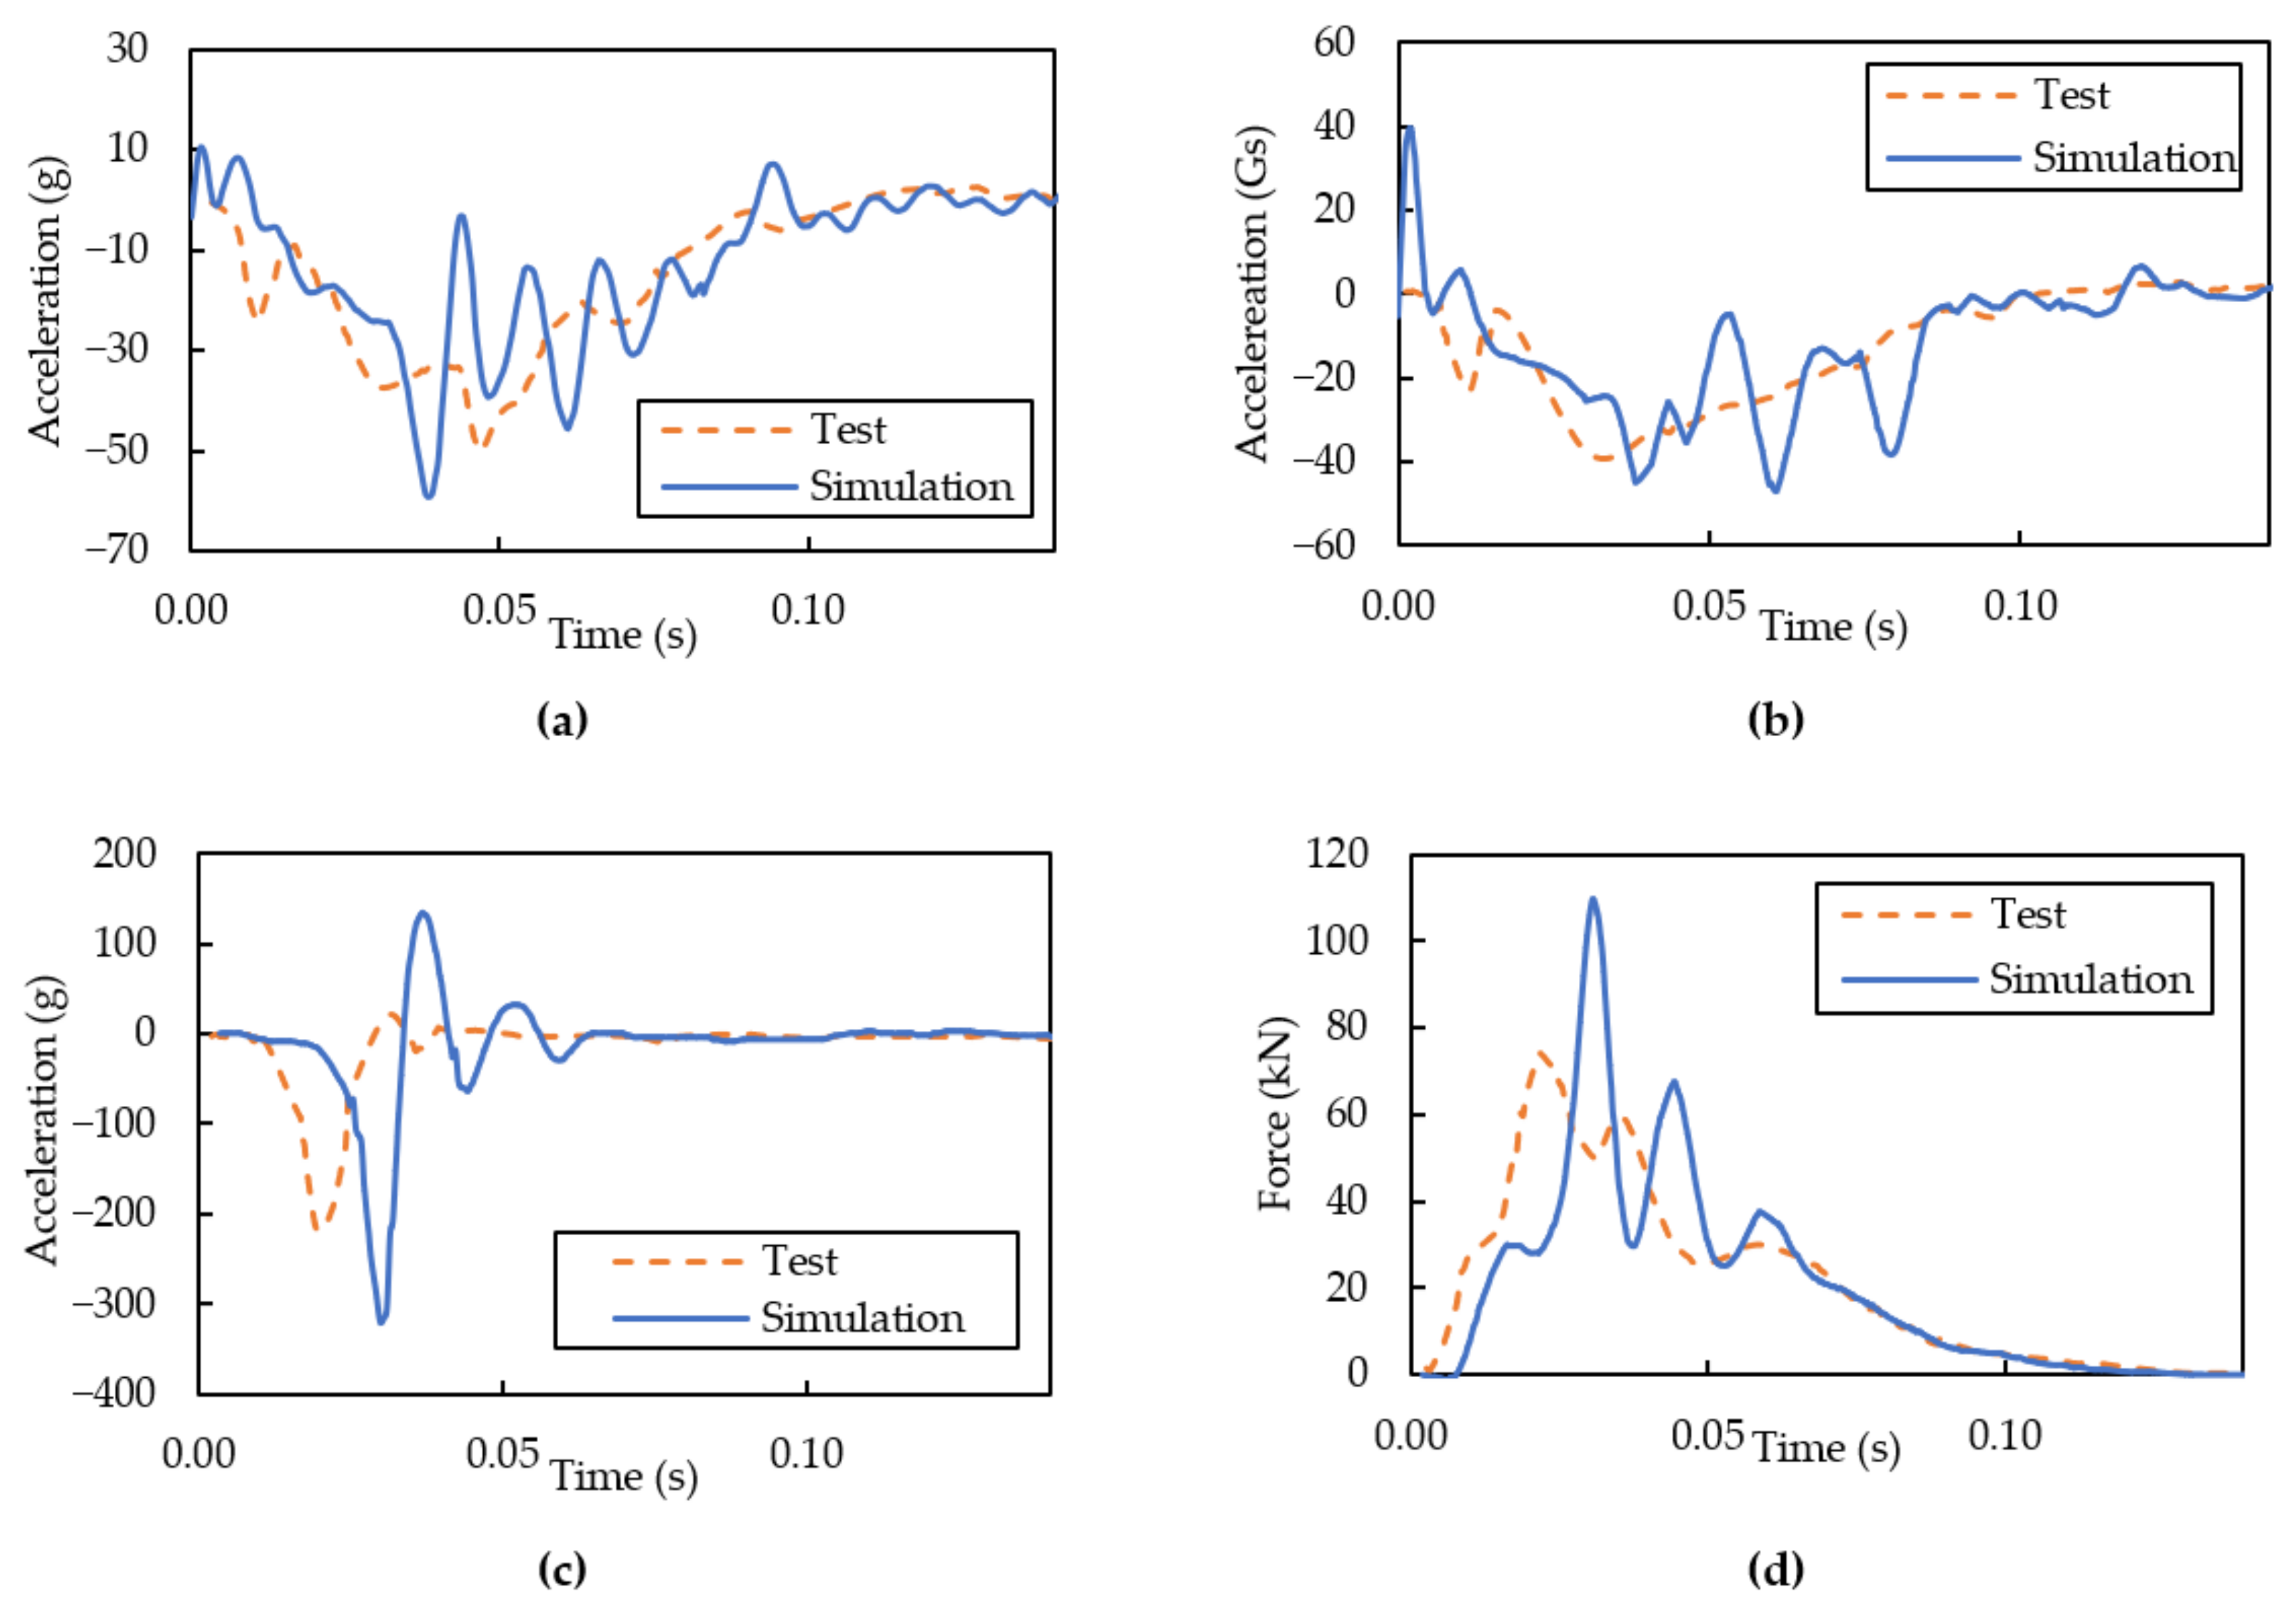
4.2. Dummy Responses in Frontal-Impact with Rigid Wall
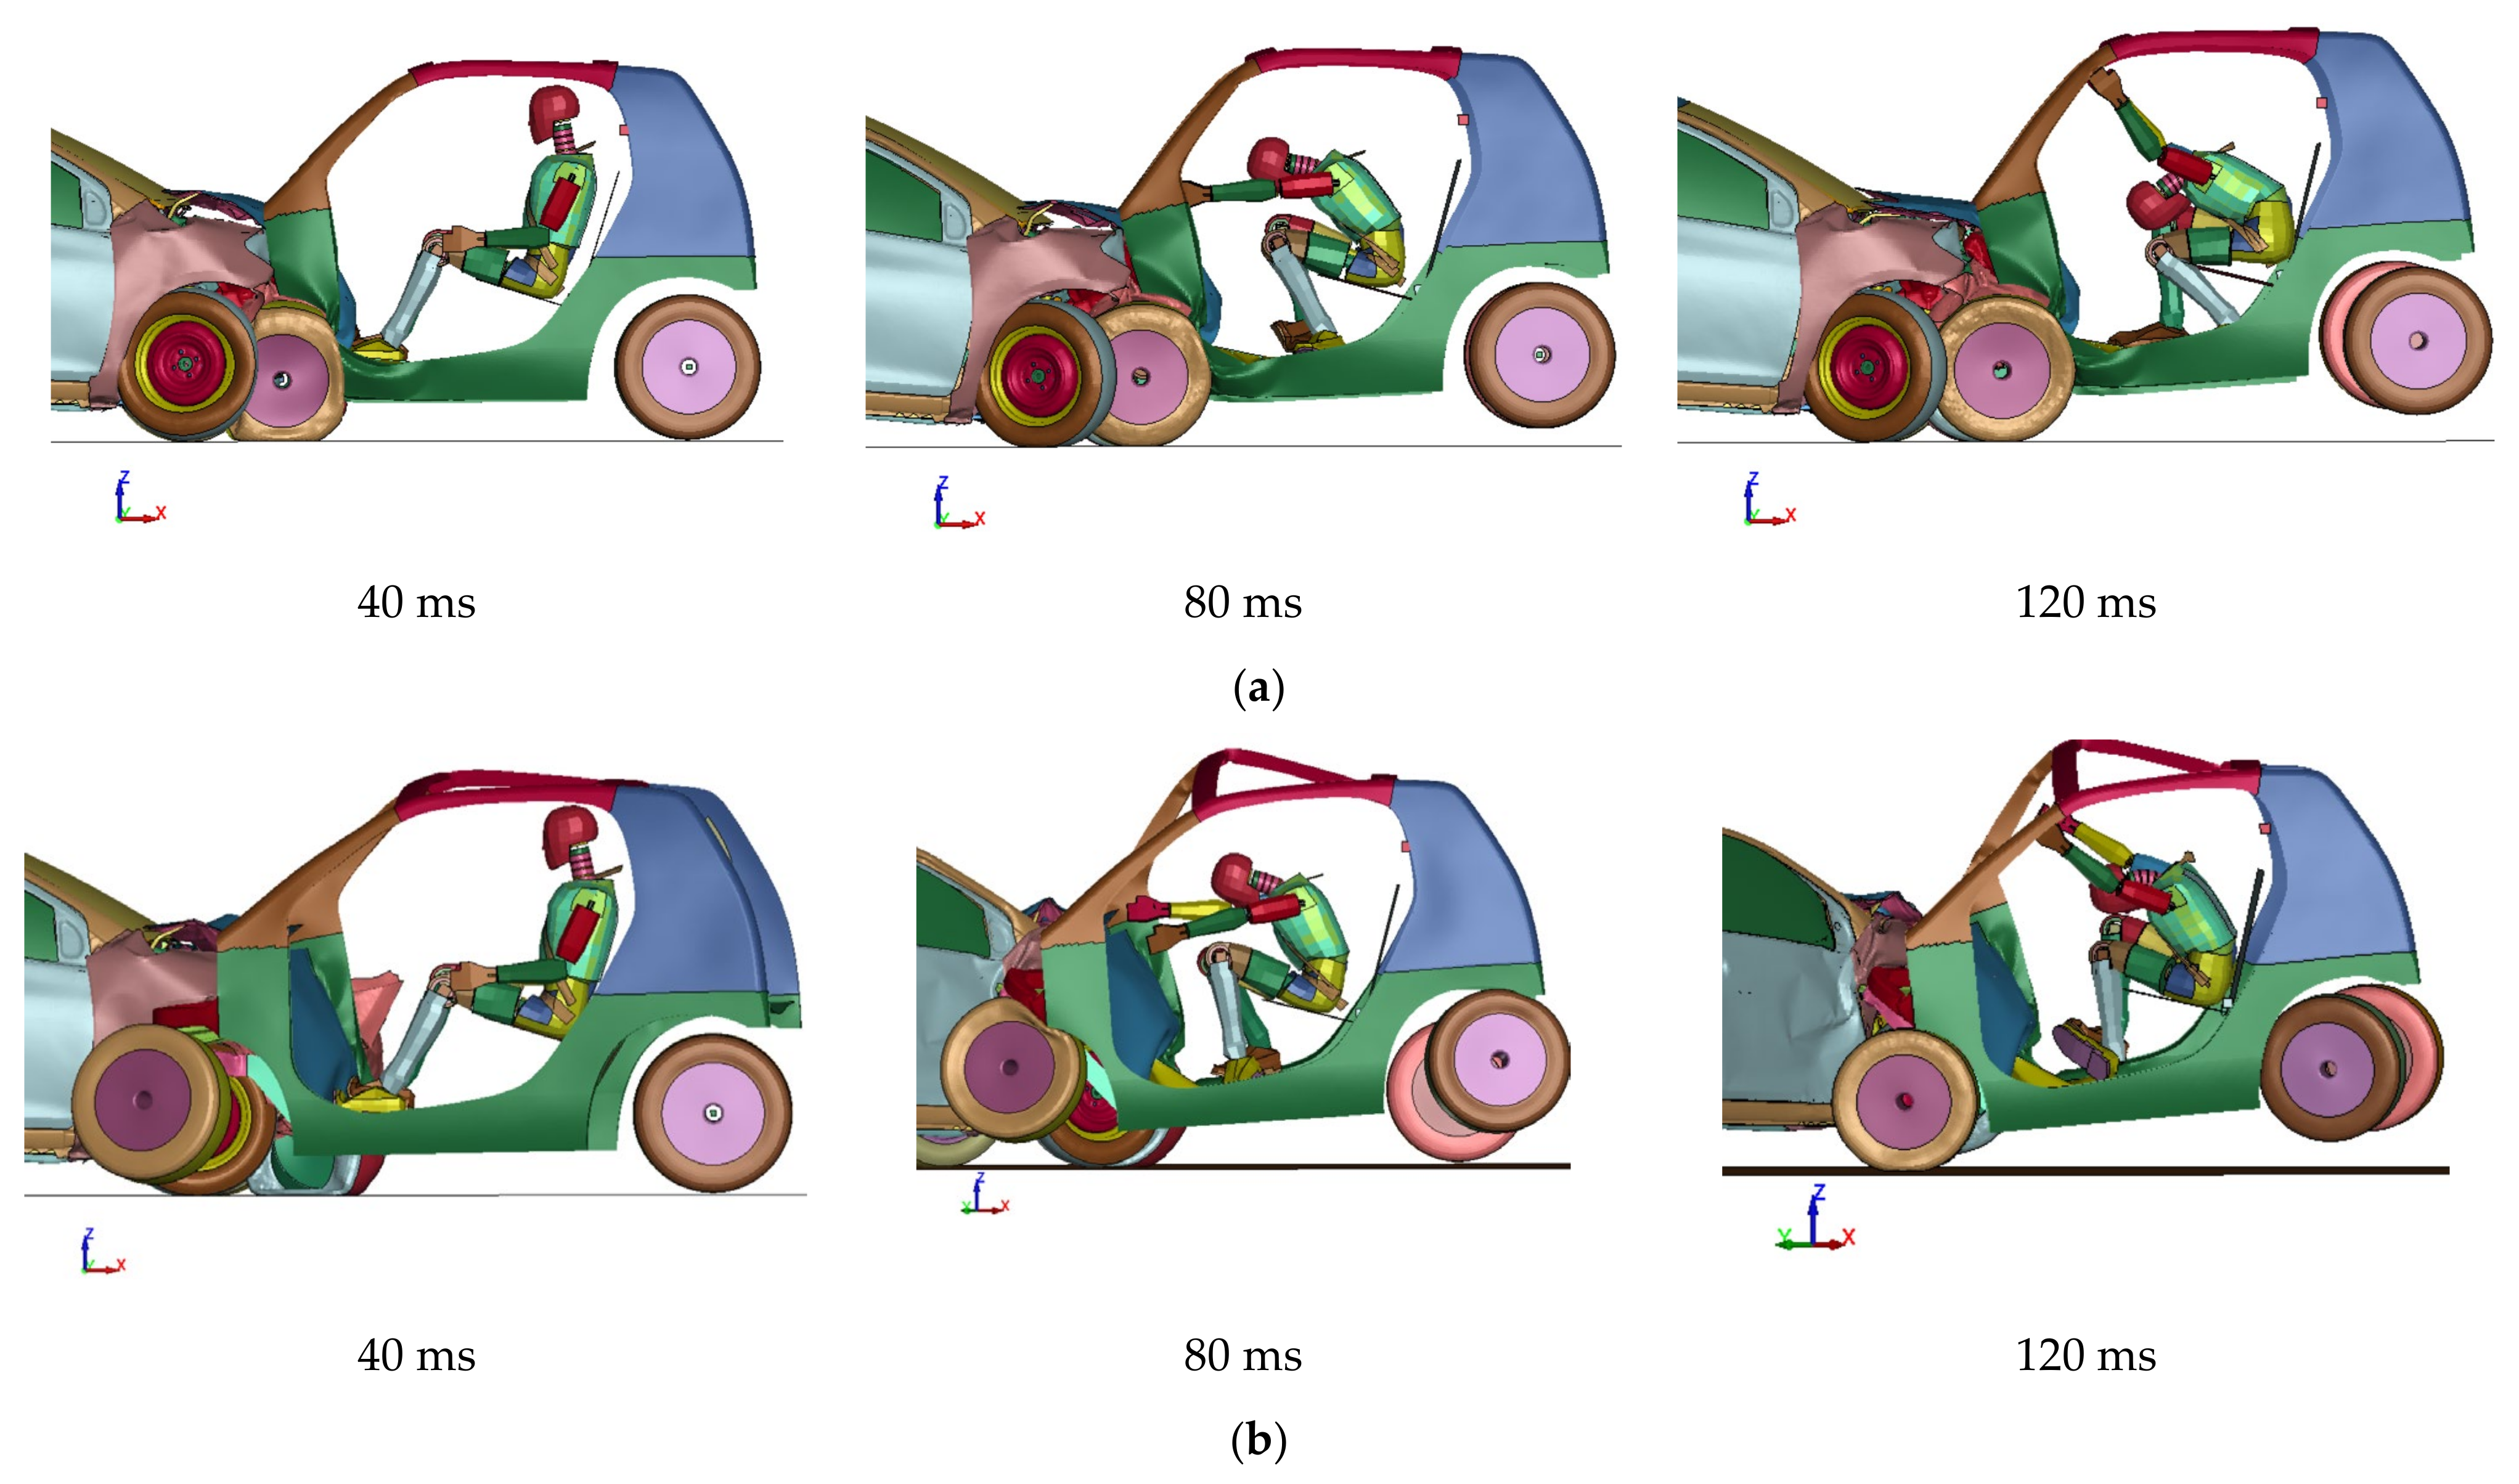
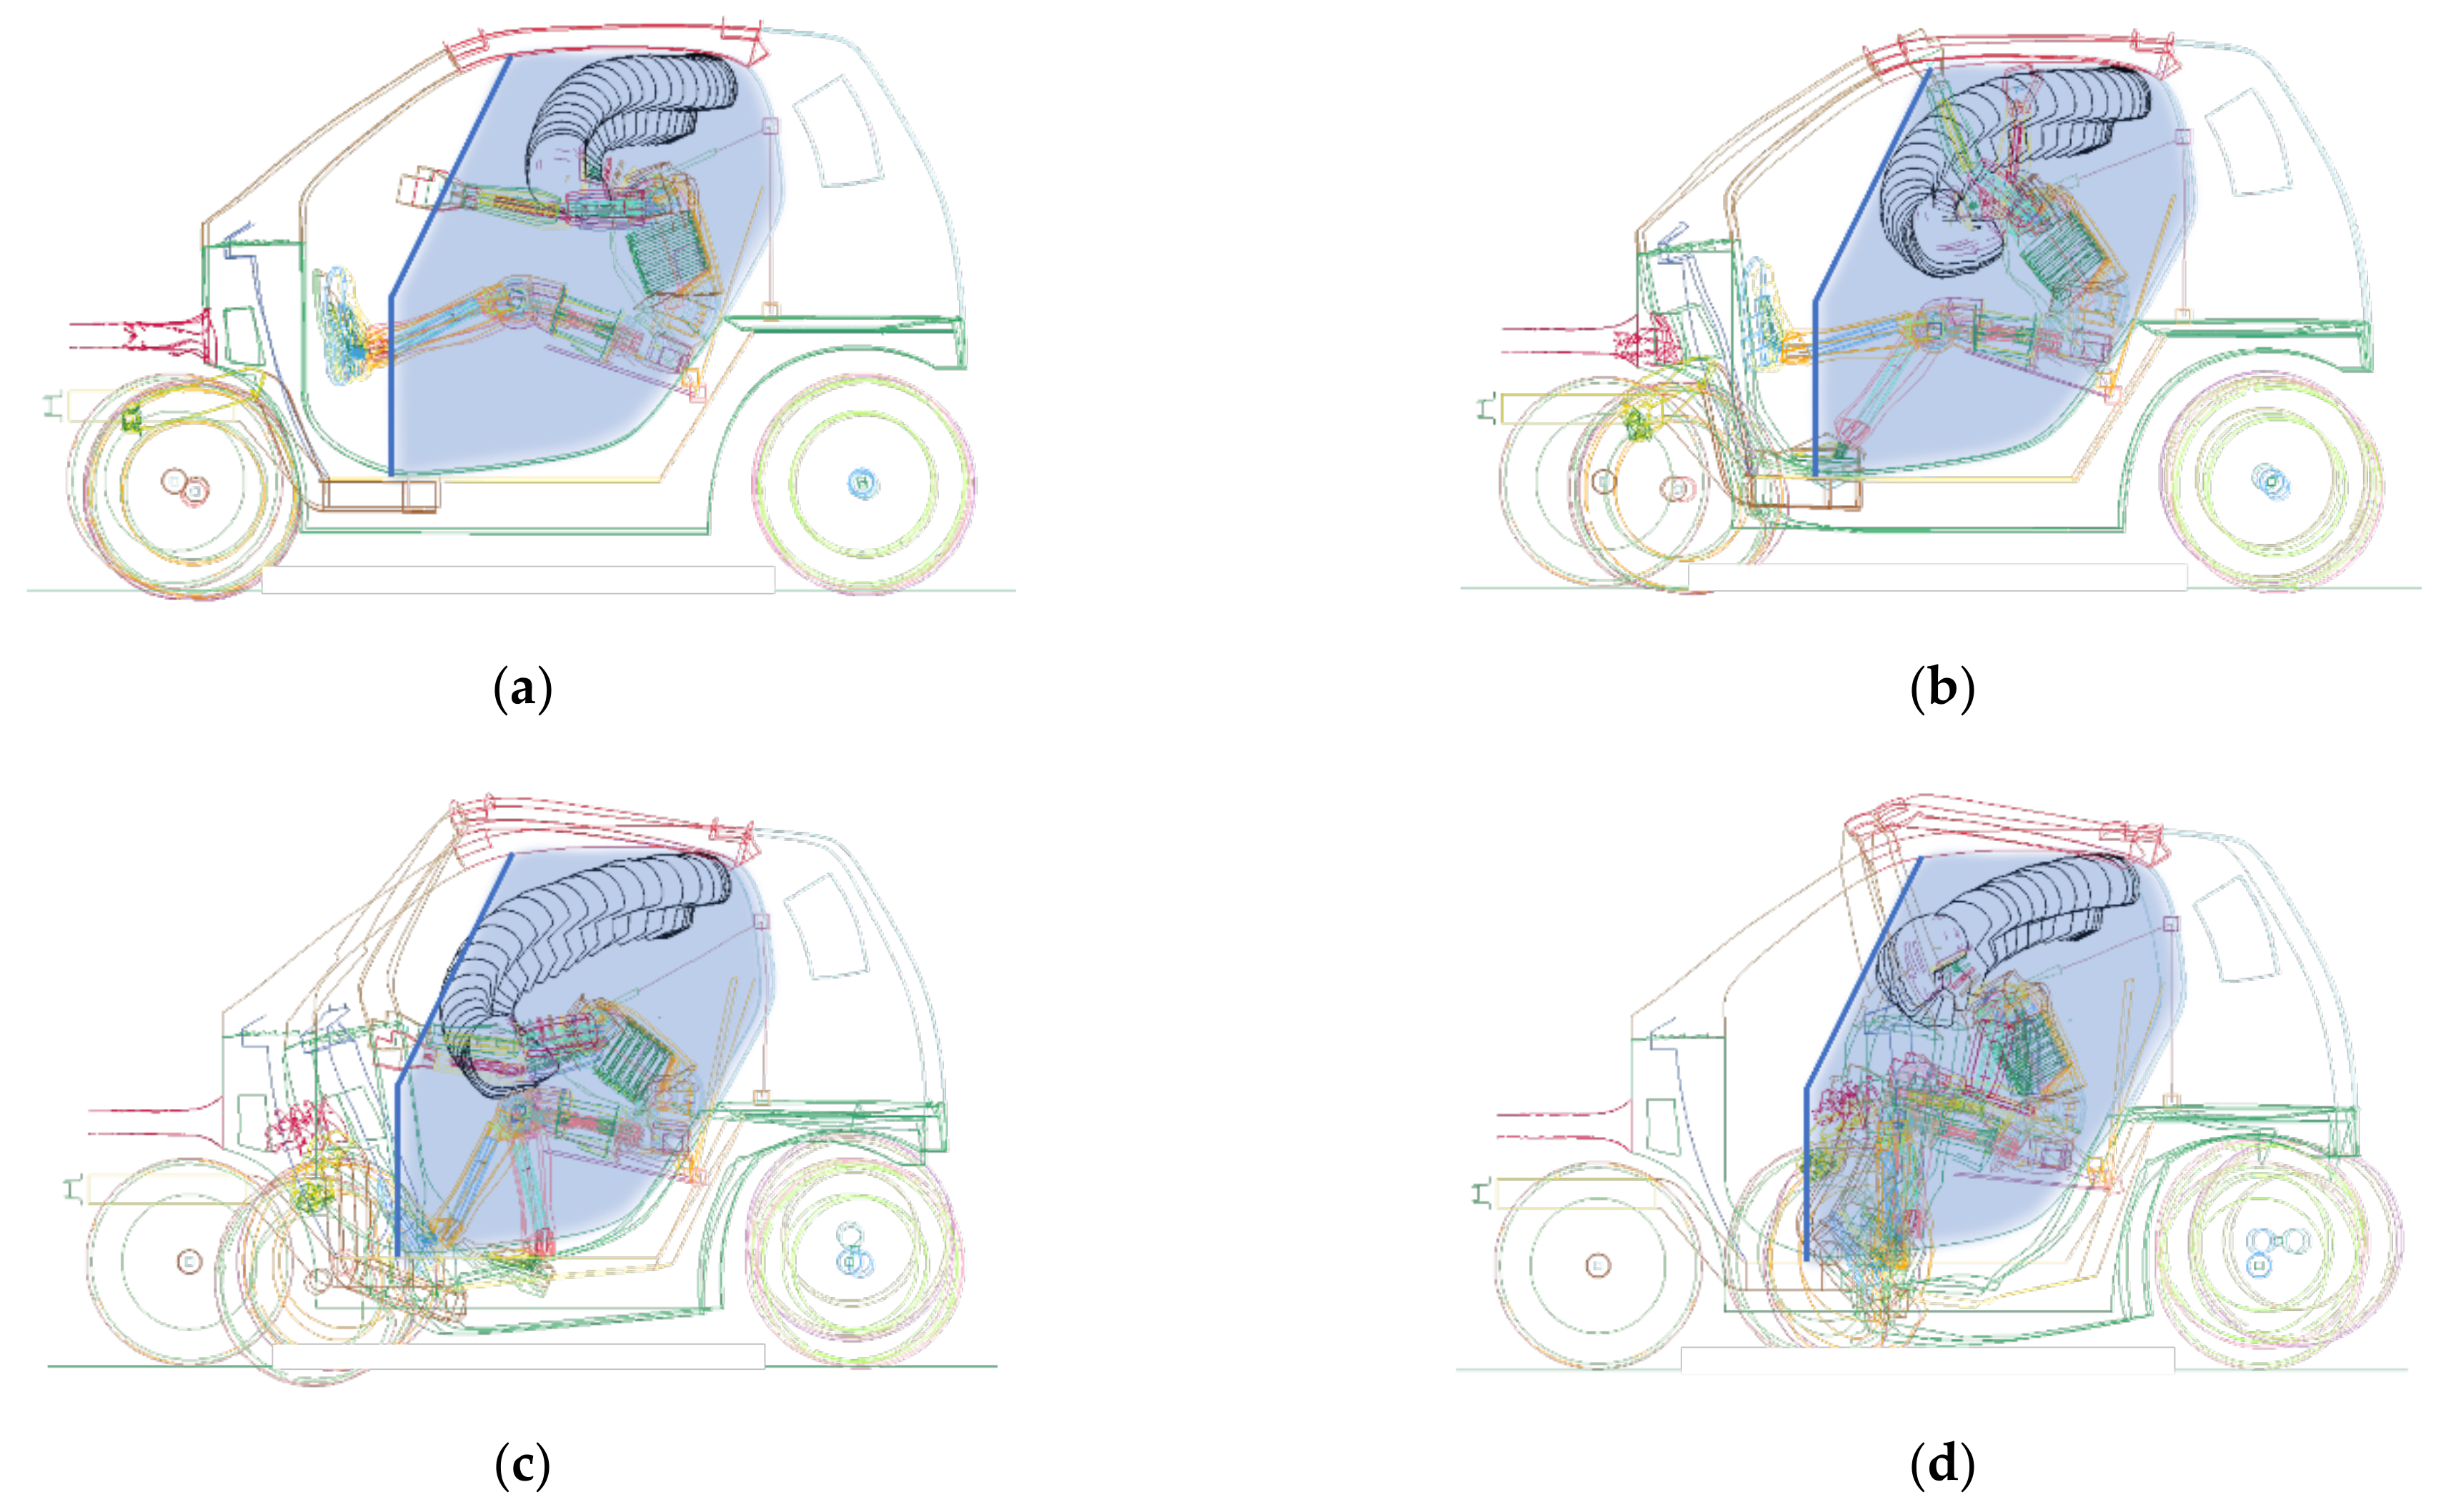
4.3. Dummy Kinematics and Injury Severity in Car-to-Car Collision
5. Conclusions
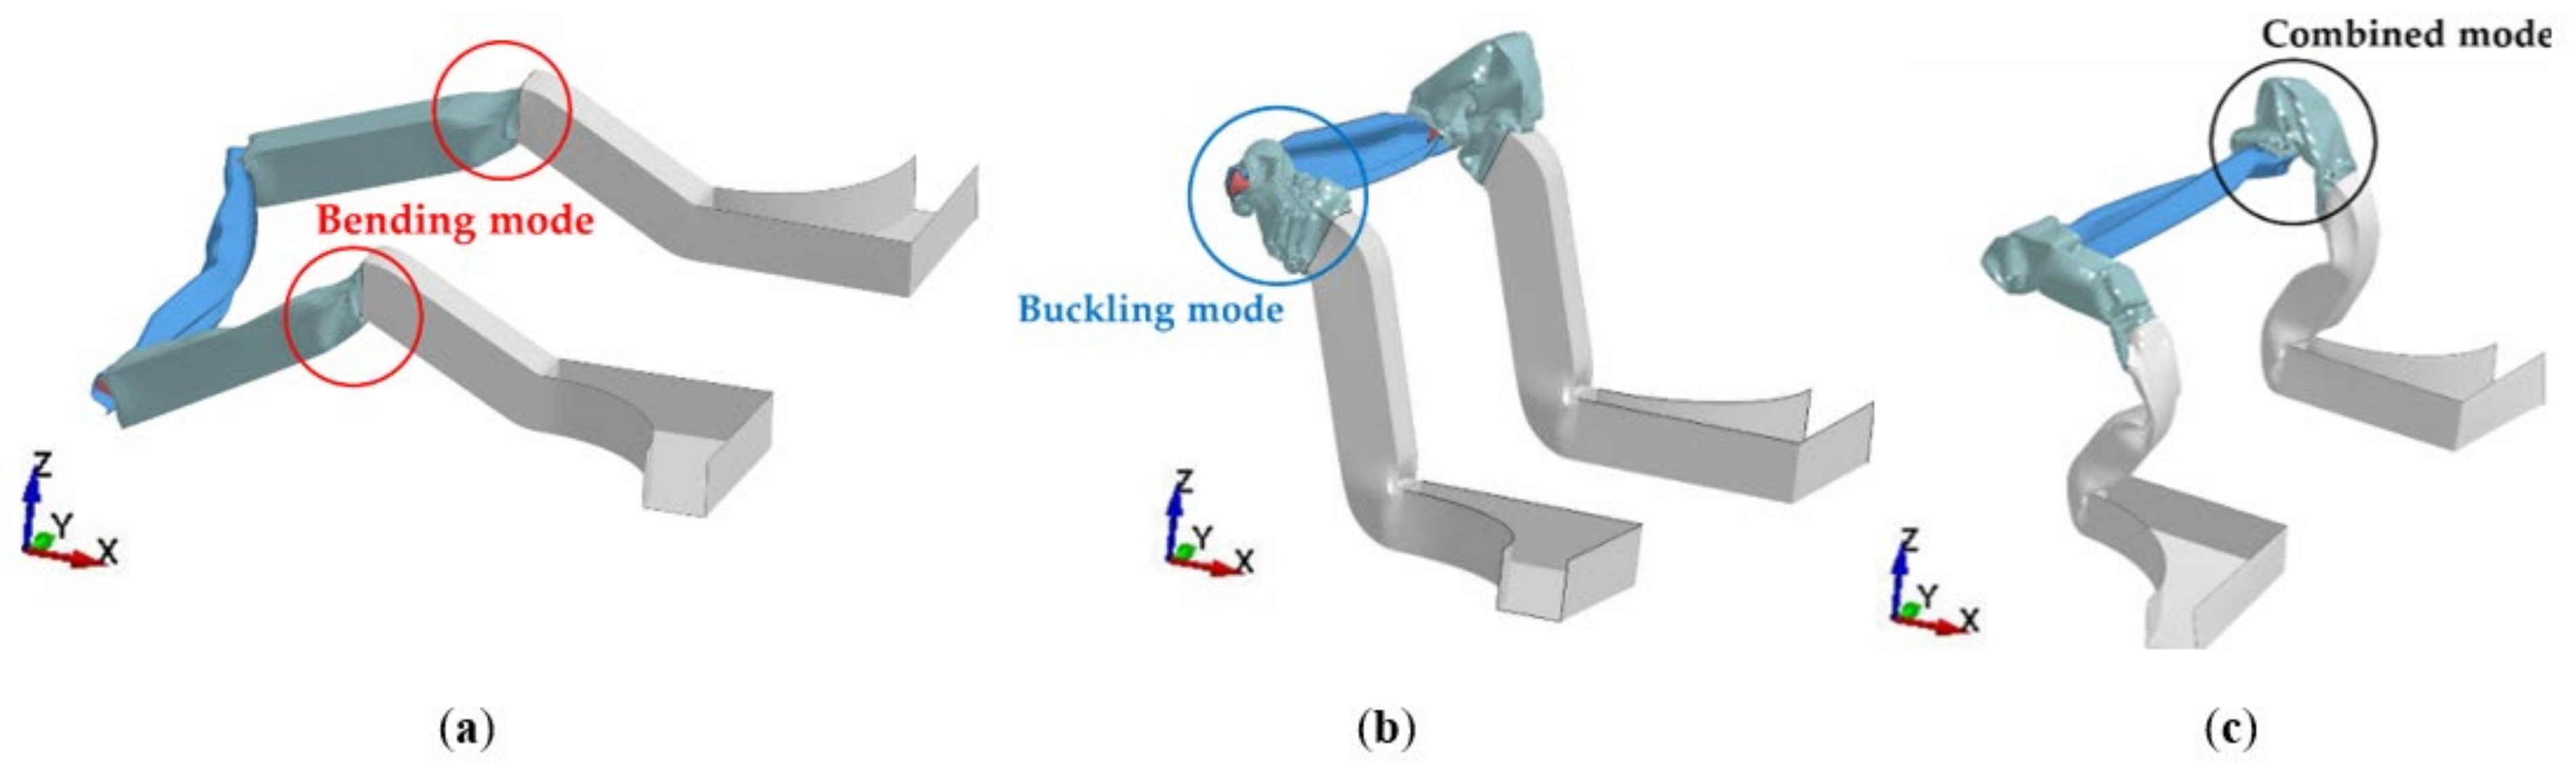
- Under a frontal crash, the front rail should be able to fail in buckling mode to absorb high-impact energy and efficiently reduce the structural intrusion into the compartment zone.
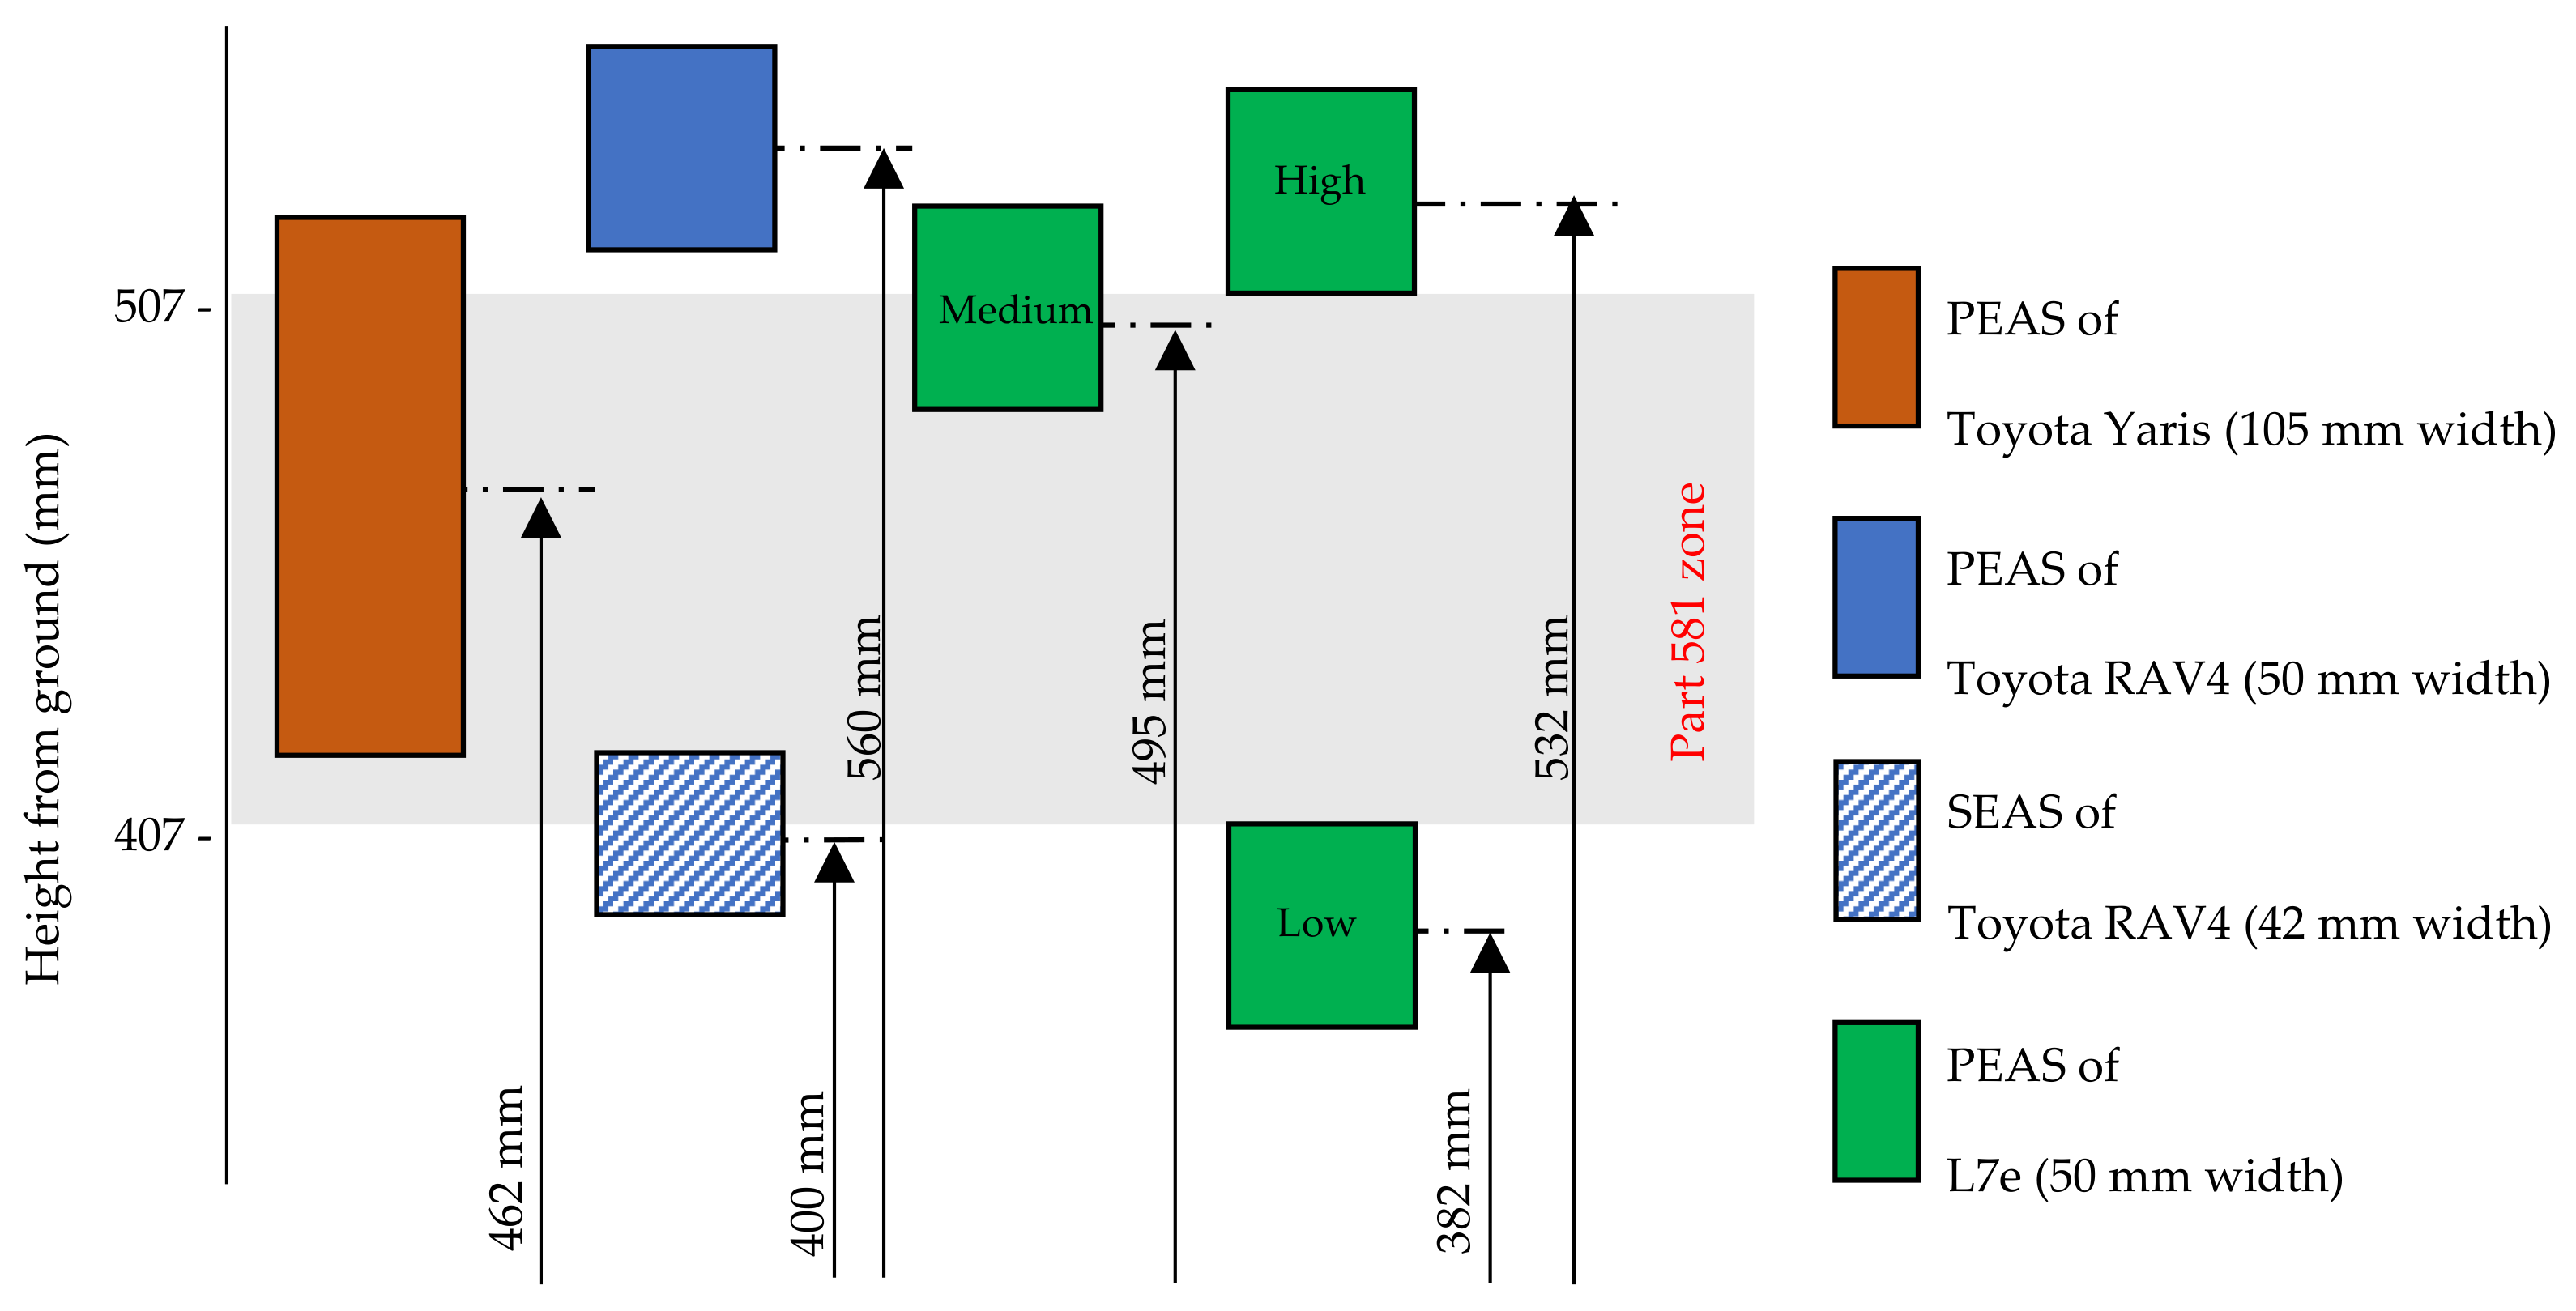
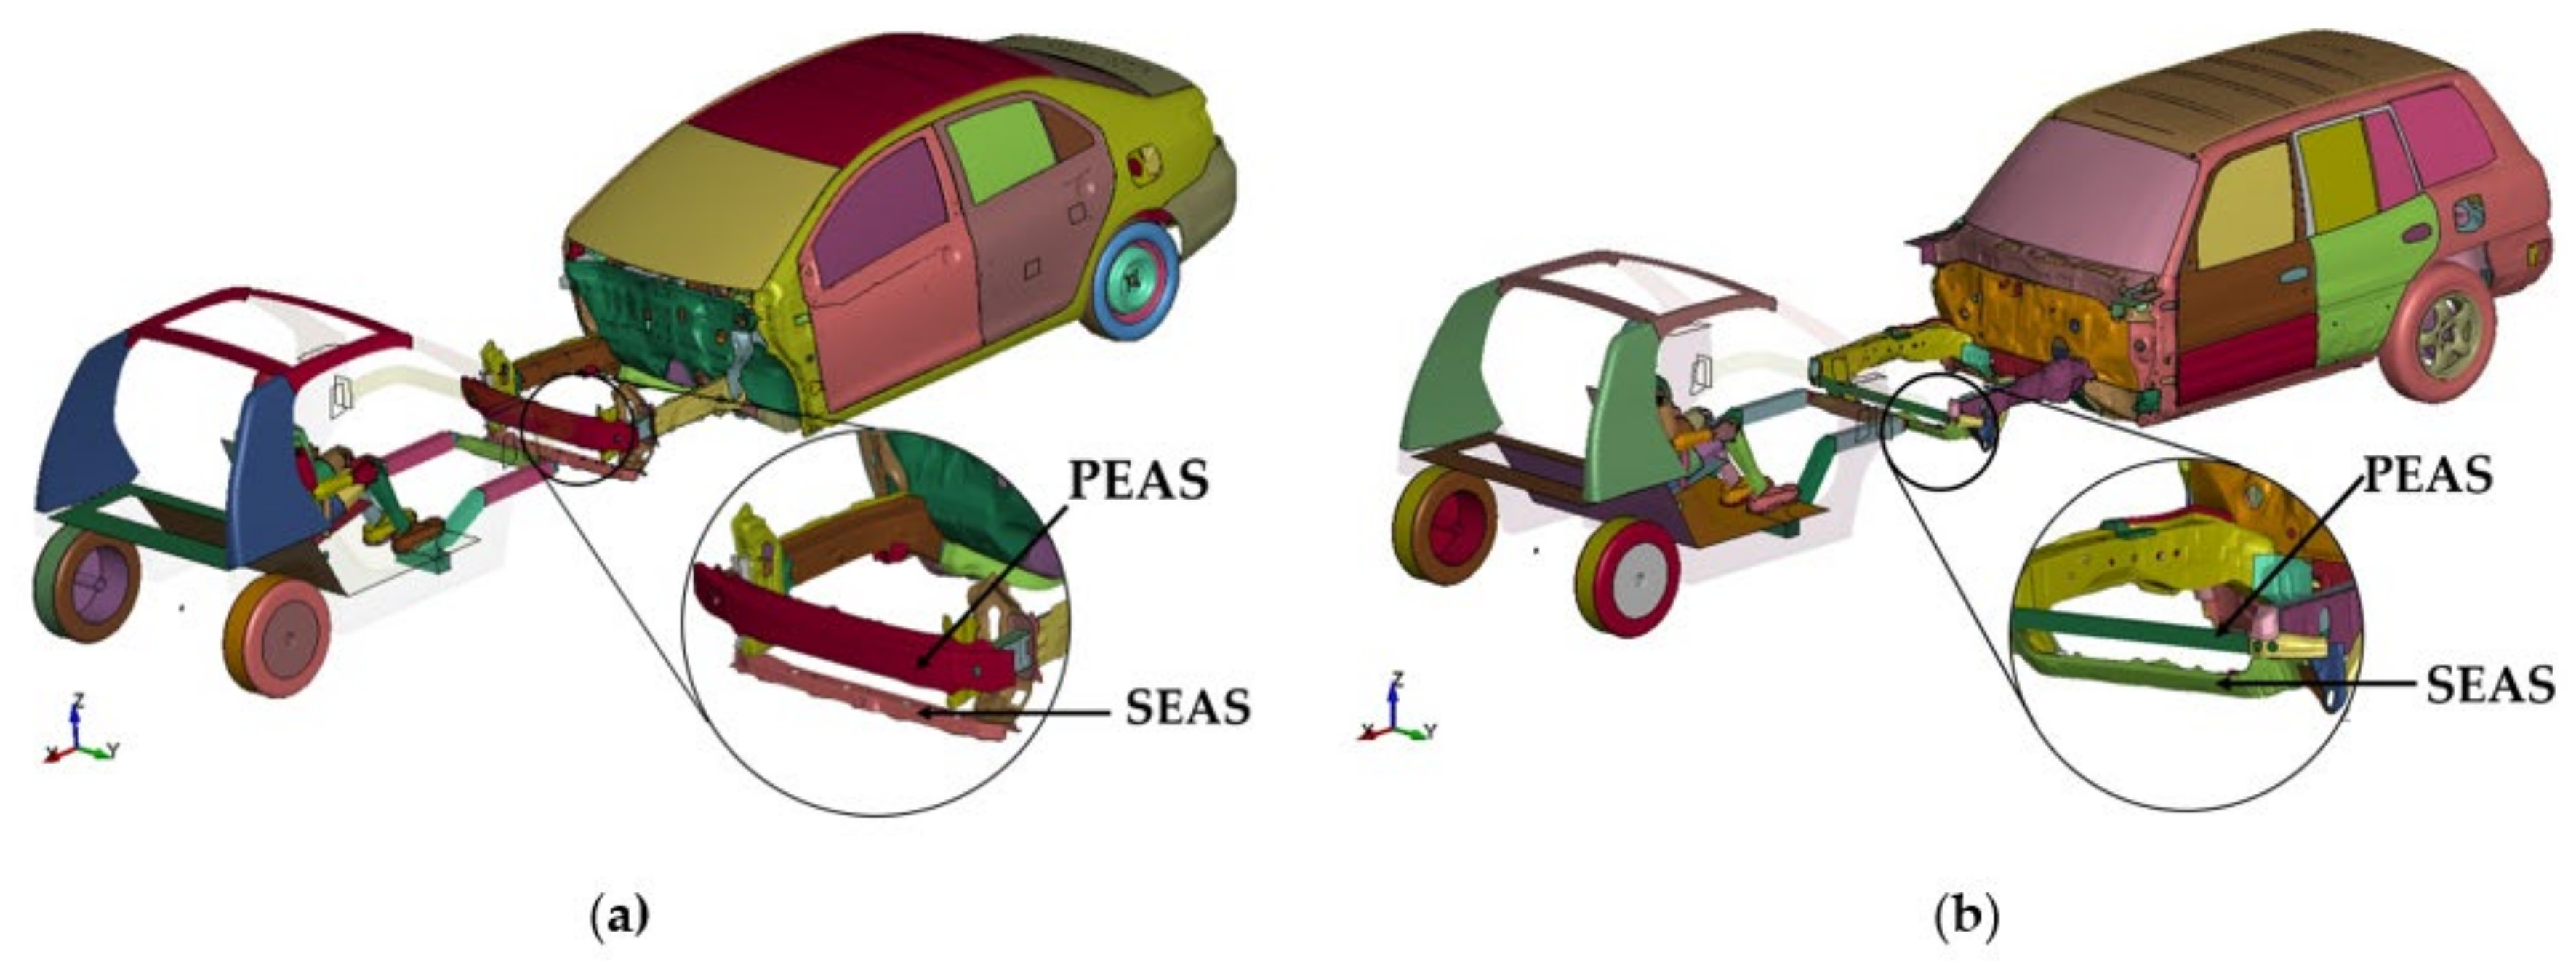
- The crash compatibility of the quadricycle with other opponent vehicles for occupant safety is considerably affected by the vertical alignment of the primary energy-absorbing structure. Optimizing the appropriate vertical alignment to match the bumper within the part 581 zone and adding a secondary energy-absorbing structure to the L7e vehicle is recommended.
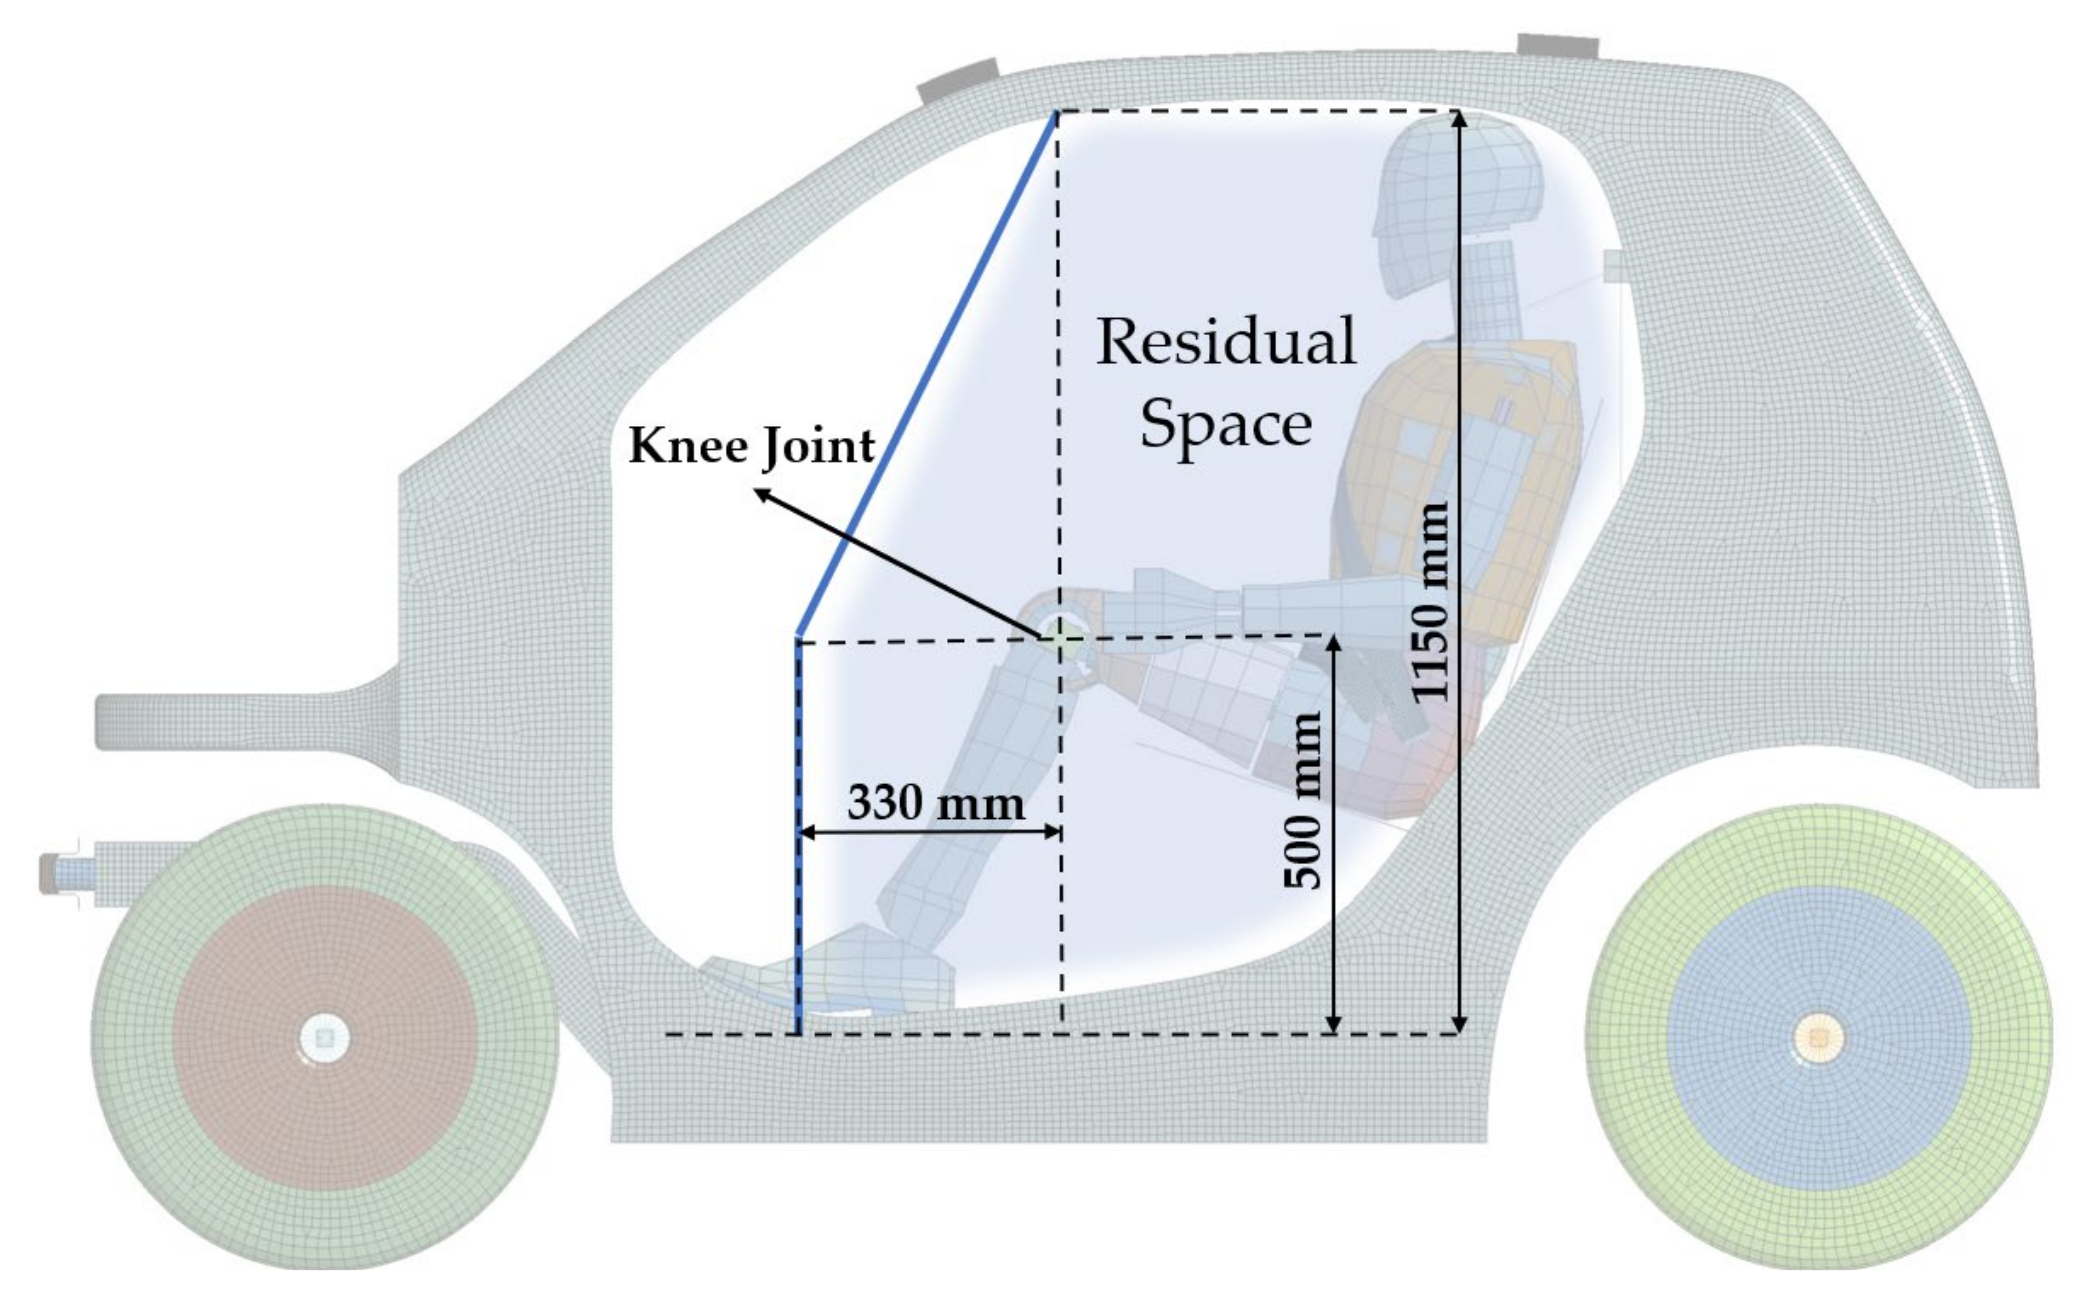
- The proposed residual space was well utilized to assess the structural performance and passenger safety in the full-frontal impact with the rigid wall scenario.
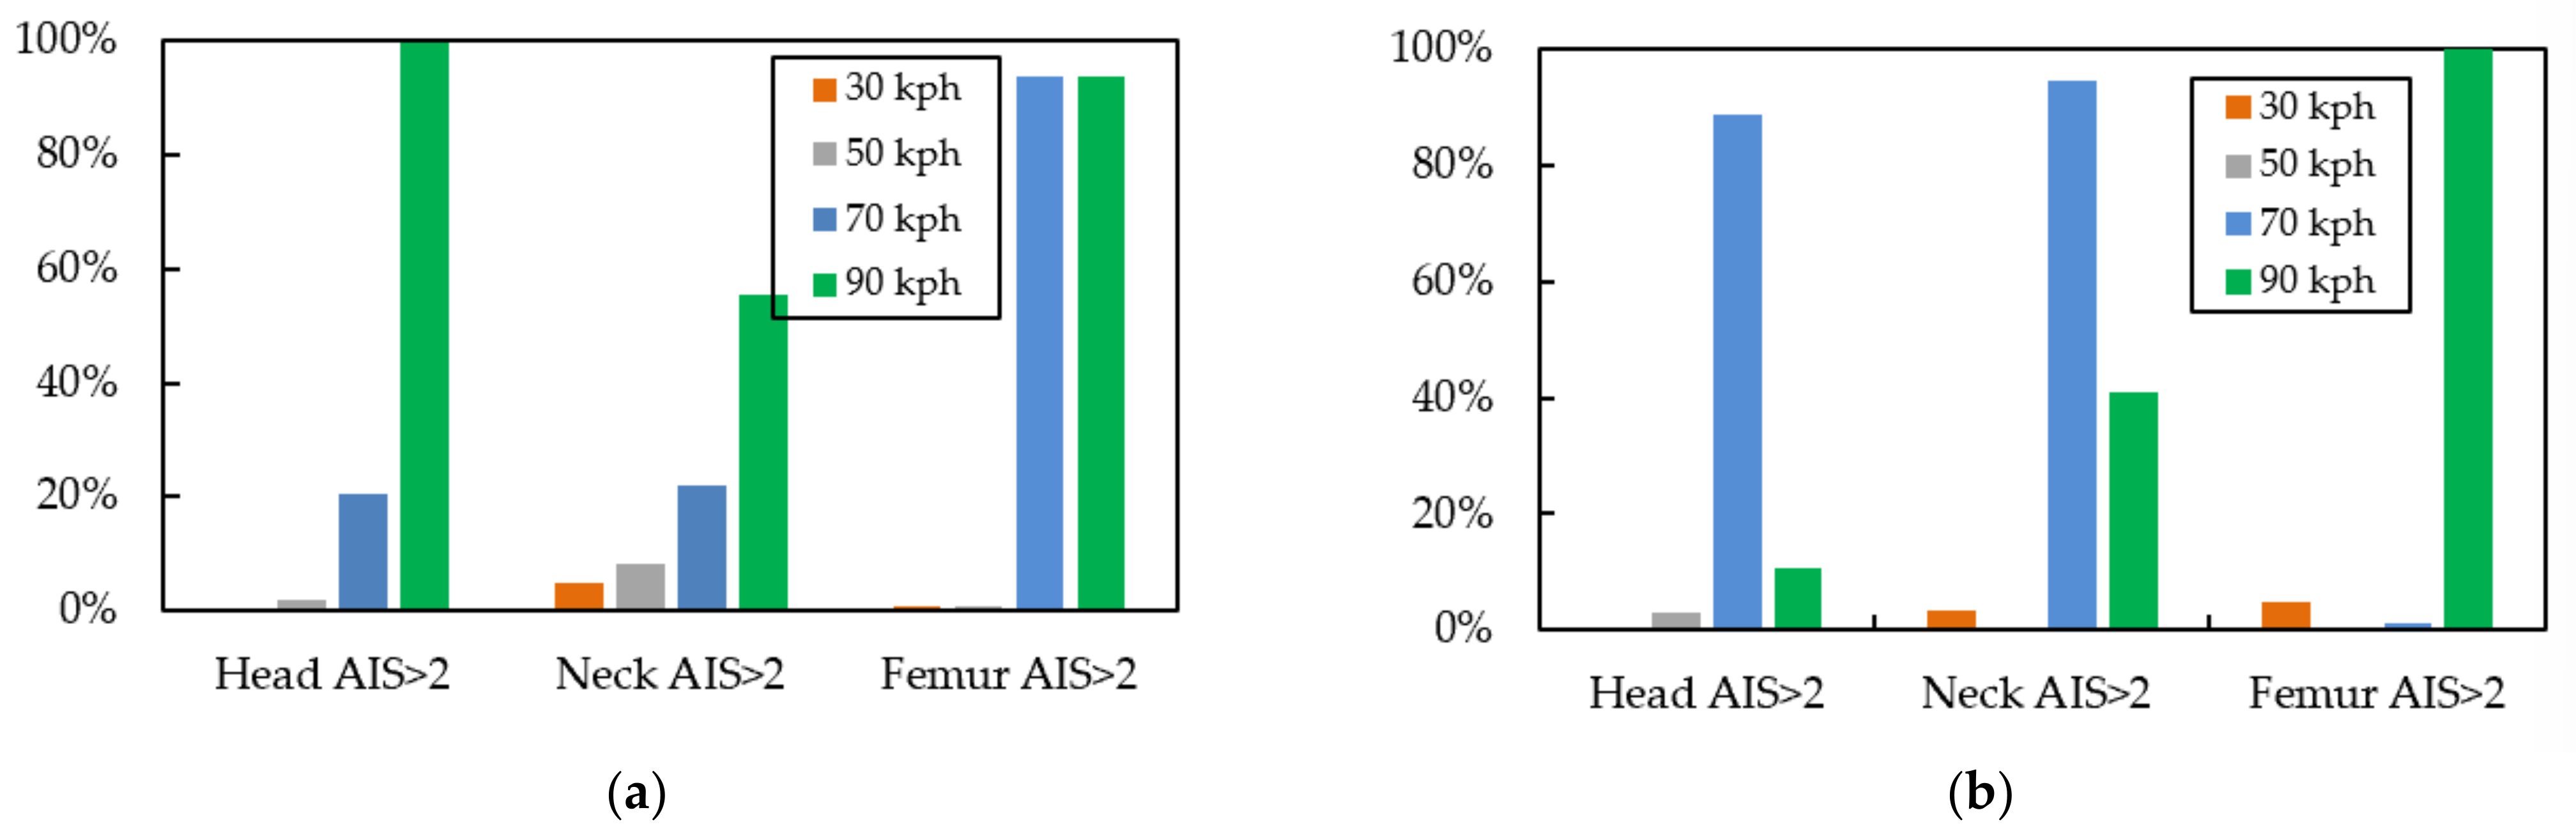
- The frontal impact of a quadricycle with the rigid wall might not be adequate to guarantee the occupant injuries from the actual car-to-car accidents since it showed the lowest injury severities compared with other car-to-car crashes.
- Safety assessments using only the energy absorption or intrusion of the frontal structures are inadequate to represent the passenger’s injury severity because the results are significantly conflicted with the occupant injuries according to the AIS 2+.
Author Contributions
Funding
Informed Consent Statement
Data Availability Statement
Conflicts of Interest
Appendix A


| Parameters | Left Rear Seat | Right Rear Seat | Top Engine | Rigid Wall Force | |
|---|---|---|---|---|---|
| Sprague-Geers MPC | Magnitude (%) | −9.6 | 4.6 | 25.5 | 12.0 |
| Phase (%) | 13.5 | 13.8 | 40.0 | 9.7 | |
| ANOVA | Average deviation (%) | −2.0 | −1.6 | −0.7 | 3.0 |
| Standard deviation (%) | 17.1 | 18.7 | 33.2 | 16.9 |
| Parameters | Left Rear Seat | Right Rear Seat | Top Engine | Rigid Wall Force | |
|---|---|---|---|---|---|
| Sprague-Geers MPC | Magnitude (%) | −6.4 | 5.5 | 35.5 | 4.8 |
| Phase (%) | 14.7 | 19.0 | 13.9 | 8.5 | |
| ANOVA | Average deviation (%) | 3.5 | 2.6 | 0.7 | 9.8 |
| Standard deviation (%) | 17.3 | 27.2 | 12.1 | 10.9 |


Appendix B


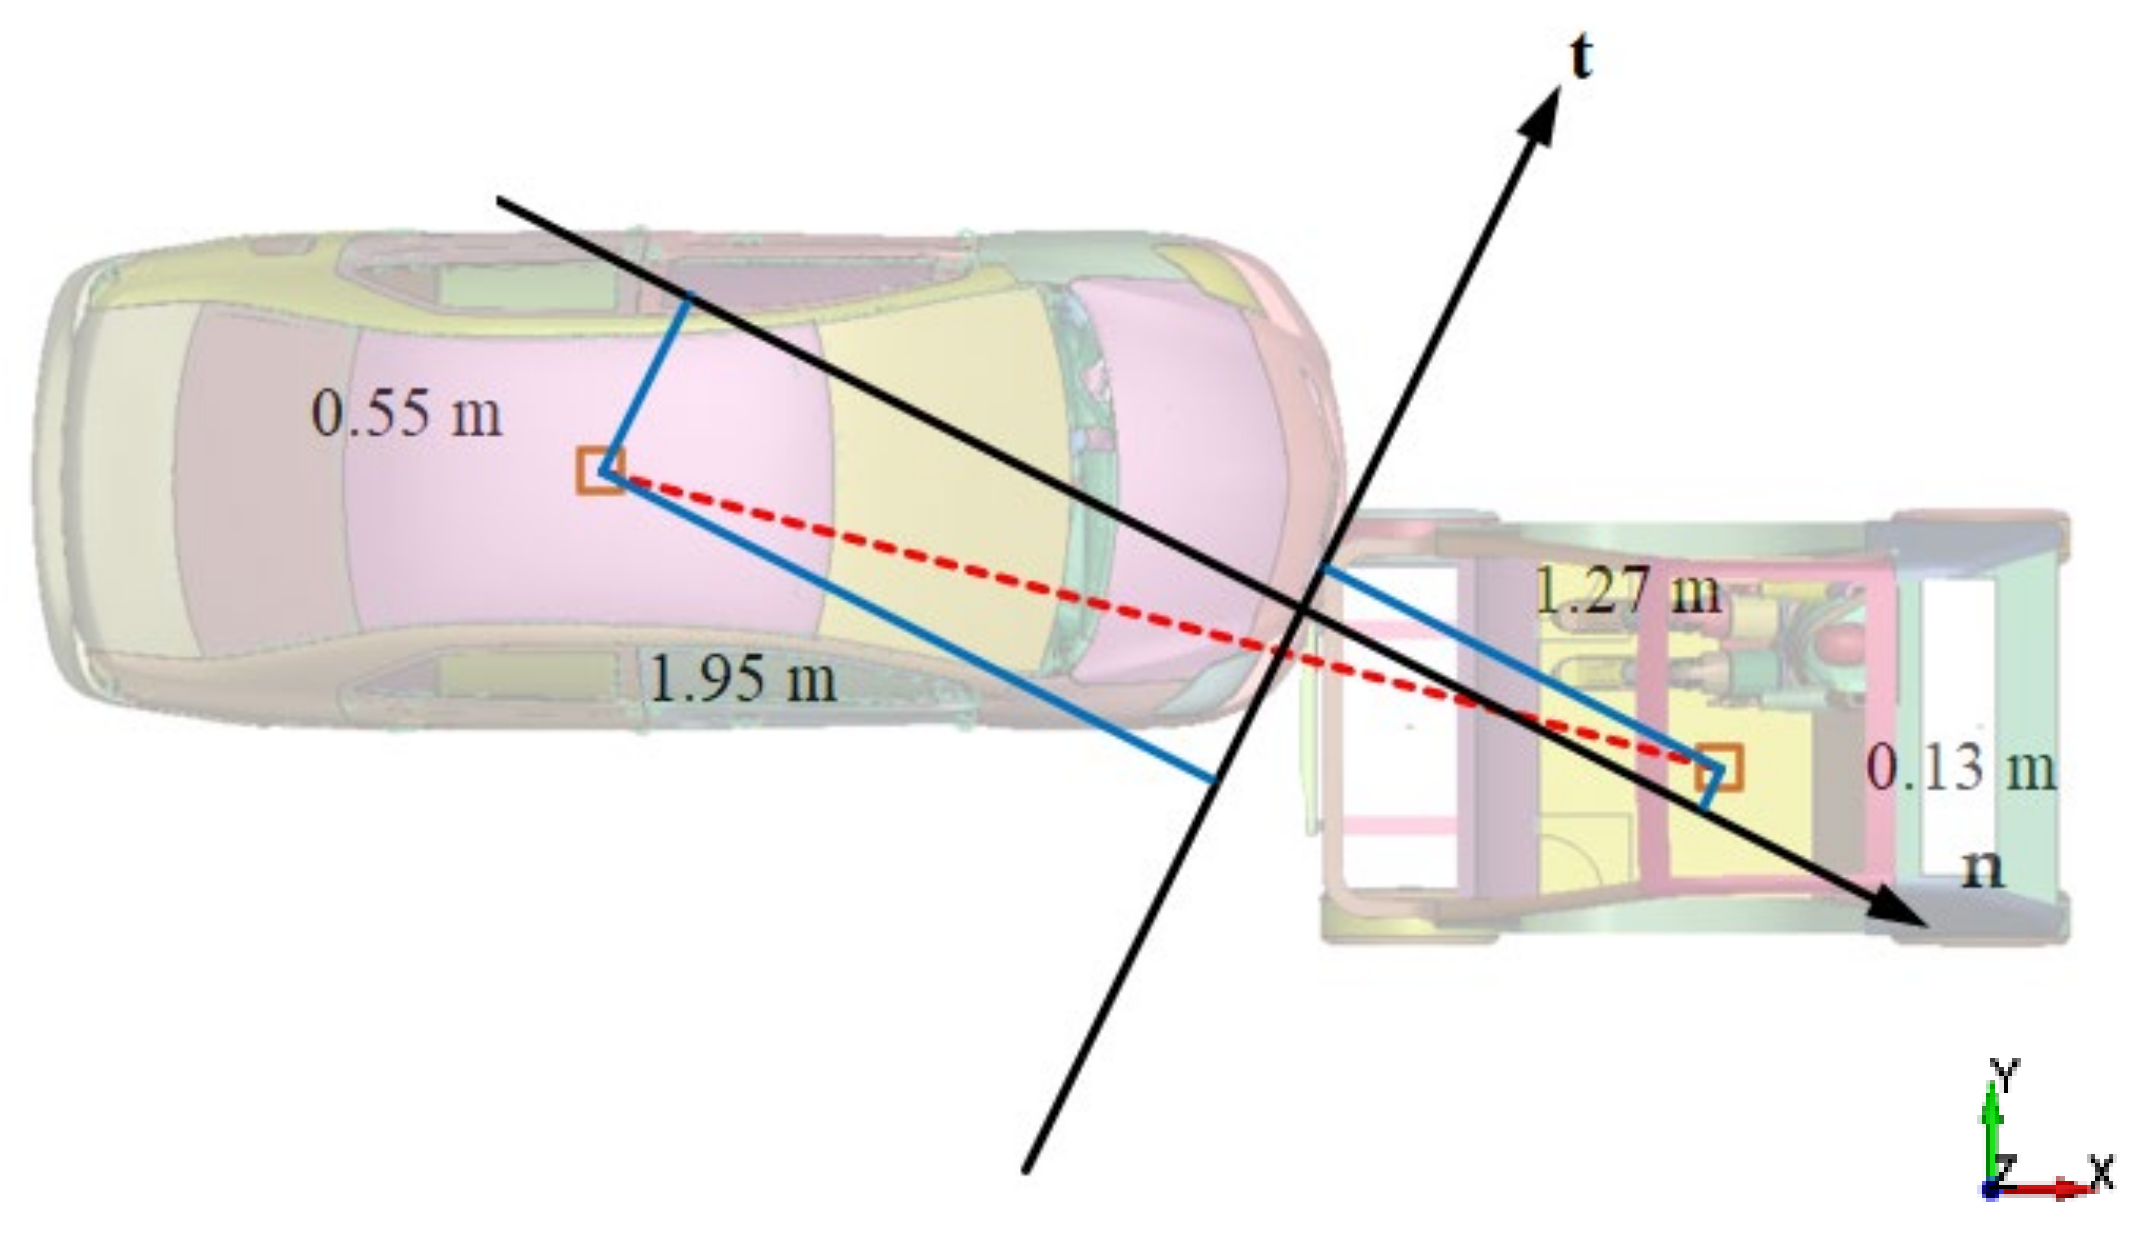
| Post-Crash Result | Simulation | Theoretical |
|---|---|---|
| Normal impulse (N.s) | 8963 | 8155 |
| Tangent impulse (N.s) | 1539 | 1631 |
| Resultant impulse (N.s) | 9094 | 8316 |
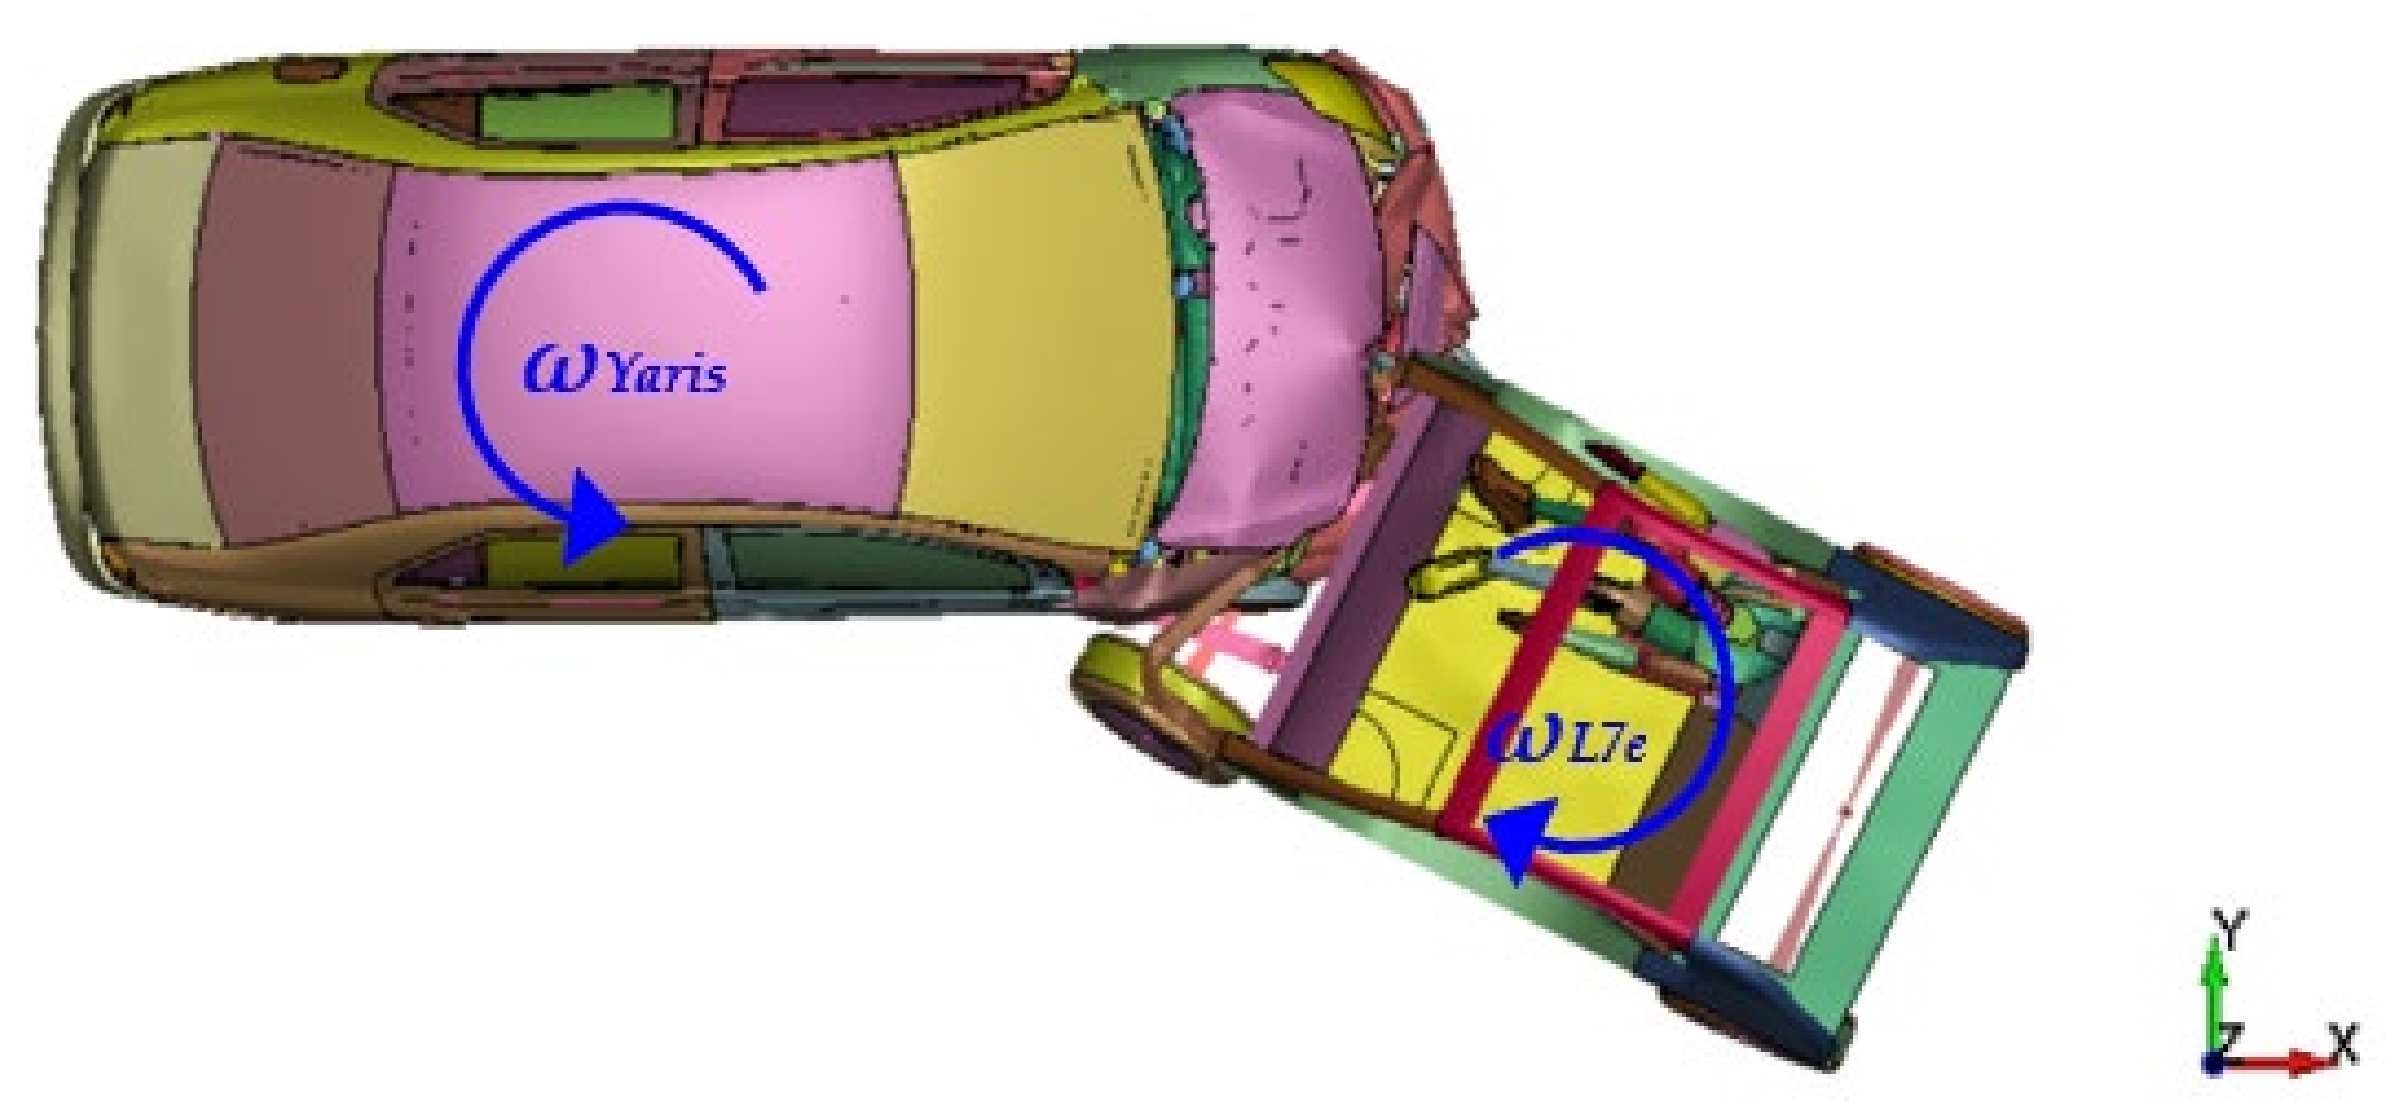
| ωYaris (1/s) | 0.71 | 1.29 |
| ωL7e (1/s) | −4.40 | −2.06 |
References
- Choma, E.F.; Evans, J.S.; Hammitt, J.K.; Gómez-Ibáñez, J.A.; Spengler, J.D. Assessing the health impacts of electric vehicles through air pollution in the United States. Environ. Interact. 2020, 144, 106015. [Google Scholar] [CrossRef] [PubMed]
- Mu, R.; Yamamoto, T. An analysis on mixed traffic flow of conventional passenger cars and microcars using a cellular automata model. Procedia-Soc. Behav. Sci. 2012, 43, 457–465. [Google Scholar] [CrossRef] [Green Version]
- Wüstenhagen, S.; Beckert, P.; Lange, O.; Franze, A. Light Electric Vehicles for Muscle–Battery Electric Mobility in Circular Economy: A Comprehensive Study. Sustainability 2021, 13, 13793. [Google Scholar] [CrossRef]
- Redelbach, M.; Özdemir, E.D.; Friedrich, H.E. Optimizing battery sizes of plug-in hybrid and extended range electric vehicles for different user types. Energy Policy 2014, 73, 158–168. [Google Scholar] [CrossRef] [Green Version]
- The European New Car Assessment Programme. 2016 Quadricycles’ Tests. Available online: https://www.euroncap.com/en/vehicle-safety/safety-campaigns/2016-quadricycles-tests (accessed on 13 December 2021).
- Kongwat, S.; Jaroenjittakam, S.; Chaianan, S.; Atchariyauthen, I.; Jongpradist, P. Design for crash safety of electric heavy quadricycle structure. IOP Conf. Ser. Mater. Sci. Eng. 2021, 1137, 012012. [Google Scholar] [CrossRef]
- Wolsfeld, R.; Klein, F.; Seidel, K.; Zehnpfennig, L. Concept of an L7e microcar with high passive safety. Lightweight Des. Worldw. 2018, 11, 30–35. [Google Scholar] [CrossRef]
- Setiawan, R.; Salim, M.R. Crashworthiness Design for an Electric City Car against Side Pole Impact. J. Eng. Technol. Sci. 2017, 49, 587–603. [Google Scholar] [CrossRef] [Green Version]
- Sadeghipour, E. A New Approach to Assess and Optimize the Frontal Crash Compatibility of Vehicle Structures. Ph.D. Thesis, Technische Universität München, Munich, Germany, 2017. [Google Scholar]
- Sandner, V.; Ratzek, A. MPDB-Mobile offset progressive deformable barrier. In Proceedings of the 24th International Technical Conference on the Enhanced Safety of Vehicles (ESV), Gothenburg, Sweden, 8–11 June 2015. [Google Scholar]
- Dios, E.; Lázaro, I.; Delannoy, P.; Thomson, R.; Versmissen, T.; Nunen, E. Development of a structural interaction assessment criteria using progressive deformable barrier data. In Proceedings of the 23rd International Technical Conference on the Enhanced Safety of Vehicles (ESV), Seoul, Korea, 27–30 May 2013. [Google Scholar]
- Johannsen, H.; Adolph, T.; Thomson, R.; Edwards, M.; Lázaro, I.; Versmissen, T. Fimcar—Frontal impact and compatibility assessment research: Strategy and first results for future frontal Impact Assessment. In Proceedings of the 22nd ESV Conference Proceedings, Washington, DC, USA, 13–16 June 2011. [Google Scholar]
- Zeng, Q.; Wen, H.; Huang, H. The interactive effect on injury severity of driver-vehicle units in two-vehicle crashes. J. Saf. Res. 2016, 59, 105–111. [Google Scholar] [CrossRef]
- Huang, H.; Siddiqui, C.; Abdel-Aty, M. Indexing crashworthiness and crash aggressivity by vehicle type. Accid. Anal. Prev. 2011, 43, 1364–1370. [Google Scholar] [CrossRef]
- Thompson, A.; Edwards, M.; Wisch, M.; Adolph, T.; Krusper, A.; Thomson, R.; Johannsen, H. Report Detailing the Analysis of National Accident Databases; FP7 European Commission FIMCAR Project; GA (234216); Springer: Berlin, Germany, 2011. [Google Scholar]
- Eggers, A.; Adolph, T. Evaluation of the Thoracic Deflection Measurement System ‘RibEye’ in the Hybrid III 50th in Frontal Sled Tests. In Proceedings of the 23rd International Technical Conference on the Enhanced Safety of Vehicles (ESV), Seoul, Korea, 27–30 May 2013. [Google Scholar]
- Lemmen, P.; Hynd, D.; Carroll, J.; Davidsson, J.; Been, B.; Song, E.; Steeger, B. Thoracic Injury Assessment for Improved Vehicle Safety. Procedia-Soc. Behav. Sci. 2012, 48, 1649–1661. [Google Scholar] [CrossRef]
- Hallman, J.J.; Yoganandan, N.; Pintar, F.A.; Maiman, D.J. Injury Differences Between Small and Large Overlap Frontal Crashes. Ann. Adv. Automot. Med. 2011, 55, 147–157. [Google Scholar] [PubMed]
- Kolke, R.; Sandner, V.; Ambos, R.; Unger, T. Frontal and side impact compatibility. ATZ Worldw. 2010, 112, 18–24. [Google Scholar] [CrossRef]
- Sadeghipour, E.; Duddeck, F.; Lienkamp, M. Crash Compatibility of Microcars: A Study on Current Test Approaches. In Proceedings of the Crash. Tech. 2014, Munich, Germany, 8–9 April 2014. [Google Scholar] [CrossRef]
- The European New Car Assessment Programme. Mobile Progressive Deformable Barrier. 2020. Available online: https://www.euroncap.com/en/vehicle-safety/the-ratings-explained/adult-occupant-protection/frontal-impact/mobile-progressive-deformable-barrier (accessed on 13 December 2021).
- Davies, H.C.; Bastien, C. An approach for the crash safety assessment of smaller and lightweight vehicles. Transp. Policy 2021, 105, 12–21. [Google Scholar] [CrossRef]
- Dux, L.E.E.; Wolkenstein, M.; Luttenberger, P. A Mobile Deformable Barrier Test for the Front Crash Assessment of Future Urban Microcars. In Proceedings of the 24th International Technical Conference on the Enhanced Safety of Vehicles (ESV), Gothenburg, Sweden, 8–11 June 2015. [Google Scholar]
- Zhendong, S.; Haitao, Z.; Weiqiang, P. Assessment of Car to Car crash compatibility based on MPDB. In Proceedings of the 12th International Conference on Measuring Technology and Mechatronics Automation (ICMTMA), Phuket, Thailand, 28–29 February 2022. [Google Scholar] [CrossRef]
- Baker, B.C.; Nolan, J.M.; O’Neill, B.; Genetos, A.P. Crash compatibility between cars and light trucks: Benefits of lowering front-end energy-absorbing structure in SUVs and pickups. Accid. Anal. Prev. 2008, 40, 116–125. [Google Scholar] [CrossRef] [PubMed]
- O’Brien, S. Priorities for the assessment of frontal impact compatibility. In Proceedings of the 22nd International Technical Conference on the Enhanced Safety of Vehicles, Washington, DC, USA, 13–16 June 2011. [Google Scholar]
- Yonezawa, H. Investigation for New Side Impact Test Procedures in Japan. In Proceedings of the 21st International Technical Conference on the Enhanced Safety of Vehicles, Stuttgart, Germany, 15–18 June 2009. [Google Scholar]
- Fischer, B. Final Report of New Car Assessment Program Testing of a 2007 Toyota Yaris; MGA Research Corporation: Burlington, WI, USA, 2006. [Google Scholar]
- Sankey, J.W. Final Report of New Car Assessment Program Testing of a 1997 Toyota RAV4; Transportation Research Center Inc.: East Liberty, OH, USA, 1997. [Google Scholar]
- Marzougui, D.; Samaha, R.R.; Nix, L.; Kan, C.D.S. Extended Validation of the Finite Element Model for the 2010 Toyota Yaris Passenger Sedan (MASH 1100 kg Vehicle); Working Paper NCAC 2012-W-005; National Crash Analysis Center (NCAC): Ashburn, VA, USA, 2012. [Google Scholar]
- National Crash Analysis Center (NCAC). Finite Element Model of Toyota Rav 4 (The Model Year 1997); National Crash Analysis Center (NCAC): Ashburn, VA, USA, 2008. [Google Scholar]
- Li, S.; Sui, J.; Ding, F.; Wu, S.; Chen, W.; Wang, C. Optimization of Milling Aluminum Alloy 6061-T6 using Modified Johnson-Cook Model. Simul. Model. Pract. Theory 2021, 111, 102330. [Google Scholar] [CrossRef]
- Ansys Company. Livermore Software Technology. Hybrid III 50th Percentile Male. Available online: https://www.lstc.com/products/models/dummies/H3_50th (accessed on 16 November 2020).
- Yeh, I. LS-DYNA Seatbelt Modeling Guideline. 2007. Available online: https://ftp.lstc.com/anonymous/outgoing/support/FAQ_docs/SeatBeltGuideline1.pdf (accessed on 9 June 2022).
- Chou, C.C.; Nyquist, G.W. Analytical Studies of the Head Injury Criterion (HIC). SAE Trans. 1974, 83, 398–410. [Google Scholar]
- Zalewski, J.; Kisilowski, J. Analysis of Chosen Aspects of a Two-Car Crash Simulation. In Proceedings of the International Conference on Transport Systems Telematics, Ustron, Poland, 10–13 October 2012; pp. 34–44. [Google Scholar]
- Christensen, J.; Bastien, C. Nonlinear Optimization of Vehicle Safety Structures: Modeling of Structures Subjected to Large Deformations; Butterworth-Heinemann: Oxford, UK, 2015. [Google Scholar]
- Association for the Advancement of Automotive Medicine. The abbreviated Injury Scale 2015 Revision; Association for the Advancement of Automotive Medicine: Des Plaines, IL, USA, 2016. [Google Scholar]
- Lesko, M.M.; Woodford, M.; White, L.; O’Brien, S.J.; Childs, C.; Lecky, F.E. Using Abbreviated Injury Scale (AIS) codes to classify Computed Tomography (CT) features in the Marshall System. BMC Med. Res. Methodol. 2010, 10, 72. [Google Scholar] [CrossRef] [PubMed]
- Eppinger, R.; Sun, E.; Bandak, F.; Haffner, M.; Khawepong, N.; Maltese, M.; Kuppa, S.; Nguyen, T.; Takhounts, E.; Tannous, R.; et al. Development of Improved Injury Criteria for the Assessment of Advanced Automotive Restraint Systems—II; NHTSA: Washington, DC, USA, 1999. [Google Scholar]
- Ray, M.H.; Mongiardini, M.; Atahan, A.O.; Plaxico, C.A.; Anghileri, M. Recommended Procedures for Verification and Validation of Computer Simulations Used for Roadside Safety Applications; National Cooperative Highway Research Program (NCHRP): Washington, DC, USA, 2008. [Google Scholar]


| Sections | Components | Thickness |
|---|---|---|
| Frontal Structure | Bumper | 2.0 mm |
| Upper beam | 1.2 mm | |
| Front rail | ||
| Crash box | 1.0 mm | |
| Subframe | 3.0 mm | |
| Passenger Compartment | Backbar | 3.0 mm |
| Pillars | 2.0 mm | |
| Roof | ||
| Floor | ||
| Side beams |
| Opponent Vehicle | Bumper Height | ||
|---|---|---|---|
| Low | Medium | High | |
| Sedan |  |  |  |
| SUV |  |  |  |
| Opponent Vehicle | Initial Velocity | Bumper Height | Energy Absorption (%) | Deformed Mode of Front Rail | |||
|---|---|---|---|---|---|---|---|
| Front Rail | Subframe | Upper Beam | Total | ||||
| Sedan | 30 kph | Low | 37.0 | 0.64 | 30.0 | 67.6 | Buckling |
| Medium | 22.3 | 15.4 | 23.9 | 61.6 | Combined | ||
| High | 19.4 | 18.9 | 24.7 | 63.1 | Combined | ||
| 50 kph | Low | 20.3 | 4.46 | 10.1 | 34.9 | Buckling | |
| Medium | 9.38 | 14.3 | 11.3 | 34.9 | Combined | ||
| High | 9.05 | 14.6 | 11.5 | 35.2 | Combined | ||
| SUV | 30 kph | Low | 11.8 | 1.06 | 29.1 | 41.9 | Bending |
| Medium | 32.5 | 8.55 | 21.6 | 62.7 | Buckling | ||
| High | 33.9 | 7.38 | 20.1 | 61.3 | Buckling | ||
| 50 kph | Low | 9.42 | 9.99 | 11.2 | 30.6 | Bending | |
| Medium | 13.6 | 6.82 | 10.3 | 30.7 | Buckling | ||
| High | 11.1 | 6.09 | 9.50 | 26.7 | Buckling | ||
| Opponent Vehicle | Sedan | SUV | |||||
|---|---|---|---|---|---|---|---|
| Bumper Height | Low | Medium | High | Low | Medium | High | |
| Minimum clearance to residual space (mm) * | 50 kph (F) | +14 | +63 | +75 | −30 | +85 | 0 |
| 50 kph (OL) | 0 | −25 | −55 | −191 | −223 | −236 | |
| 50 kph (OR) | +240 | +240 | +240 | +240 | +240 | +240 | |
Publisher’s Note: MDPI stays neutral with regard to jurisdictional claims in published maps and institutional affiliations. |
© 2022 by the authors. Licensee MDPI, Basel, Switzerland. This article is an open access article distributed under the terms and conditions of the Creative Commons Attribution (CC BY) license (https://creativecommons.org/licenses/by/4.0/).
Share and Cite
Kongwat, S.; Homsnit, T.; Padungtree, C.; Tonitiwong, N.; Jongpradist, P.; Jongpradist, P. Safety Assessment and Crash Compatibility of Heavy Quadricycle under Frontal Impact Collisions. Sustainability 2022, 14, 13458. https://doi.org/10.3390/su142013458
Kongwat S, Homsnit T, Padungtree C, Tonitiwong N, Jongpradist P, Jongpradist P. Safety Assessment and Crash Compatibility of Heavy Quadricycle under Frontal Impact Collisions. Sustainability. 2022; 14(20):13458. https://doi.org/10.3390/su142013458
Chicago/Turabian StyleKongwat, Suphanut, Thonn Homsnit, Chaimongkol Padungtree, Naphon Tonitiwong, Pornkasem Jongpradist, and Pattaramon Jongpradist. 2022. "Safety Assessment and Crash Compatibility of Heavy Quadricycle under Frontal Impact Collisions" Sustainability 14, no. 20: 13458. https://doi.org/10.3390/su142013458